Evidence for weakly correlated oxygen holes in the highest-Tc cuprate superconductor HgBa2Ca2Cu3O8+δ
Abstract
We study the electronic structure of HgBa2Ca2Cu3O8+δ (Hg1223 ; Tc = 134 K) using photoemission spectroscopy (PES) and x-ray absorption spectroscopy (XAS). Resonant valence band PES across the O K-edge and Cu L-edge identify correlation satellites originating in O 2p and Cu 3d two-hole final states, respectively. Analyses using the experimental O 2p and Cu 3d partial density of states show quantitatively different on-site Coulomb energy for the Cu-site (U6.50.5 eV) and O-site (Upp = 1.00.5 eV). Cu2O7-cluster calculations with non-local screening explain the Cu 2p core level PES and Cu L-edge XAS spectra, confirm the Udd and Upp values, and provide evidence for the Zhang-Rice singlet state in Hg1223. In contrast to other hole-doped cuprates and 3d-transition metal oxides, the present results indicate weakly correlated oxygen holes in Hg1223.
pacs:
79.60.-i, 71.30.+h, 75.47.LxNearly 30 years after the discovery of high-transition temperature (Tc) superconductivity in the cuprates,Bed the role of electron correlations still remains the central enigma in understanding their properties. While pioneering theoretical and experimental studies have established important aspects of spin-charge ordering,ZG ; Machida ; JT ; Salkola ; Wu ; GG ; JC ; MT ; Tabis ; HJ anti-ferromagnetic correlationsJulien ; Lee ; Chan and electron-phonon couplingLanzara in the high-Tc cuprates, the origin for high-Tc superconductivity still remains elusive.Keimer The spin-charge order competes with the metallicity of doped carriers in the CuO2 layers and leads to novel thermodynamic, transport and spectroscopic phenomena which favor quantum critical behavior.Valla ; Randeria ; Pepin ; Jacobs ; Proust
It is well-accepted that Mott-Hubbard correlations provide an appropriate starting point for describing the electronic structure of the CuO2 layers.Emery ; Varma ; Zhang ; arpesRMP ; MottRMP ; Weber ; Werner However, the actual quantification of correlations in terms of an on-site Coulomb energy for the Cu-site(=Udd) in comparison with that on the O site(=Upp), and their roles in spin-charge order and superconductivity is still being investigated. In fact, using the method of CiniCini and SawatzkySawatzky (see supplementary material SM for a description of the method), it is known that Upp is large (5-6 eV) and quite comparable to Udd ( 5-8 eV) in YBa2Cu3O7 (YBCO)Marel ; Balzarotti , Bi2Sr2CaCu2O8(Bi-2212),Tjeng and La2-xAxCuO4(A = Sr, Ba).BarDeroma This behaviour of Upp Udd is known for oxides across the 3d transition metal(TM) series : titanium/vanadium oxides(SrTiO3, V2O3, VO2, V2O5),Ishida ; Post ; Park LaMO3 (M = Mn-Ni) perovskites,AC ; DD and cuprates(including Cu2O and CuO).Marel ; Balzarotti ; Ghijsen ; Tjeng ; BarDeroma A recent theoretical study on rare-earth nickelates (RNiO3), using comparable values of Udd (= 7 eV) and Upp (= 5 eV), showed that the metal-insulator transition in RNiO3 arises from a novel charge-order involving ligand holes.Johnston It would be interesting to establish the relation of Udd and Upp with charge-order even for the cuprates. However, while all the above mentioned cuprate families show charge-order,GG ; JC ; MT ; Tabis ; HJ to date, there is no report of charge-order in HgBa2Ca2Cu3O8+δ(Hg1223) series, which shows the highest-Tc(= 134 K) at ambient pressure,Ott although a clear spin gap below T* 230 K was reported earlyJulien . Given the recent resurgence of interest in the Hg-based cuprates,Yamamoto ; Loret ; Manuel ; Jang ; Hinton we felt it important to quantify Udd and Upp for the optimally doped Hg1223. This would help to understand the highest Tc system, motivate studies for charge order in Hg1223 and clarify its link with Udd and Upp in general.
Photoemission spectroscopy has played a vital role in elucidating the electronic structure of high-Tc cuprates. High-resolution angle-resolved PES studies have revealed the Fermi surfaces,arpesRMP a momentum-dependent pseudogap,Marshall ; Ding a low energy kink in the band dispersion,Lanzara and the highly intriguing Fermi arcsNorman whose origin is still under debate.Meng ; King Core level PES in combination with model cluster calculations showed that Udd is larger than the charge-transfer energy and the low energy properties involve charge-transfer excitations in the Zaanen-Sawatzky-Allen scheme.Fujimori ; ZXS The properties of all the cuprate families originate in the CuO4 plaquette common to their layered structure.arpesRMP The strong hybridization of the Cu 3d-O 2p states leads to the Zhang-Rice singlet(ZRS) as the lowest energy state.Zhang For Bi2212 Veenendaal94 ; Brookes2001 and for LSCOTaguchi ; Brookes , core level PES and spin-polarized resonant PES studies have established the ZRS state across the superconducting dome. Since the highest Tc Hg1223 system also shows the superconducting dome behavior,Fukuoka ; Yamamoto it is important to identify and characterize the ZRS state in Hg1223.
We carry out XAS and resonant PES across the O K-edge and Cu L-edge of optimally doped Hg1223. The samples were prepared using a high-pressure method and characterized for their superconducting Tc = 134 K (Fig. S1), as reported recently.Yamamoto The details of sample preparation, characterization and spectroscopy measurements are described in SM.SM We also carry out off-resonant VB-PES at specific photon energies from 21.2 eV-1200 eV to conclusively determine the O 2p and Cu 3d pDOS. Using the estimated Udd and Upp, we carry out model many-body Hamiltonian calculations for a Cu2O7-cluster with non-local screeningVeenendaal ; Okada for the Cu 2p core level PES and Cu L-edge XAS spectra. The results show the importance of non-local screening in PES and XAS, confirm the ZRS state as well as the estimated values of Udd = 6.51 eV and Upp = 1.00.5 eV. We conclude that the highest Tc cuprate exhibits an unexpectedly smaller Upp compared to Udd i.e. coexistence of weakly correlated oxygen holes and strongly correlated d-holes, which need to be considered in theoretical models addressing the highest Tc in cuprates.
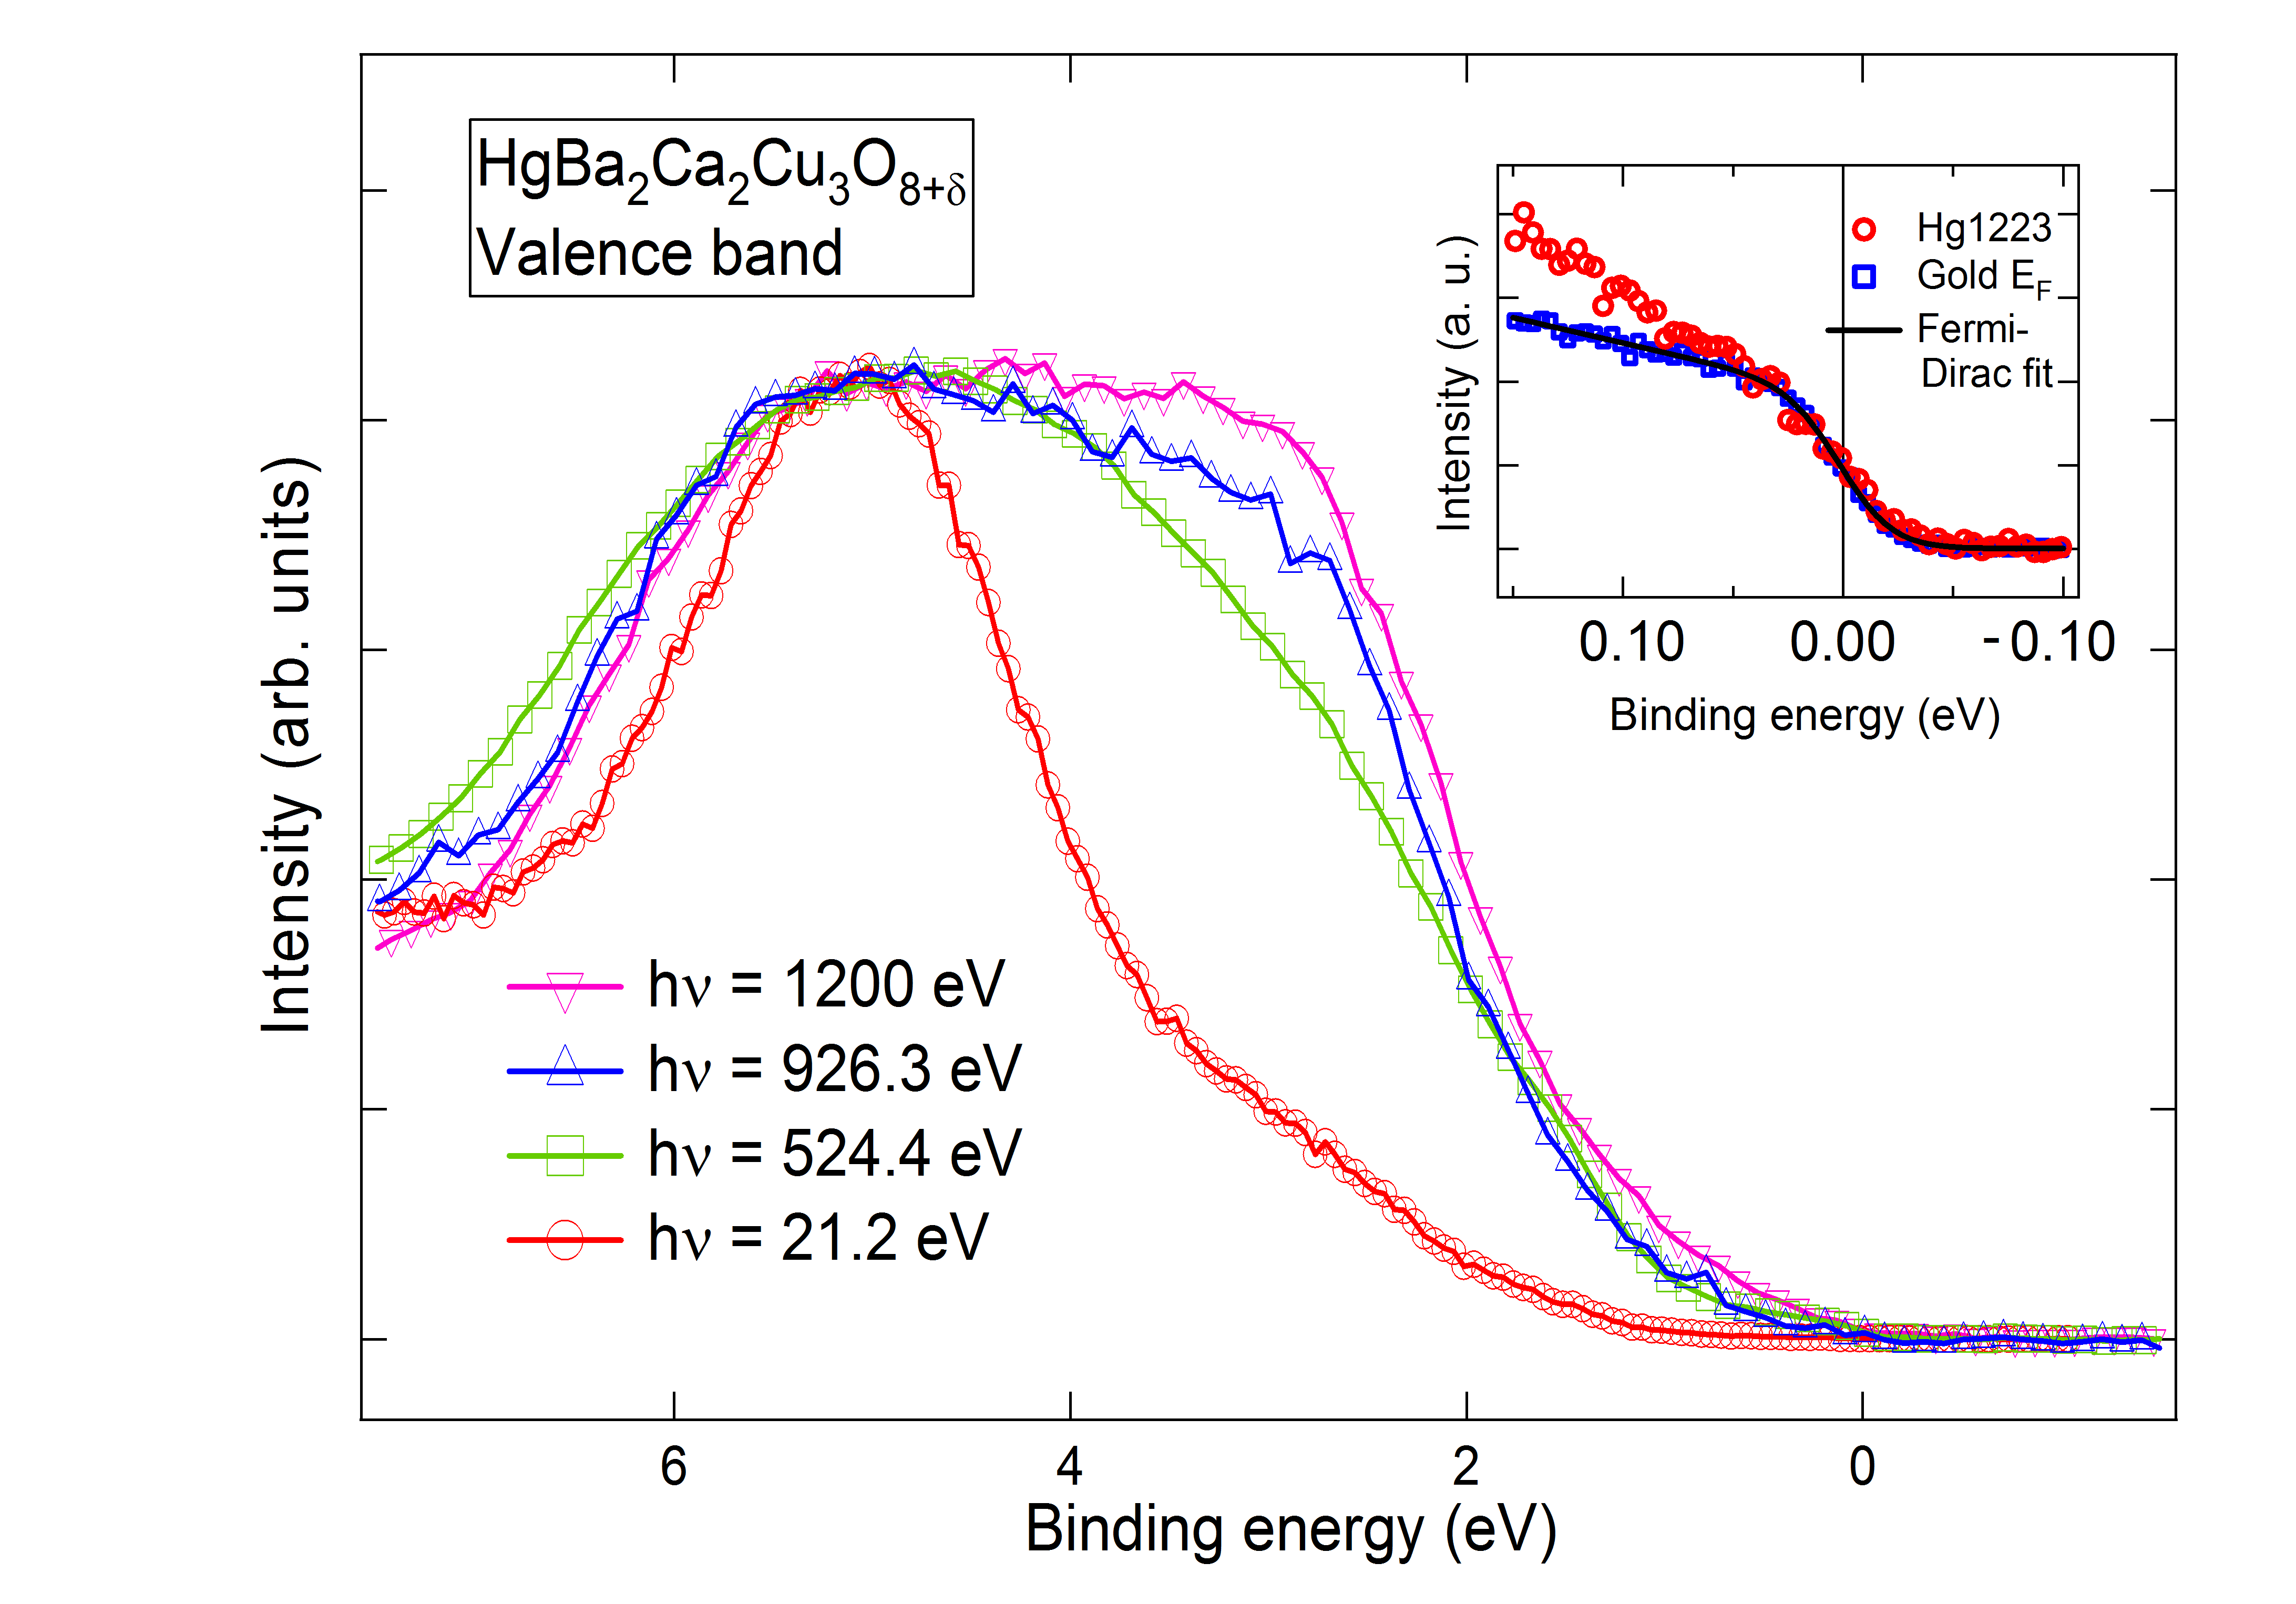
Fig. 1 shows the valence band photoemission spectra of Hg1223 measured with ultraviolet (21.2 eV) and soft x-ray (524, 926 eV and 1200 eV) photons. The valence band PES of Hg-1223 measured with a photon energy of 21.2 eV (He I) shows a broad peak at 5 eV binding energy(BE) and a weak feature at 2.5 eV extending to the Fermi level, consistent with earlier work.Almeras ; Vasquez Inspite of the very low intensity near EF, the Hg1223 spectra show a Fermi step indicative of a metal. The near EF Hg1223 spectrum with He I photons measured at T = 120 K is shown in the inset along with the Fermi step for gold and a Fermi-Dirac fit to the step. The superconducting gap at T = 120 K is too small to be measured with a resolution of 40 meV. The feature at 5 eV BE is the O 2p band and the weak feature at 2.5 eV dominantly consists of the Cu 3d states, based on band structure calculations.Rodriguez On increasing photon energies, the feature at 2.5 eV is relatively enhanced (the spectra are normalized at the 5 eV feature), confirming the assignment. The core-levels ( Hg 4f, Ba 3d, Ca 2p and O 1s) and wide BE range valence band spectrum showing also the Hg 5d, Ba 5s-5p, Ca 3p and O 2s shallow core levels measured with h = 1200 eV are discussed in SM(Figs. S2 and S3).
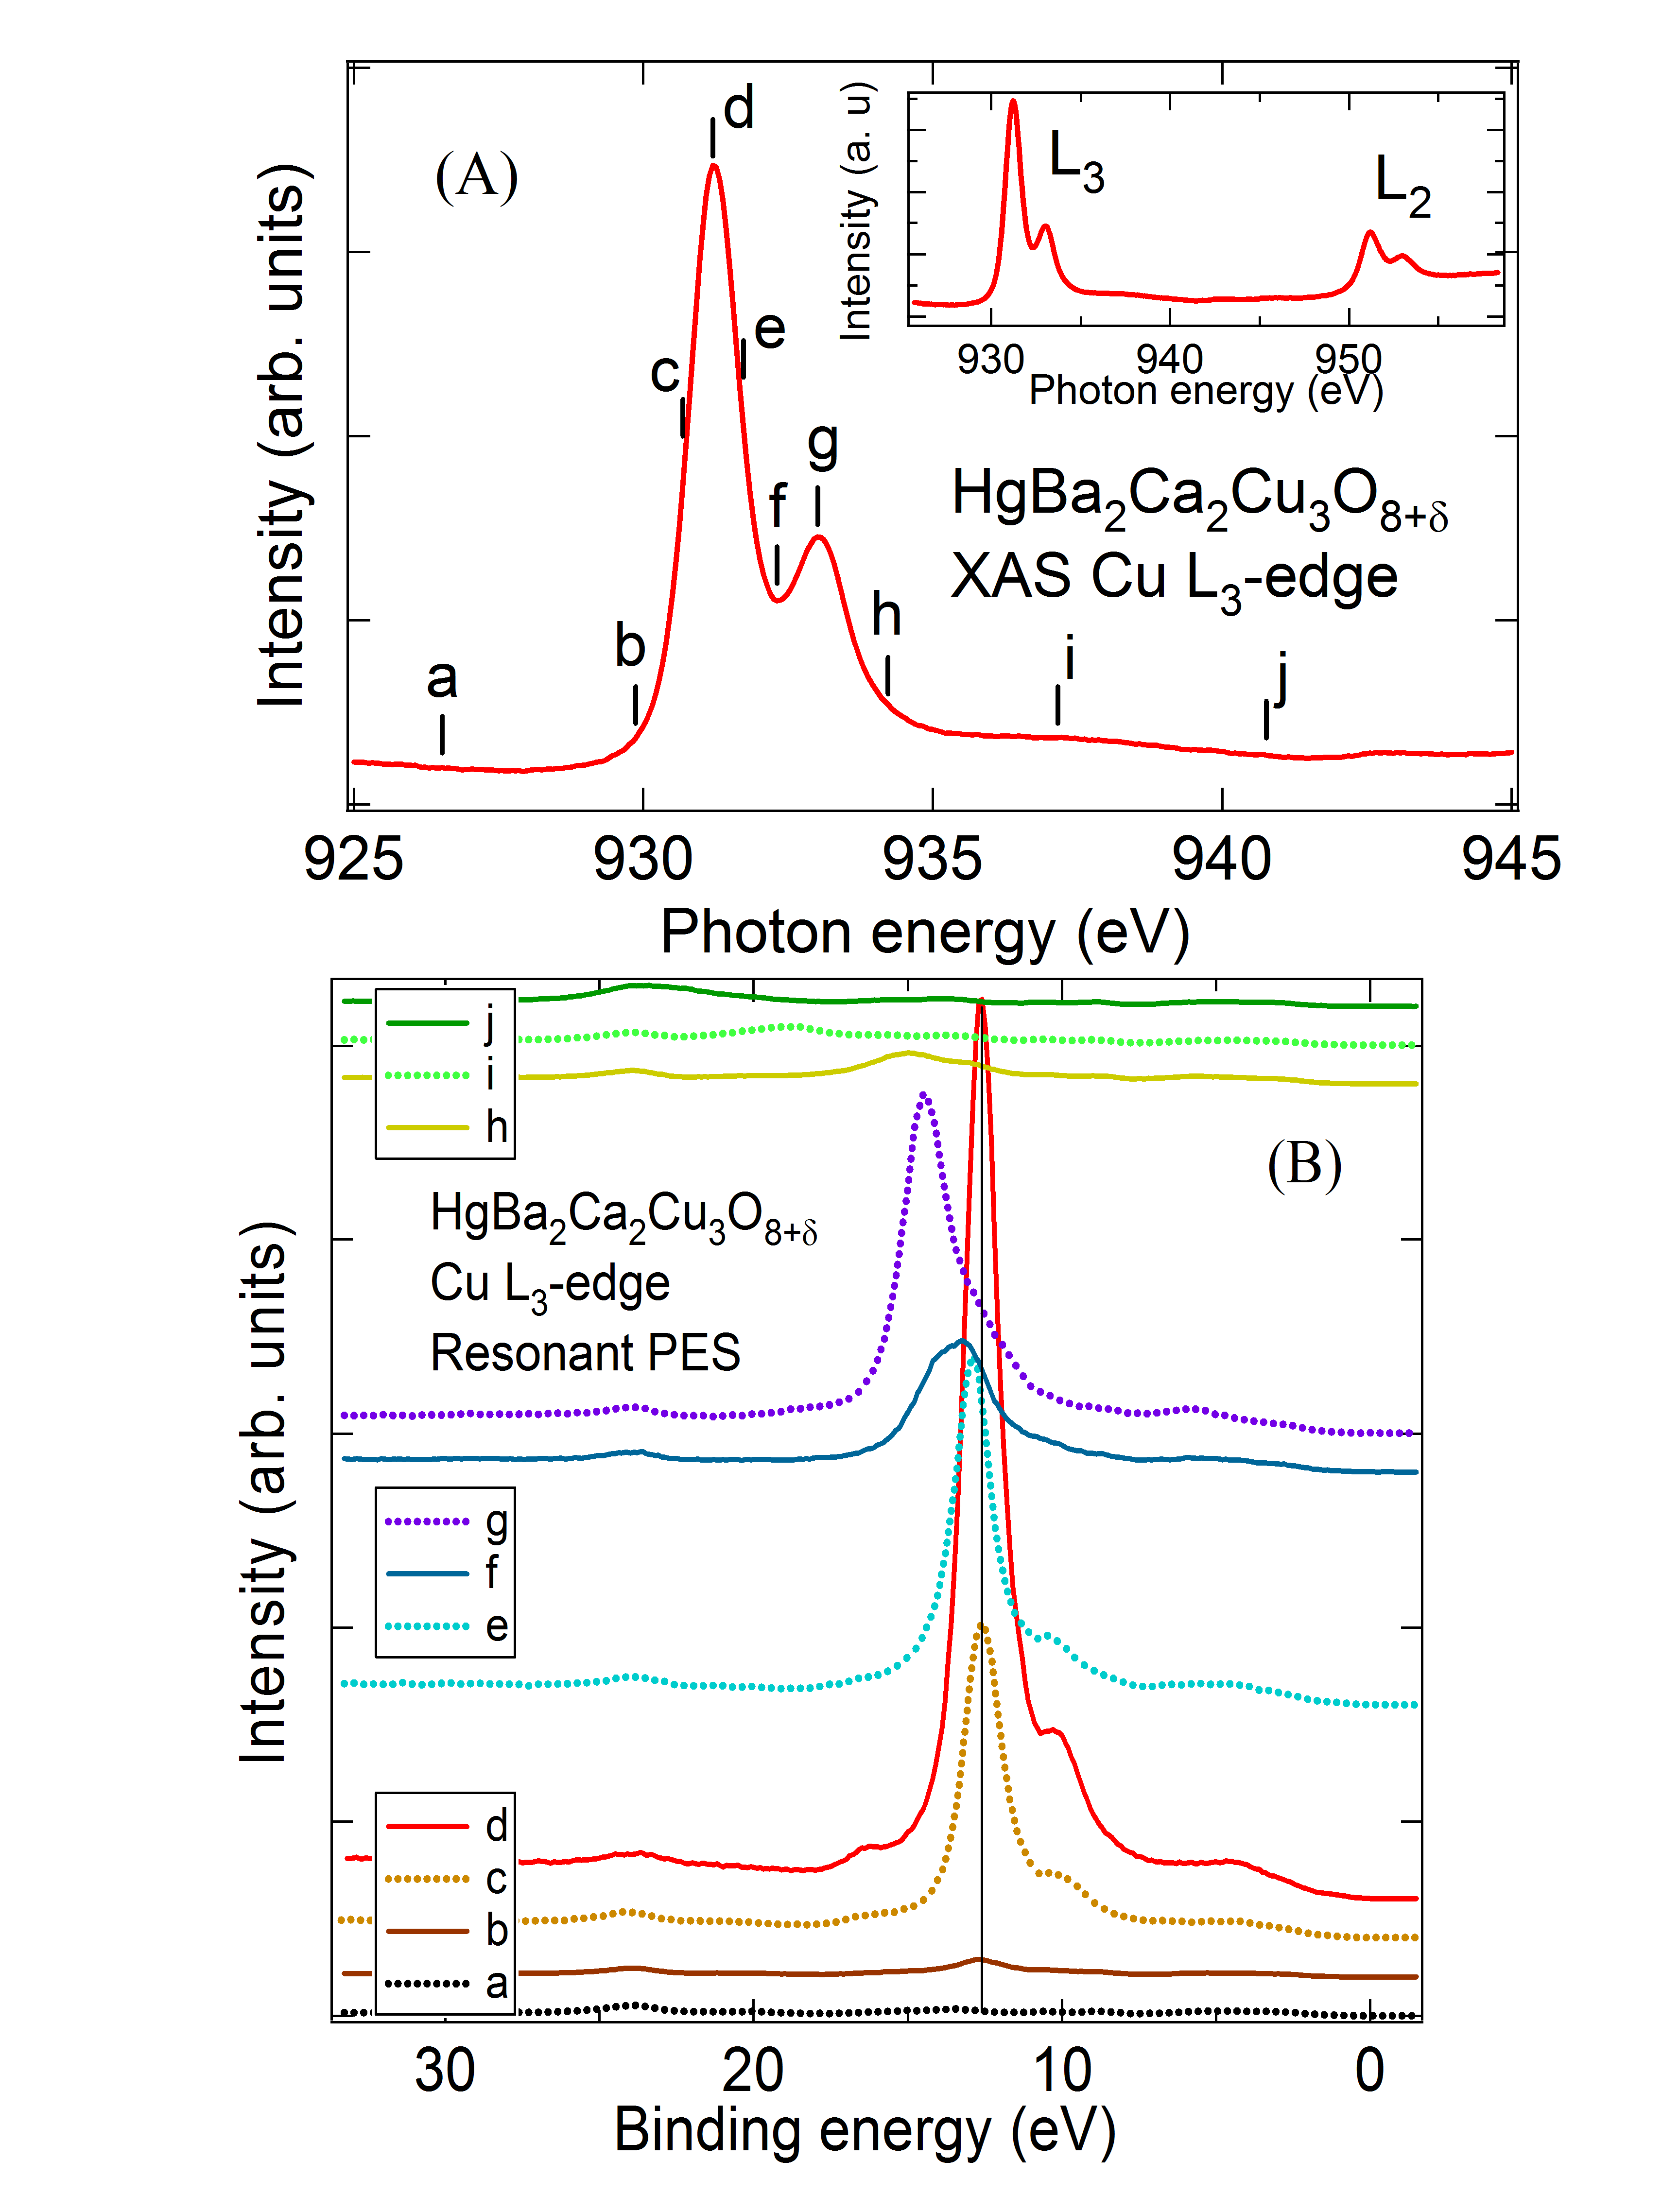
In Fig.2(A), we show the Cu L3-edge XAS (inset shows the wide range L3 and L2 features), which consists of a main peak at 931 eV photon energy (label ) and a weak but clear feature at 933 eV (label ). The weak feature has been reported earlier but with much lower relative intensity.Pellegrin We then carried out Cu 2p-3d resonant valence band PES at the photon energies labelled and the spectra are correspondingly labelled and shown in Fig. 2(B). The off-resonance spectrum is the same as the h = 926.3 eV spectrum of Fig. 1. As we increase the photon energies from to , we see a dramatic 190-times increase in the intensity of feature centered at 12.8 eV BE. This corresponds to the well-known giant resonance seen in cuprates.Tjeng On increasing the photon energy further, we see a shift of the resonance feature as it moves to higher binding energies, with the magnitude of the energy shift tracking the increase in photon energy. This identifies the resonance feature as the Cu L3VV Auger state, with two final state holes(VV) in the valence band thus confirming its origin to be the Cu 3d correlation satellite. The intensity follows the XAS profile with a reduction for photon energies labelled and , then an increase at , followed by a gradual reduction at higher energies.
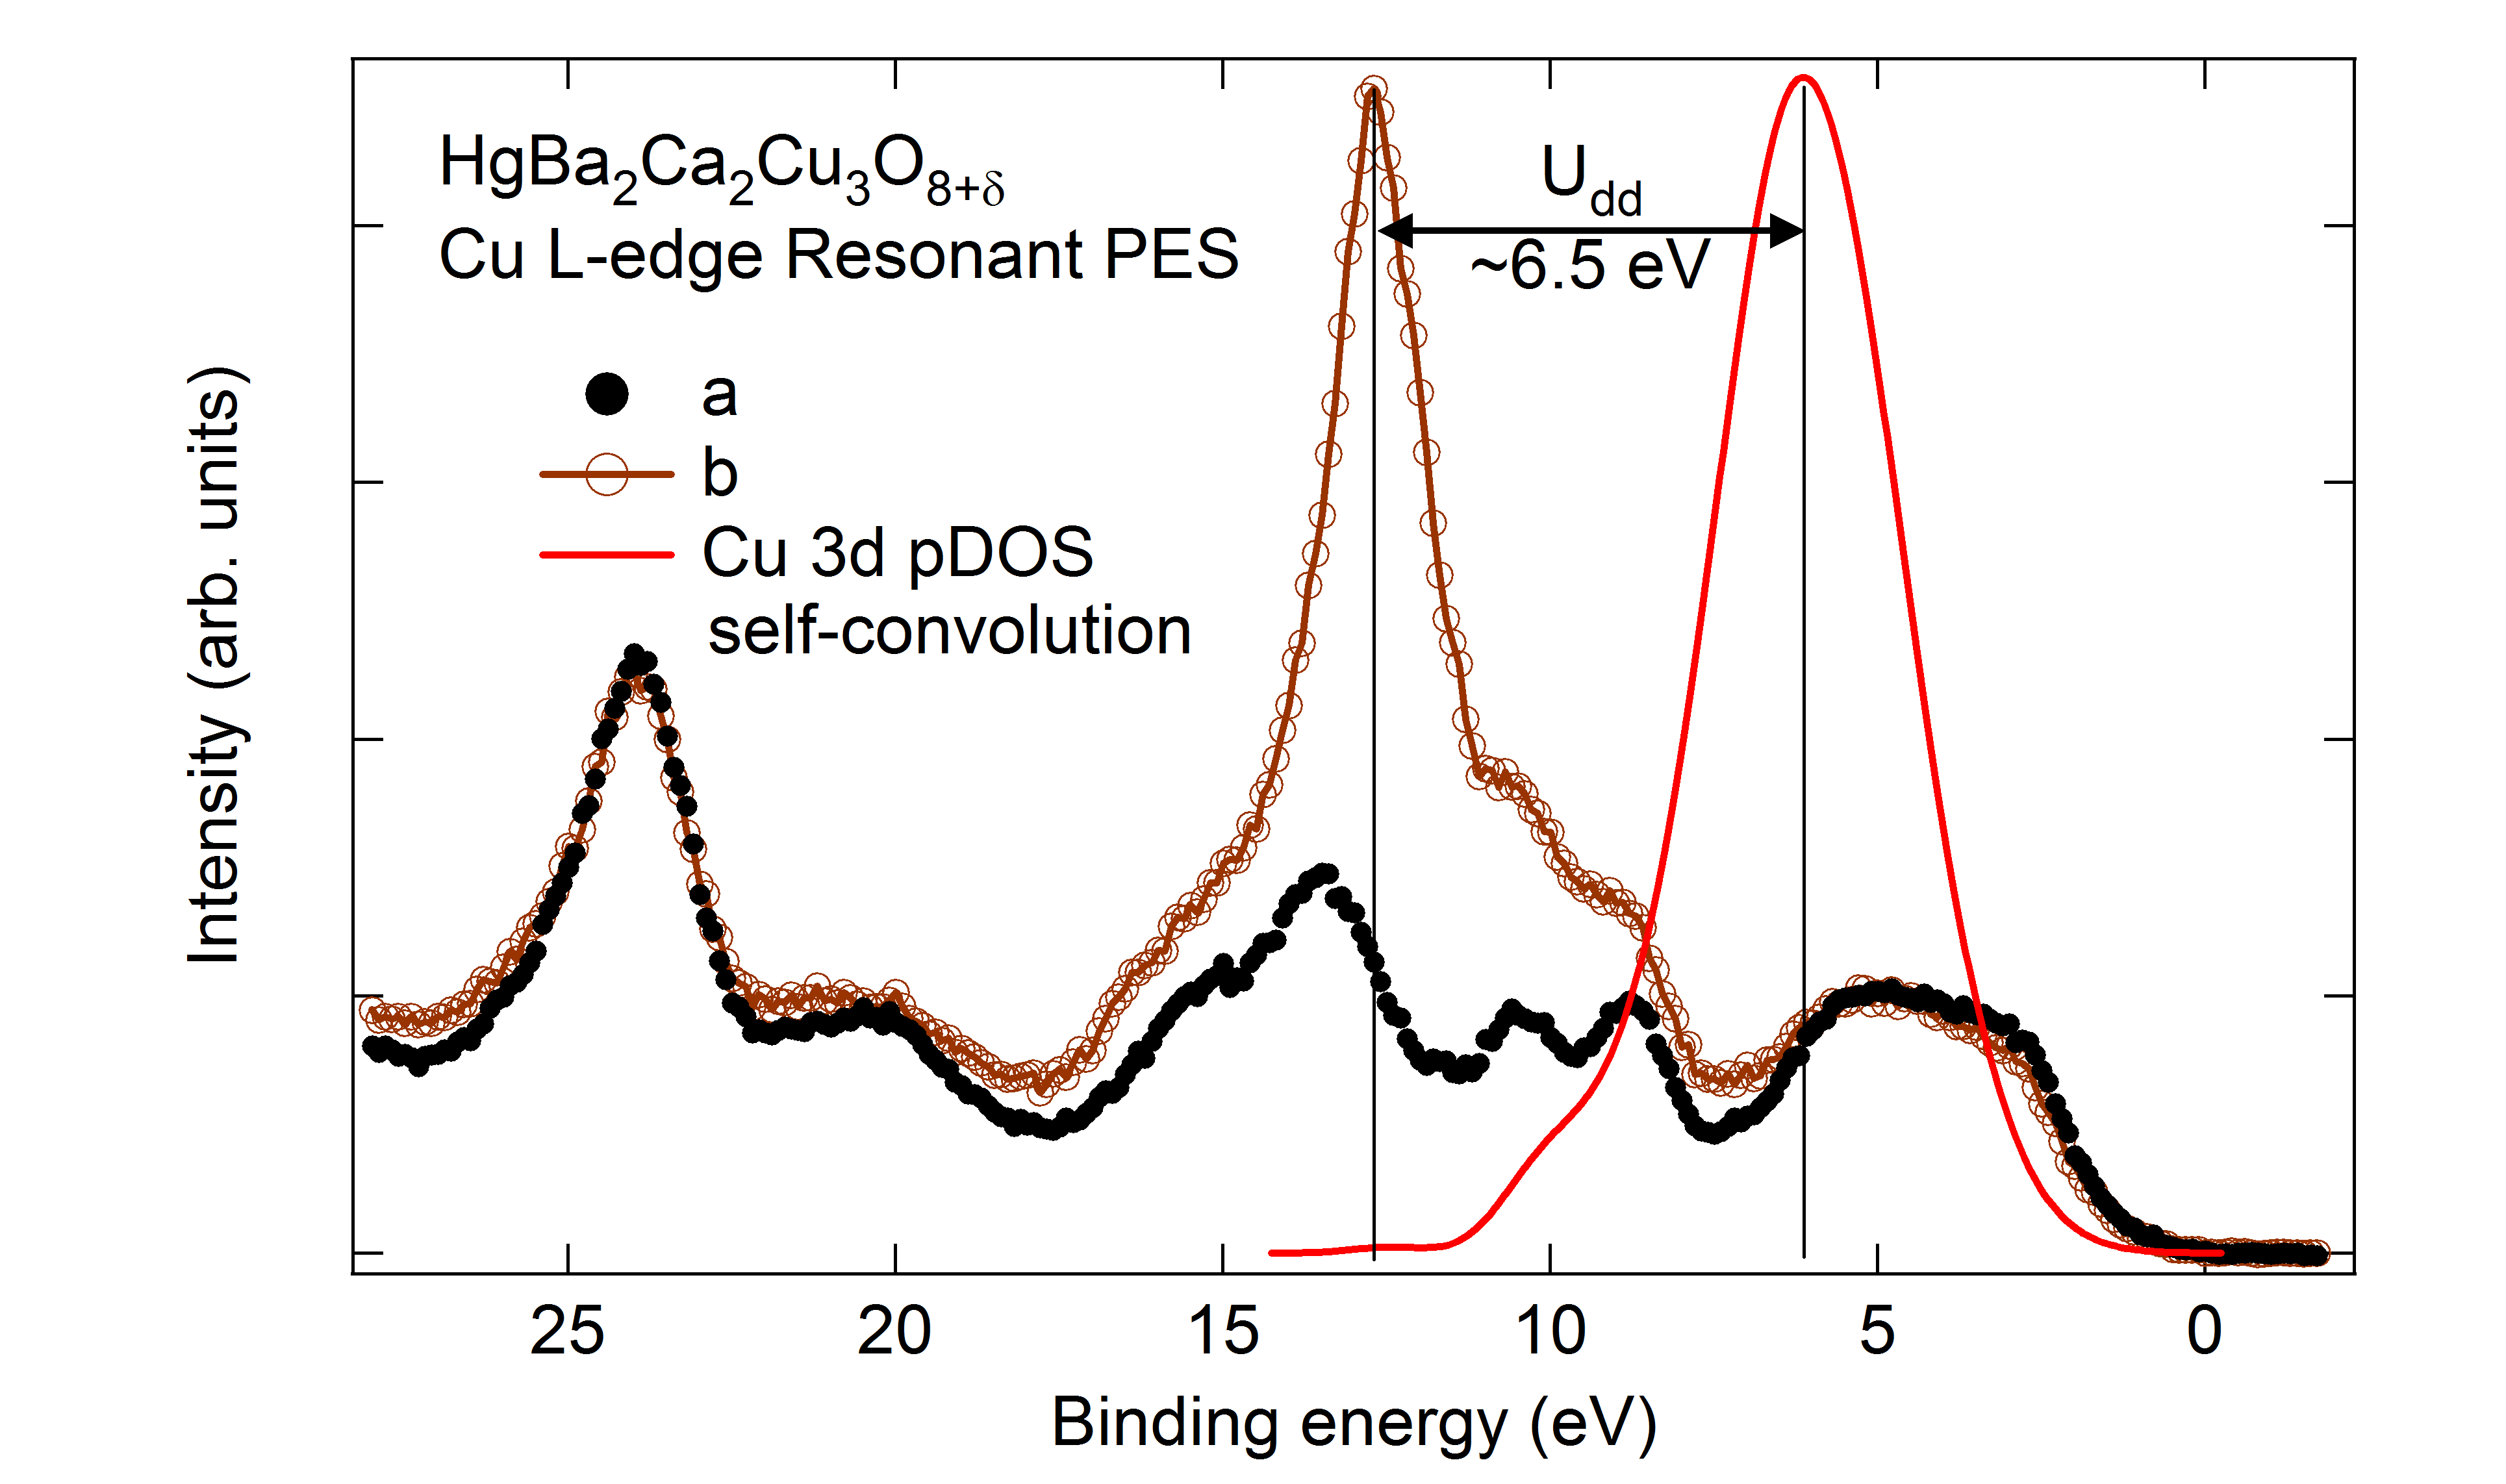
In order to estimate the on-site Udd, we identify the dominantly Cu 3d pDOS in the valence band. We do this by subtracting out the normalized ultraviolet (h = 21.2 eV) valence band spectrum ( which consists mainly of the O 2p pDOS ) from the soft x-ray (h = 1200 eV) spectrum, as shown in SM Fig.S4. We carry out a self-convolution of the Cu 3d pDOS and compare it with the spectrum showing the resonantly enhanced Cu 3d correlation satellite which occurs at 12.8 eV BE(Fig. 3). The spectra labelled and are the same as shown in Fig. 2(B), but drawn on an expanded y-scale and normalised at the O 2s core level peak at 24 eV BE. The energy separation between the main peaks of the resonantly enhanced spectrum and the two-hole spectrum gives a measure of on-site Udd = 6.5 0.5 eV, consistent with earlier work on other cuprates.Marel ; Balzarotti ; Tjeng ; BarDeroma
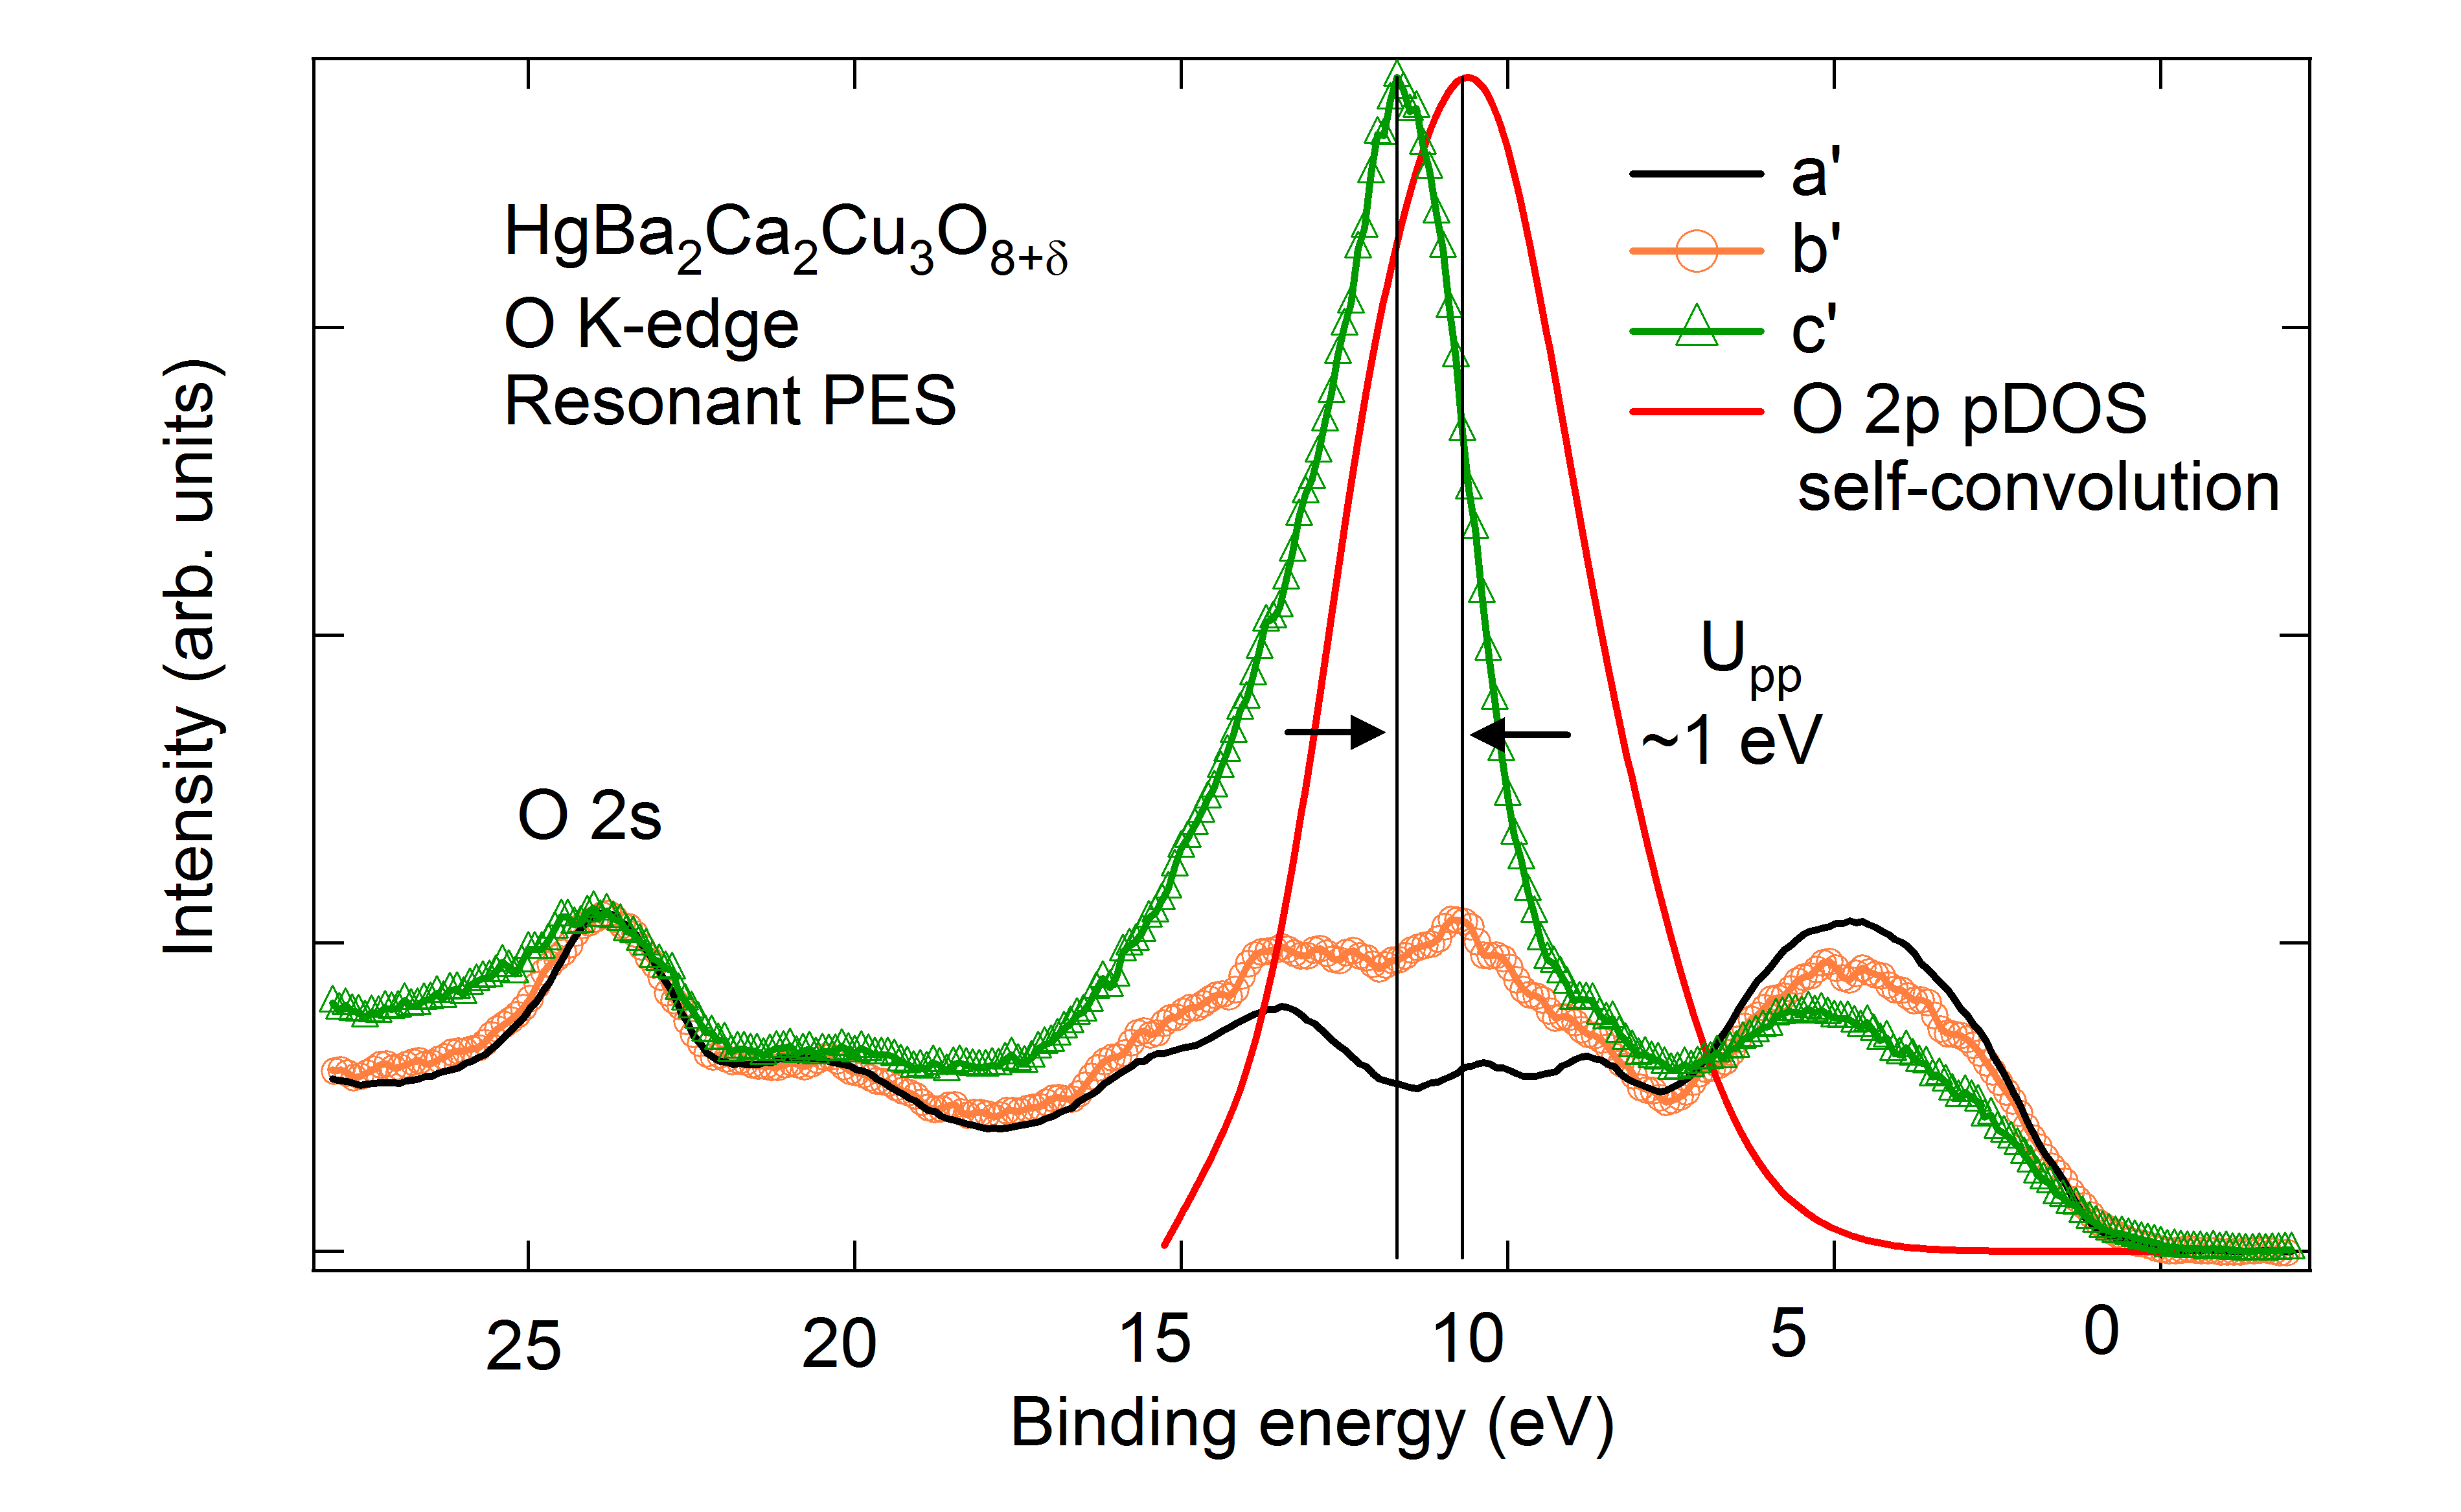
Next, we carry out a similar analysis to determine the on-site Upp, by measuring the O K-edge XAS and O 1s-2p resonant valence band PES (data shown in SM Fig. S5). The O 1s-2p resonant PES identifies the O KVV Auger feature originating in the O 2p correlation satellite, occuring at 11.6 eV. In Fig. 4, we compare the self convolution of the O 2p pDOS with the spectra showing the resonantly enhanced correlation satellite. The spectra labelled are the same as shown in Fig. S4, but plotted on an expanded y-scale and normalised at the O 2s peak at 24 eV BE. From the energy separation between the main peaks, we estimate an on-site Upp = 1.0 0.5 eV. Such a low value of Upp for 3d transition metal oxides, in general, and for hole-doped cuprates in particular, has not been reported to date. Since a large Udd coexisting with a small Upp is unusual, we checked its validity using another method.
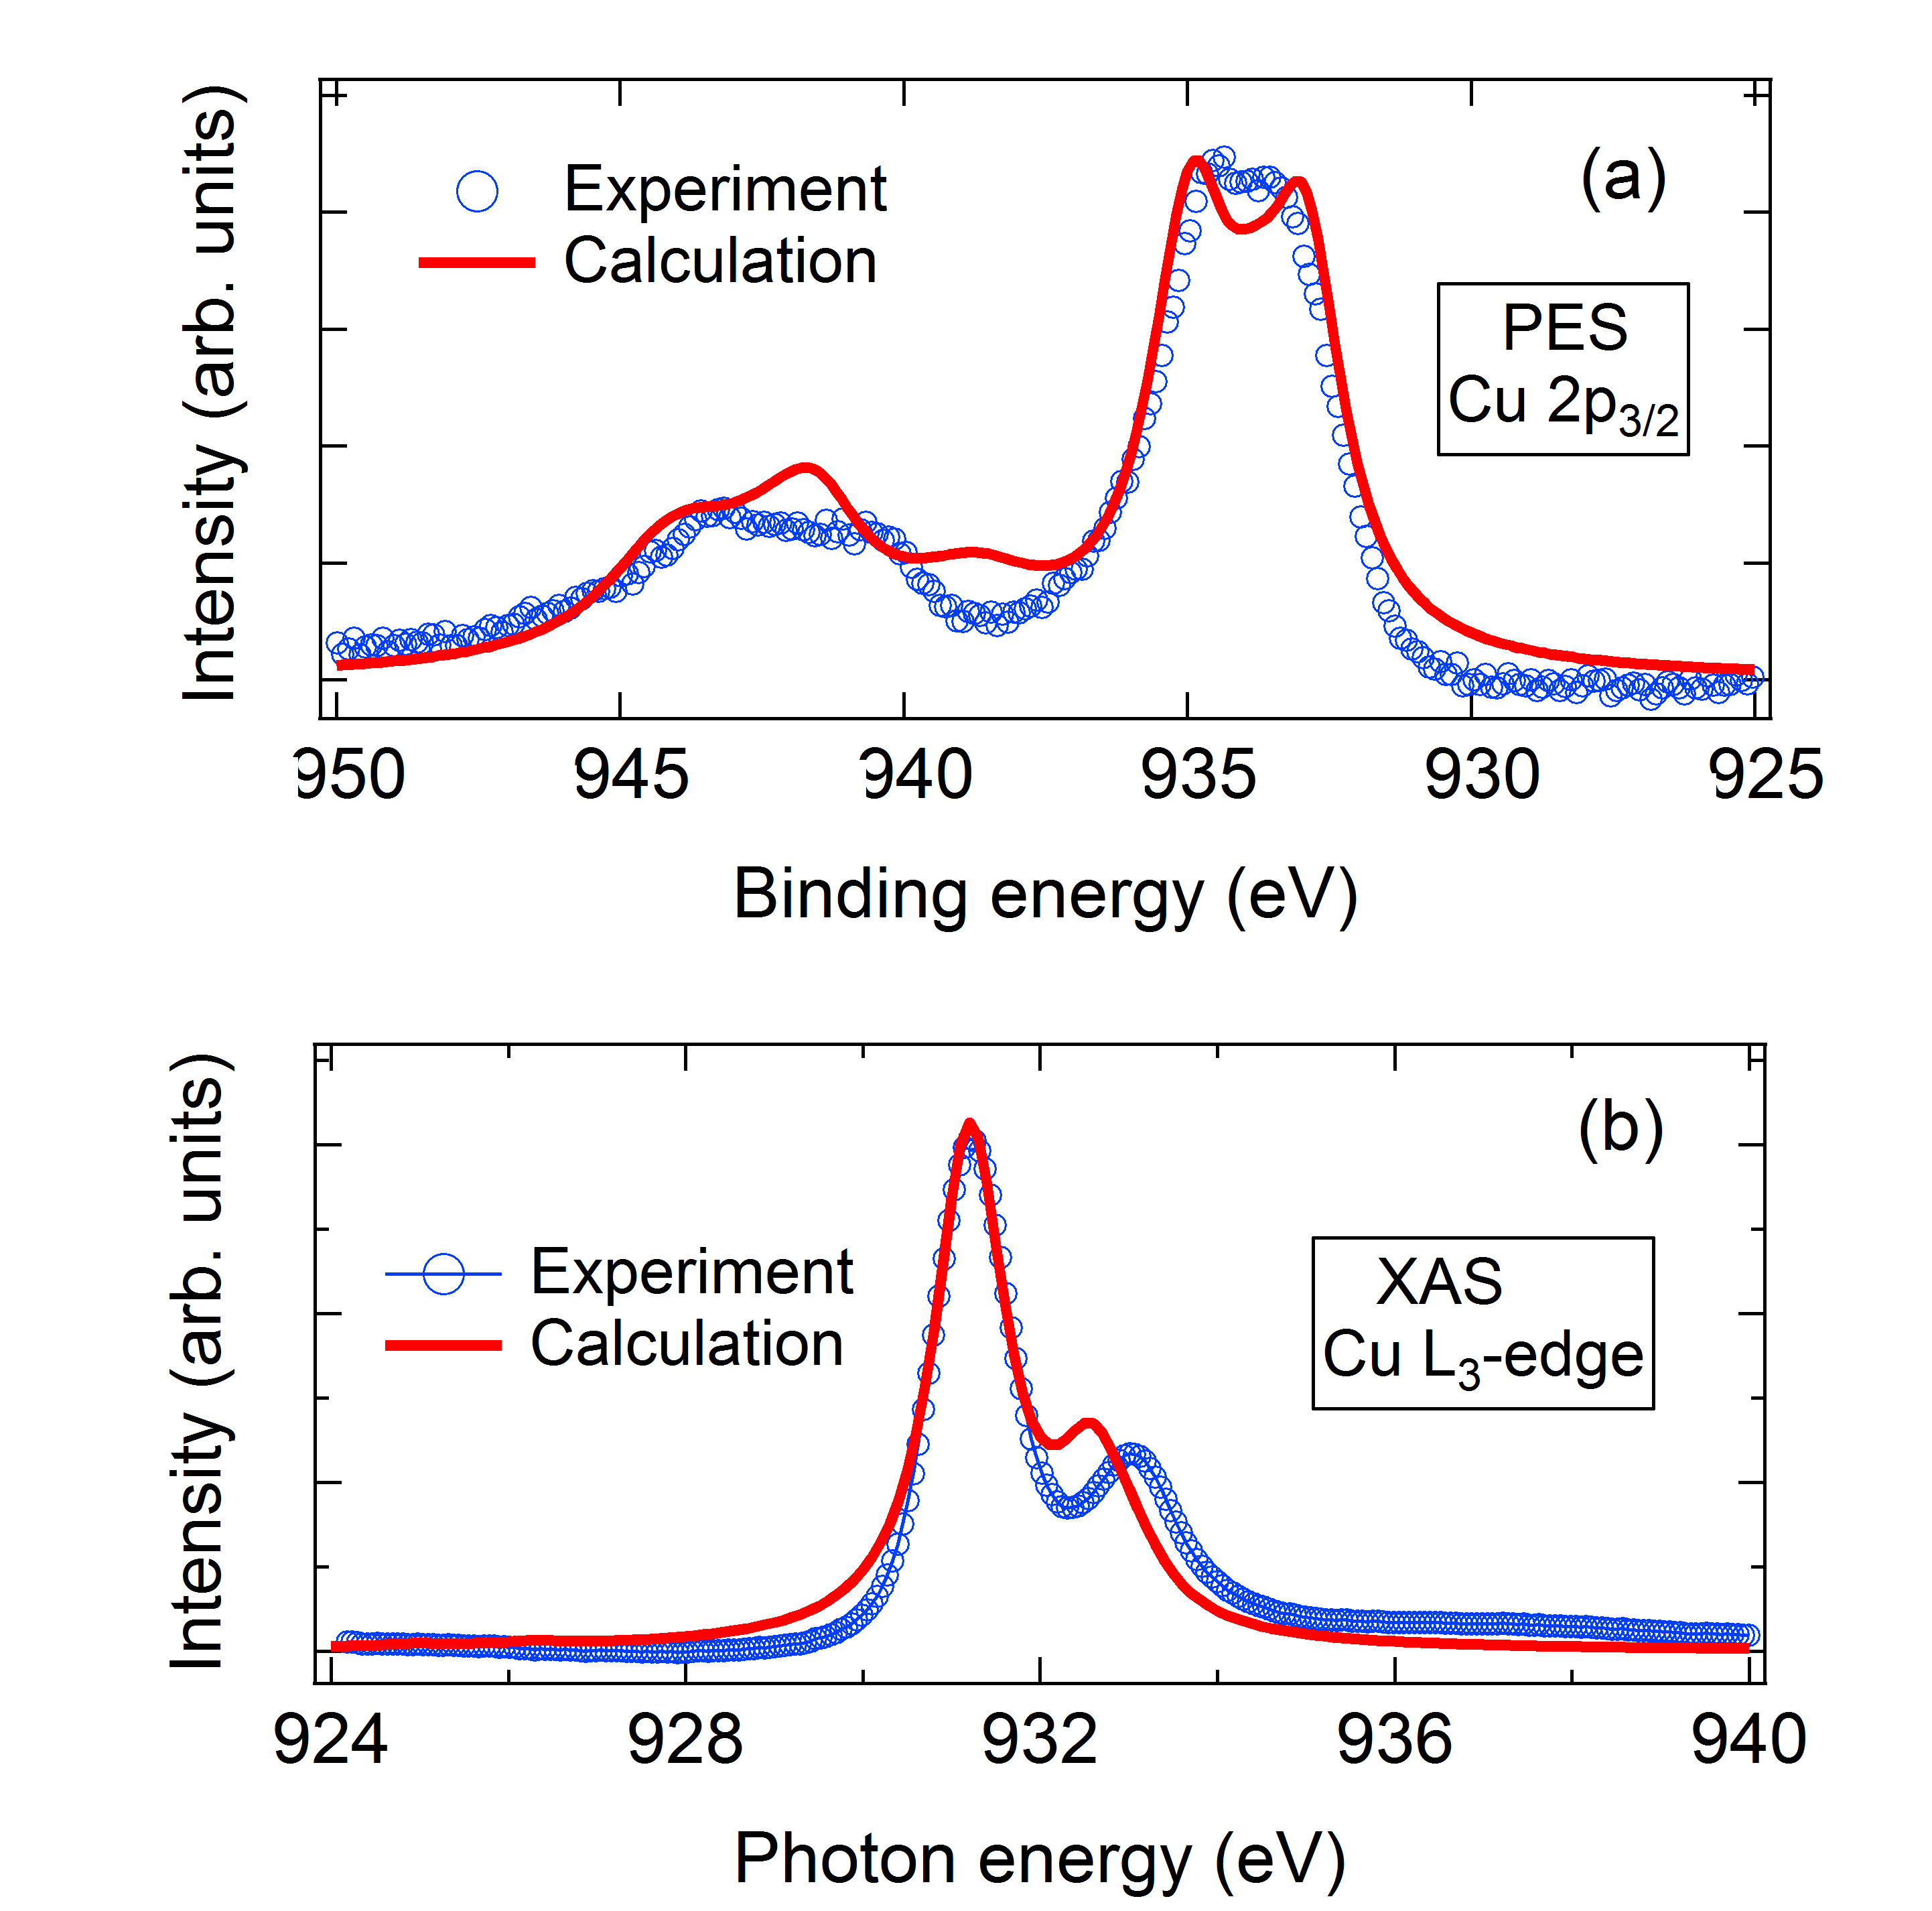
It is well-known that the Cu 2p core-level PES is best explained by model many-body cluster calculations which go beyond a single CuO4 plaquette by including non-local screening from a neighbouring CuO4 plaquette.Veenendaal ; Okada We have carried out such calculations for a Cu2O7 cluster and compared the results with the experimentally measured Cu 2p PES. While non-local calculations for Cu L-edge XAS have shown an additional satellite feature,Veenendaal it has not been directly compared with experiment as most cuprates show only a single peak XAS spectrum which gets broadened with dopingTjeng ; CTChen ; Nucker . However, the Hg-based cuprates have shown a weak well-separated satellite feature.Pellegrin In the present study, we also see a clear satellite which is reproduced by calculations. The calculations (see SM for details) were carried out for the simplest case with 3 holes in the Cu2O7 cluster, corresponding to 50% hole doping.
Fig. 5(a) shows the Cu 2p3/2 core level PES spectrum plotted with the calculated spectrum. The experimental data shows a main peak consisting of two features at 933.4 eV and 934.5 eV, and broad weak intensity satellite structures between 939 eV to 946 eV. The calculated spectrum(Fig. 5(a)) was obtained using = 1.3 eV, where is the charge-transfer energy, the O 2p-Cu 3d overlap integral tpd = 0.45 eV, the O 2p-O 2p overlap integral tpp = 0.3 eV, Udd = 6.5 eV, Upp = 1.0 eV and the Coulomb interaction due to the core hole Udc = 8.5 eV. While the calculations reproduce all the features of the experimental data but with small discrepancies for the satellite features, we use the above parameters as they give the best fit to the Cu 2p PES and L-edge XAS spectra simultaneously. We checked that the well-screened feature at 933.4 eV in the Cu 2p3/2 main peak (the lowest BE feature) is dominated by the Cu1 d : Cu2 d configuration (the prefix Cu1 and Cu2 identify the two Cu sites and the core hole is created on the Cu1 site, see Fig. S6 in SM). Thus, the well-screened feature involves ‘non-local’ screening from the Cu2 site CuO4 plaquette, leading to an effective ZRS state consistent with earlier work.Veenendaal ; Okada The feature at 934.5 eV in the main peak is attributed to ‘local’ screening from the Cu1 site plaquette as it is dominated by Cu1 d : Cu2 d9 and Cu1 d : Cu2 d9 states, with admixture from Cu1 d : Cu2 d. The satellite features are dominated by ionic configurations on the Cu1 site namely Cu1 d9 : Cu2 d and Cu1 d9 : Cu2 d with admixture from d : Cu2 d9 and d : Cu2 d8 configurations.
Similarly, Fig. 5(b) shows the Cu L3 XAS spectrum compared to calculations carried out with the same paramaters as for the Cu 2p core level PES discussed above. The main peak in Cu L3 XAS spectrum at 931 eV is dominated by the d : Cu2 d state involving ‘non-local’ screening from the Cu2 site, with admixture from d : Cu2 d9 state. The satellite feature at 933 eV is dominated by d : Cu2 d9 state with admixture from d8+1 : Cu2 d10. We carried out additional checks (see SM, Figs. S7 and S8) for the validity of the parameters used for the calculations. The calculations indicate deviations from experimental data if Udd 4 eV or Upp 3 eV. This confirms a large Udd coexisting with a small Upp in the highest-Tc Hg1223 cuprate, and indicates an electronic inhomogeneity on the length scale of a CuO4 plaquette.
Our results thus indicate the necessity of distinguishing between Udd and Upp, which originates from dynamical screening effects at the Cu- and O-site.Werner It is known that the strength of correlations depends on the presence or absence of apical oxygens, with stronger correlations in hole-doped LSCO having apical oxygen, and weaker correlations in electron-doped NCCO, having no apical oxygen.Weber For the single-band Hubbard model, a very recent extension showed that Udd is proportional to the inverse of the bond distance between apical oxygen and copper atoms even for the Hg-based cuprates.Jang Since Hg1223 has 3 Cu-O layers : the inner layer has no apical oxygen and the two outer layers has pyramidal CuO5 co-ordination, the effective correlations are weakest in the Hg1223 system quite like the electron-doped cuprates.Jang In addition, in the only study of a three band model expicitly including Udd and Upp, it was shown that the static Udd = 7.0 eV and Upp = 4.64 eV for La2CuO4.Werner The authors also discussed that the frequency dependent local self-energy is larger for the Cu site with 4 nearest neighbour oxygens, and smaller for the O site with 2 nearest neighbour Cu atoms. Finally, since the charge carriers in the hole-doped cuprates have large O 2p hole character, coexistence of a small Upp and large Udd suggests pairing would be favored for the weakly correlated oxygen holes in the highest-Tc Hg1223 cuprate.
In conclusion, resonant valence band PES across the O K-edge and Cu L-edge identify correlation satellites due to two-hole final states in Hg1223. Analyses using the measured O 2p and Cu 3d partial DOS show that on-site Coulomb energy for the O-site (Upp = 1.00.5 eV) is much smaller than that for Cu-site (U6.50.5 eV). Cu2O7-cluster calculations with non-local screening for the Cu 2p core level PES and Cu L-edge XAS spectra are used to confirm the Udd and Upp values, and provide evidence for the Zhang-Rice singlet state in optimally doped Hg1223. In contrast to known results of Upp Udd for other hole-doped cuprates as well as 3d-transition metal oxides in general, the present results indicate weakly correlated oxygen holes in the highest-Tc cuprate Hg1223.
Acknowledgements : AC thanks the Institut Jean Lamour, Université de Lorraine for hospitality and financial support during the course of this work. The synchrotron radiation experiments were performed at BL17SU, SPring-8, with the approval of RIKEN (Proposal No. 20140019).
References
- (1) J. G. Bednorz and K. A. Mueller, Z. fur Physik B 64, 189(1986).
- (2) J. Zaanen and O. Gunnarsson, Phys. Rev. B 40, 7391(R) (1989).
- (3) K. Machida, Physica C 158, 192 (1989) ; M. Kato, K. Machida, H. Nakanishi and M. Fujita, Jl. Phys. Soc. Jpn., 59, 1047 (1990).
- (4) J. M. Tranquada, B. J. Sternlieb, J. D. Axe, Y. Nakamura and S. Uchida, Nature 375, 561 (1995).
- (5) M. I. Salkola, V. J. Emery, and S. A. Kivelson, Phys. Rev. Lett. 77, 155 (1996).
- (6) T. Wu, H. Mayaffre, S. Kramer, M. Horvatic, C. Berthier, W. N. Hardy, R. Liang, D. A. Bonn and M.-H. Julien, Nature 477, 191 (2011).
- (7) G. Ghiringhelli, M. Le Tacon, M. Minola, S. Blanco-Canosa, C. Mazzoli, N. B. Brookes, G. M. De Luca, A. Frano, D. G. Hawthorn, F. He, T. Loew, M. Moretti Sala, D. C. Peets, M. Salluzzo, E. Schierle, R. Sutarto, G. A. Sawatzky, E. Weschke, B. Keimer, L. Braicovich, Science 337, 821 (2012).
- (8) J. Chang, E. Blackburn, A. T. Holmes, N. B. Christensen, J. Larsen, J. Mesot, Ruixing Liang, D. A. Bonn, W. N. Hardy, A. Watenphul, M. v. Zimmermann, E. M. Forgan and S. M. Hayden, Nature Physics 8, 871 (2012).
- (9) M. Le Tacon, A. Bosak, S. M. Souliou, G. Dellea, T. Loew, R. Heid, K-P. Bohnen, G. Ghiringhelli, M. Krisch and B. Keimer, Nature Physics 10, 52 (2014).
- (10) W. Tabis, Y. Li, M. Le Tacon, L. Braicovich, A. Kreyssig, M. Minola, G. Dellea, E. Weschke, M. J. Veit, M. Ramazanoglu, A. I. Goldman, T. Schmitt, G. Ghiringhelli, N. Barisic, M. K. Chan, C. J. Dorow, G. Yu, X. Zhao, B. Keimer and M. Greven, Nat. Commun. 5:5875 doi: 10.1038/ncomms6875 (2014).
- (11) S. Gerber, H. Jang, H. Nojiri, S. Matsuzawa, H. Yasumura, D. A. Bonn, R. Liang, W. N. Hardy, Z. Islam, A. Mehta, S. Song, M. Sikorski, D. Stefanescu, Y. Feng, S. A. Kivelson, T. P. Devereaux, Z.-X. Shen, C.-C. Kao, W.-S. Lee, D. Zhu, and J.-S. Lee, Science 350, 949 (2015).
- (12) M.-H. Julien, P. Carretta, M. Horvatic, C. Berthier, Y. Berthier, P. Segransan, A. Carrington, and D. Colson, Phys. Rev. Lett. 76, 4238(1996).
- (13) W. S. Lee, J. J. Lee, E. A. Nowadnick, S. Gerber, W. Tabis, S. W. Huang, V. N. Strocov, E. M. Motoyama, G. Yu, B. Moritz, H. Y. Huang, R. P. Wang, Y. B. Huang, W. B. Wu, C. T. Chen, D. J. Huang, M. Greven, T. Schmitt, Z. X. Shen and T. P. Devereaux, Nature Physics 10, 883 (2014).
- (14) M. K. Chan, C. J. Dorow, L. Mangin-Thro, Y. Tang, Y. Ge, M. J. Veit, G. Yu, X. Zhao, A. D. Christianson, J. T. Park, Y. Sidis, P. Steffens, D. L. Abernathy, P. Bourges and M. Greven, Nature Communications 7, 10819 (2016).
- (15) A. Lanzara, P. V. Bogdanov, X. J. Zhou, S. A. Kellar, D. L. Feng, E. D. Lu, T. Yoshida, H. Eisaki, A. Fujimori, K. Kishio, J.-I. Shimoyama, T. Noda, S. Uchida, Z. Hussain and Z.-X. Shen, Nature 412, 510 (2001).
- (16) B. Keimer, S. A. Kivelson, M. R. Norman, S. Uchida and J. Zaanen, Nature 518, 179 (2015).
- (17) T. Valla, A. V. Fedorov, P. D. Johnson, B. O. Wells, S. L. Hulbert, Q. Li, G. D. Gu, N. Koshizuka Science 285, 2110 (1999).
- (18) I. Hetel, T. R. Lemberger and M. Randeria Nature Physics 3, 700 (2007).
- (19) K. B. Efetov, H. Meier and C. Pépin, Nature 518, 179 (2013).
- (20) Th. Jacobs, Y. Simsek, Y. Koval, P. Muller, and V.M. Krasnov Phys. Rev. Lett. 116, 067001 (2016)
- (21) S. Badoux, W. Tabis, F. Laliberte, G. Grissonnanche, B. Vignolle, D. Vignolles, J. Beard, D. A. Bonn, W. N. Hardy, R. Liang, N. Doiron-Leyraud, Louis Taillefer and Cyril Proust, Nature 531, 210?214 (2016).
- (22) V. J. Emery, Phys. Rev. Lett. 58, 2794 (1987).
- (23) C. M. Varma, S. Schmitt-Rink, and E. Abrahams, Solid State Commun. 62, 681 (1987).
- (24) F. C. Zhang and T. M. Rice, Phys. Rev. B 37, 3759 (1988).
- (25) A. Damascelli, Z. Hussain and Z.-X. Shen, Rev. Mod. Phys. 75, 473 (2003).
- (26) P. A. Lee, N. Nagaosa and X.-G Wen, Rev. Mod. Phys. 78, 17 (2006).
- (27) C. Weber, K. Haule, and G. Kotliar, Nature Phys. 6, 574(2010) ; ibid. Phys. Rev. B 82, 125107 (2010).
- (28) P. Werner, R. Sakuma, F. Nilsson, and F. Aryasetiawan, Phys. Rev. B 91, 125142 (2015).
- (29) M Cini, Solid State Communications 20, 605 (1976); 24, 681-684 (1977); Phys. Rev. B 17, 2788 (1978).
- (30) G. A. Sawatzky, Phys. Rev. Lett. 39, 504 (1977).
- (31) Material synthesis and characaterization, experimental methods, supporting spectroscopy and model many-body Cu2O7 cluster calculation methods and results are detailed in Supplementary Material.
- (32) D. van der Marel, J. van Elp, G. A. Sawatzky, and D. Heitmann, Phys. Rev. B37, 5136 (1988).
- (33) A. Balzarotti, M. De Crescenzi, N. Motta, F. Patella, and A. Sgarlata, Phys. Rev. B 38, 6461 (1988).
- (34) L. H. Tjeng, C. T. Chen, and S-W. Cheong, Phys. Rev. B 45, 8205 (1992).
- (35) R. Bar-Deroma, J. Felsteiner, R. Brener, J. Ashkenazi and D. van der Marel Phys. Rev. B 45, 2361 (1992).
- (36) Y. Ishida, R. Eguchi, M. Matsunami, K. Horiba, M. Taguchi, A. Chainani, Y. Senba, H. Ohashi, H. Ohta, and S. Shin, Phys. Rev. Lett. 100, 056401 (2008).
- (37) G. A. Sawatzky and D. Post, Phys. Rev. B 20, 1546, (1979).
- (38) J.-H. Park, Ph.D. thesis, University of Michigan, 1994.
- (39) A. Chainani, M. Mathew and D. D. Sarma, Phys. Rev. B 46, 9976 (1992) ; ibid. 47, 15397 (1993) ; ibid. 48, 14818 (1994) ; A. Chainani, Ph. D. thesis, Indian Institute of Science, 1993.
- (40) D. D. Sarma and A. Chainani, Jl. Solid State Chem. 111, 208 (1994).
- (41) J. Ghijsen, L. H. Tjeng, J. van Elp, H. Eskes, J. Westerink, G. A. Sawatzky and M. T. Czyzyk, Phys. Rev. B 38, 11322 (1988).
- (42) S. Johnston, A. Mukherjee, I. Elfimov, M. Berciu, and G. A. Sawatzky, Phys. Rev. Lett. 112, 106404 (2014).
- (43) A. Schilling, M. Cantoni, J. D. Guo and H. R. Ott, Nature 363, 56 (1993).
- (44) A. Yamamoto, N. Takeshita, C. Terakura, Y. Tokura, Nature Communications 6, 8990 (2015).
- (45) B. Loret, S. Sakai, Y. Gallais, M. Cazayous, M.-A. Measson, A. Forget, D. Colson, M. Civelli, and A. Sacuto, Phys. Rev. Lett. 116, 197001 (2016).
- (46) M. Izquierdo, D. C. Freitas, D. Colson, G. Garbarino, A. Forget, S. Megtert, H. Raffy, R. Comes, J.-P. Itie, S. Ravy, P. Fertey, M. Nunez-Regueiro, condmat/1510.03750.
- (47) S.-W. Jang, H. Sakakibara, H. Kino, T. Kotani, K. Kuroki, M.-J Han, Sci. rep. 6, 33397 (2016).
- (48) J.P. Hinton, E. Thewalt, Z. Alpichshev, F. Mahmood, J.D. Koralek, M.K. Chan, M.J. Veit, C.J. Dorow, N. Barisic, A.F. Kemper, D.A. Bonn, W.N. Hardy, R. Liang, N. Gedik, M. Greven, A. Lanzara, J. Orenstein, condmat/1601.05224.
- (49) D. S. Marshall, D. S. Dessau, A. G. Loeser, C-H. Park, A. Y. Matsuura, J. N. Eckstein, I. Bozovic, P. Fournier, A. Kapitulnik, W. E. Spicer, and Z.-X. Shen, Phys. Rev. Lett. 76, 4841 (1996).
- (50) H. Ding, T. Yokoya, J.C. Campuzano, T. Takahashi, M. Randeria, M.R. Norman, T. Mochiku, K. Kadowaki, and J. Giapintzakis, Nature, 382, 51 (1996).
- (51) M.R. Norman, H. Ding, M. Randeria, J.C. Campuzano, T. Yokoya, T. Takeuchi, T. Takahashi, T. Mochiku, and K. Kadowaki, P. Guptasarma, D.G. Hinks, Nature, 392, 157 (1998).
- (52) Jianqiao Meng, Guodong Liu, Wentao Zhang, Lin Zhao, Haiyun Liu, Xiaowen Jia, Daixiang Mu, Shanyu Liu, Xiaoli Dong, Jun Zhang, Wei Lu, Guiling Wang, Yong Zhou, Yong Zhu, Xiaoyang Wang, Zuyan Xu, Chuangtian Chen and X. J. Zhou. Nature 462, 335 (2009).
- (53) P. D. C. King, J. A. Rosen, W. Meevasana, A. Tamai, E. Rozbicki, R. Comin, G. Levy, D. Fournier, Y. Yoshida, H. Eisaki, K. M. Shen, N. J. C. Ingle, A. Damascelli, and F. Baumberger Phys. Rev. Lett. 106, 127005 (2011).
- (54) A. Fujimori, E. Takayama-Muromachi, Y. Uchida, and B. Okai, Phys. Rev. B 35, 8814(R) (1987).
- (55) Z.-X. Shen, J. W. Allen, J. J. Yeh, J. -S. Kang, W. Ellis, W. Spicer, I. Lindau, M. B. Maple, Y. D. Dalichaouch, M. S. Torikachvili, J. Z. Sun, and T. H. Geballe, Phys. Rev. B 36, 8414 (1987).
- (56) M. A. van Veenendaal, G. A. Sawatzky and W. A. Groen, Phys. Rev. B 49, 1407 (1994).
- (57) N. B. Brookes, G. Ghiringhelli, O. Tjernberg, L. H. Tjeng, T. Mizokawa, T.W. Li and A. A. Menovsky, Phys. Rev. Lett. 87, 237003 (2001).
- (58) M. Taguchi, A. Chainani, K. Horiba, Y. Takata, M. Yabashi, K. Tamasaku, Y. Nishino, D. Miwa, T. Ishikawa, T. Takeuchi, K. Yamamoto, M. Matsunami, S. Shin, T. Yokoya, E. Ikenaga, K. Kobayashi, T. Mochiku, K. Hirata, J. Hori, K. Ishii, F. Nakamura, and T. Suzuki Phys. Rev. Lett. 95, 177002 (2005).
- (59) N.B. Brookes, G. Ghiringhelli, A.-M. Charvet, A. Fujimori, T. Kakeshita, H. Eisaki, S. Uchida, and T. Mizokawa, Phys. Rev. Lett. 115, 027002 (2015).
- (60) A. Fukuoka, A. Tokiwa-Yamamoto, M. Itoh, R. Usami, S. Adachi, and K. Tanabe, Phys. Rev. B 55, 6612 (1997).
- (61) M. A. van Veenendaal, H. Eskes, and G. A. Sawatzky, Phys. Rev. B 47, 11462 (1993). M. A. van Veenendaal and G. A. Sawatzky, Phys. Rev. B 49, 3473 (1994).
- (62) K. Okada and A. Kotani, Phys. Rev. B 52, 4794 (1995).
- (63) P. Almeras, Tiziana Dell fOrto, C. Coluzza, J. Almeida, G. Margaritondo, Y. Y. Xue, R. L. Meng and C. W. Chu, J. Appl. Phys. 76, 1100 (1994).
- (64) R. P. Vasquez, M. Rupp, A. Gupta, and C. C. Tsuei, Phys. Rev. B 51, 15657(R) (1995).
- (65) C.O. Rodriguez, N.E. Christensen and E.L. Peltzer y Blanca, Physica C 216, 12 (1993).
- (66) C. T. Chen, L. H. Tjeng, J. Kwo, H. L. Kao, P. Rudolf, F. Sette, and R. M. Fleming, Phys. Rev. Lett. 68, 2543 (1992).
- (67) N. Nucker, E. Pellegrin, P. Schweiss, J. Fink,S. L. Molodtsov, C. T. Simmons, G. Kaindl, W. Frentrup, A. Erb and G. Muller-Vogt, Phys. Rev. B 51, 8529(1995).
- (68) E. Pellegrin, J. Fink, C. T. Chen, Q. Xiong, Q. M. Lin, and C. W. Chu, Phys. Rev. B 53, 2767 (1996).
Supplementary Material : Evidence for weakly correlated oxygen holes in the highest-Tc cuprate superconductor HgBa2Ca2Cu3O8+δ
A. Chainani, M. Sicot, Y. Fagot-Revurat, G. Vasseur, J. Granet, B. Kierren, L. Moreau, M. Oura, A. Yamamoto,
Y. Tokura and D. Malterre.
.1 Experimental details of the sample preparation, characterization and the spectroscopy measurements:
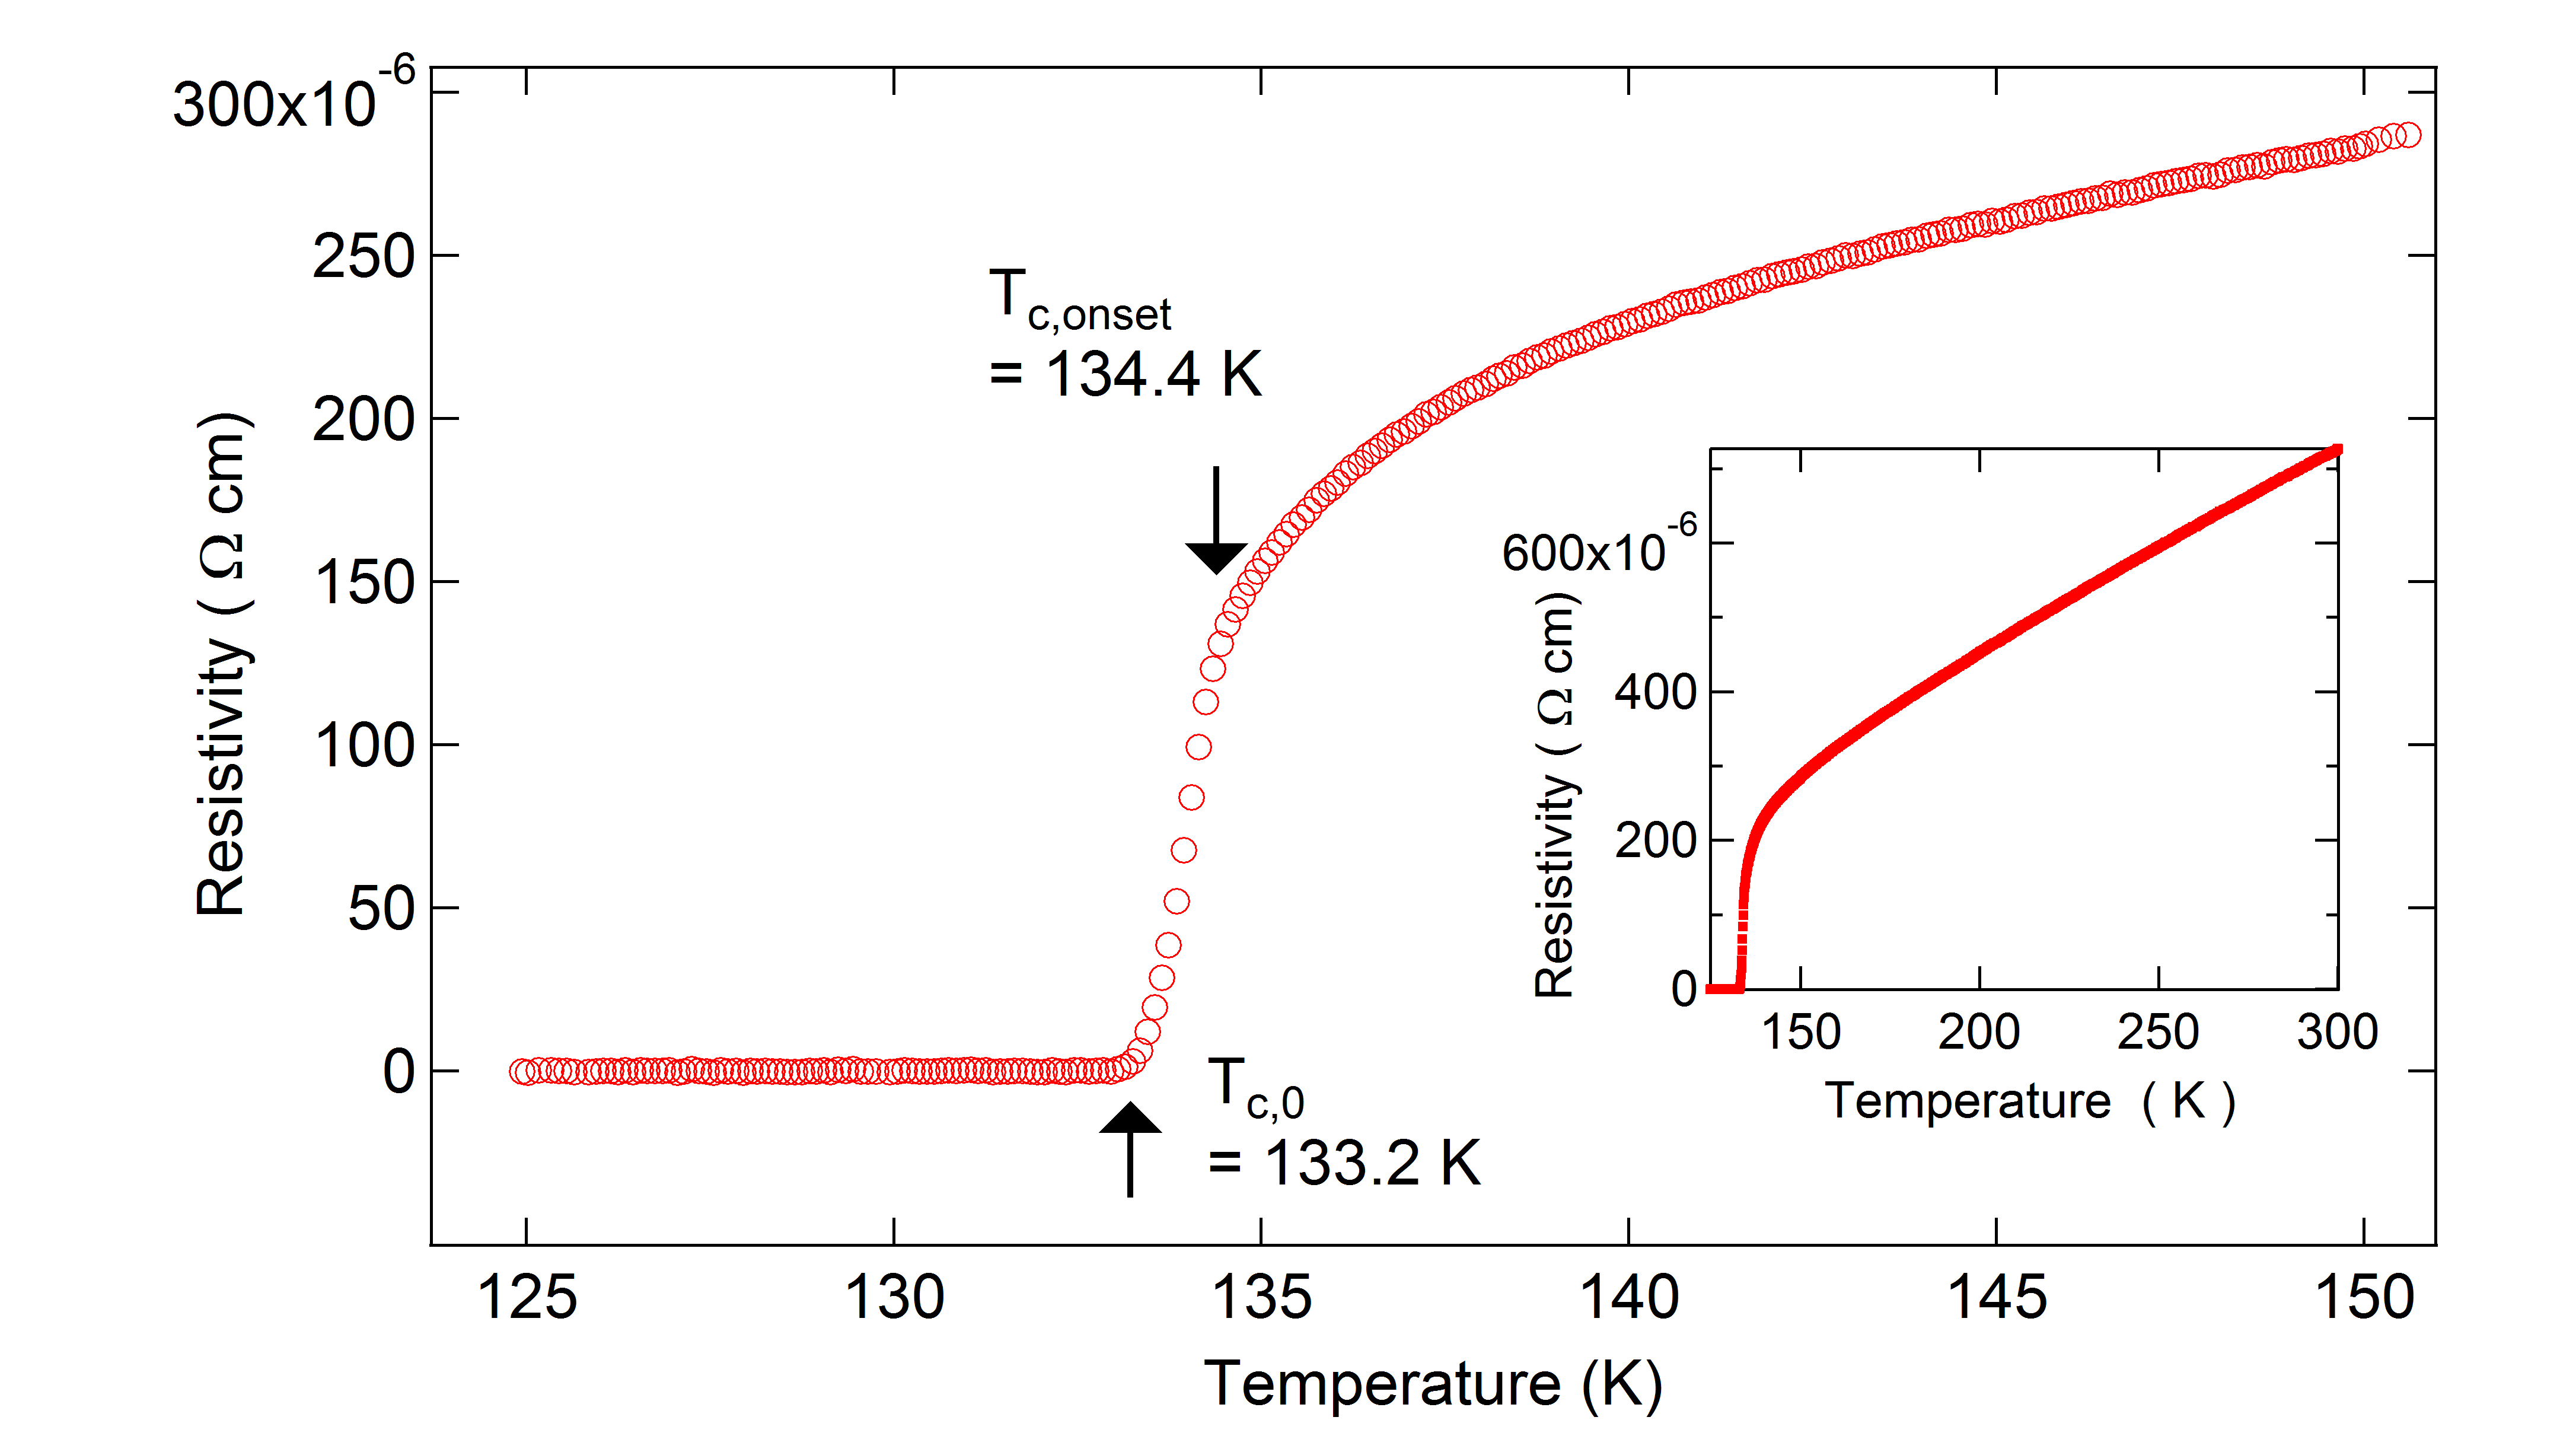
The polycrystalline Hg1223 sample was prepared from a mixture of HgO and a precursor. The precursor was prepared from BaCO3, CaCO3, and CuO at 950 C in flowing high-purity oxygen gas. It was found necessary to use a slightly Hg-deficient starting composition of Hg0.75Ba2Ca2Cu3Oy (HgO : Ba2Ca2Cu3Oy = 0.75 : 1) to avoid impurity phases.Yamamoto2 The mixture was pressed into a cylindrical pellet, charged into a gold capsule, and then heated at 830 C under 2 GPa for 30 min, using a cubic-anvil high-pressure apparatus (TRY Engineering, 180-ton press). The powder X-ray diffraction patterns confirmed the single phase of Hg1223. Fig. S1 shows the superconducting transition with a = 134.4 K and = 133.2 K, from electrical resistivity measurements (PPMS, Quantum Design). The inset shows the wide range resistivity data upto 300 K showing the nearly linear resistivity as a function of temperature, typical of high-Tc cuprate superconductors.
Ultraviolet (UV)-PES using a He I discharge lamp was carried out at University of Lorraine. The spectrometer is equipped with a Gammadata-Scienta SES2002 hemispherical electron analyzer. The sample was cooled using a flowing liquid nitrogen cryostat and the sample temperature was T = 120 K. The total energy resolution was 40 meV for the UV-PES measurements. Soft x-ray PES measurements were carried out at beamline BL17SU, SPring-8 using incident photon energies of h = 524 eV-1200 eV and a spectrometer equipped with a Gammadata-Scienta SES2002 hemispherical electron analyzer. The total energy resolution was about 160 - 280 meV for the SX-PES measurements. XAS measurements were recorded in the total electron yield mode. SX-PES measurements were carried out at a sample temperature of T = 20 K obtained using a flowing liquid He cryostat. The measurements were carried out in a vacuum below 4 x 10⁻⁸ Pa and clean sample surfaces were obtained by cleaving the sample. For the UV-PES measurements, the cleaving was done in the preparation chamber at room temperature and the sample was transferred immediately into the analysis chamber and cooled, while for the SX-PES, XAS and Resonant-PES measurments, the cleaving was carried out in-situ at T = 20 K. The spectra were calibrated using the Fermi level (EF ) measured from a gold film evaporated onto the sample holder. The Resonant-PES measurements were also calibrated by measuring the gold spectrum at the start and end of every cycle of photon energies used for the Cu L-edge and O K-edge measurements.
.2 Core level PES and wide range valence band PES measurements:
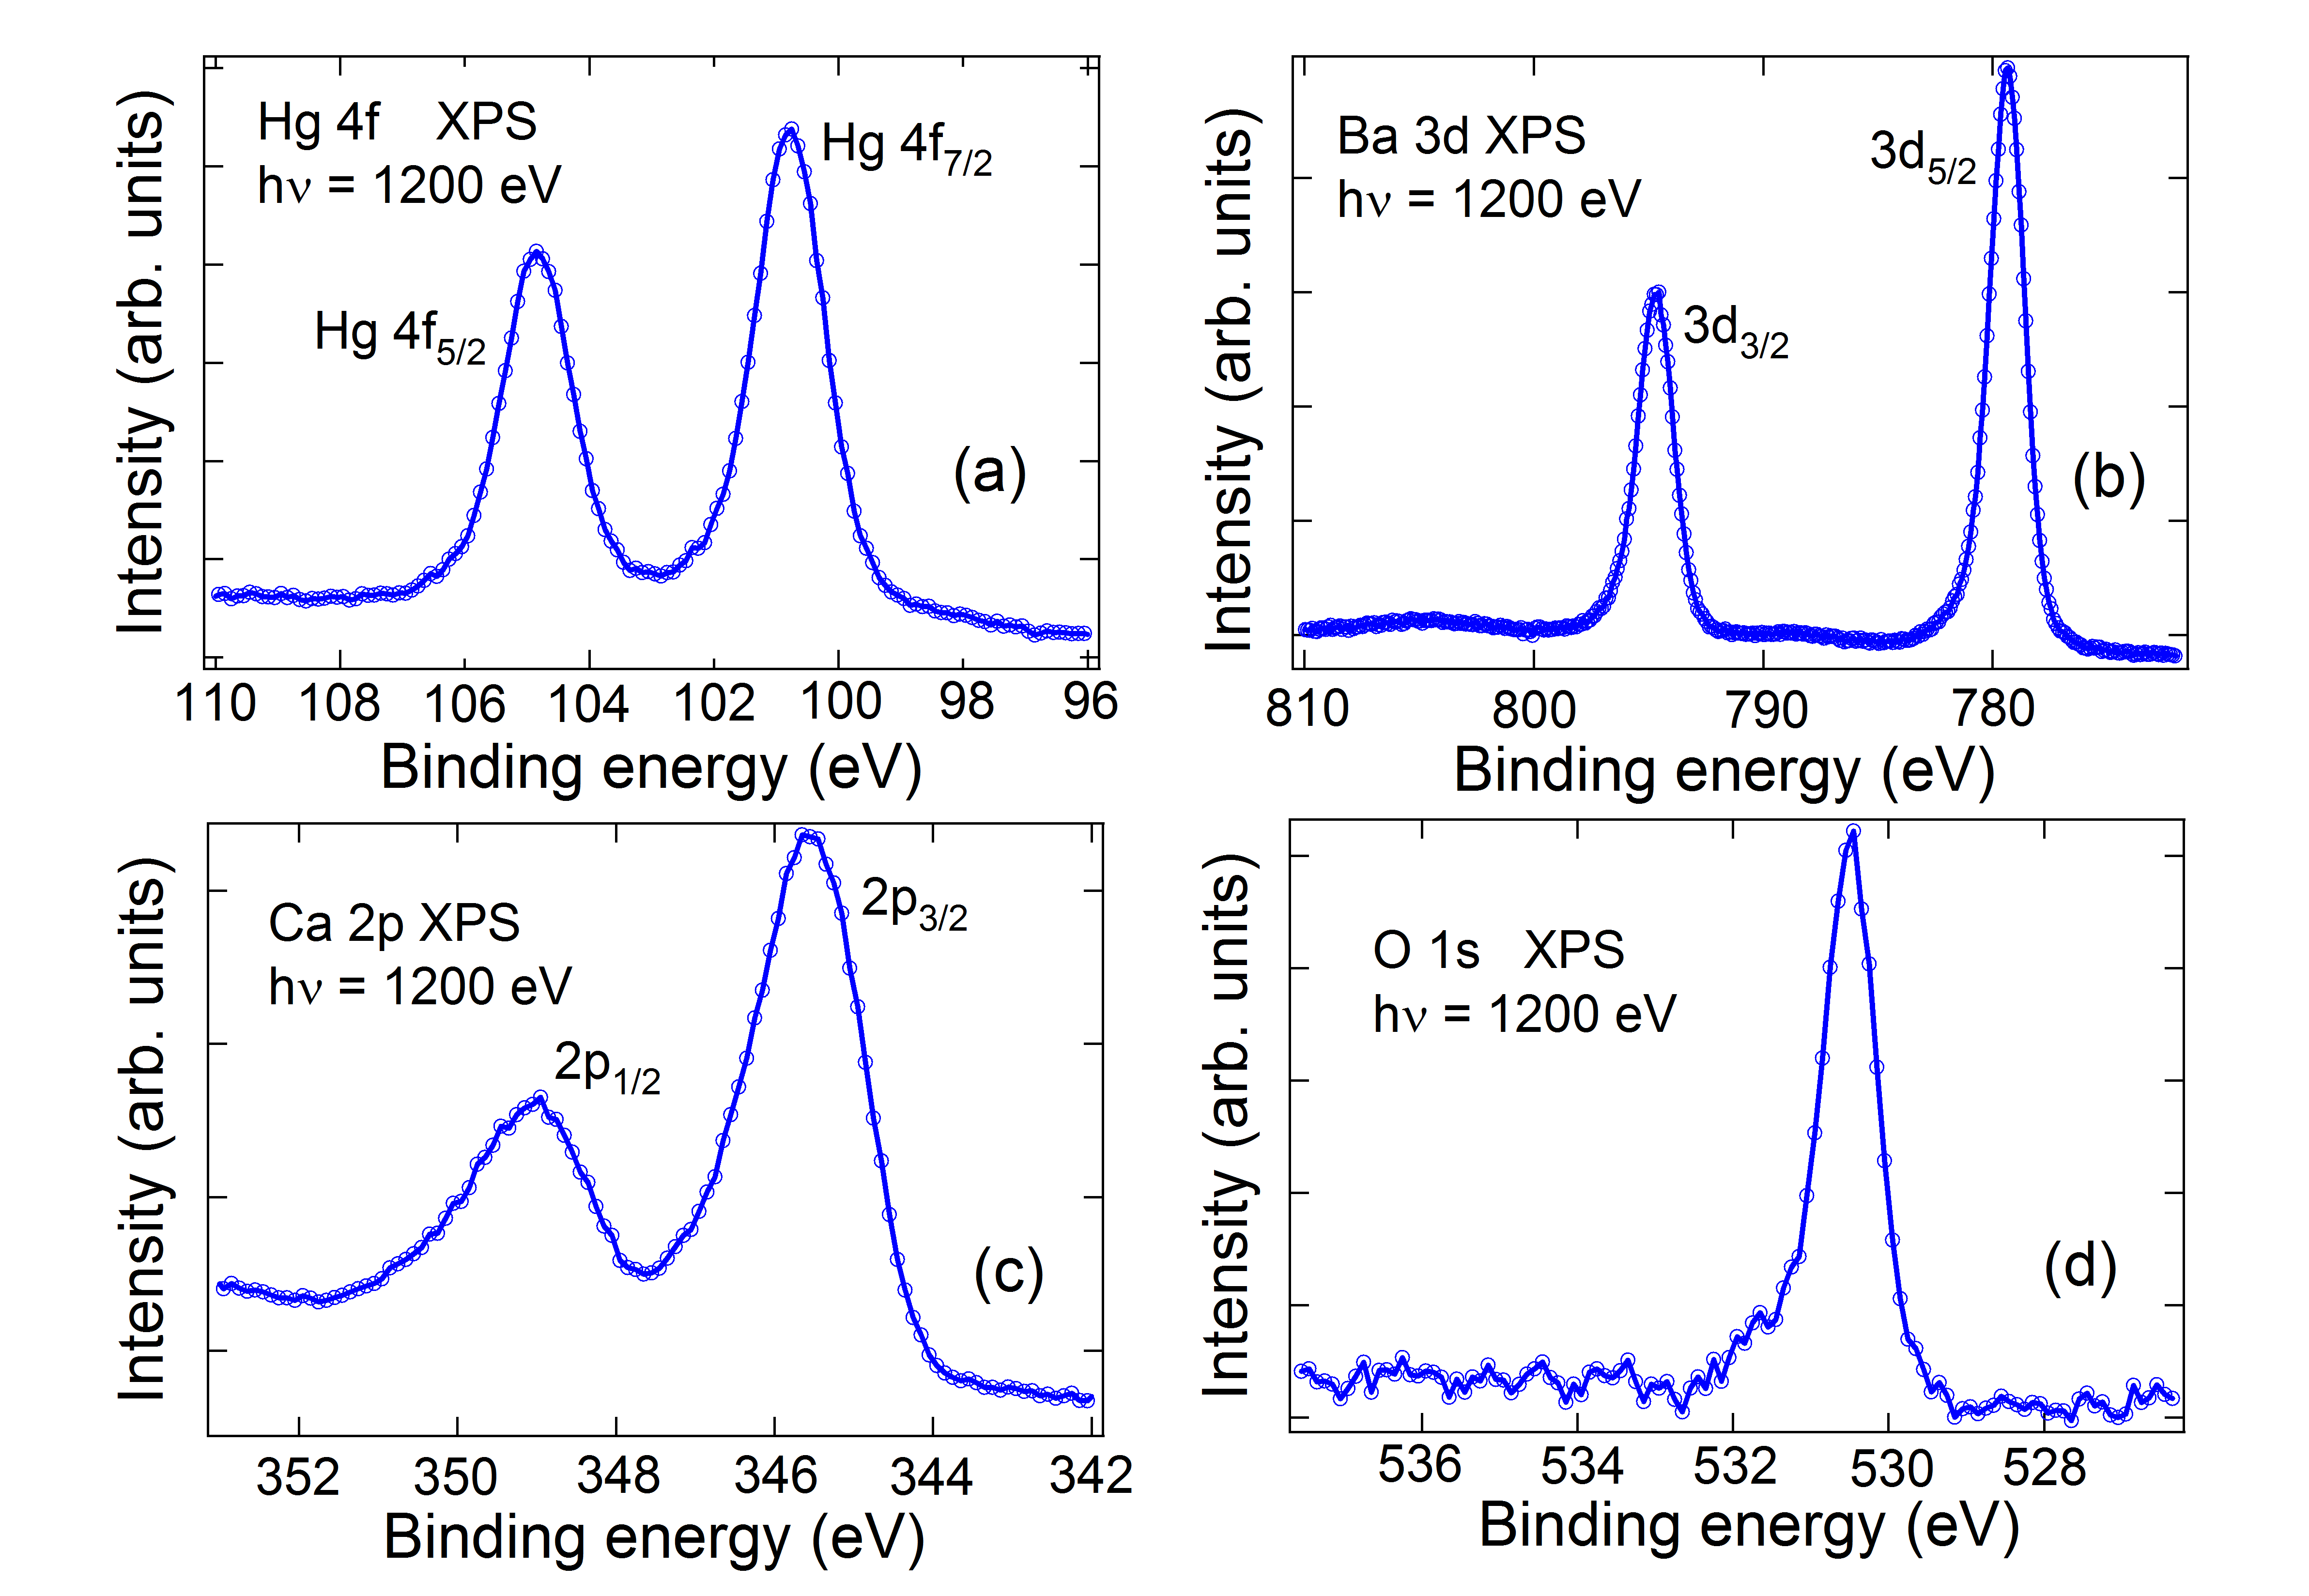
Fig. S2(a-d) shows the core levels of Hg 4f, Ba 3d , Ca 2p and O 1s, respectively, measured at T = 20 K using a photon energy h = 1200 eV. The Hg 4f (Fig. S2(a)) spectrum exhibits clean single peaks for the Hg 4f7/2 and 4f5/2 spin-orbit split levels, occuring at 100.8 eV and 104.8 eV. These values are typical of Hg2+ states as in HgO.NIST This result rules out the presence of Hg3+, and hence mixed valency of Hg ions in Hg1223, which was claimed in an early study based on Hg 4f levels showing doublet features for the 4f7/2 and 4f5/2 levels.Gopinath We believe the difference between the present study and earlier work stems from the fact that we have used a high pressure synthesis and we obtain optimally doped samples with a Tc = 134 K, which corresponds to a hole doping p = 0.2.Yamamoto2 In contrast, the earlier study, which used samples made by a solid state reaction method, had inferred their sample to be underdoped based on an analysis that Hg3+ would effectively remove holes.Gopinath Fig. S2(b) shows the Ba 3d5/2 and 3d3/2 core levels as sharp single peaks at 779.4 eV and 794.7 eV, respectively. These values are typical of Ba2+ as in BaO.NIST Similarly, Fig. S2(c) shows the Ca 2p3/2 and 2p1/2 core levels as single peaks at 345.5 eV and 349.0 eV, and are typical of Ca2+ states.NIST Fig. S2(d) shows the oxygen 1s core level with an essentially single peak at 530.5 eV, although a very weak feature at 531.8 eV can also be discerned. The high binding energy weak feature at 531.8 eV is attributed to suface non-stoichiometry, which is seen even for cleaved single crystal metal oxides.Parmigiani
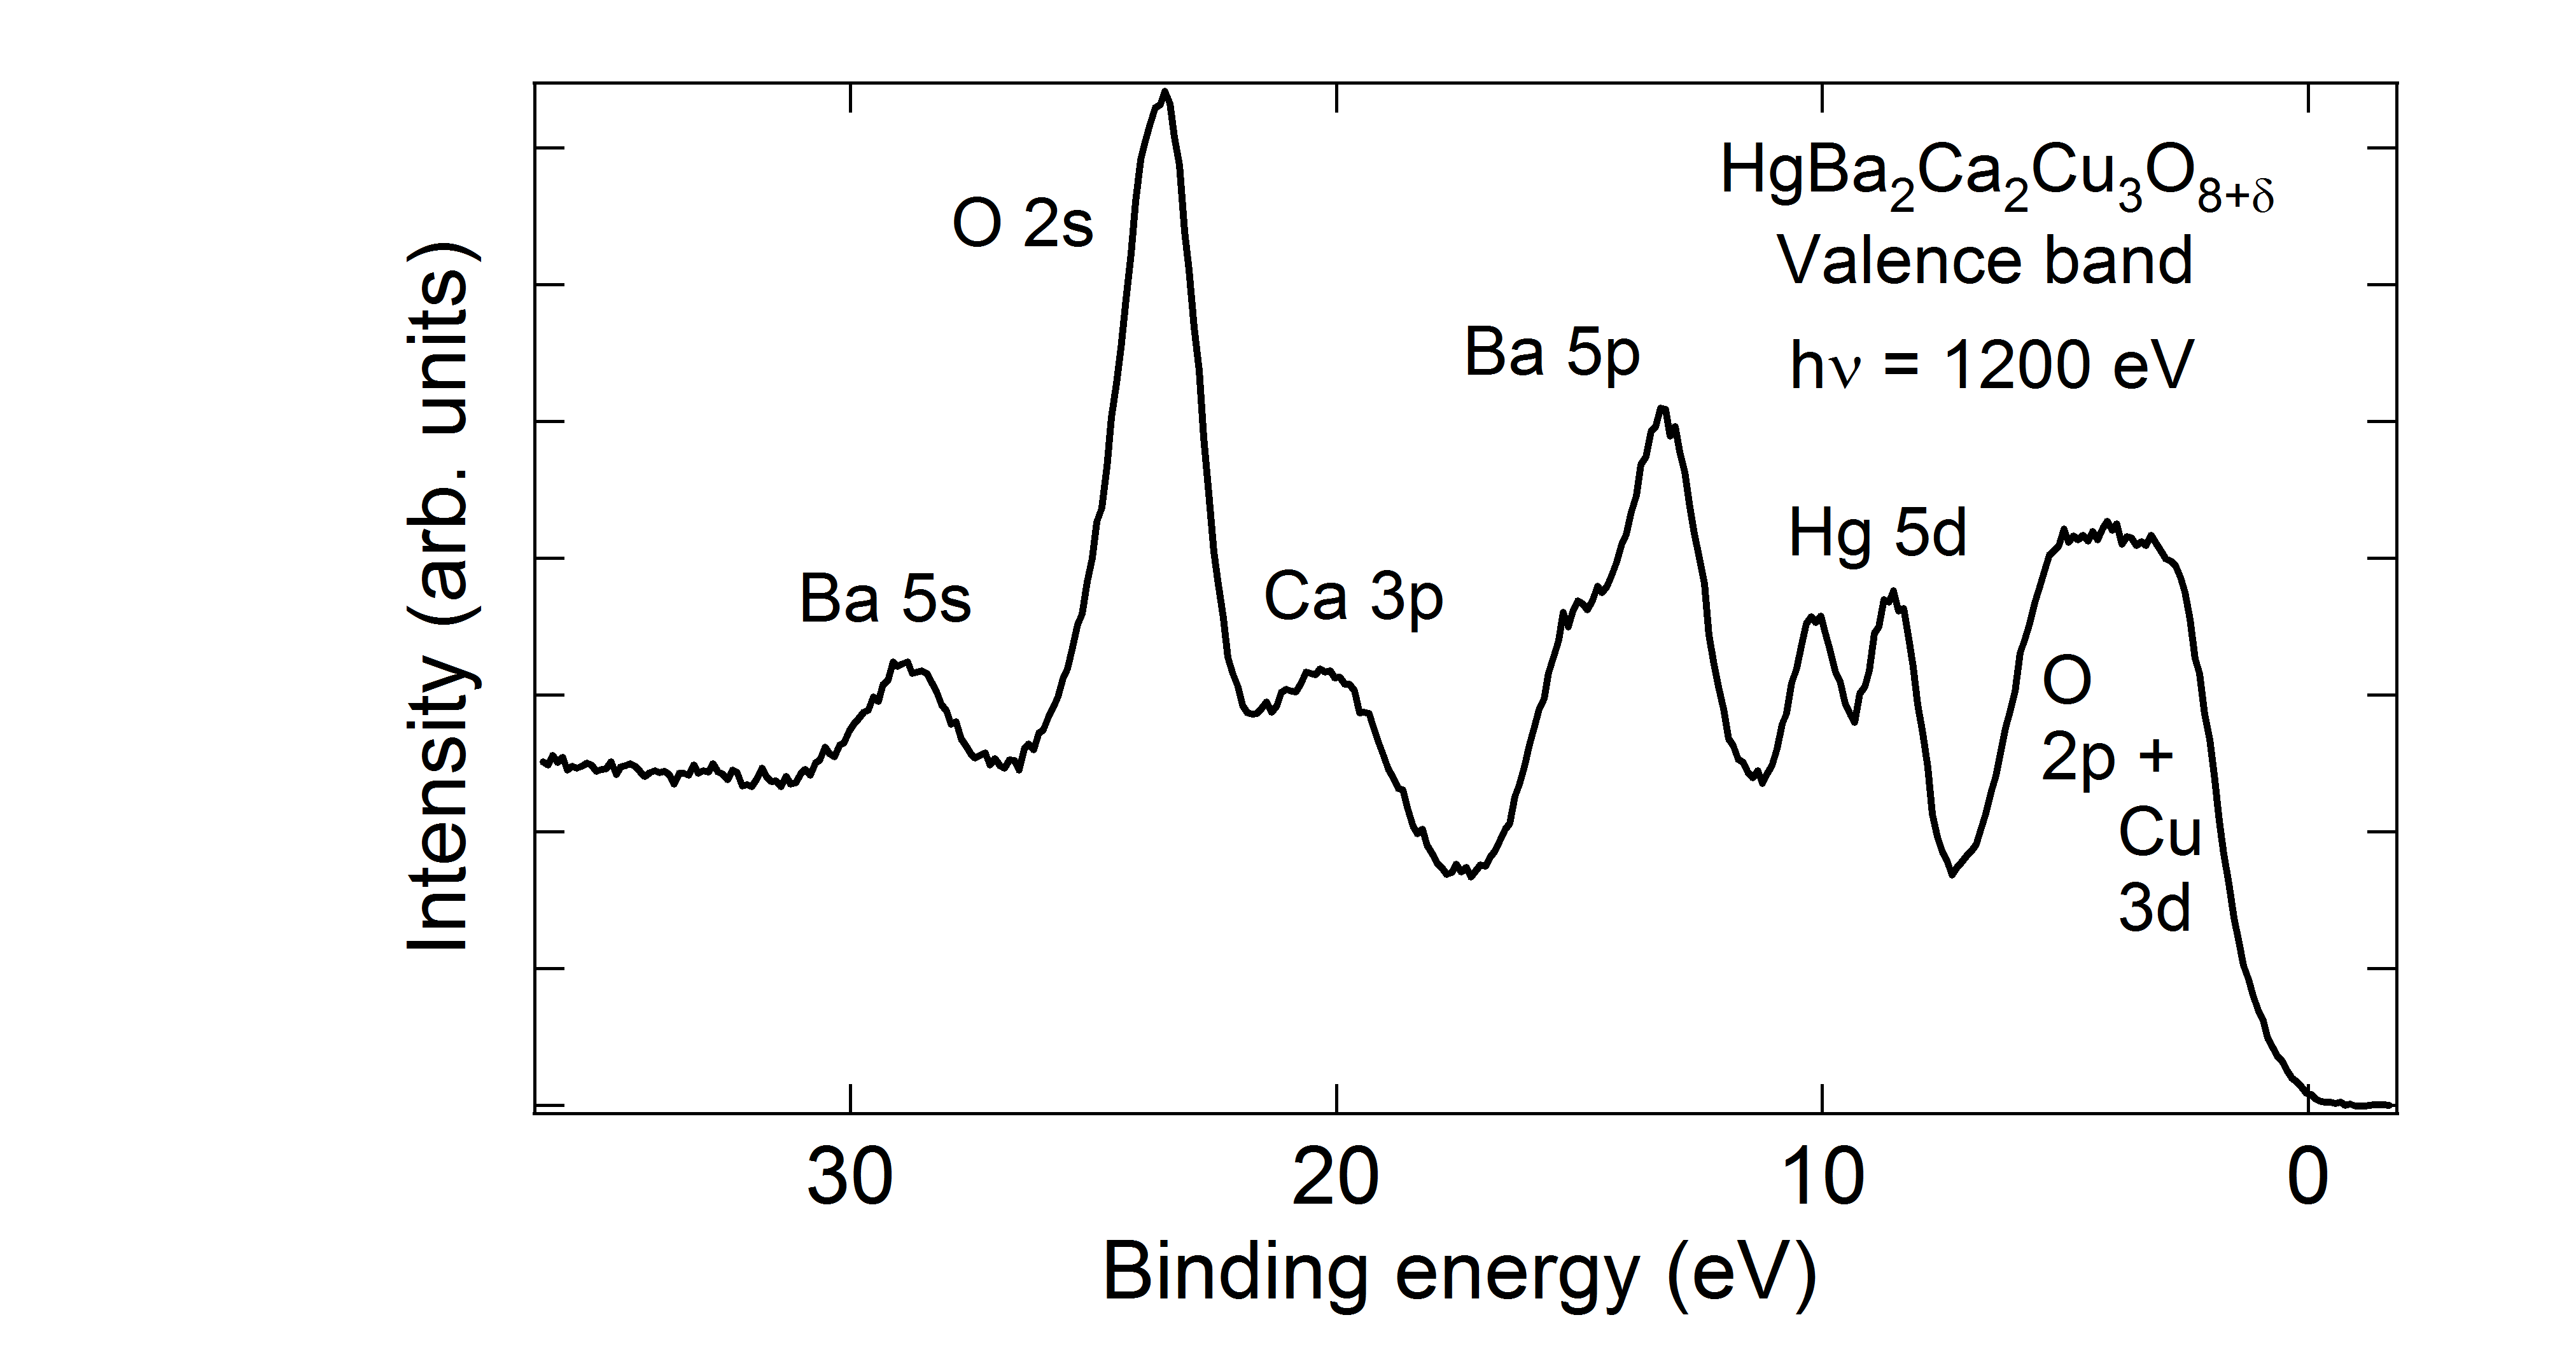
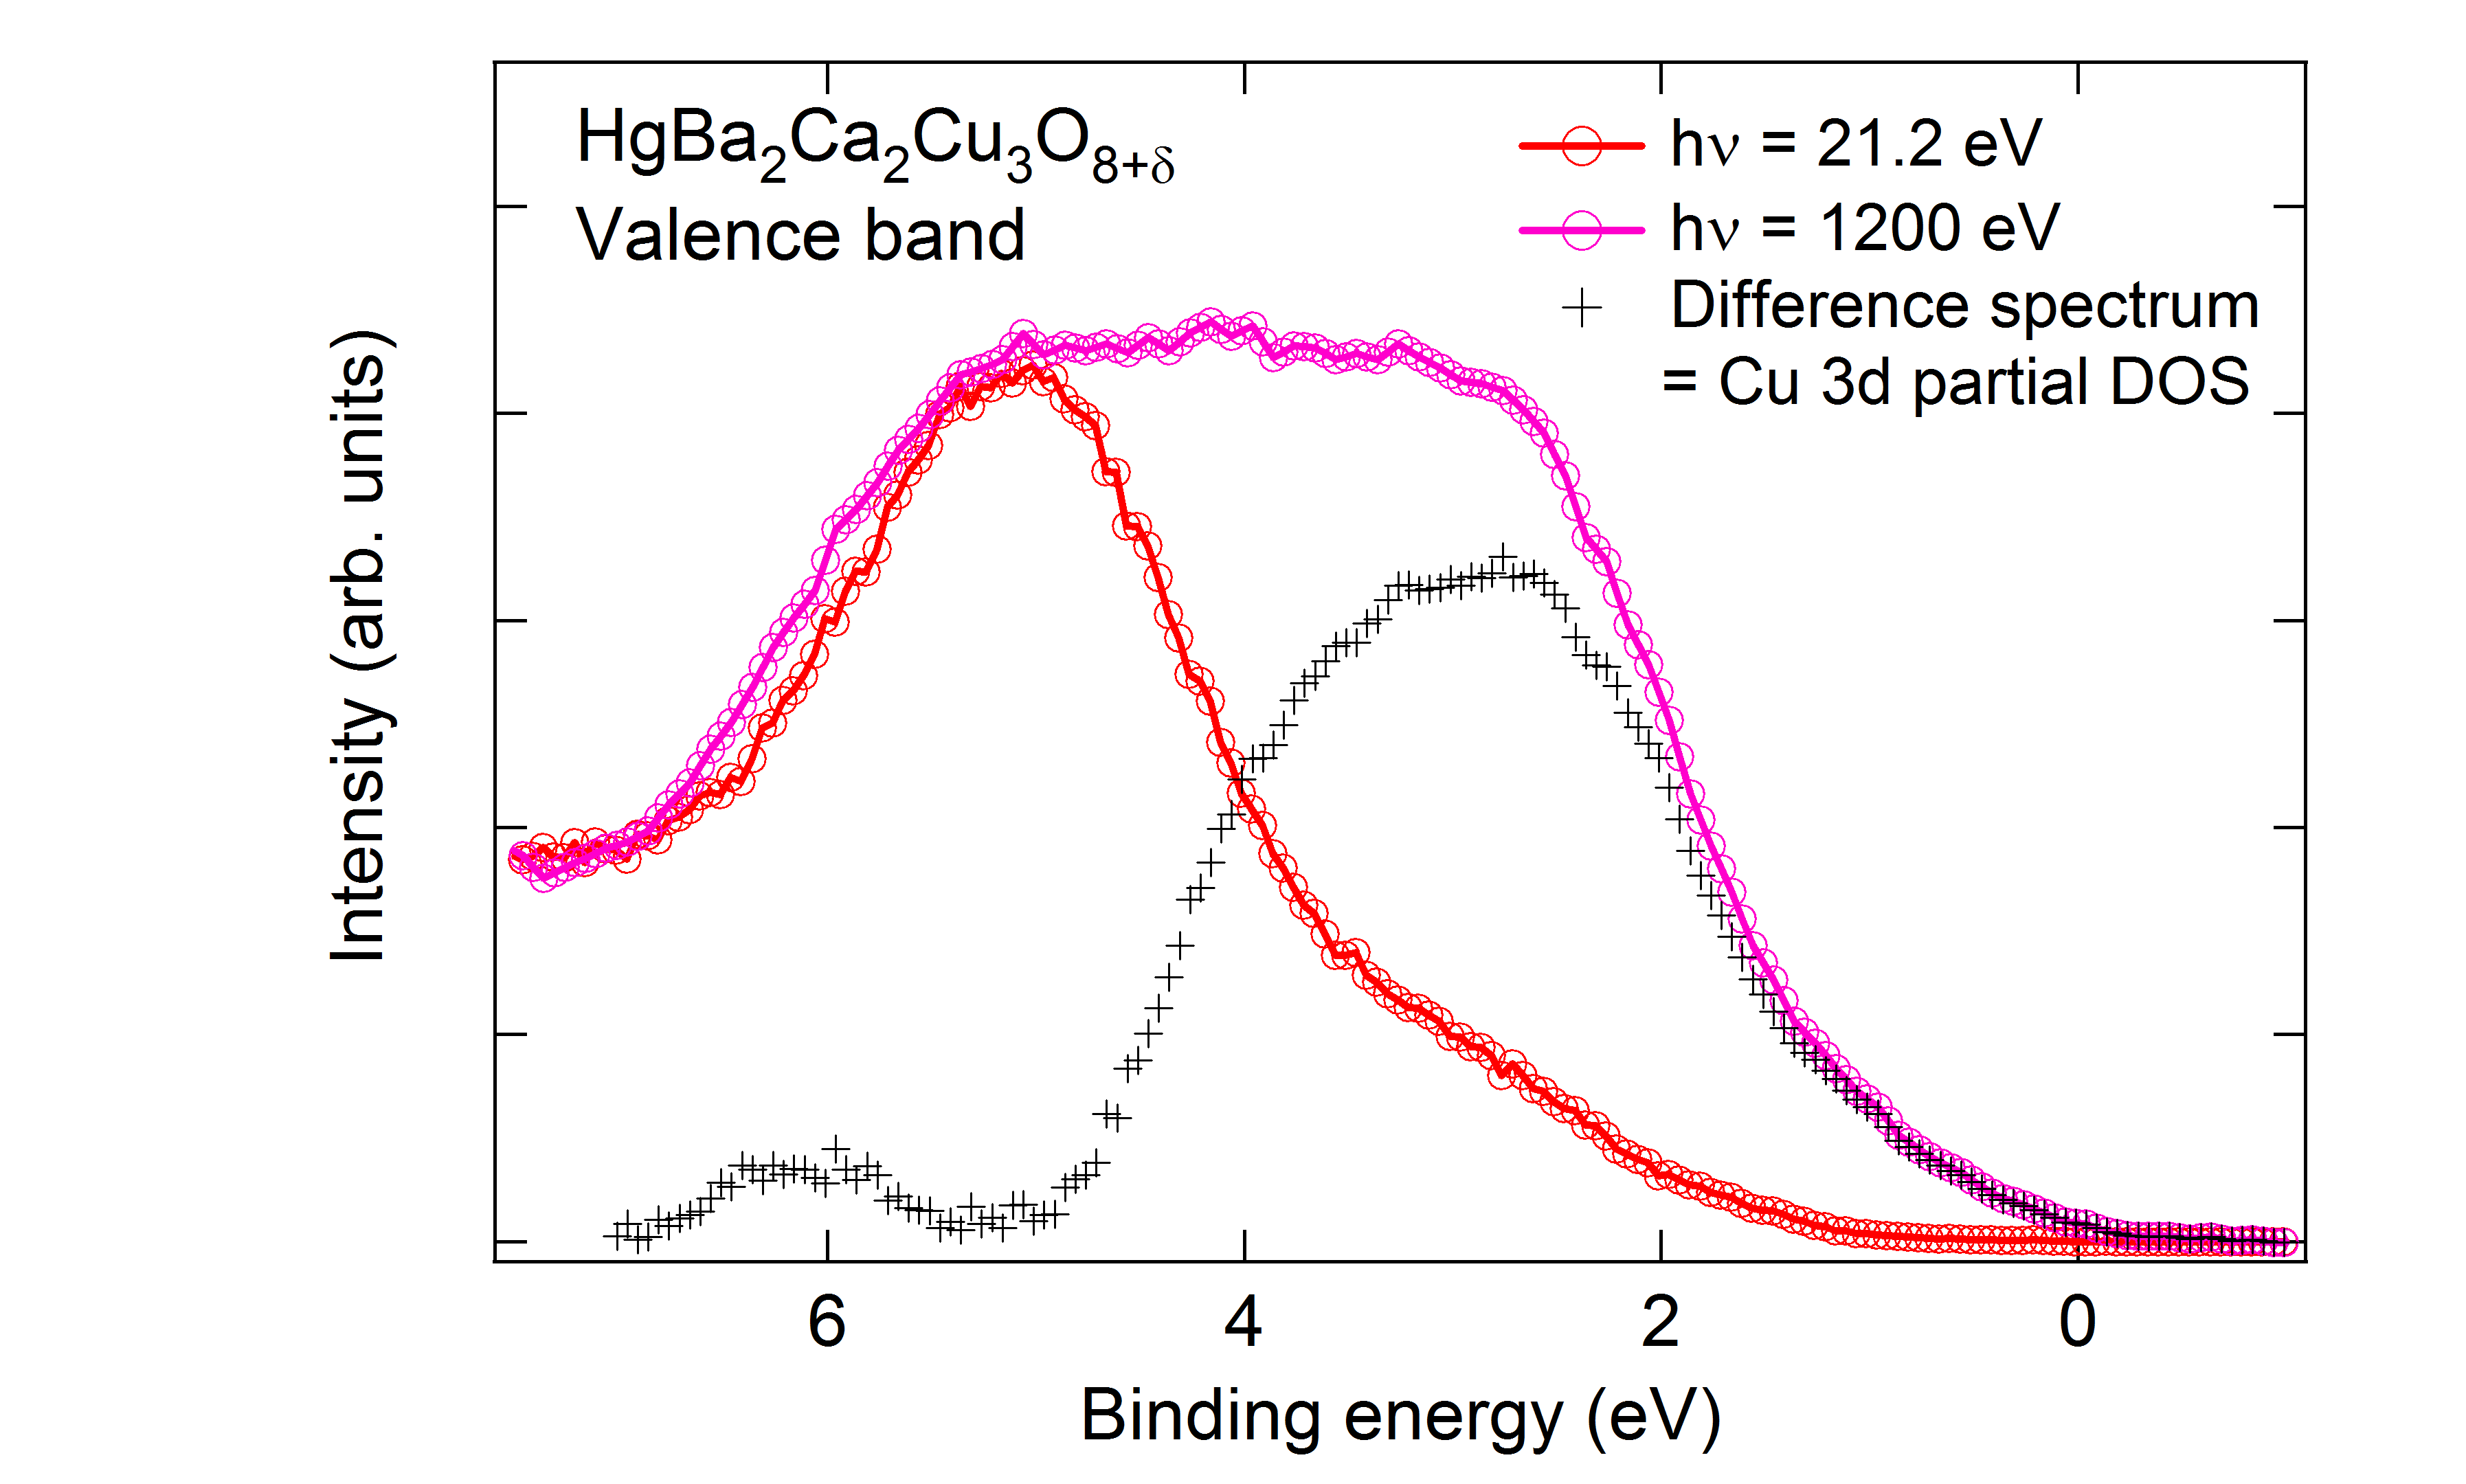
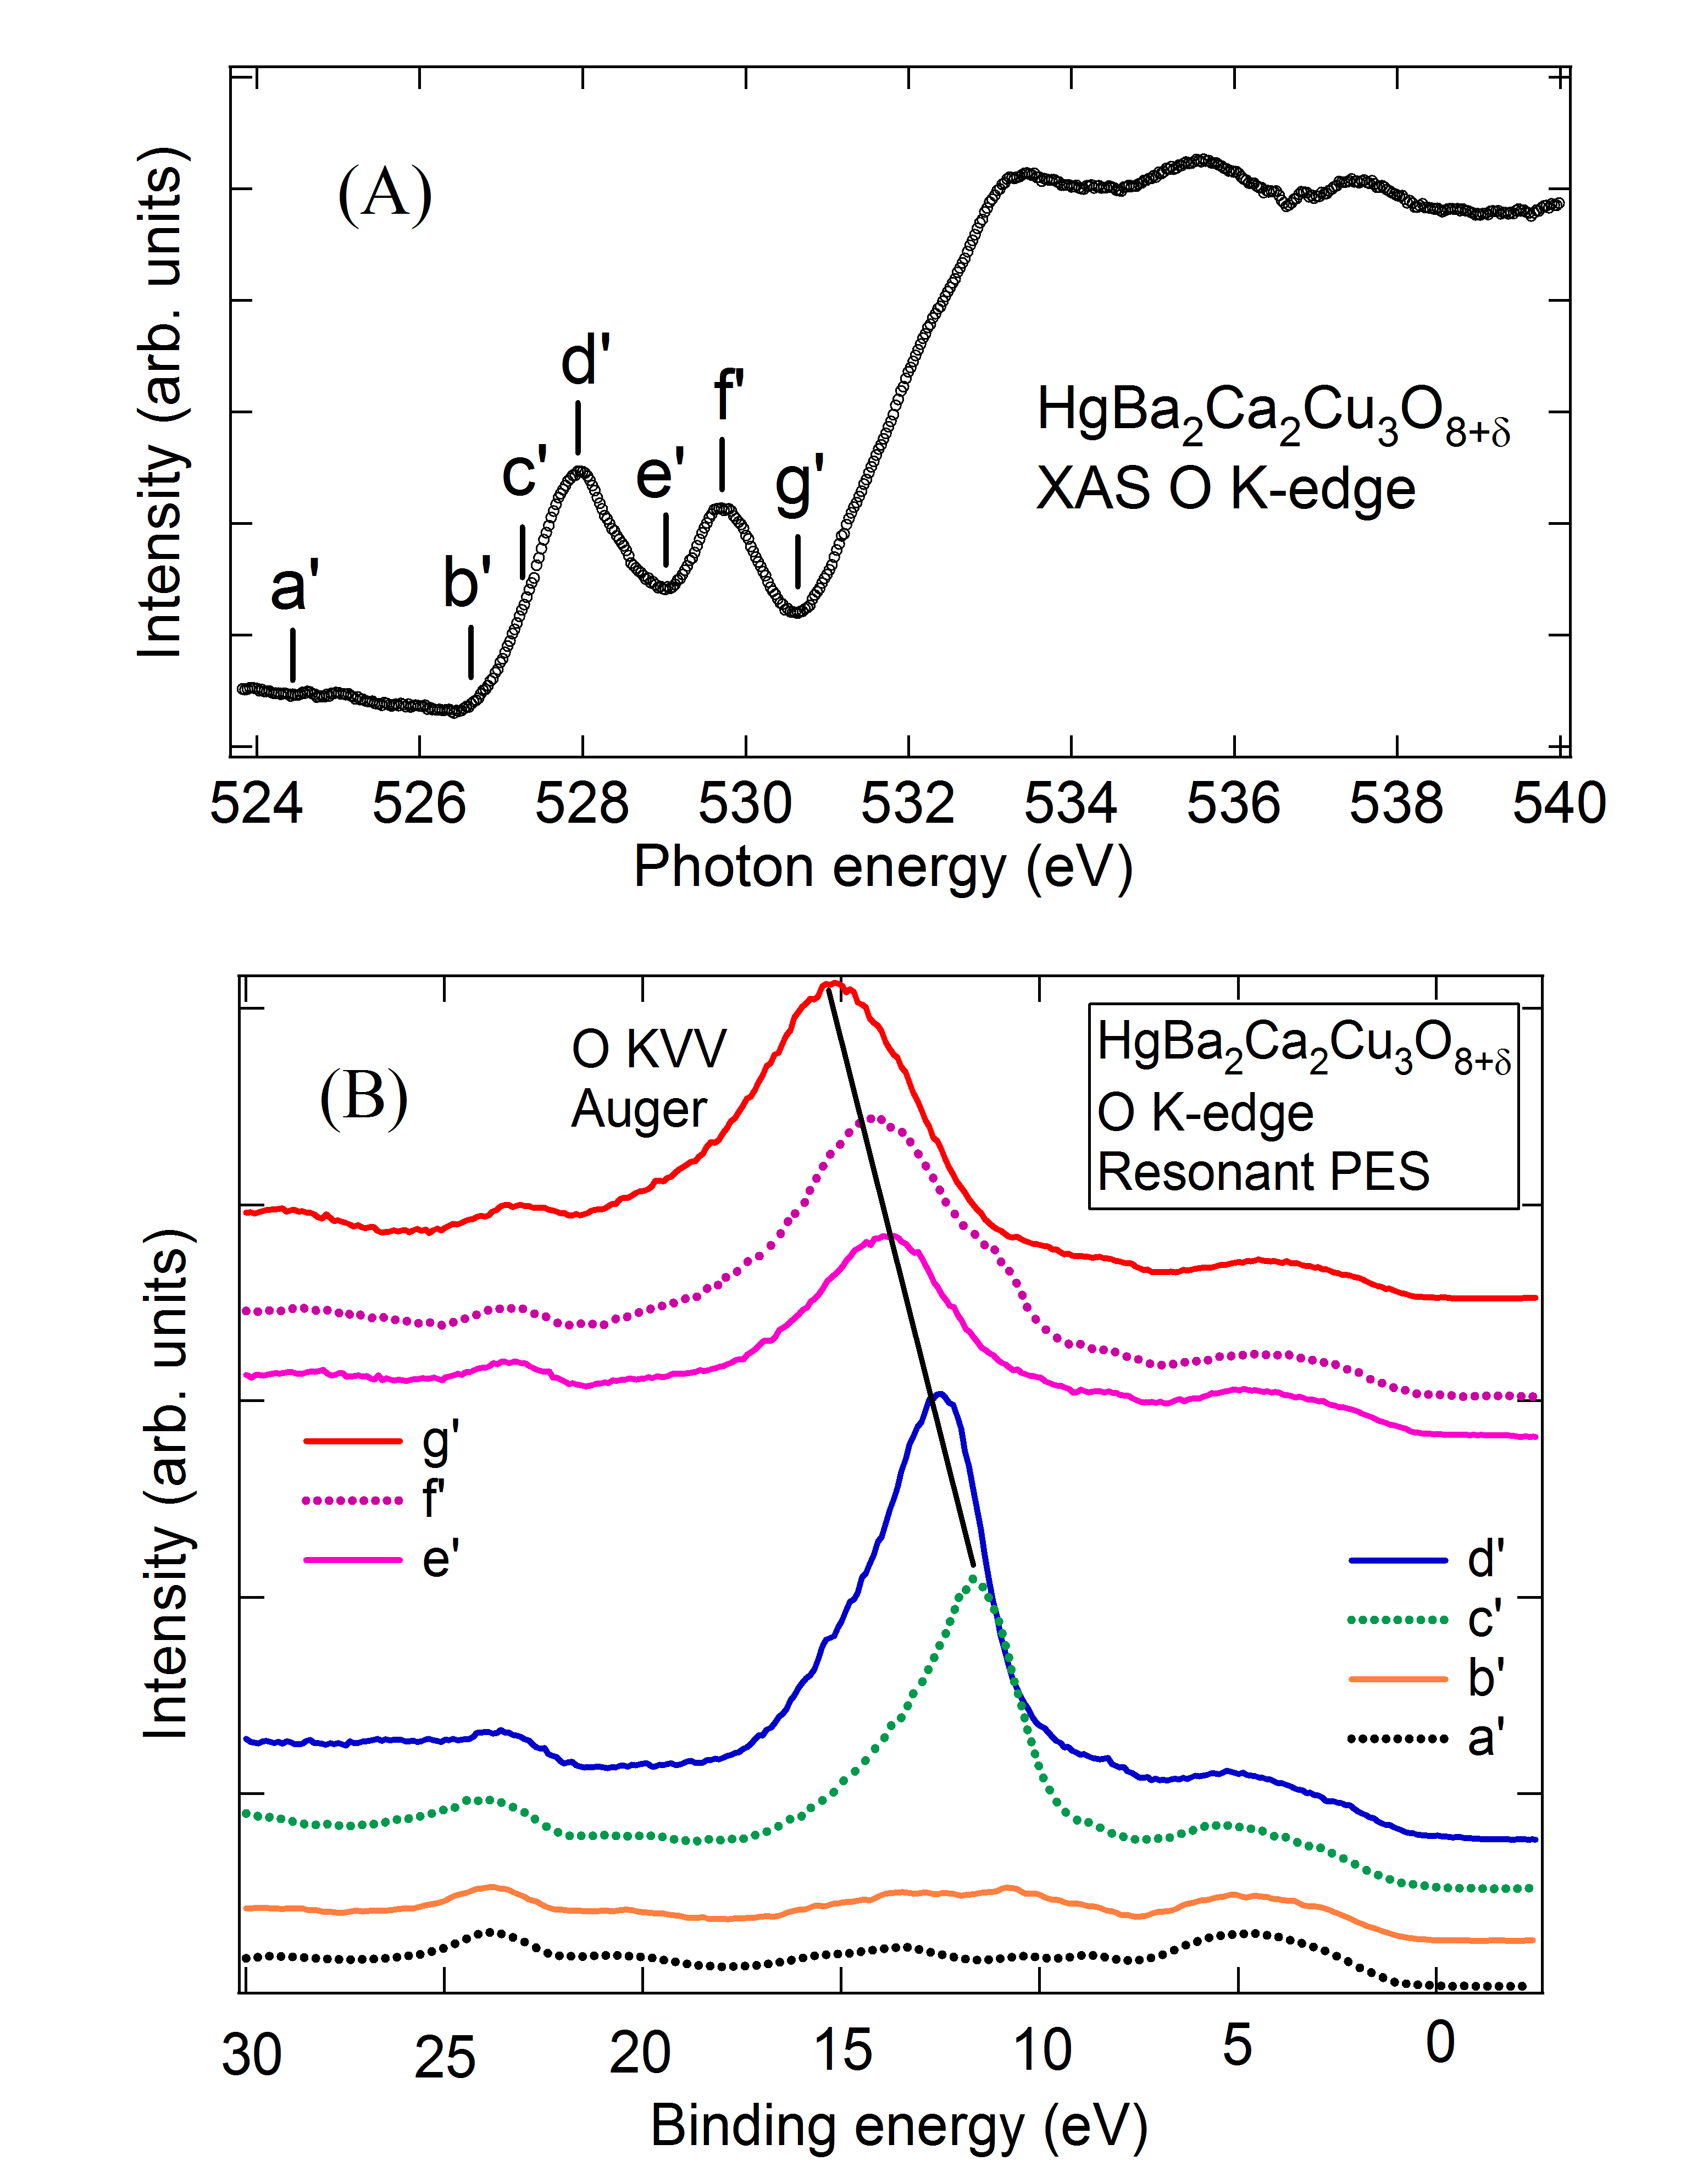
Fig. S3 shows the wide range valence band spectrum of Hg1223 measured at T = 20 K using h= 1200 eV. The spectrum shows the shallow core levels of Ba 5s at about 29 eV, the O 2s peak at 23.5 eV, and the Ca 3p at 20 eV binding energy. The Ba 5p3/2 and 5p1/2 doublet is observed at 13.3 eV and 14.8 eV, respectively, while the Hg 5d5/2 and 5d3/2 levels are seen at 8.5 eV and 10.1 eV binding energies. The valence band consisting of the Cu 3d and O 2p states occurring between the Fermi level and about 6 eV binding energy are discussed in detail in Fig. 1 of the main paper, which compares the valence band spectra obtained using incident photon energies of h = 21.2 eV, 524.4 eV, 926.3 eV and 1200 eV. Based on atomic cross-sections as a function of incident photon energy, the photon energy dependence indicates that the 5 eV feature seen in the h = 21.2 eV spectrum is dominated by the O 2p partial density of states (pDOS). This is consistent with band structure calculations of Hg1223.Rodriguez2 In order to separate out the O 2p and Cu 3d states, in Fig. S4 we plot the spectrum measured using h = 21.2 eV with the h = 1200 eV spectrum. The spectra are normalized at 5 eV binding energy corresponding to the feature due to dominantly O 2p states. The difference spectrum obtained by subtracting the h = 21.2 eV from the h = 1200 eV spectrum is representative of the dominantly Cu 3d pDOS(Fig. S4). A numerical self-convolution of the obtained Cu 3d pDOS is carried out to obtain the two hole spectrum and compared with the spectrum showing the Cu 3d correlation satellite, as shown in Fig. 3 of the main paper.
.3 Cini-Sawatzky method for estimating on-site Coulomb energy:
Early work by CiniCini and SawatzkySawatzky showed that on-site Coulomb energies can be quantified and the method has been applied to several TM oxides.Marel ; Balzarotti ; Tjeng ; BarDeroma ; Ishida ; Post ; Park ; AC ; DD ; Ghijsen The method is : determine the one-electron removal (single-hole) valence band (VB) partial density of states(pDOS), numerically evaluate the two-valence-hole energies as a self-convolution of the single-hole states, and then compare with the measured correlation satellite associated with the two-valence-hole (VV) Auger final state for estimating the site-specific Coulomb energies in compounds. We follow the same procedure for obtaining Udd and Upp via measurements of the O 2p and Cu 3d VB pDOS, and the O KVV and Cu LVV Auger spectra.
.4 O K-edge XAS and O 1s-2p resonant valence band PES measurements:
In Fig. S5(A), we show the O K-edge XAS which exhibits a two peak structure at 528 eV and 530 eV photon energies (labelled and ). These two peaks are due to O 2p states hybridized with Cu 3d states and are attributed to the doped hole states and the upper Hubbard band, respectively.CT ; Fink The higher lying features at 533 eV-536 are due to the Hg-Ba-Ca p-character states. We then carried out O 1s-2p resonant valence band PES at the photon energies labelled and the spectra are correspondingly labelled and shown in Fig. S5(B). The off-resonance spectrum is the same as the h = 524.4 eV spectrum of Fig. 1. As we increase the photon energies from to , we see a systematic evolution of the valence band spectra. In particular, at the energy = 527.6 eV, we see a clear high intensity feature centered at 11.6 eV BE. On increasing the photon energy further, we see a shift of this feature to higher binding energies, with the magnitude of the energy shift tracking the increase in photon energy. This identifies the resonance feature as the O KVV Auger state, with two final state holes(VV) in the valence band. This confirms its origin to be the O KVV correlation satellite and we analyse it further to obtain an on-site Upp = 1.0 0.5 eV, as discussed in the main text(Fig. 4).
.5 Model many-body calculations including non-local screening for a Cu2O7 cluster :
We have carried out model many-body Hamiltonian calculations for the Cu 2p XPS and Cu L-edge XAS using a Cu2O7 cluster with non-local screening, following the work of Veenendaal et alVeenendaal3 . We consider the simplest case of hole doping, namely, one extra hole in the Cu2O7 cluster where the undoped reference state has one hole per Cu site. Thus, we have three holes in the Cu2O7 cluster corresponding to a hole-doping content of 50%. We use the notation for the Cu2O7 cluster(see Fig. S6) with the Cu site in the left CuO4 plaquette labelled as Cu1 and that in the right CuO4 plaquette is labelled as Cu2.
For the assumed case of the core hole on the Cu1 site, the purely ionic character state is given by Cu1 d8 ; Cu2 d9 and its complementary state is given by the Cu1 d8 ; Cu2 d9 state. For the d8 ionic configuration, we consider d9 and d10 charge-transferred states, while for the d9 configuration, we consider d10 charge-transferred state. The electronic parameters entering the calculation are , the charge-transfer energy, the O 2p-Cu 3d overlap integral tpd, the O 2p-O 2p overlap integral tpp, Udd, Upp and the Coulomb interaction due to the core hole Udc. Here, we have restricted Udd and Upp to the experimentally estimated values. We have neglected multiplet effects in the calculations. The pure ‘local screening’ state is one in which the ligand from the Cu1 site plaquette with the core hole takes part in screening e.g. dn+1 ; Cu2 dm, where n and m correspond to the initial ionic states. The pure ‘non-local screening’ corresponds to the case when the core hole is on the Cu1 site while the ligand from the Cu2 site plaquette participates in the screening process e.g. Cu1 dn+1 ; Cu2 dm. And we can also have states like Cu1 dn+1 ; Cu2 dm+1, or Cu1 dn+2 ; Cu2 dm, etc. which have local and non-local screening. The non-local screening indicates that the more stable configuration requires the ligand hole screening on the Cu2 site and represents the Zhang-Rice singlet (ZRS) state.Veenendaal3 As discussed in the introduction, it has been shown that the ZRS state survives in the doped hole case using core level PESVeenendaal942 ; Taguchi2 and spin-polarized resonant photoemission measurements.Brookes2 In spite of the restricted number of basis states, we found that these basis states were sufficient to reproduce all the features in the experimental Cu 2p3/2 PES and Cu L3-edge XAS spectra as shown in Fig. 5 and discussed in the main paper.
In order to further check the validity of the estimated Udd and Upp values, we have carried out an extensive check by varying Udd and Upp and keeping all other parameters fixed. The results are shown in Figs. S7 and S8.
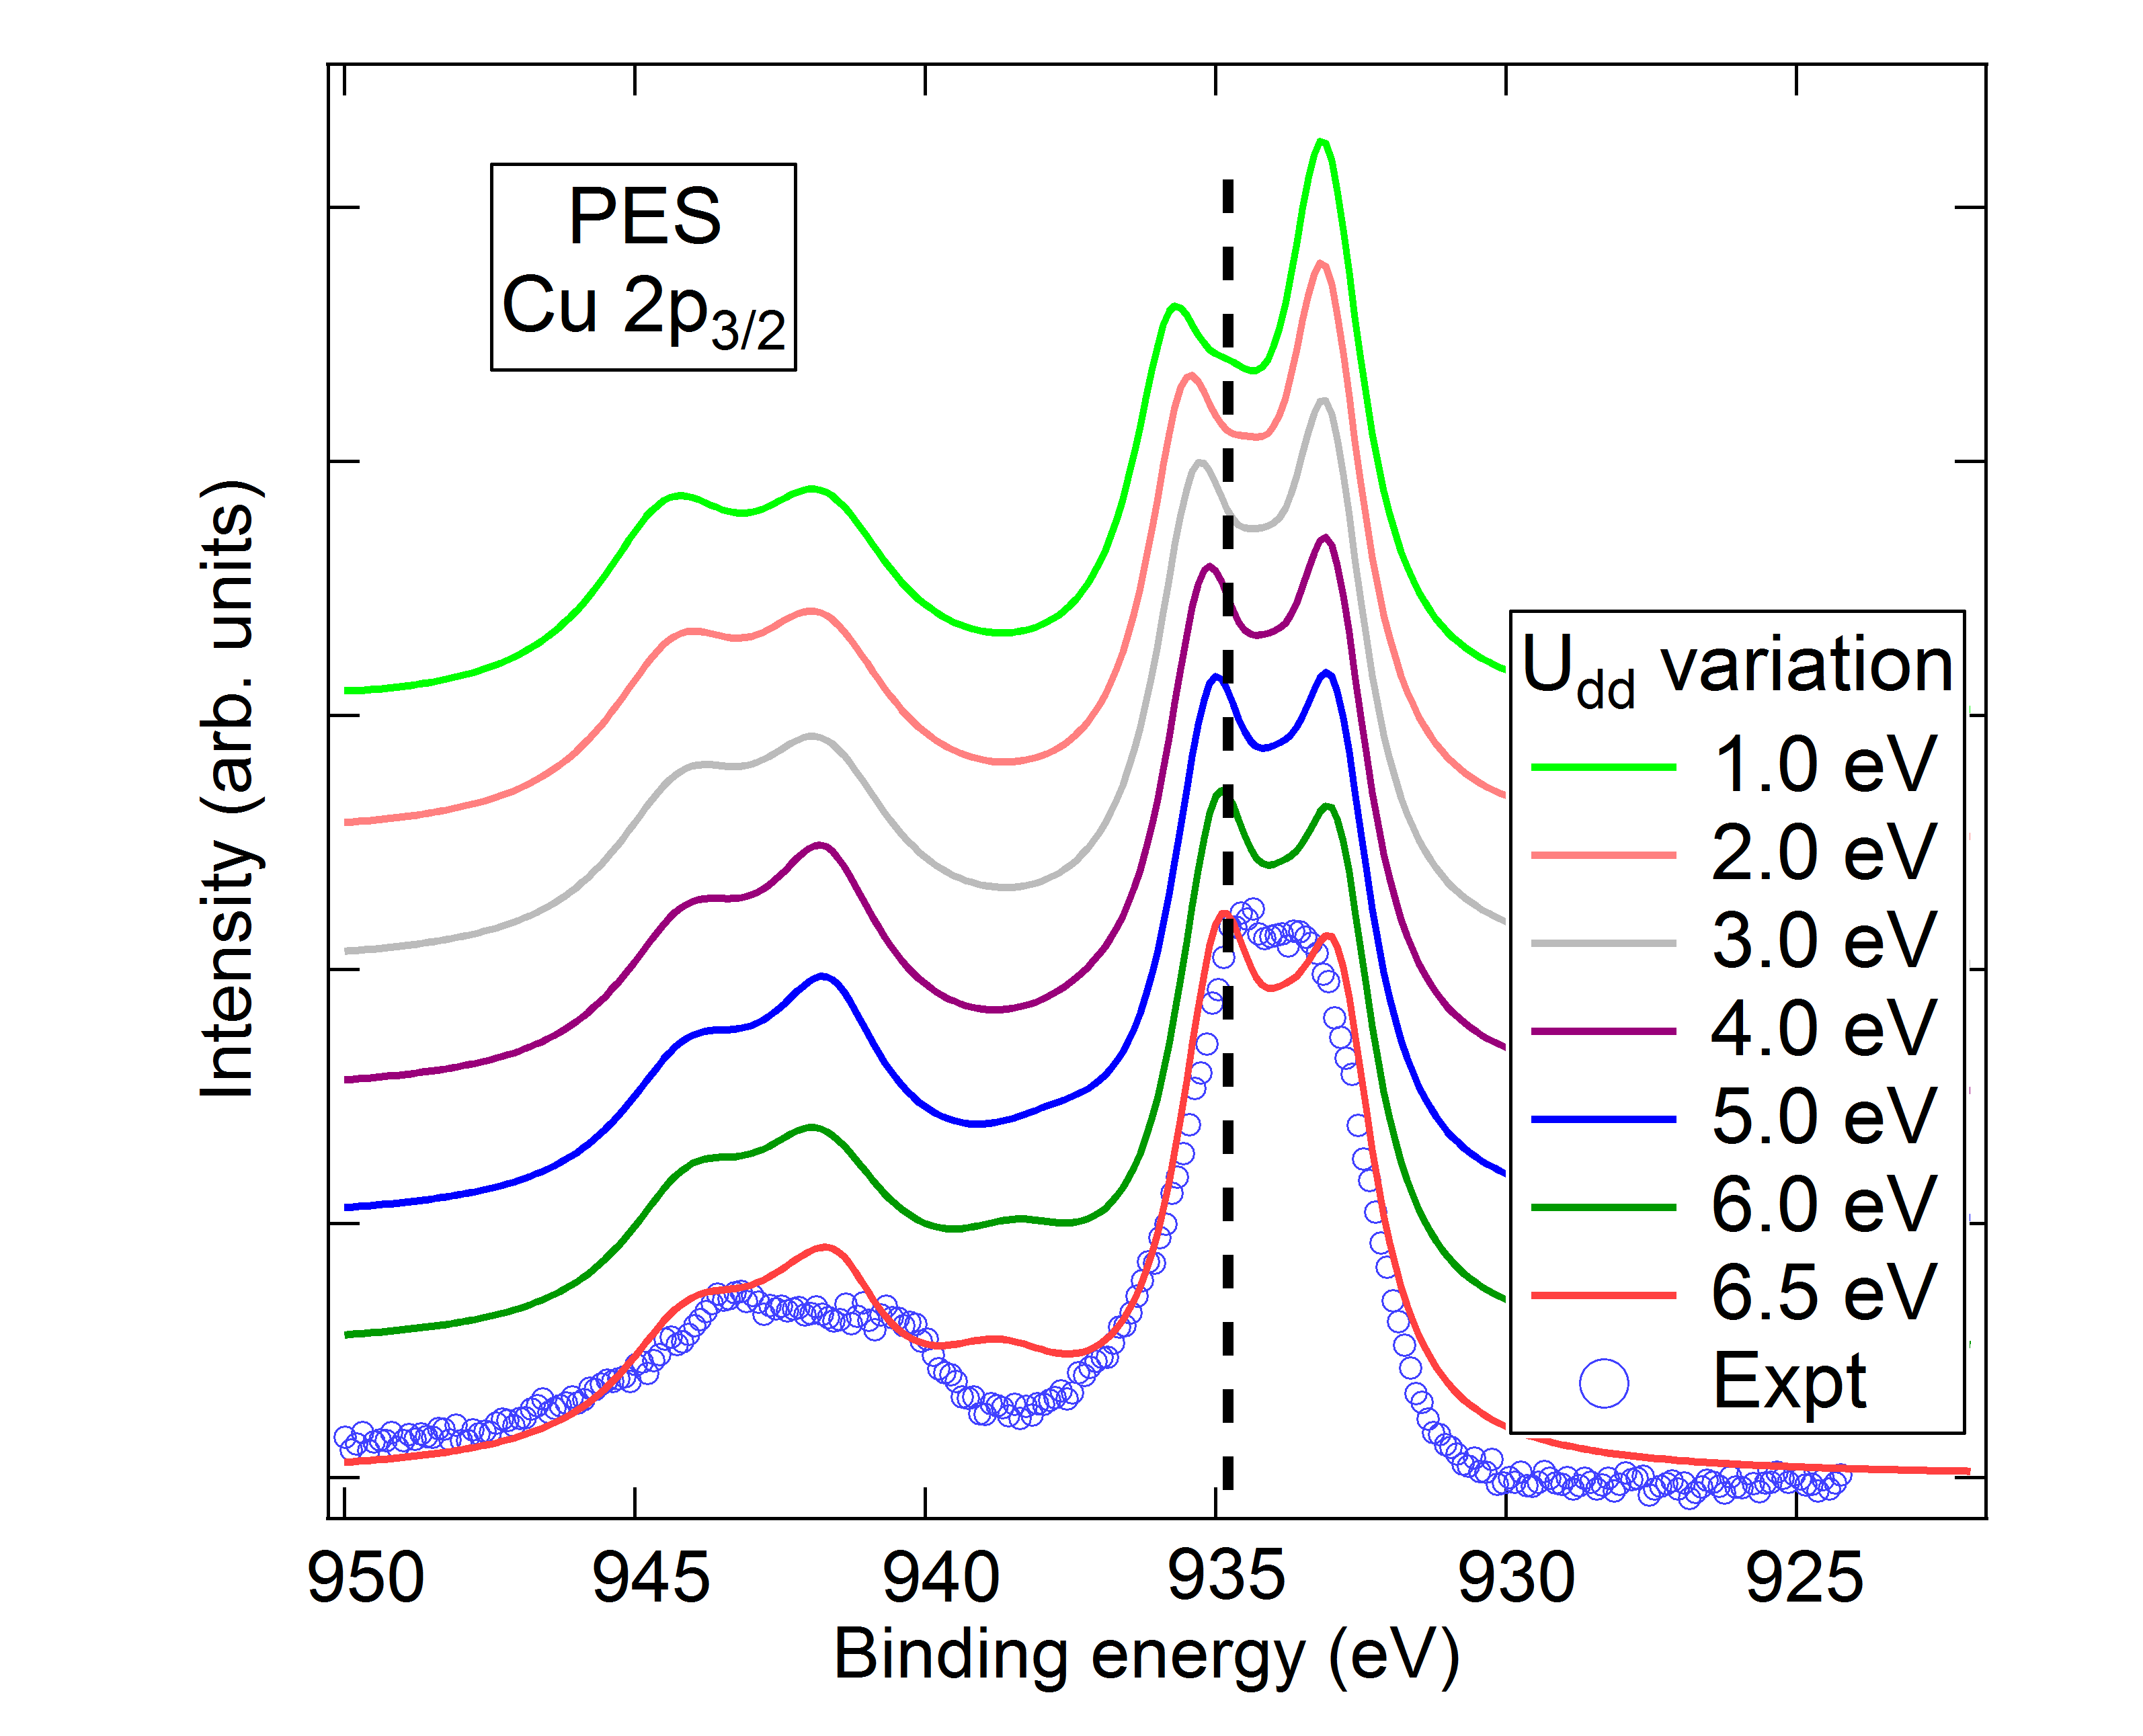
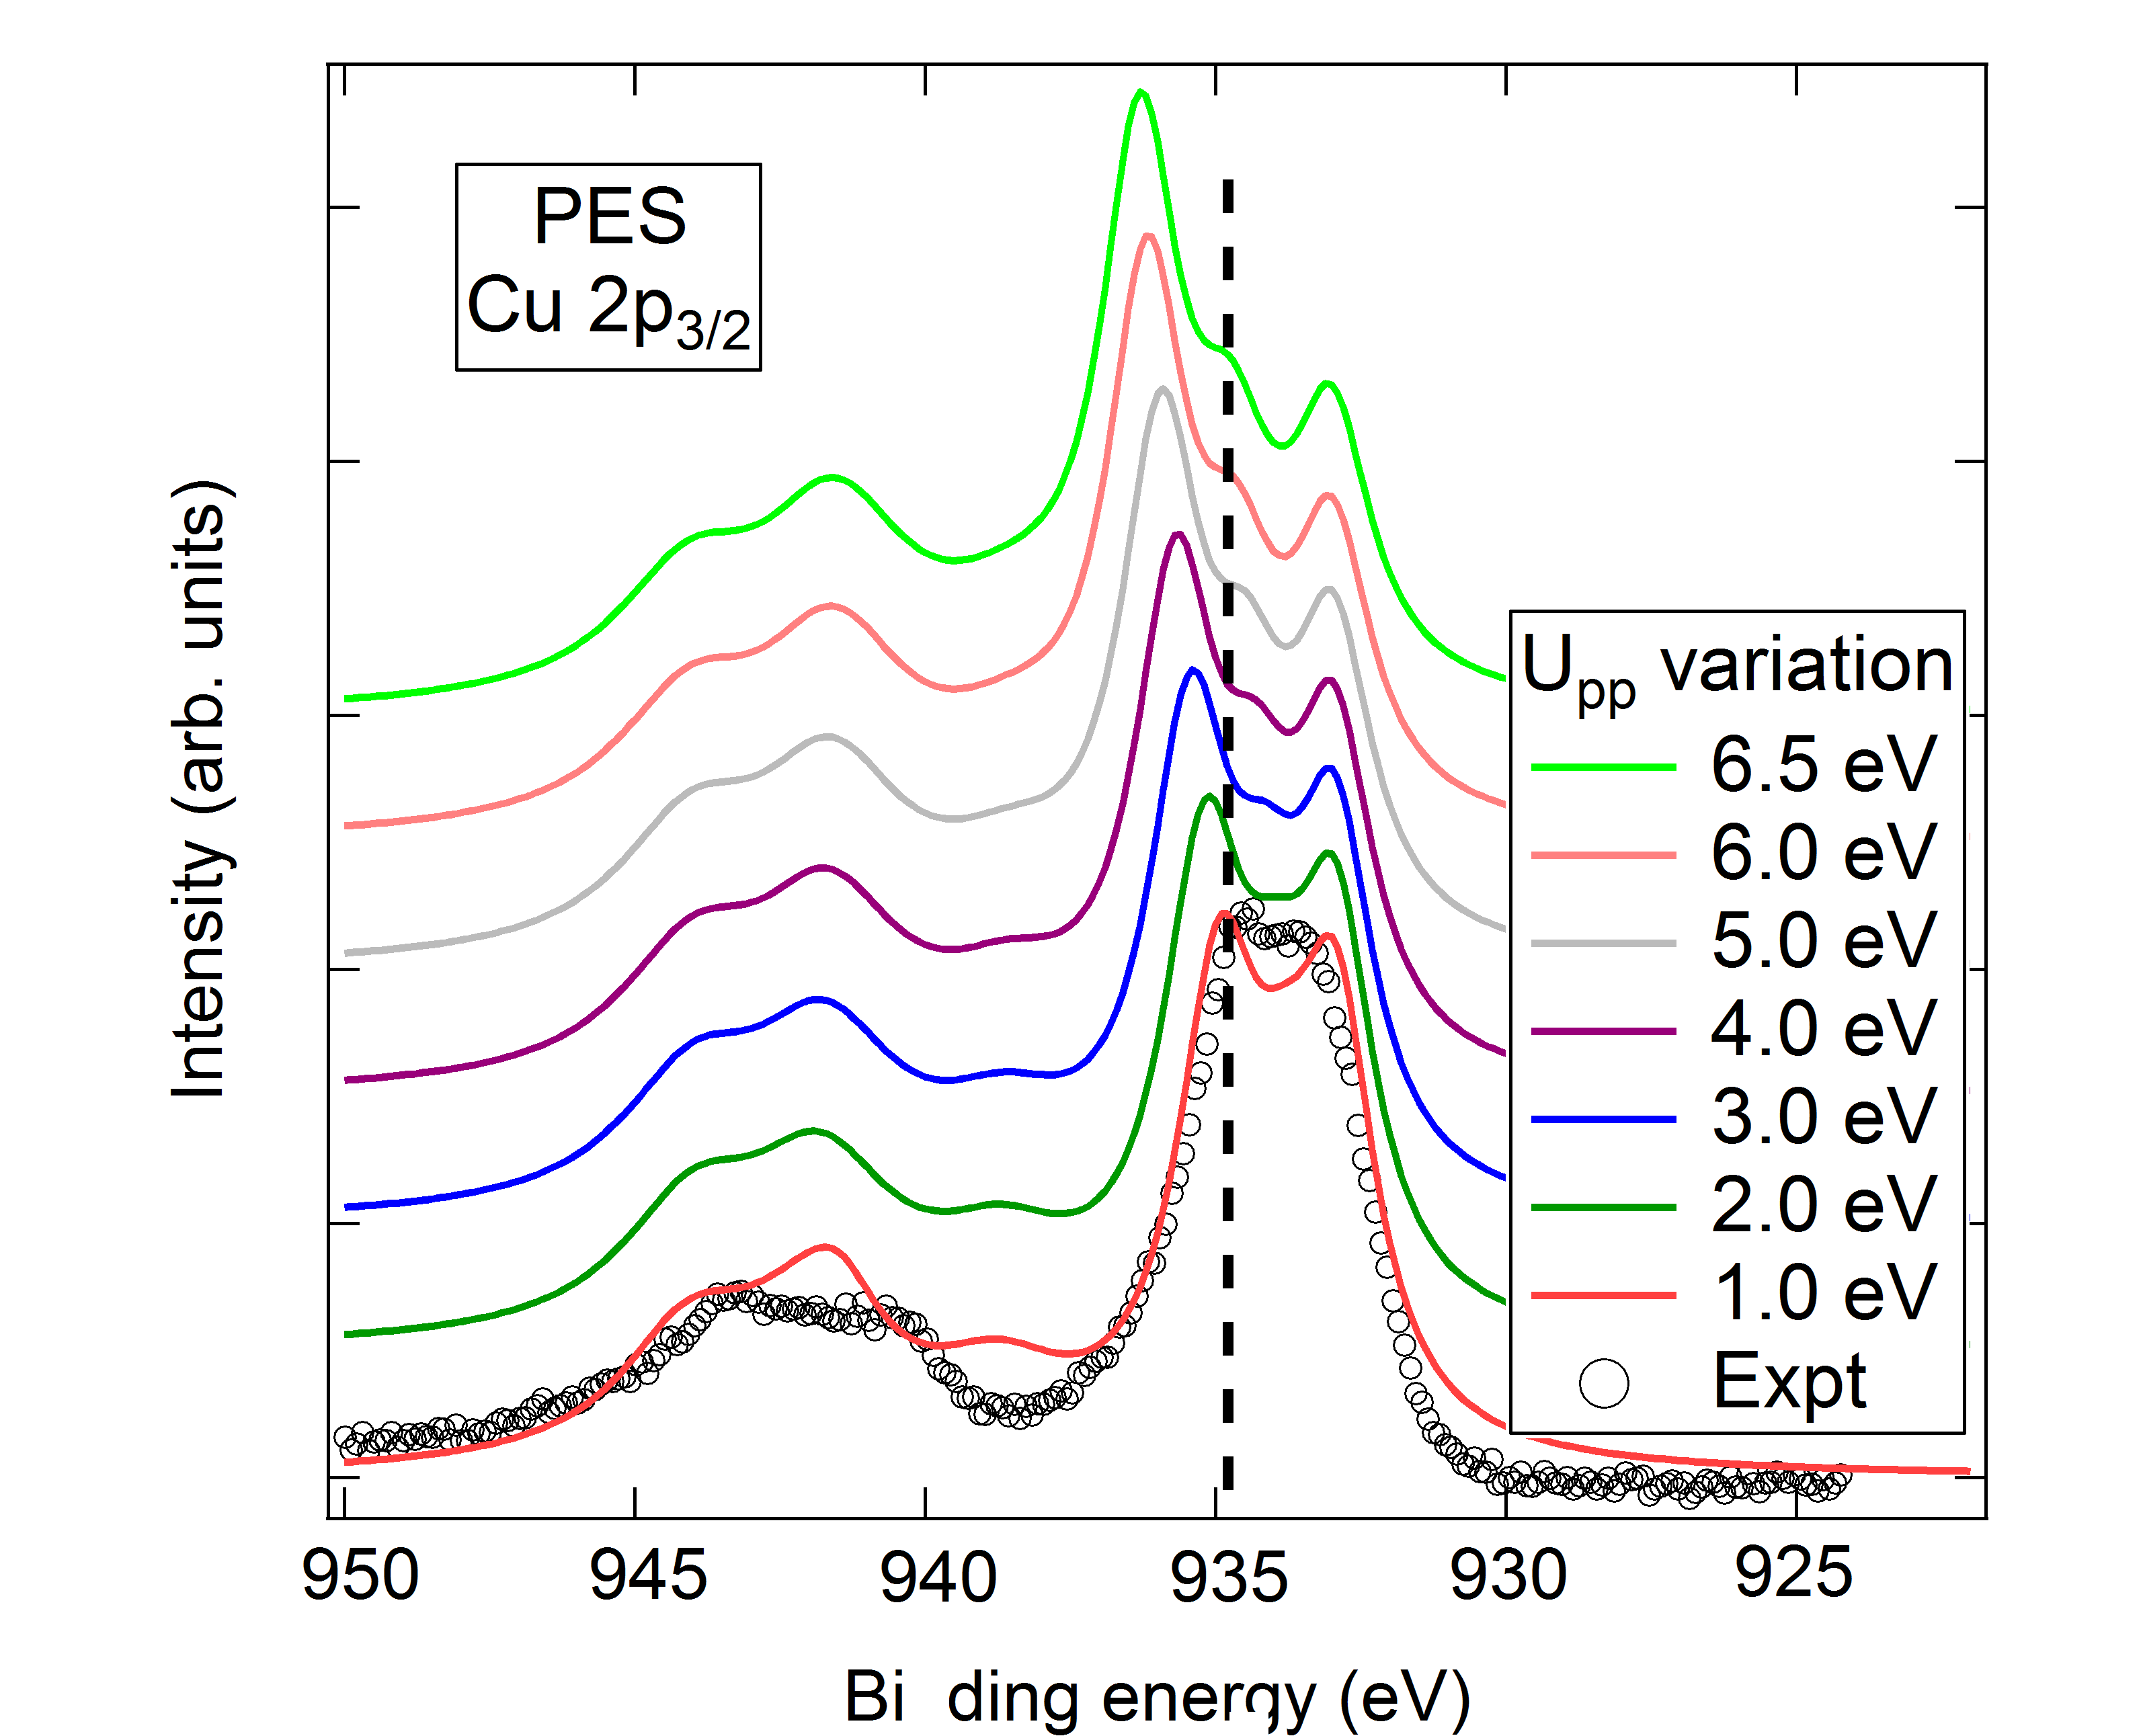
Fig. S7 shows the variation of the calculated Cu 2p3/2 X-ray photoemission spectra as a function of the on-site Udd, which was varied from the optimal value of Udd = 6.5 eV down to Udd = 1.0 eV, keeping all other parameters fixed. The calculations do not show much change down to a Udd value of 4 eV, but on reducing Udd further, the calculated spectra start showing deviations from the experimental Cu 2p spectrum of HgBa2Ca2Cu3O8+δ. In particular, for Udd 4 eV, the energy separation between the main peaks consisting of the dominantly local (BE = 934.5 eV) and non-local (BE (933.4 eV) screened states increase on decreasing Udd. Simultaneously, the intensity of the locally screened feature gets reduced compared to the non-locally screened feature. The ionic character satellites do not show much change for the entire range of Udd investigated here. This result indicates that Udd 4 eV is consistent with the data.
Fig. S8 shows the variation of the calculated Cu 2p X-ray photoemission spectra as a function of the on-site Upp, varied from 1 to 6.5 eV. In this case, the calculations start showing changes compared to the experimental spectra for Upp 3 eV. In particular, the energy separation between the main peaks consisting of the dominantly local ( BE = 934.5 eV) and non-local (BE = 933.4 eV) screened states smoothly increase on increasing Upp. Simultaneously, the intensity of the non-locally screened feature gets reduced compared to the locally screened feature. The ionic character satellites again show hardly any change for the range of Upp values investigated. This result indicates that Upp 3 eV is consistent with the data.
References
- (1) A. Yamamoto, N. Takeshita, C. Terakura, Y. Tokura, Nature Communications 6, 8990 (2015).
- (2) J. F. Moulder,W. F. Stickle, P. E. Sobol, and K. D. Bomben, Handbook of X-ray Photoelectron Spectroscopy (Physical Electronics, Eden Prairie, MN, 1995).
- (3) C. S. Gopinath, N. H. Hur and S. Subramanian, Phys. Rev. B 52, 9879 (1995).
- (4) F. Parmigiani and L. Sangaletti, J. Electron Spectrosc. Relat. Phenom. 98-99, 287 (1999).
- (5) C.O. Rodriguez, N.E. Christensen and E.L. Peltzer y Blanca, Physica C 216, 12 (1993).
- (6) M Cini, Solid State Communications 20, 605 (1976); 24, 681-684 (1977); Phys. Rev. B 17, 2788 (1978).
- (7) G. A. Sawatzky, Phys. Rev. Lett. 39, 504 (1977).
- (8) D. van der Marel, J. van Elp, G. A. Sawatzky, and D. Heitmann, Phys. Rev. B37, 5136 (1988).
- (9) A. Balzarotti, M. De Crescenzi, N. Motta, F. Patella, and A. Sgarlata, Phys. Rev. B 38, 6461 (1988).
- (10) L. H. Tjeng, C. T. Chen, and S-W. Cheong, Phys. Rev. B 45, 8205 (1992).
- (11) R. Bar-Deroma, J. Felsteiner, R. Brener, J. Ashkenazi and D. van der Marel Phys. Rev. B 45, 2361 (1992).
- (12) Y. Ishida, R. Eguchi, M. Matsunami, K. Horiba, M. Taguchi, A. Chainani, Y. Senba, H. Ohashi, H. Ohta, and S. Shin, Phys. Rev. Lett. 100, 056401 (2008).
- (13) G. A. Sawatzky and D. Post, Phys. Rev. B 20, 1546, (1979).
- (14) J.-H. Park, Ph.D. thesis, University of Michigan, 1994.
- (15) A. Chainani, M. Mathew and D. D. Sarma, Phys. Rev. B 46, 9976 (1992) ; ibid. 47, 15397 (1993) ; ibid. 48, 14818 (1994) ; A. Chainani, Ph. D. thesis, Indian Institute of Science, 1993.
- (16) D. D. Sarma and A. Chainani, Jl. Solid State Chem. 111, 208 (1994).
- (17) J. Ghijsen, L. H. Tjeng, J. van Elp, H. Eskes, J. Westerink, G. A. Sawatzky and M. T. Czyzyk, Phys. Rev. B 38, 11322 (1988).
- (18) M. A. van Veenendaal, H. Eskes, and G. A. Sawatzky, Phys. Rev. B 47, 11462 (1993). M. A. van Veenendaal and G. A. Sawatzky, Phys. Rev. B 49, 3473 (1994).
- (19) C. T. Chen, L. H. Tjeng, J. Kwo, H. L. Kao, P. Rudolf, F. Sette and R. M. Fleming, Phys. Rev. Lett. 68, 2543 (1992).
- (20) E. Pellegrin, J. Fink, C. T. Chen, Q. Xiong, Q. M. Lin, and C. W. Chu, Phys. Rev. B 53, 2767 (1996).
- (21) M. A. van Veenendaal, G. A. Sawatzky and W. A. Groen, Phys. Rev. B 49, 1407 (1994).
- (22) M. Taguchi, A. Chainani, K. Horiba, Y. Takata, M. Yabashi, K. Tamasaku, Y. Nishino, D. Miwa, T. Ishikawa, T. Takeuchi, K. Yamamoto, M. Matsunami, S. Shin, T. Yokoya, E. Ikenaga, K. Kobayashi, T. Mochiku, K. Hirata, J. Hori, K. Ishii, F. Nakamura, and T. Suzuki Phys. Rev. Lett. 95, 177002 (2005).
- (23) N. B. Brookes, G. Ghiringhelli, O. Tjernberg, L. H. Tjeng, T. Mizokawa, T.W. Li and A. A. Menovsky, Phys. Rev. Lett. 87, 237003 (2001) ; N.B. Brookes, G. Ghiringhelli, A.-M. Charvet, A. Fujimori, T. Kakeshita, H. Eisaki, S. Uchida, and T. Mizokawa, Phys. Rev. Lett. 115, 027002 (2015).