Results on Solar Physics from AMS-02
Abstract
AMS-02 is a wide acceptance high-energy physics experiment installed on the International Space Station in May 2011 and operating continuously since then. Using the largest number of detected particles in space of any space-borne experiment, it performs precision measurements of galactic cosmic rays fluxes. Detailed time variation studies of Protons, Heliums, Electron and Positron fluxes were presented. The low-rigidity range exhibits a decreasing general trend strongly related to the increase of solar activity, as well local decreases associated with strong solar events.
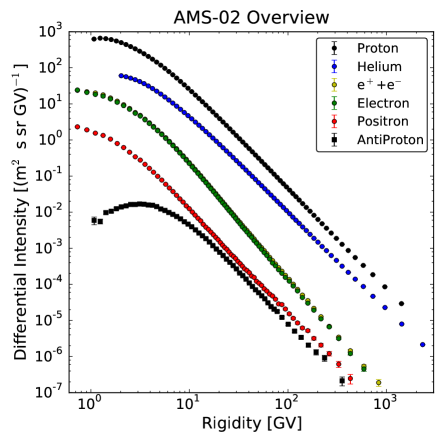
The Alpha Magnetic Spectrometer (AMS-02) was installed on the International Space Station (ISS) to measure cosmic rays with unprecedented accuracy. The long duration of mission, planned to conclude in 2024 with ISS mission, allows to cover almost a complete solar cycle from the ascending phase of this solar cycle 24, through its maximum, and the descending phase into the next solar minimum. Thanks to its large geometrical acceptance, 0.45 m2 sr, over 65 billion cosmic ray events have been recorded in the first 48 months of AMS operations 2016PhRvL.117i1103A . A collection of all AMS-02 available spectra is shown in Fig. 1 where black point are proton spectrum 2015PhRvL.114q1103A , blue points are helium 2015PhRvL.115u1101A , green point are electron 2014Aguilar , red points are positron 2014Aguilar ,yellow points represents e-+e+ 2014PhRvL.113v1102A (almost overlapped with electron flux) and finally black squares are antiproton 2016PhRvL.117i1103A
These data will allow deep studies of the Galactic Cosmic Ray (GCR) fluxes and their time evolution over an entire solar cycle enabling a better understanding of the so-called solar modulation effect. In this paper we reviewed the AMS-02 analysis for proton, helium, electron and positron. We presented the time variation of GCR flux during first 5 years of data taking with particular attention of range 1–30 GV. We explore long term effects on GCR flux with different charge and masses. Finally, short scale solar events are presented.
I AMS-02 detector
The AMS-02 is a general purpose particle physics detector, operating in space since May 2011. It will achieve a unique long duration mission, aiming at performing antimatter and dark matter searches, as well as cosmic ray composition and flux measurements in the rigidity range from 1 GV to a few TV, where rigidity is the momentum divided by the charge. The experiment is installed on-board the ISS, located at an average altitude of about 400 Km from Earth surface, thus over the atmosphere but inside the geomagnetic field.
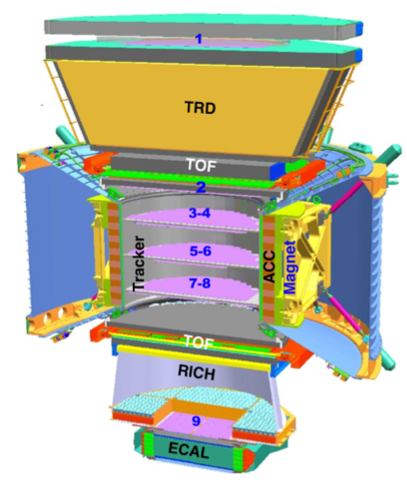
In order to distinguish between different species of particles, AMS-02 is made of 5 sub-detectors which are described in detailed in Ref 2013PhRvL.110n1102A . From top to bottom (see Fig. 2) the detector is composed of a transition radiation detector (TRD), a time of flight system (TOF), nine planes of precision silicon tracker surrounded by a permanent magnet, an array of anti-coincidence counters (ACC), a ring imaging C̆erenkov detector (RICH), and an electromagnetic calorimeter (ECAL).
The tracker accurately determines the trajectory and absolute charge (Z) of cosmic rays by multiple measurements of the coordinates and energy loss. It is composed of 192 ladders, each containing double-sided silicon sensors, readout electronics, and mechanical support 2010NIMPA.613..207A ; 2011Tracker . Three planes of aluminum honeycomb with carbon fiber skins are equipped with ladders on both sides of the plane. These double planes are numbered 3–8 (see Fig. 2). Another three planes are equipped with one layer of silicon ladders. As indicated in Fig. 2, plane 1 is located on top of the TRD, plane 2 is above the magnet, and plane 9 is between the RICH and the ECAL. Plane 9 covers the ECAL acceptance. Planes 2–8 constitute the inner tracker. Coordinate resolution of each plane is measured to be better than 10 m in the bending direction, and the charge resolution is at Z=1. The total lever arm of the tracker from plane 1 to plane 9 is 3.0 m. Positions of the planes of the inner tracker are held stable by a special carbon fiber structure 2002Tracker . It is monitored by using 20 IR laser beams which penetrate through all planes of the inner tracker and provide micron-level accuracy position measurements. The positions of planes 1 and 9 are aligned by using cosmic ray protons such that they are stable to 3 m (see, e.g., Figure 2 in Ref. 2013PhRvL.110n1102A ). Together with the tracker, the magnet provides a maximum detectable rigidity of 2 TV on average, over tracker planes 1–9.
The TRD is designed to use transition radiation to distinguish between and protons, and to independently identify nuclei (2006TRD, ). It consists of 5 248 proportional tubes of 6 mm diameter with a maximum length of 2 m arranged side by side in 16-tube modules. The 328 modules are mounted in 20 layers. Each layer is interleaved with a 20 mm thick fiber fleece radiator with a density of 0.06 g/cm3. The tubes are filled with a 90:10 Xe:CO2 mixture. The on-board gas supplies contained, at launch, 49 kg of Xe and 5 kg of CO2 which ensures 30 years of steady TRD operations in space. In order to differentiate between and protons, signals from the 20 layers are combined in a TRD estimator formed from the ratio of the log-likelihood probability of the hypothesis to that of the proton hypothesis. Positrons and electrons have a TRD estimator value and protons . This allows the efficient discrimination of the proton background.
Two planes of TOF counters are located above and two planes below the magnet (2013ToF, ; 2014NIMPA.743…22B, ). Each plane contains eight or ten scintillating paddles. Each paddle is equipped with two or three photomultiplier tubes on each end for efficient detection of traversing particles. The coincidence of signals from all four planes provides a charged particle trigger. The TOF charge resolution, obtained from multiple measurements of the ionization energy loss, is at . The average time resolution of each counter has been measured to be 160 ps, and the overall velocity (c) resolution of the system has been measured to be 4% for and particles, which also discriminates between upward- and downward-going particles. The timing resolution improves with increasing magnitude of the charge to a limit of ps and % for particles.
The ACC surround the inner tracker inside the magnet bore 2009ACC . Their purpose is to detect events with unwanted particles that enter or leave the inner tracker volume transversely. The ACC consists of sixteen curved scintillator panels of 0.8 m length, instrumented with wavelength-shifting fibers to collect the light. Long duration tests of the counters show they have an efficiency close to 0.999 99.
The RICH is designed to measure the magnitude of the charge of cosmic rays and their velocities with a precision of 2010Aguilar . It consists of two non-overlapping dielectric radiators, one in the center with a refractive index of , corresponding to a C̆erenkov threshold of , surrounded by a radiator with , with a threshold of .
The ECAL consists of a multilayer sandwich of 98 lead foils and scintillating fibers with an active area of mm2 and a thickness of 166.5 mm corresponding to 17 radiation lengths 2012Rosie . The calorimeter is composed of nine superlayers, each 18.5 mm thick and made of 11 grooved, 1 mm thick lead foils interleaved with ten layers of 1 mm diameter scintillating fibers (the last foil of the last superlayer is made of aluminum). In each superlayer, the fibers run in one direction only. The 3D imaging capability of the detector is obtained by stacking alternate superlayers with fibers parallel to the x and y axes (five and four superlayers, respectively). In order to cleanly identify electrons and positrons, an ECAL estimator, based on a boosted decision tree algorithm, is constructed by using the 3D shower shape in the ECAL.
There are three main detectors that allow a significant reduction of the proton background in the identification of the positron and electron samples. These are the TRD (above the magnet), the ECAL (below the magnet), and the tracker. The TRD and the ECAL are separated by the magnet and the tracker. This ensures that secondary particles produced in the TRD and the upper TOF planes are swept away and do not enter into the ECAL. Events with large angle scattering are also rejected by a quality cut on the measurement of the trajectory using the tracker. The matching of the ECAL energy and the momentum measured with the tracker greatly improves the proton rejection. The proton rejection power of the TRD estimator at 90% efficiency measured on orbit is . The proton rejection power of the ECAL estimator when combined with the energy-momentum matching requirement reaches . The performance of both the TRD and ECAL estimators are derived from data taken on the ISS. Note that the proton rejection power can be readily improved by tightening the selection criteria with reduced efficiency.
II Flux Measurement and Analysis
In this work the AMS-02 data collected during first 5 years of AMS-02 operations are analyzed. The isotropic flux of GCRs in each Rigidity bin (expressed in GV), of width , is given by 2015PhRvL.114q1103A :
| (1) |
where is the number of identified particles with rigidity between R and , is the effective acceptance, is the exposure time. The effective data collection time i.e. exposure time, is measured by requiring that AMS-02 is in the nominal data taking status, the detector pointing direction is within 40∘ of the Earth zenith axis, and the ISS is orbiting outside the South Atlantic Anomaly. Each GCR species was analyzed by independent groups with the aims to reduce systematic uncertainties. The integratedflux for each species can be found in Ref. 2015PhRvL.114q1103A ; 2015PhRvL.115u1101A ; 2014Aguilar ; 2014PhRvL.113v1102A ; 2016PhRvL.117i1103A and are reported in Fig. 1.
II.1 Proton Analysis
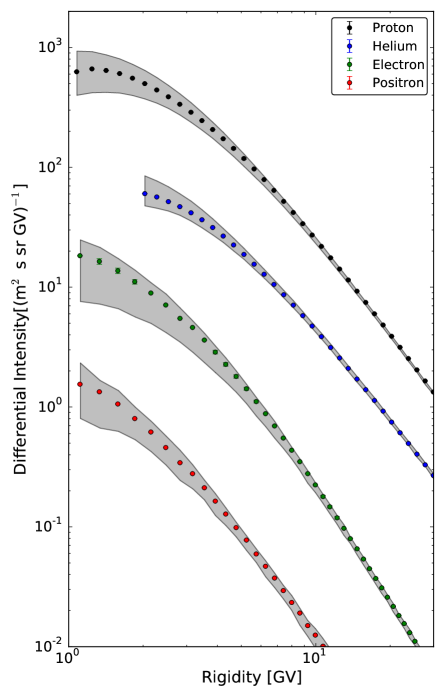
The proton sample is selected by requiring a downward going event with measured . The charge measurement must be consistent with a charge one particle, , along the full particle trajectory. The measured rigidity must be positive and above the International Geomagnetic Reference Field (IGRF2010IGRF ) cutoff according to the maximum value in the AMS-02 field of view. To eliminate further contamination of secondary particles coming from the penumbra region, an additional 1.2 safe factor was applied to the IGRF cutoff. To remove events with large scattering and to further clean the data sample, additional track fitting requirements on the in the bending coordinate were included. Finally a cut on the combined TOF and tracker mass measurement ( GeV/c2) was applied to suppress the small contamination of secondary pions produced in the upper part of the detector. Protons are the most abundant species of GCRs, so the residual background from other particles is very low. Deuterons are not removed in this analysis: their contamination is less than 2% at 1 GV and decreases with increasing rigidity (0.6% at 20 GV). Contamination from interacting nuclei () at the top of AMS-02 (layer 1 or TRD) is 0.5% at 1 GV and becomes negligible with increasing rigidity. Positron and electron contamination is less than 0.1% at all rigidities. All detector efficiencies have been extensively studied and validated with ISS data. The trigger efficiency indeed is directly measured from ISS data by the use of a prescaled (1%) unbiased trigger sample with no ACC requirement and a coincidence of at least 3 out of the 4 TOF layers. The number of events was corrected with the rigidity resolution function to account for the bin-to-bin migration, i.e. unfolding procedure. Two unfolding procedures were used to crosscheck the result: the so called folded acceptance and the forward unfolding technique whose details are described in Ref. 1983Unfolding and Ref. 2007Unfolding respectively. The small difference between the two methods (less than 0.5%) is accounted into the systematic errors. The systematic errors have been extensively studied and a detailed description is given in Ref. 2015PhRvL.114q1103A . The order of magnitude of the systematic errors in the rigidity range from 1 GV to 10 GV is summarized here. One source of systematic errors comes from the uncertainties on the trigger efficiency due to the reduced statistics of the prescaled unbiased sample: this systematic is very low (%) below 10 GV. Another source of systematic errors comes from the data to MC corrections that have to be applied to the acceptance: these corrections dominate our systematics at low rigidities being about 5% at 1 GV and decreasing below 2% at 10 GV. In addition, the acceptance suffers from the uncertainties on the model estimation of the inelastic cross sections. The total systematic on this latter was estimated to be about 1% at 1 GV and decreases to 0.6% at 10 GV. Finally the uncertainty on the rigidity scale resolution function, which is coming from a residual tracker misalignment and from the magnetic field map measurement, was found to be less than 1% below 10 GV. To compute fluxes each bartel rotation, additional analysis were performed to verify the detector stability versus time. The daily trigger and both inner and full span tracker efficiencies in the rigidity range from 1 GV to 10 GV, was showed in Figure 2 of Ref. 2015ICRC_Consolandi . The trigger efficiency remained stable over time during all the period of operations. The inner and full span tracker efficiencies increased on July 21st, 2011 due to the improvement of the tracker calibration and had a drop on December 1st, 2011 due to the loss of 3% tracker readout channels in the non-bending coordinates. The detector acceptance and all the efficiencies were calculated for each month to obtain the monthly fluxes. The monthly proton flux above 45 GV shows no observable effects related to the solar modulation and remained stable for this measurement period as reported in Ref. 2015PhRvL.114q1103A . In Fig. 3 the integrated flux presented in Ref. 2015PhRvL.114q1103A (black round) is showed with the total flux variation of proton for the considered period as the gray band.
II.2 Helium analysis
Helium sample was selected requiring to be downward going and to have a reconstructed track in the inner tracker with charge compatible with Z=2. In order to have the best resolution at the highest rigidities, further selections are made by requiring the track to pass through L1 and L9 and to satisfy additional track fitting quality criteria such as a cut in the bending coordinate. To remove the helium candidates which interacted within the detector, were used additional requirements on the charge as measured by each of L1, the upper TOF, the lower TOF, and L9. To select only primary cosmic rays, the measured rigidity is required to be greater than a factor of 1.2 times the maximum geomagnetic cutoff within the AMS field of view. Because of the multiple independent measurements of the charge, the selected sample contains only a small contamination of particles which had Z2 at the top of the AMS. Comparing the proton and helium charge distributions in the inner tracker, the proton contamination of the helium sample was measured to be less than over the entire rigidity range. The sample also contains helium from other nuclei which interact at the top of the AMS (for example, in L1), this contribution is below for the entire rigidity range. The background contributions are subtracted from the flux and the uncertainties are accounted for in the systematic errors. The trigger efficiency was measured to range from 95% to 99.5%, where the inefficiency is mostly due to secondary rays produced by He in the tracker materials and which then entered the ACC. The bin-to-bin migration of events was corrected using the two unfolding procedures used in the proton analysis. Extensive studies, reported in 2015PhRvL.115u1101A , were made for the systematic errors. These errors include the uncertainties in the trigger efficiency, the geomagnetic cutoff factor, the acceptance taking into account the event selection and reconstruction and also accounting for helium interactions in the detector, the unfolding, the rigidity resolution function, the absolute rigidity scale, and the negligible background contamination discussed above. In Fig. 3 the integrated flux presented in Ref. 2015PhRvL.115u1101A (blue round) is showed with the total flux variation for the considered period as the gray band.
II.3 Lepton analys
The measurement of the separate fluxes of electrons and positrons is needed for a deeper understanding of the positron fraction measurement reported in Ref. 2014PhRvL.113l1101A . The isotropic flux of cosmic rays electrons and positrons in each energy bin , of width , is given by 2014Aguilar :
| (2) |
where is the number of electrons or positrons with energy between E and , is the effective acceptance, is the exposure time. The effective acceptance is the product of the detector geometric acceptance ( 500 cm2 sr) and the selection efficiency, estimated with simulated events and validated with a pure sample of electron events identified in the data. The trigger efficiency is 100% above few GeV, and it is estimated using minimum bias triggered events. The exposure time is evaluated as a function of energy and it takes into account the lifetime of the experiment which depends on its orbit location and on the geomagnetic cutoff. To identify downward-going particles of charge one, cuts are applied on the velocity measured by the TOF and on the charge reconstructed by the tracker, the upper TOF planes, and the TRD. To reject positrons and electrons produced by the interaction of primary cosmic rays with the atmosphere, the minimum energy within the bin is required to exceed 1.2 times the geomagnetic cutoff. Over a sample of well reconstructed particles with one shower in the ECAL and one track in the TRD and in the tracker, the identification of signal events is performed applying an additional cut on E/p, followed by a fixed cut in the ECAL estimator to further reduce the proton background. The number of signal and background event is estimated for each energy bin performing a template fit procedure. The energy resolution of the ECAL is below 2% at energies higher than 80 GeV 2013Adloff and the absolute energy scale is verified by using minimum ionising particles and the ratio between the energy, measured by the ECAL, and the momentum, measured by the tracker. These results are compared with the Test Beam values where the beam en- ergy is known to high precision. Between 10 and 290 GeV (Test Beam energies), the uncertainty on the absolute scale is , while it is 4% up to 700 GeV. The statistical error dominates above 50 GeV in the measurement of positrons, while the systematic and statistical errors are comparable for electrons, above 200 GeV (see table 1 in Ref.2014Aguilar ). In Fig. 3 the integrated flux presented in Ref. 2014Aguilar for electron (green points) and positron (red points) are showed with the total flux variation for the considered period as the gray band.
.
III Helium over Proton Ratio
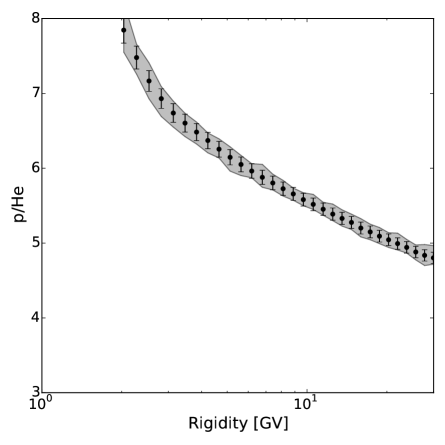
The overall variation of protons and helium is shown in Fig. 3. During the first five year of operation the flux decreased down to 50% with respect the first month. AMS-02 operates along the solar maximum of solar cycle 24 and observed the maximum of solar activity in 2014, i.e. the minimum of the flux. After that, GCR flux of both proton and helium rise again. In Fig. 4 we report the ratio of integrated proton and helium flux as presented in Ref. 2015PhRvL.115u1101A compared with the overall variation along the five year of AMS operation represente as gray bands. It is possible to note as the overall variation is compatible with the experimental uncertainties of integrated flux. Thus, the helium over proton flux ratio evaluated for same rigidity bin is time independent. It is important to note that helium has double charge and four time the mass of proton. The evidence of time independence of p/He suggest that the propagation process scale with rigidity.
IV Electron over Proton Ratio
The overall variation of electrons and positrons fluxes are shown in Fig. 3. Although, since 2011, both electron and positron flux decreased down to 50% with respect the first month, positrons and electrons fluxes shown different time evolution after the peak of solar activity. The minimum of electron flux was delayed of more than 12 month with respect positron. As a consequence, the positron fraction – that, as reported in Ref. 2014PhRvL.113l1101A , was stable in time during the first 2 year of AMS-02 operation – from second half of 2013 start to slowly change toward results compatible with the one measured by AMS-01 2002PhR…366..331A in 1998. The same is observed comparing protons and electron fluxes, while protons and positrons seems to follow the same time evolution. This indicates a charge sign dependent effect, that is negligible before 2013 and becomes important moving towards solar minimum.
V Solar Energetic Particles
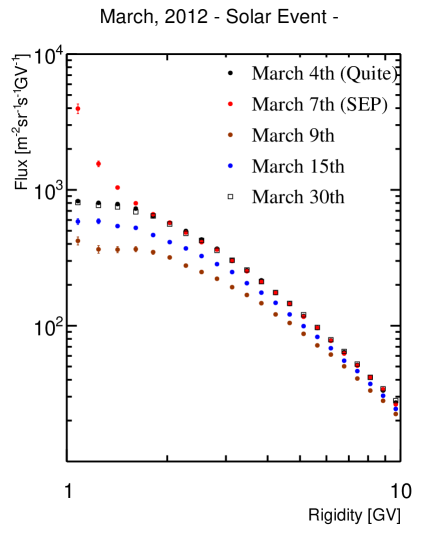
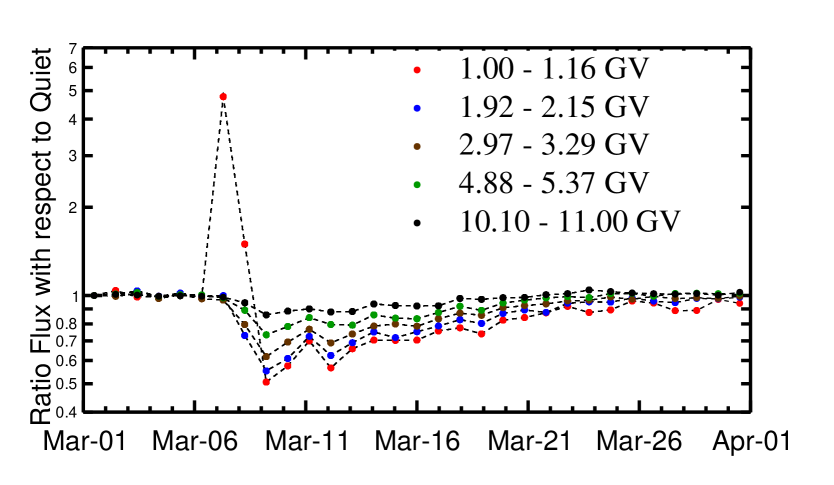
In addition to this overall modulation effect, shorter timescale fluctuations are observed. These are related to solar impulsive events. Sharp increase of AMS low energy flux are associated to Solar Energetic Particles (SEP) penetrating the Earth magnetic field. A decrease in AMS low energy flux, that last for few days, is usually labeled as Forbush Decrease (FD). A partial list of events that were observed by AMS-02 detector can be found in Ref. 2015ICRC_Bindi . For this analysis the computed geomagnetic cutoff should be modified accounting for the external geomagnetic field that is perturbed by the solar event. The proper geomagnetic cutoff used for this analysis was discussed in GrandiICRC . As representative example the solar event of March 7th, 2012 is showed in Figs. 5–6. This was one of the most intense events of solar cycle 24 and was correlated with two solar flares of classes X5.4 and X1.3 respectively and two fast Coronal Mass Ejections (CME). The time evolution of the daily proton flux observed by AMS-02 during the March 2012 month is displayed in Fig. 6 where the flux is normalized to the first day of the month at different rigidity bins. From March 1st until March 6th the daily flux was stable at all rigidities. At March 7th, the increase in the lowest rigidity bin indicates the arrival of SEP. Forbush decrease, that was measured during the following days, even in the higher rigidity bins, had its maximum on March 9th. After this GCR minimum, the flux gradually recovered to nominal conditions within about 20 days.
VI Conclusion
In this work, we reviewed the AMS-02 GCR fluxes time evolution along the first 5 years of operation and the contribution of AMS-02 detector to Solar Physics. The overall flux behavior consist in a first phase of decreasing and a second part of increasing that is consistent with the solar activity cycle that show his maximum peak during the AMS operation. The minimum of the flux is the same for proton, helium and positron, while electron has minimum of the flux more then 12 month later.
The study of time evolution ratio between different species shown a clear charge sign dependent effect after the solar maximum, that can be explained as a transition of an opposite heliospheric magnetic field polarity. Particle with same charge sign show the same time evolution for the same rigidity bin. This leads to the conclusion that GCR propagation in the heliosphere, for the considered period, is a rigidity dependent process.
Finally to the solar modulation effect, shorter timescale variations of the GCR spectra were observed due to impulsive solar events. Since AMS-02 will be taking data on the ISS for more than a decade, these and future data will allow deeper studies of GCR fluxes and their time evolution over an entire solar cycle, enabling a better understanding of the solar modulation effect and of the shorter timescale solar activity.
Acknowledgements.
This work is supported by ASI (Agenzia Spaziale Italiana) under contract ASI-INFN I/002/13/0.References
- (1) Aguilar, M., Ali Cavasonza, L., Alpat, B., et al. Physical Review Letters, Vol.117, id.091103, 2016.
- (2) Aguilar, M., Alberti, G., Alpat, B., et al., Physical Review Letters, Vol.110, id.141102, 2013.
- (3) Alpat, B., Ambrosi, G., Azzarello, P., et al., Nuclear Instruments and Methods in Physics Research A, 613, 207, 2010.
- (4) K. Luebelsmeyer et al., Nucl. Instrum. Methods Phys. Res., Sect. A 654, 639, 2011.
- (5) M. Aguilar et al., Phys. Rep. 366, 331, 2002.
- (6) Doetinchem, Ph. et al., Nucl. Instrum. Methods Phys. Res., Sect. A 558, 526, 2006.
- (7) A. Basili, V. Bindi, D. Casadei, G. Castellini, A. Contin, A. Kounine, M. Lolli, F. Palmonari, and L. Quadrani, Nucl. Instrum. Methods Phys. Res., Sect. A 707, 99, 2013.
- (8) Bindi, V., Chen, G. M., Chen, H. S., et al., Nuclear Instruments and Methods in Physics Research A, 743, 22, 2014.
- (9) Ph. von Doetinchem, W. Karpinski, Th. Kirn, K. Lübelsmeyer, St. Schael, and M. Wlochal, Nucl. Phys. B, Proc. Suppl. 197, 15 (2009).
- (10) M. Aguilar-Benitez et al., Nucl. Instrum. Methods Phys. Res., Sect. A 614, 237 (2010);
- (11) S. Rosier-Lees et al., J. Phys. Conf. Ser. 404, 012034 (2012)
- (12) Aguilar, M., Aisa, D., Alpat, B., et al., Physical Review Letters, Vol.114, id.171103, 2015.
- (13) C. C. Finlay et al., Geophys. J. Int. 183, 1216 (2010).
- (14) G. D’Agostini, Nucl. Inst. Methods Phys. Res., Sect. A, 362, 487 (1995); V. Blobel, Report DESY-84-118 (1984); A. Kondor, Nucl. Inst. Methods Phys. Res., 216, 177 (1983).
- (15) J. Albert et al.,Nucl. Inst. Methods Phys. Res., Sect. A 583, 494 (2007).
- (16) Consolandi, C. PoS(ICRC2015)117, 2015
- (17) Aguilar, M., Aisa, D., Alpat, B., et al., Physical Review Letters, 115, 211101, 2015.
- (18) M. Aguilar et al, Phys. Rev. Lett. 113 121102 (2014)
- (19) C. Adloff et al, Nucl. Instr. Meth. A 714 (2013) 147- 154
- (20) Aguilar, M., Aisa, D., Alpat, B., et al., Physical Review Letters, 113, 221102, 2014
- (21) Accardo, L., Aguilar, M., Aisa, D., et al. Physical Review Letters, 113, 121101, 2014
- (22) Aguilar, M., Alcaraz, J., et al., Phys. Report, Vol. 366(6), pp. 331, 2002
- (23) Bindi, V., PoS(ICRC2015)108, 2015
- (24) Grandi, D., Bertucci, B., Boschini, M., PoS(ICRC2015)116, 2015