Tradeoffs between microbial growth phases lead to frequency-dependent and non-transitive selection
Abstract
Mutations in a microbial population can increase the frequency of a genotype not only by increasing its exponential growth rate, but also by decreasing its lag time or adjusting the yield (resource efficiency). The contribution of multiple life-history traits to selection is a critical question for evolutionary biology as we seek to predict the evolutionary fates of mutations. Here we use a model of microbial growth to show there are two distinct components of selection corresponding to the growth and lag phases, while the yield modulates their relative importance. The model predicts rich population dynamics when there are tradeoffs between phases: multiple strains can coexist or exhibit bistability due to frequency-dependent selection, and strains can engage in rock-paper-scissors interactions due to non-transitive selection. We characterize the environmental conditions and patterns of traits necessary to realize these phenomena, which we show to be readily accessible to experiments. Our results provide a theoretical framework for analyzing high-throughput measurements of microbial growth traits, especially interpreting the pleiotropy and correlations between traits across mutants. This work also highlights the need for more comprehensive measurements of selection in simple microbial systems, where the concept of an ordinary fitness landscape breaks down.
I Introduction
The life history of most organisms is described by multiple traits, such as fecundity, generation time, resource efficiency, and survival probability Orr2009 . While all of these traits may contribute to the long-term fate of a lineage, it is often not obvious how selection optimizes all of them simultaneously, especially if there are tradeoffs McGill2006 ; Warmflash2012 . The comparatively simple life histories of single-celled microbes make them a convenient system to study this problem. Microbial cells typically undergo a lag phase while adjusting to a new environment, followed by a phase of exponential growth, and finally a saturation or stationary phase when resources are depleted. Covariation in traits for these phases appears to be pervasive in microbial populations. Experimental evolution of E. coli produced wide variation of growth traits both between and within populations Vasi1994 ; Novak2006 , while naturally-evolved populations of yeast showed similarly broad variation across a large number of environments Warringer2011 . Covariation in growth traits appears to also be important in populations adapting to antibiotics Fitzsimmons2010 ; Fridman2014 ; RedingRoman2017 ; LevinReisman2017 . Even single mutations have been found to be pleiotropic, generating variation in multiple phases Fitzsimmons2010 ; Adkar2017 .
Previous work has focused mainly on the possibility of tradeoffs between these traits, especially between exponential growth rate and yield (resource efficiency) in the context of / selection Luckinbill1978 ; Velicer1999 ; Reznick2002 ; Novak2006 ; Fitzsimmons2010 ; Jasmin2012a ; Jasmin2012b ; Bachmann2013 , as well as between growth rates at low and high concentrations of a resource Levin1972 ; Stewart1973 ; Turner1996 ; Smith2011 . However, new methods for high-throughput phenotyping of microbial populations have recently been developed to generate large data sets of growth traits Zackrisson2016 , measuring growth rates, lag times, and yields for hundreds or thousands of strains across environmental conditions Warringer2011 . Some methods can even measure these traits for populations starting from single cells LevinReisman2010 ; Ziv2013 . This data requires a quantitative framework to interpret observed patterns of covariation in an evolutionary context. For example, while growth tradeoffs have previously been proposed to cause coexistence of multiple strains Stewart1973 ; Smith2011 , we lack a quantitative understanding of what patterns of traits and conditions are necessary to achieve these effects, such that they can be directly evaluated on high-throughput data.
Here we address this problem by developing a quantitative framework for selection on multiple microbial growth traits. We derive an expression for the selection coefficient that quantifies the relative selection pressures on lag time, growth rate, and yield. We then determine how these selection pressures shape population dynamics over many cycles of growth, as occur in natural environments or laboratory evolution. We find that selection is frequency-dependent, enabling coexistence and bistability of multiple strains and distorting the fixation statistics of mutants from the classical expectation. We also find that selection can be non-transitive across multiple strains, leading to apparent rock-paper-scissors interactions. These results are not only valuable for interpreting measurements of microbial selection and growth traits, but they also reveal how simple properties of microbial growth lead to complex population dynamics.
II Methods
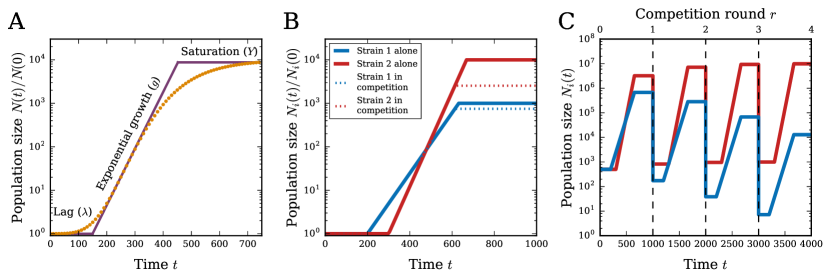
Consider a population of microbial cells competing for a single limiting resource. The population size as a function of time (growth curve) typically follows a sigmoidal shape on a logarithmic scale, with an initial lag phase of sub-exponential growth, then a phase of exponential growth, and finally a saturation phase as the environmental resources are exhausted (Fig. 1A). We consider a minimal three-phase model of growth dynamics in which the growth curve is characterized by three quantitative traits, one corresponding to each phase of growth Zwietering1990 ; Buchanan1997 : a lag time , an exponential growth rate , and a saturation population size (Fig. 1A, Sec. S1 in Supplementary Methods). It is possible to generalize this model for additional phases, such as a phase for consuming a secondary resource (diauxie) or a death phase, but here we will focus on these three traits since they are most commonly reported in microbial phenotyping experiments Warringer2011 ; Zackrisson2016 .
The saturation size depends on both the total amount of resources in the environment, as well as the cells’ intrinsic efficiency of using those resources. To separate these two components, we define to be the initial amount of the limiting resource and to be the yield, or the number of cells per unit resource Vasi1994 . Therefore is the amount of resources consumed by time , and saturation occurs at time when . The saturation time is therefore determined intrinsically, i.e., by the growth traits of the strain, rather than being externally imposed. It is straightforward to extend this model to multiple strains, each with a distinct growth rate , lag time , and yield , and all competing for the same pool of resources (Fig. 1B, Sec. S1). We assume different strains interact only by competing for the limiting resource; their growth traits are the same as when they grow independently.
We focus on the case of two competing strains, such as a wild-type and a mutant. We will denote the wild-type growth traits by and the mutant traits by . Assume the total initial population size is and the initial frequency of mutants is . Since we are mainly interested in the relative growth of the two strains (e.g., their changes in frequency over time), only relative time scales and yields matter. To that end we can reduce the parameter space by using the following dimensionless quantities:
| (1) |
Each relative yield is the fold-increase of that strain if it grows alone, starting at population size with resources.
Laboratory evolution experiments, as well as seasonal natural environments, typically involve a series of these growth cycles as new resources periodically become available Elena2003 . We assume each round of competition begins with the same initial population size and amount of resources , and the strains grow according to the dynamics of Fig. 1B until those resources are exhausted. The population is then diluted down to again with new resources, and the cycle repeats (Fig. 1C). In each round the total selection coefficient for the mutant relative to the wild-type is
| (2) |
where time is measured from the beginning of the round (Sec. S2) Crow1970 ; Chevin2011 . This definition is convenient because it describes the relative change in frequency of the mutant over the wild-type during each round of competition. Let be the mutant frequency at the beginning of the th round of competition; the frequency at the end of the round will be the initial frequency for the next round. Using Eq. 2, the selection coefficient for this round is , which we can rearrange to obtain
| (3) |
This shows how the mutant frequency changes over rounds as a function of the selection coefficient. If the selection coefficient is small, we can approximate these dynamics over a large number of rounds by the logistic equation: . However, for generality we use the frequency dynamics over discrete rounds defined by Eq. 3 throughout this work.
III Results
III.1 Distinct components of selection on growth and lag phases
We can derive an approximate expression for the selection coefficient as a function of the underlying parameters in the three-phase growth model. The selection coefficient consists of two components, one corresponding to selection on growth rate and another corresponding to selection on lag time (Sec. S3, Fig. S1):
| (4a) | ||||
| where | ||||
| (4b) | ||||
and denotes the harmonic mean, is the frequency of the mutant at the beginning of the competition round, and , , , and are as defined in Eq. 1. The harmonic mean of the two yields is approximately the effective yield for the whole population (Sec. S4). Equation 4 confirms that the relative traits defined in Eq. 1 fully determine the relative growth of the strains.
We interpret the two terms of the selection coefficient as selection on growth and selection on lag since is zero if and only if the growth rates are equal, while is zero if and only if the lag times are equal. If the mutant and wild-type growth rates only differ by a small amount (), then is proportional to the ordinary growth rate selection coefficient , while is the approximate selection coefficient for lag. This contrasts with previous studies that used as a measure of selection on lag time Vasi1994 ; Wahl2015 , which assumes that selection acts on the change in lag time relative to the absolute magnitude of lag time, . But the absolute magnitude of lag time cannot matter since the model is invariant under translations in time, and hence our model correctly shows that selection instead acts on the change in lag time relative to the growth rate.
III.2 Effect of pleiotropy and tradeoffs on selection
Many mutations affect multiple growth traits simultaneously, i.e., they are pleiotropic Fitzsimmons2010 ; Adkar2017 . Given a measured or predicted pattern of pleiotropy, we can estimate its effect on selection using Eq. 4 (Sec. S5). In particular, if a mutation affects both growth and lag, then both and will be nonzero. The ratio of these components indicates the relative selection on growth versus lag traits:
| (5) |
We can use this to determine, for example, how much faster a strain must grow to compensate for a longer lag time. This also shows that we can increase the magnitude of relative selection on growth versus lag by increasing the relative yields and . Conceptually, this is because increasing the yields increases the portion of the total competition time occupied by the exponential growth phase compared to the lag phase. Since each relative yield is proportional to the initial amount of resources per cell (Eq. 1), we can therefore tune the relative selection on growth versus lag in a competition by controlling . One can use this, for example, in an evolution experiment to direct selection more toward improving growth rate (by choosing large ) or more toward improving lag time (by choosing small ).
The ratio also indicates the type of pleiotropy on growth and lag through its sign. If , then the pleiotropy is synergistic: the mutation is either beneficial to both growth and lag, or deleterious to both. If , then the pleiotropy is antagonistic: the mutant is better in one trait and worse in the other. Antagonistic pleiotropy means the mutant has a tradeoff between growth and lag. In this case, whether the mutation is overall beneficial or deleterious depends on which trait has stronger selection. As aforementioned, relative selection strength is controlled by the initial resources per cell through the yields (Eq. 5), so we can therefore qualitatively change the outcome of a competition with a growth-lag tradeoff by tuning to be above or below a critical value, obtained by setting :
| (6) |
The right side of this equation depends only on intrinsic properties of the strains (growth rates, lag times, yields) and sets the critical value for , which we can control experimentally. When is below this threshold, selection will favor the strain with the better lag time: there are relatively few resources, and so it is more important to start growing first. On the other hand, when is above the critical value, selection will favor the strain with the better growth rate: there are relatively abundant resources, and so it is more important to grow faster.
III.3 Selection is frequency-dependent
Equation 4 shows that the selection coefficient depends on the initial frequency of the mutant (Sec. S6, Fig. S2). This is fundamentally a consequence of having a finite resource: if resources were unlimited and selection were measured at some arbitrary time instead of (which is intrinsically determined by the strains’ growth traits), then the resulting selection coefficient would not depend on .
This frequency-dependence means that some mutants are beneficial at certain initial frequencies and deleterious at others. The traits of these “conditionally-neutral” mutants must satisfy
| (7) |
which is obtained by determining which trait values allow for some frequency . This condition is only satisfied for mutants with a tradeoff between growth rate and lag time. For mutants satisfying Eq. 7, the unique frequency at which the mutant is conditionally neutral is
| (8) |
If the mutant and wild-type have equal yields (), then the mutant is neutral at all frequencies if . Mutants not satisfying these conditions are either beneficial at all frequencies () or deleterious at all frequencies ().
III.4 Neutral, beneficial, and deleterious regions of mutant trait space
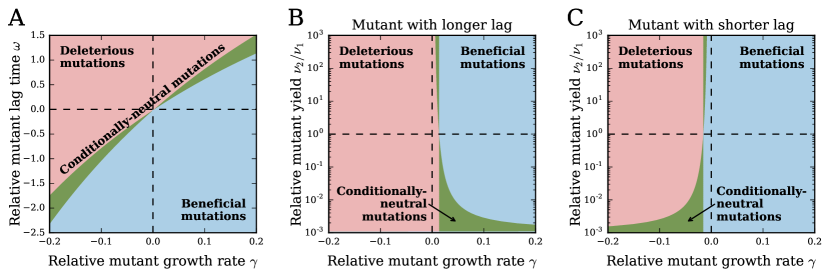
Figure 2A shows the regions of growth and lag trait space corresponding to conditionally-neutral (green), beneficial (blue), and deleterious (red) mutants. The slope of the conditionally-neutral region is determined by the magnitudes of the yields: increasing both yields (e.g., by increasing the initial resources per cell ) makes the region steeper, since that increases relative selection on growth (Eq. 5).
We can further understand the role of the yields by considering the trait space of growth rate and yield (Fig. 2B,C), as commonly considered in / selection studies Luckinbill1978 ; Velicer1999 ; Reznick2002 ; Novak2006 ; Fitzsimmons2010 ; Jasmin2012a ; Jasmin2012b ; Bachmann2013 . If the mutant has a longer lag time, then having a higher yield will be advantageous since the greater resource efficiency gives the mutant more time to grow exponentially to make up for its late start (Fig. 2B). On the other hand, if the the mutant has a shorter lag time, then having a lower yield is better since the mutant can hoard resources before the wild-type grows too much (Fig. 2C). These diagrams also show there are limits to how much changes in yield can affect selection. For example, if a deleterious mutant with slower growth () but shorter lag () reduces its yield, the best it can do is become conditionally neutral (move down into the green region of Fig. 2C) — it can never become completely beneficial. Likewise, a beneficial mutant with faster growth but longer lag can never become completely deleterious by varying its yield (Fig. 2B). Furthermore, a mutant with worse growth and lag can never outcompete the wild-type, no matter how resource-efficient (high yield) it is. In this sense there are no pure “-strategists” in the model Reznick2002 . Indeed, Eq. 4a indicates that there is no distinct selection pressure on yield, but rather it only modulates the relative selection pressures on growth versus lag. Note that increasing the mutant yield significantly above the wild-type value changes the selection coefficient very little, since the effective yield for the combined population (which determines the selection coefficient) is dominated by whichever strain is less efficient through the harmonic mean in Eq. 4.
III.5 Growth-lag tradeoffs enable coexistence or bistability of a mutant and wild-type
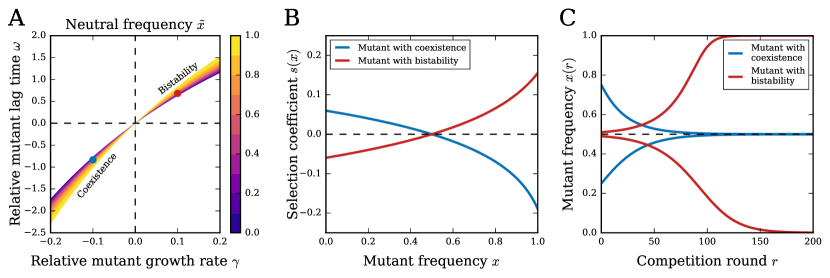
Mutants that are conditionally neutral (satisfying Eq. 7) due to a growth-lag tradeoff will have zero selection coefficient at an intermediate frequency (Eq. 8). Figure 3A shows the conditionally-neutral region of trait space colored according to the neutral frequency. For the two example mutants marked by blue and red points in Fig. 3A, both with neutral frequency , Fig. 3B shows their selection coefficients as functions of frequency . Selection for the blue mutant has negative (decreasing) frequency-dependence, so that when the frequency is below the neutral frequency , selection is positive, driving the frequency up toward , while selection is negative above the neutral frequency, driving frequency down. Therefore this mutant will stably coexist at frequency with the wild-type. In contrast, the red mutant has positive (increasing) frequency-dependent selection, so that it has bistable long-term fates: selection will drive it to extinction or fixation depending on whether its frequency is below or above the neutral frequency. Bistability of this type has been proposed as a useful mechanism for safely introducing new organisms into an environment without allowing them to fix unintentionally Tanaka2017 . Figure 3C shows example trajectories of the frequencies over rounds of competitions for these two mutants.
Coexistence of a conditionally-neutral mutant and wild-type requires a tradeoff between growth rate and yield (Sec. S6) — the mutant must have faster growth rate and lower yield, or slower growth rate and higher yield — in addition to the tradeoff between growth rate and lag time necessary for conditional neutrality. For example, the blue mutant in Fig. 3 has slower growth but shorter lag and higher yield compared to the wild-type. Therefore when the mutant is at low frequency (below ), the overall yield of the combined population (harmonic mean in Eq. 4) is approximately equal to the wild-type’s yield, and since the wild-type has lower yield, this results in stronger selection on lag versus growth. This means positive selection for the mutant, which has the shorter lag time. In contrast, when the mutant’s frequency is high, the overall yield of the population is closer to the mutant’s yield, and thus there is stronger selection on growth versus lag. This favors the wild-type strain, which has the faster growth rate, and therefore produces negative selection on the mutant. These scenarios are reversed when the strain with faster growth (and longer lag) also has greater yield (e.g., the red mutant in Fig. 3), resulting in bistability. Since Fig. 3A assumes the mutant has yield higher than that of the wild-type, all mutants in the lower branch of the conditionally-neutral region have coexistence, while all mutants in the upper branch are bistable.
Given any two strains with different yields and a tradeoff between growth and lag, in principle it is always possible to construct competition conditions such that the two strains will either coexist or be bistable. That is, one may choose any neutral frequency and use Eq. 6 to determine the critical value of the initial resources per cell ; with set to that value, the competition will have zero selection at precisely the desired frequency. Whether that produces coexistence or bistability depends on whether there is a tradeoff between growth and yield. Since the bottleneck population size also controls the strength of stochastic fluctuations (genetic drift) between competition rounds, we can determine how to choose this parameter such that coexistence will be robust to these fluctuations (Sec. S7).
Frequency-dependent selection may also significantly distort fixation of the mutant. In particular, it is common to measure selection on a mutant by competing the mutant against a wild-type starting from equal frequencies () Elena2003 . If selection is approximately constant across all frequencies, this single selection coefficient measurement is sufficient to accurately estimate the fixation probability and time of the mutant (Sec. S8). However, conditionally-neutral mutants may have fixation statistics that deviate significantly from this expectation due to frequency-dependent selection. For example, a mutant that is neutral at will have by definition, which would suggest the fixation probability of a single mutant should be the neutral value . However, its fixation probability may actually be much lower than that when accounting for the full frequency-dependence of selection (Sec. S8, Fig. S3). Therefore accounting for the frequency-dependent nature of selection may be essential for predicting evolutionary fates of mutations with tradeoffs in growth traits.
III.6 Selection is non-additive and non-transitive
We now consider a collection of many strains with distinct growth traits. To determine all of their relative selection coefficients, in general we would need to perform binary competitions between all pairs. However, if selection obeys the additivity condition
| (9) |
where is the selection coefficient of strain over strain in a binary competition, then we need only measure selection coefficients relative to a single reference strain, and from those we can predict selection for all other pairs. The additivity condition holds, for example, if selection coefficients are simply differences in scalar fitness values (Malthusian parameters) for each strain (i.e., ). Therefore the extent to which Eq. 9 holds is indicative of the existence of a fitness landscape.
Based on the selection coefficient definition (Eq. 2), the additivity condition would hold if the selection coefficient is measured at a fixed time before saturation occurs. In that case, there is a scalar fitness value for each strain, and the selection coefficients are just differences in these values (Sec. S2). However, if we only measure selection after the finite resources are exhausted, then the selection coefficient depends on the saturation time , which is intrinsically determined by the traits of the two competing strains and is therefore different for each binary competition (Sec. S4). This means that the selection coefficient in this model does not obey additivity in general, although it will be approximately additive in the limit of small differences in growth traits between strains (Sec. S9).
A condition weaker than additivity is transitivity, which means that if strain 2 beats strain 1 and strain 3 beats strain 2 in binary competitions, then strain 3 must beat strain 1 in a binary competition as well Verhoef2010 . This must also hold for neutrality, so if strains 1 and 2 are neutral, and strains 2 and 3 are neutral, then strains 1 and 3 must also be neutral. This essentially means that Eq. 9 at least predicts the correct sign for each binary selection coefficient.
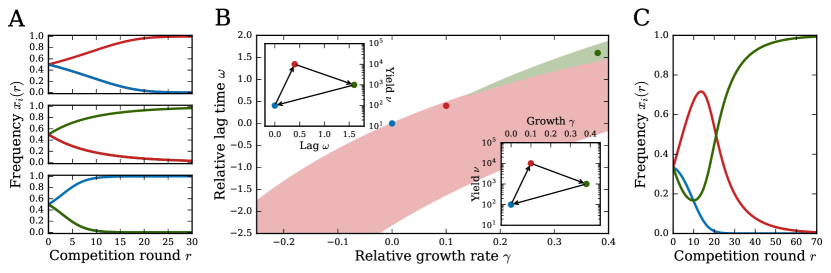
If all three strains have equal yields, then selection in our model is always transitive for any initial frequencies (Sec. S10). If the yields are not all equal, then it is possible to find sets of three strains with non-transitive selection: each strain outcompetes one of the others in a binary competition (Sec. S10), forming a rock-paper-scissors game Kerr2002 . In Fig. 4A we show an example of three strains forming a non-transitive set. Figure 4B shows the distribution of these same three strains in trait space, where the shaded regions indicate constraints on the strains necessary for them to exhibit non-transitivity. That is, given a choice of the blue strain’s traits, the red strain’s traits may lie anywhere in the red shaded region, which allows the red strain to beat the blue strain while still making it possible to choose the green strain and form a non-transitive set. Once we fix the red point, then the green strain’s traits may lie anywhere in the green shaded region.
This trait space diagram reveals what patterns of traits are conducive to generating non-transitive selection. The trait space constraints favor a positive correlation between growth rates and lag times across strains, indicating a growth-lag tradeoff. Indeed, these tradeoffs between growth strategies are the crucial mechanism underlying non-transitivity. For example, in Fig. 4A, red beats blue since red’s faster growth rate and higher yield outweigh its longer lag time; green beats red due to its even faster growth rate, despite its longer lag and lower yield; and blue beats green with a shorter lag time and lower yield. Non-transitive strains will generally have no significant correlation between yield and growth rate or between yield and lag time (Fig. 4B, insets); furthermore, the cycle of selective advantage through the three strains generally goes clockwise in both the lag-yield and growth-yield planes.
Since each strain in a non-transitive set can beat one of the others in a binary competition, it is difficult to predict a priori the outcome of a competition with all three present. In Fig. 4C we show the population dynamics for ternary competition of the non-transitive strains in Fig. 4A,B. Non-transitive and frequency-dependent selection creates complex population dynamics: the red strain rises at first, while the blue and green strains drop, but once blue has sufficiently diminished, that allows green to come back (since green loses to blue, but beats red) and eventually dominate. Note that we do not see oscillations or coexistence in these ternary competitions, as sometime occur with non-transitive interactions Sinervo1996 ; Verhoef2010 .
IV Discussion
IV.1 Selection on multiple growth phases produces complex population dynamics
Our model shows how basic properties of microbial growth cause the standard concept of a scalar fitness landscape to break down, revealing selection to depend fundamentally on the multidimensional nature of life history. This occurs even for the simple periodic environment (constant and ) commonly used in laboratory evolution; fluctuating environments, as are expected in natural evolution, will likely exaggerate the importance of these effects. In contrast with previous theoretical work on tradeoffs between different phases of growth Stewart1973 ; Smith2011 , we have obtained simple mathematical results indicating the environmental conditions and patterns of traits necessary to produce complex population dynamics such as coexistence and bistability. In particular, we have shown how to tune the amount of resources and bottleneck population size such that any pair of strains with a growth-lag tradeoff will coexist or be bistable. In terms of ecology, this is an important demonstration of how life-history tradeoffs can enable coexistence of multiple strains even on a single limiting resource Levin1972 . This conflicts with the principle of competitive exclusion Hardin1960 , which posits that the number of coexisting types cannot exceed the number of resources. However, models that demonstrate this principle, such as the MacArthur consumer-resource model Chesson1990 , do not account for multiple phases of life history, so that a single strain will always have overall superiority on any one resource.
Our model furthermore provides a simple mechanism for generating non-transitive interactions, in contrast to most known mechanisms that rely on particular patterns of allelopathy Jackson1996 ; Kerr2002 , morphology Sinervo1996 , or spatial dynamics Edwards2010 . These results emphasize the need for more comprehensive measurements of selection beyond competition experiments against a reference strain at a single initial frequency Elena2003 . As we have shown, these measurements may be insufficient to predict the long-term population dynamics at all frequencies (due to frequency-dependent selection), or the outcomes of all possible binary and higher-order competitions (due to non-transitive selection).
IV.2 Pleiotropy and correlations between traits
Tradeoffs among growth, lag, and yield are necessary for coexistence, bistability, and non-transitivity. Whether these tradeoffs are commonly realized in an evolving microbial population largely depends on the pleiotropy of mutations. Two theoretical considerations suggest pleiotropy between growth and lag will be predominantly synergistic. First, cell-to-cell variation in lag times LevinReisman2010 ; Ziv2013 means that the apparent population lag time is largely governed by the cells that happen to exit lag phase first and begin dividing, which causes the population lag time to be conflated with growth rate Baranyi1998 . Second, mechanistic models that attempt to explain how growth rate and lag time depend on underlying cellular processes also predict synergistic pleiotropy Baranyi1994 ; Swinnen2004 ; Himeoka2017 ; conceptually, this is because the product of growth rate and lag time should be a positive constant corresponding to the amount of metabolic “work” that the cell must perform to exit lag and begin to divide. Pleiotropy between growth rate and yield, on the other hand, is generally expected to be antagonistic due to thermodynamic constraints between the rate and yield of metabolic reactions Pfeiffer2001 ; MacLean2007 , although this constraint may not necessarily induce a correlation Wong2009 .
Distributions of these traits have been measured for both bacteria and fungi. Correlations between growth rate and yield have long been the focus of / selection studies; some of these experiments have indeed found tradeoffs between growth rate and yield MacLean2007 ; Jasmin2012a ; Jasmin2012b ; Bachmann2013 , but others have found no tradeoff, or even a positive correlation Luckinbill1978 ; Velicer1999 ; Novak2006 ; Fitzsimmons2010 ; Warringer2011 . Measurements of lag times have also found mixed results Swinnen2004 ; Warringer2011 ; Himeoka2017 ; Wang2015 ; Adkar2017 . However, most of these data are for evolved populations, which may not reflect the true pleiotropy of mutations: distributions of fixed mutations may be correlated by selection even if the underlying distributions of mutations are uncorrelated. Our model shows that higher yield is only beneficial for faster growth rates, and so selection will tend to especially amplify mutations that increase both traits, which may explain some of the observed positive correlations between growth rate and yield. Indeed, data on the distributions of growth rates and yields from individual clones within a population show a negative correlation Novak2006 . The model developed here will be useful for further exploring the relationship between the underlying pleiotropy of mutations and the distribution of traits in evolved populations.
IV.3 Analysis of experimental growth curves and competitions
Given a collection of microbial strains, we can measure their individual growth curves and determine growth rates, lag times, and yields. In principle, we can use the model (Eq. 4) to predict the outcome of any binary competition with these strains. These strains need not be mutants of the same species, as we primarily discuss here, but can even be different species. In practice, however, there are several challenges in applying the model to this data. First, real growth dynamics are undoubtedly more complicated than the minimal model used here. There are additional time scales, such as the rate at which growth decelerates as resources are exhausted Stewart1973 ; other frequency-dependent effects, such as a dependence of the lag time on the initial population size Kaprelyants1996 ; and more complex interactions between cells, such as cross-feeding Turner1996 , especially between different species. In addition, the measured traits and competition parameters may be noisy, due to intrinsic noise within the cells as well as the extrinsic noise of the experiment.
Nevertheless, the simplicity of the model investigated here makes it a useful tool for identifying candidate strains from a collection of individual growth curves that may have interesting dynamics in pairs or in multi-strain competitions, which can then be subsequently tested by experiment. Existing technologies enable high-throughput measurement of individual growth curves for large numbers of strains LevinReisman2010 ; Ziv2013 ; Zackrisson2016 , but systematic measurements of competitions are limited by the large number of possible strain combinations, as well as the need for sequencing or fluorescent markers to distinguish strains. The model can therefore help to target which competition experiments are likely to be most interesting by computationally scanning all combinations and setting bounds on various parameters to be compared with experimental uncertainties. For example, we can identify pairs of strains with growth-lag tradeoffs and predict a range of competition conditions that will lead to coexistence. We can also identify candidate sets of strains for demonstrating non-transitive selection. Even for sets of strains with additional interactions beyond competition for a single resource, which will almost certainly be the case when the strains are different species, our results can serve as a null model for testing the importance of these other interactions, beyond variation in growth traits, in shaping population dynamics.
Acknowledgements.
We thank Tommaso Biancalani, Parris Humphrey, and William Jacobs for valuable discussions, and Tal Einav for a critical reading of the manuscript. This work was supported by NIH awards F32 GM116217 to MM and R01 GM068670 to EIS.Author contributions
MM, BVA, and EIS designed research; MM and BVA carried out calculations and analyzed data; MM wrote the manuscript. All authors edited and approved the final version.
References
- (1) Orr HA. Fitness and its role in evolutionary genetics. Nat Rev Genet. 2009;10:531–539.
- (2) McGill BJ, Enquist BJ, Weiher E, Westoby M. Rebuilding community ecology from functional traits. Trends Ecol Evol. 2006;21:178–185.
- (3) Warmflash A, Francois P, Siggia ED. Pareto evolution of gene networks: an algorithm to optimize multiple fitness objectives. Phys Biol. 2012;9:56001.
- (4) Vasi F, Travisano M, Lenski RE. Long-Term Experimental Evolution in Escherichia coli. II. Changes in Life-History Traits During Adaptation to a Seasonal Environment. Am Nat. 1994;144:432–456.
- (5) Novak M, Pfeiffer T, Lenski RE, Sauer U, Bonhoeffer S. Experimental Tests for an Evolutionary Trade-Off between Growth Rate and Yield in E. coli. Am Nat. 2006;168:242–251.
- (6) Warringer J, Zörgö E, Cubillos FA, Zia A, Gjuvsland A, Simpson JT, et al. Trait Variation in Yeast Is Defined by Population History. PLOS Genet. 2011;7:e1002111.
- (7) Fitzsimmons JM, Schoustra SE, Kerr JT, Kassen R. Population consequences of mutational events: effects of antibiotic resistance on the r/K trade-off. Evol Ecol. 2010;24:227–236.
- (8) Fridman O, Goldberg A, Ronin I, Shoresh N, Balaban NQ. Optimization of lag time underlies antibiotic tolerance in evolved bacterial populations. Nature. 2014;513:418–421.
- (9) Reding-Roman C, Hewlett M, Duxbury S, Gori F, Gudelj I, Beardmore R. The unconstrained evolution of fast and efficient antibiotic-resistant bacterial genomes. Nat Ecol Evol. 2017;1:0050.
- (10) Levin-Reisman I, Ronin I, Gefen O, Braniss I, Shoresh N, Balaban NQ. Antibiotic tolerance facilitates the evolution of resistance. Science. 2017;355:826–830.
- (11) Adkar BV, Manhart M, Bhattacharyya S, Tian J, Musharbash M, Shakhnovich EI. Optimization of lag phase shapes the evolution of a bacterial enzyme. Nat Ecol Evol. 2017;1:0149.
- (12) Luckinbill LS. r and K Selection in Experimental Populations of Escherichia coli. Science. 1978;202:1201–1203.
- (13) Velicer GJ, Lenski RE. Evolutionary Trade-Offs Under Conditions of Resource Abundance and Scarcity: Experiments with Bacteria. Ecology. 1999;80:1168–1179.
- (14) Reznick D, Bryant MJ, Bashey F. r- and K-selection revisited: The role of population regulation in life-history evolution. Ecology. 2002;83:1509–1520.
- (15) Jasmin JN, Zeyl C. Life-History Evolution and Density-Dependent Growth in Experimental Populations of Yeast. Evolution. 2012;66:3789–3802.
- (16) Jasmin JN, Dillon MM, Zeyl C. The yield of experimental yeast populations declines during selection. Proc R Soc B. 2012;279:4382–4388.
- (17) Bachmann H, Fischlechner M, Rabbers I, Barfa N, dos Santos FB, Molenaar D, et al. Availability of public goods shapes the evolution of competing metabolic strategies. Proc Natl Acad Sci USA. 2013;110:14302–14307.
- (18) Levin BR. Coexistence of Two Asexual Strains on a Single Resource. Science. 1972;175:1272–1274.
- (19) Stewart FM, Levin BR. Partitioning of Resources and the Outcome of Interspecific Competition: A Model and Some General Considerations. Am Nat. 1973;107:171–198.
- (20) Turner PE, Souza V, Lenski RE. Tests of Ecological Mechanisms Promoting the Stable Coexistence of Two Bacterial Genotypes. Ecology. 1996;77:2119–2129.
- (21) Smith HL. Bacterial competition in serial transfer culture. Math Biosci. 2011;229:149–159.
- (22) Zackrisson M, Hallin J, Ottosson LG, Dahl P, Fernandez-Parada E, Ländström E, et al. Scan-o-matic: High-Resolution Microbial Phenomics at a Massive Scale. G3. 2016;6:3003–3014.
- (23) Levin-Reisman I, Gefen O, Fridman O, Ronin I, Shwa D, Sheftel H, et al. Automated imaging with ScanLag reveals previously undetectable bacterial growth phenotypes. Nat Methods. 2010;7:737–739.
- (24) Ziv N, Siegal ML, Gresham D. Genetic and Nongenetic Determinants of Cell Growth Variation Assessed by High-Throughput Microscopy. Mol Biol Evol. 2013;30:2568–2578.
- (25) Zwietering MH, Jongenburger I, Rombouts FM, van ’t Riet K. Modeling of the Bacterial Growth Curve. Appl Environ Microbiol. 1990;56:1875–1881.
- (26) Buchanan RL, Whiting RC, Damert WC. When is simple good enough: a comparison of the Gompertz, Baranyi, and three-phase linear models for fitting bacterial growth curves. Food Microbiol. 1997;14:313–326.
- (27) Elena SF, Lenski RE. Evolution experiments with microorganisms: the dynamics and genetic bases of adaptation. Nat Rev Genet. 2003;4:457–469.
- (28) Crow JF, Kimura M. An Introduction to Population Genetics Theory. New York: Harper and Row; 1970.
- (29) Chevin LM. On measuring selection in experimental evolution. Biol Lett. 2011;7:210–213.
- (30) Wahl LM, Zhu AD. Survival Probability of Beneficial Mutations in Bacterial Batch Culture. Genetics. 2015;200:309–320.
- (31) Tanaka H, Stone HA, Nelson DR. Spatial gene drives and pushed genetic waves. Proc Natl Acad Sci USA. 2017;114:8452–8457.
- (32) Verhoef HA, Morin PJ. Community Ecology: Processes, Models, and Applications. Oxford: Oxford University Press; 2010.
- (33) Kerr B, Riley MA, Feldman MW, Bohannan BJM. Local dispersal promotes biodiversity in a real-life game of rock-paper-scissors. Nature. 2002;418:171–174.
- (34) Sinervo B, Lively CM. The rock-paper-scissors game and the evolution of alternative male strategies. Nature. 1996;380:240–243.
- (35) Hardin G. The competitive exclusion principle. Science. 1960;131:1292–1297.
- (36) Chesson P. MacArthur’s consumer-resource model. Theor Popul Biol. 1990;37:26–38.
- (37) Jackson JBC, Buss L. Alleopathy and spatial competition among coral reef invertebrates. Proc Natl Acad Sci USA. 1975;72:5160–5163.
- (38) Edwards KF, Schreiber SJ. Preemption of space can lead to intransitive coexistence of competitors. Oikos. 2010;119:1201–1209.
- (39) Baranyi J. Comparison of Stochastic and Deterministic Concepts of Bacterial Lag. J Theor Biol. 1998;192:403–408.
- (40) Baranyi J, Roberts TA. A dynamic approach to predicting bacterial growth in food. Int J Food Microbiol. 1994;23:277–294.
- (41) Swinnen IAM, Bernaerts K, Dens EJJ, Geeraerd AH, Impe JFV. Predictive modelling of the microbial lag phase: a review. Int J Food Microbiol. 2004;94:137–159.
- (42) Himeoka Y, Kaneko K. Theory for Transitions Between Exponential and Stationary Phases: Universal Laws for Lag Time. Phys Rev X. 2017;7:021049.
- (43) Pfeiffer T, Schuster S, Bonhoeffer S. Cooperation and Competition in the Evolution of ATP-Producing Pathways. Science. 2001;292:504–507.
- (44) MacLean RC. The tragedy of the commons in microbial populations: insights from theoretical, comparative and experimental studies. Heredity. 2007;100:471–477.
- (45) Wong WW, Tran LM, Liao JC. A hidden square-root boundary between growth rate and biomass yield. Biotechnol Bioeng. 2009;102:73–80.
- (46) Wang J, Atolia E, Hua B, Savir Y, Escalante-Chong R, Springer M. Natural Variation in Preparation for Nutrient Depletion Reveals a Cost-Benefit Tradeoff. PLOS Biol. 2015;13:e1002041.
- (47) Kaprelyants AS, Kell DB. Do bacteria need to communicate with each other for growth? Trends Microbiol. 1996;4:237–242.