Chemistry of TMC-1 with multiply deuterated species and spin chemistry of H2, H2+, H3+ and their isotopologues
Abstract
Deuterated species are unique and powerful tools in astronomy since they can probe the physical conditions, chemistry, and ionization level of various astrophysical media. Recent observations of several deuterated species along with some of their spin isomeric forms have rekindled the interest for more accurate studies on deuterium fractionation. This paper presents the first publicly available chemical network of multiply deuterated species along with spin chemistry implemented on the latest state-of-the-art gas-grain chemical code ‘NAUTILUS’. D/H ratios for all deuterated species observed at different positions of TMC-1 are compared with the results of our model, which considers multiply deuterated species along with the spin chemistry of light hydrogen bearing species H2, H2+, H3+ and their isotopologues. We also show the differences in the modeled abundances of non-deuterated species after the inclusion of deuteration and spin chemistry in the model. Finally, we present a list of potentially observable deuterated species in TMC-1 awaiting detection.
keywords:
Astrochemistry, spectra, ISM: molecules, ISM: abundances, ISM: evolution, methods: statistical1 Introduction
Until now (as of February 2016), almost 200 molecules have been detected in the interstellar medium or circumstellar shells (as listed by CDMS111https://www.astro.uni-koeln.de/cdms/molecules). In addition, several deuterated species have been detected in various astrophysical media. Among them there were several detections:
- -
- -
- -
- -
The detection of ND3 in the Barnard 1 cloud (Lis et al., 2002) and CD3OH in IRAS 16293-2422 (Parise et al., 2004) has shown the possibility of detecting multiply deuterated species in cold and high density regions. These observations opened new questions regarding the highest deuterium fractionation level that can occur in cold and high density regions. We have already entered into a new era of astrochemistry where powerful, high-sensitive, and high-resolution observational facilities like Atacama Large Millimetre Array (ALMA) are in operation. Thus, there is no doubt that many more singly and multiply deuterated species are going to be observed. By studying the chemistry of these deuterated species, we will be able to diagnose various cold and dense environments where stars are born (see for instance Albertsson et al. (2013) and references therein).
Deuterium chemistry in the gas phase is believed to be controlled by the isotopic exchange reactions between HD and H3+, as the reservoir of deuterium is initially locked in the form of HD, via the reaction
| (1) |
The above backward reaction is endothermic by 232 K and is thus negligible at low temperatures (less than 20 K). H2D+ can react with other abundant molecules (such as CO, N2) to transfer D-atoms to other species (Ceccarelli et al., 2014). However, this reaction scheme becomes complicated if we consider nuclear spin states for the protonated species. Molecular hydrogen (H2) has two distinct spin states under the permutation of identical protons. An ortho state (ortho-H2) when the nuclear spin wave function is symmetric and a para state (para-H2) when the nuclear spin wave function is antisymmetric. The energy difference between the rotational ground states of ortho-H2 and para-H2 is 170.5 K (Hugo et al., 2009). Consequently if we consider the reaction (1) in backward direction with ortho-H2 and ortho-H2D+, the reaction becomes exothermic by about 24 K with para-H3+ as one of the products. As a result, the ortho-to-para ratio of H2 (opr(H2) from now on in the text) becomes an important parameter in controlling the deuterium fractionation even at low temperature (Flower et al., 2006).
The study of deuterium chemistry is a challenging task. The reason is the unavailability of any public database which provides a network with detailed deuterium chemistry along with spin chemistry of important protonated species. In the past, many authors have studied deuterium fractionation by cloning reactions involving hydrogen-bearing species (Aikawa et al. (2012), Albertsson et al. (2013), Albertsson et al. (2014a), Das et al. (2015), Majumdar et al. (2014a), Majumdar et al. (2014b), Roberts & Millar (2000a), Roberts & Millar (2000b), Sipilä et al. (2013), Taquet et al. (2014)). Among these studies, Roberts & Millar (2000a, b) reported one of the first gas-grain chemical models for deuteration, where the chemistry was limited to singly and a few doubly deuterated species along with surface chemistry only for H2 and HD molecules. Aikawa et al. (2012) considered the chemistry of multiply deuterated species both in the gas phase and on the grain surface but without considering spin-state chemistry. Similar models were also published in Albertsson et al. (2013), Das et al. (2015), Majumdar et al. (2014a, b) where multiple deuteration was taken into account without considering spin-state chemistry. Sipilä et al. (2013) and Taquet et al. (2014) reported deuterium fractionation models with gas-grain chemistry of deuterated species up to four atoms and the spin chemistry of H2, H2+, H3+ and their deuterated isotopologues. More recently, Albertsson et al. (2014a) have considered deuterated species with 7 atoms whereas Sipilä et al. (2015) have considered 6 atoms. Both works include spin chemistry. In many cases, deuteration was studied by restricting the number of atoms in the deuterated species, without studying spin chemistry or grain chemistry in detail. The main goal of the present paper is to present a more comprehensive deuterium fractionation model, which includes spin chemistry of H2, H2+, H3+ and their deuterated isotopologues, the chemistry of multiply deuterated species and surface chemistry described in detail in Section 2. This network is the first of its kind to be made public (http://kida.obs.u-bordeaux1.fr/). This paper is structured as follows. In Section 2, we present our new deuterium fractionation model. We give a detailed description of our deuterated network (deuspin.kida.uva.2016 from now in the rest of the text) along with its implementation in the gas-grain code NAUTILUS. We benchmark our model with the other published works. In Section 3, we discuss the general trends of deuterium chemistry. We compare our results with observations and discuss the effect of inclusion of deuspin.kida.uva.2016 on the predicted modelled abundances for several well observed non-deuterated species, and discuss some new observable deuterated species in dark clouds. Finally, in Section 4 we draw our conclusions.
2 Chemical model and network
2.1 The NAUTILUS chemical model
To study deuteration together with spin chemistry, we use the NAUTILUS gas-grain chemical model (Reboussin et al., 2014; Ruaud et al., 2015; Wakelam et al., 2015b) under typical cold dense cloud conditions. NAUTILUS is a state-of-the-art chemical code, which can be applied to simulate various types of astronomical environments. Applications of this gas-grain chemical code have already been reported for dense clouds (Wakelam et al., 2015b), low-mass protostellar envelopes (Bottinelli et al., 2014; Majumdar et al., 2016), and the outer regions of protoplanetary discs (Dutrey et al., 2011). NAUTILUS computes the abundances of species (e.g. atoms, ions, radicals, molecules) as a function of time in the gas phase and on the surfaces of interstellar grains. All the equations and the chemical processes included in the model are described in detail in Ruaud et al. (2015). To include the effect of spin chemistry, we then modified all the variables in NAUTILUS relative to H2 in terms of ortho-H2 and para-H2 (from now we will use o, p and m to represent ortho, para, and meta states 222Here ortho, para and meta stand for different nuclear spin symmetries for a species. For example, H2 has two spin states i.e. ortho (I=1 and gI=3), para (I=0 and gI=1) whereas D3+ has three spin states i.e. ortho (I=1,2 and gI=16), para (I=0, gI=1) and meta (I=1,3 and gI=10). Among others, H2+, H3+, D2+, H2D+, D2H+ have only ortho and para spin states. Here, I and gI stand for nuclear spin angular momenta and nuclear spin statistical weights respectively. See Hugo et al. (2009) for more details. in the rest of the text).
In the model, several types of chemical reactions are considered in the gas phase by following the kida.uva.2014 chemical network of Wakelam
et al. (2015a). These reactions can be classified in four categories:
bimolecular reactions between neutral species, between charged species and between neutral and charged species, unimolecular reactions (i.e. photoreactions with direct UV photons and UV photons produced by the
deexcitation of H2 excited by the cosmic ray particles), and direct ionisation and dissociation by cosmic ray particles. Here the interstellar ice is modelled by a one phase rate equation approach (Hasegawa
et al., 1992), i.e.
there is no differentiation between the species in the mantle and on the surface. In our model, the gas and the grains are coupled to each other via four interaction processes : physisorption of gas phase species onto grain surfaces,
diffusion of the accreted species, reaction at the grain surface, and evaporation to the gas phase. These evaporation processes can also be of various types. The evaporation mechanisms considered here are: thermal
(which are inefficient at dense cloud conditions), induced by cosmic-rays (Hasegawa &
Herbst, 1993), and chemical as defined by Garrod
et al. (2007). According to Wakelam et al. (2014), photodesorption
induced by cosmic-ray secondary photons is less efficient than chemical desorption. This is why we did not consider it in our model. Any species can diffuse by thermal hopping only with
a barrier of 0.5ED where ED is the species binding energy. By following Garrod
et al. (2007), we consider that approximately 1% of the products is allowed to desorb due to
chemical desorption. We do not take into account the cosmic-ray induced diffusion mechanism (CRD) since for high visual extinction, effect of CRD is negligible (see Reboussin et al., 2014)
To simulate deuterium chemistry together with spin chemistry in dark clouds, the model is used with homogeneous physical conditions and integrated over yrs. The initial elemental abundances reported in Table 1 are the same as in Hincelin et al. (2011) with deuterium and fluorine elemental abundances relative to hydrogen of (Linsky et al., 2006) and (Neufeld et al., 2005) respectively. The species are assumed to be initially in an atomic form as in diffuse clouds except for hydrogen and deuterium, which are initially in H2 and HD forms respectively. All elements (e.g. C, S, Si, Fe, Na, Mg, Cl, and P) with an ionization potential lower than 13.6 eV are initially singly ionised. For our standard model, we have used a C/O ratio of 0.7 (i.e. the oxygen elemental abundance is ). The ortho-to-para H2 ratio is initially set to its statistical value of 3. The model was run with a dust and gas temperature of 10 K, a total proton density of cm-3, a cosmic-ray ionization rate of s-1, and a visual extinction of 30 mag.
| Element | Abundance relative to H |
|---|---|
| o-H2 | 3.75 |
| p-H2 | 1.25 |
| He | 9 |
| N | 6.2 |
| O | 2.4 |
| C+ | 1.7 |
| S+ | 8 |
| Si+ | 8 |
| Fe+ | 3 |
| Na+ | 2 |
| Mg+ | 7 |
| P+ | 2 |
| Cl+ | 1 |
| F | 6.68 |
| HD | 1.60 |
2.2 Developed chemical network from KIDA 2014
The initial gas-phase chemical network was adapted from the kida.uva.2014 network333http://kida.obs.u-bordeaux1.fr/ (Wakelam et al. (2015a), which includes 489 species composed of 13 elements (H, He, C, N, O, Si, S, Fe, Na, Mg, Cl, P, F) linked with 7509 reactions. Our starting network includes various updates of the HCN/HNC chemistry by Loison et al. (2014b), carbon chemistry by Loison et al. (2014a), branching ratios for reactions forming C, Cn=2-4H(0,+), and C3H from Chabot et al. (2013) and also various new data sheets from KIDA database. This network has been extended to include the spin states of H2, H2+ and H3+ and their deuterated isotopologues.
To add the spin states of H2, H2+, H3+ into kida.uva.2014, we applied the method described by Sipilä et al. (2015) in which the branching ratios are calculated using Oka’s method (Oka, 2004). In this method, selection rules for reactive collisions involving different spin species are derived using angular momentum algebra. Branching ratios resulting from this method correspond to pure nuclear spin statistical weights under the assumption that the nuclei are completely mixed in the reaction. Following Sipilä et al. (2015), we applied the same method to all reactions except charge-transfer reactions, where we assume that spin states are conserved. We have added an activation energy of 170 K to the coefficient (of the temperature dependent rate coefficients ) for the reactions where o-H2 is formed (see Albertsson et al. (2014a) for similar methods). The formation of o-H2 and p-H2 in reactions that involve species, whose spin states are not tracked (i.e., other than H2, H2+, and H3+), is handled with the “recombination” approach described in detail in Sect. 2.3.1 of Sipilä et al. (2015). Our deuteration routine is similar to the one described in Albertsson et al. (2013) where deuterons are substituted for protons in the reactions, and branching ratios are calculated assuming complete scrambling. Here, we do not consider the spin chemistry of multiply deuterated species. For multiply deuterated species, the calculation of nuclear spin-state branching ratios is more complicated than for hydrogenated species since there is no one-to-one correspondence between angular momentum and symmetry representations. In the present work, we include the spin-state chemistry of the deuterated isotopologues involved in the H3+ + H2 reaction system (which is essential in the present context) from Table III and IV of Hugo et al. (2009) complemented by important reactions involving light hydrogen and deuterium-bearing species (H3+, H2D+, HD etc.) from Flower et al. (2004) and Walmsley et al. (2004). We also included dissociative recombination reactions for H3+ and its deuterated forms from Pagani et al. (2009). We have added all these important reactions as a supplementary file in the format of kida.uva.2014 network. In addition, we have added several important reactions from the literature: important reactions for deuterations from Albertsson et al. (2013) and water deuteration chemistry from Talukdar & Ravishankara (1996), Bergin et al. (1999). The entire network considered here is available on the KIDA444http://kida.obs.u-bordeaux1.fr/ website.
Our network for surface reactions and gas-grain interactions is based on the one from Garrod et al. (2007) with several additional processes from Ruaud et al. (2015). We extended our network to include deuteration by assuming statistical branching ratios (see for instance Taquet et al. (2014) for the same method). According to Taquet et al. (2013), although deuterated isotopologues have the higher mass, they seem to show similar binding energies to their hydrogenated counterpart. Therefore, by following these studies and also due to the unavailability of binding energies for deuterated species, we assume the same binding energies for all deuterated and non-deuterated species. Finally, we have nearly 7700 reactions on grain surface linked with the 111000 reactions in gas phase. If we sum up all these modifications, the deuspin.kida.uva.2016 network has the following characteristics:
-
-
Spin chemistry of light hydrogen bearing species (H2, H2+, H3+) essential to take into account the deuterium fractionation properly.
-
-
Spin chemistry of H3+ + H2 reacting system and their isotopologues from Hugo et al. (2009).
-
-
Chemistry of multiply deuterated species.
-
-
Extension of the kida.uva.2014 network to include full deuterium fractionation for species containing any of the 13 elements (H, He, C, N, O, Si, S, Fe, Na, Mg, Cl, P, F).
-
-
All reactions are written in the the same format as in the KIDA database for the different types so that in future users can export this network easily without any confusion.
2.3 Benchmarking spin and deuterium chemistry
H2, D2, H3+, H2D+, D2H+ and D3+ along with their spin isomers are the main species that dictate deuterium fractionation at low temperature (see for instance Ceccarelli et al. (2014) and references therein). In addition, deuterium fractionation strongly depends on the initial opr(H2) considered. Ortho and para H2 are formed on the surfaces of interstellar grains with a statistical ratio of 3:1 (Watanabe et al., 2010) and proton-exchange reactions in the gas phase then convert ortho-H2 into para-H2 (see Ceccarelli et al. (2014) and references therein for more discussions). In our model, we set an initial ratio of 3:1, in agreement with the experimental findings of Watanabe et al. (2010).
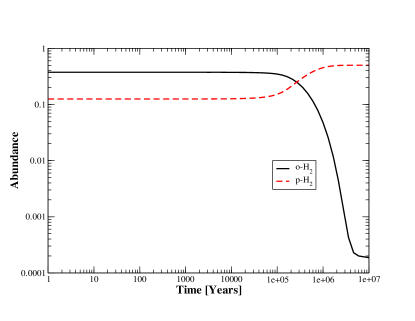
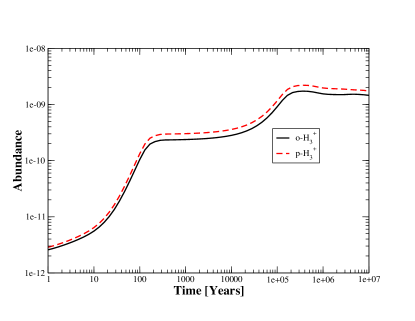
Before applying our model to a dense core (e.g. a TMC-1 like environment), we have benchmarked our model with other published works. The importance of spin-state chemistry is now widely accepted and has been tested in different stages of star formation process: diffuse clouds (Albertsson et al., 2014b), starless/prestellar cores (Pagani et al. (2009), Sipilä et al. (2013)) and protostellar systems (Taquet et al. (2013)). But in all cases spin-state chemistry was discussed to address particular issues by adopting various types of physical and chemical model making a direct comparison with our model very difficult. Two things can be compared though: the time scale for gas phase ortho-H2 to para-H2 conversion and abundance profiles for the two spin isomers of H3+. Fig. 1 shows the evolution of the ortho and para forms of H2 in the gas-phase under dense core conditions. In our model, opr(H2) becomes unity at around few times 105 years and drops down to 10-3 or below after this. This is consistent with the result of Sipilä et al. (2013). Fig. 2 shows the evolution of the ortho and para forms of H3+. At 107 year, the abundances of o-H3+ and p-H3+ are respectively and . Sipilä et al. (2015) reported for o-H3+ under the same conditions.
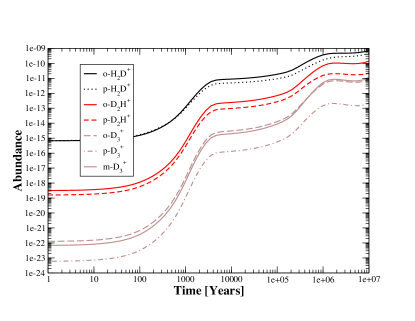
To validate deuterium chemistry with associated spin chemistry, one basic test would be to compare the abundance profile of H2D+, D2H+ and D3+ with other models, since they are the major species controlling the deuterium fractionation. In order to perform a more realistic comparison, we ran our model with a similar initial opr(H2)=10-3 (i.e kinetically equilibrated H2 at low temperature, see Faure et al. (2013)) mentioned in Sipilä et al. (2015). Fig. 3 shows the abundances of all the isotopologues of H3+. At 107 year, the abundances of o-H2D+, p-H2D+, o-D2H+, p-D2H+, o-D3+, p-D3+, m-D3+ are respectively , , , , , , . In Fig. 3 of Sipilä et al. (2015), at 107 year the reported abundances of o-H2D+ and p-D2H+ are respectively and under the same conditions, within a factor of 2 in agreement with our model. These differences are quite minor considering the differences in the starting networks (our work is based on kida.uva.2014 network whereas Sipilä et al. (2015) used osu_03_2008 network). But we have found the similar trend for all the isotopologues of H3+ as described in Sipilä et al. (2015) i.e. abundances are much higher at late times and this is attributed due to the depletion of their main reaction partners (e.g., CO) onto grain surfaces.
3 Results and discussion
3.1 General trends of deuterium chemistry
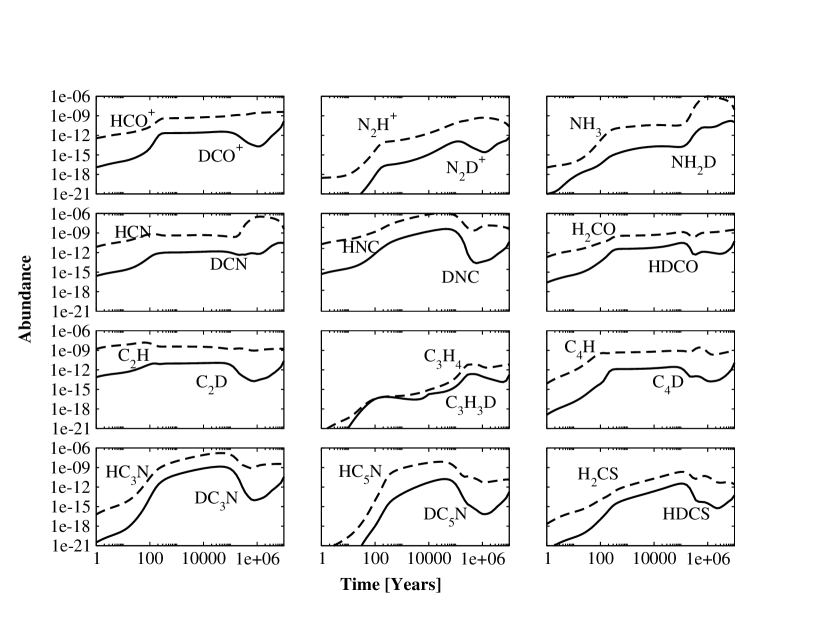
Using the model described above, we have investigated general trends of deuterium chemistry in the ISM. For this purpose, we selected two deuterated ions (DCO+, N2D+) and several deuterated neutrals (NH2D, DCN, DNC, HDCO, C2D, C3H3D, C4D, DC3N, DC5N, HDCS) as they have been observed in TMC-1 (see for instance Albertsson et al., 2013, and references therein). The abundances predicted by our model are shown in Fig. 4 as a function of time. Our model shows that the abundance of HCO+ increases with time and its formation is very efficient after 102 years due to the reaction between HOC+ and o-H2. Around this time, most of the gas phase H2 is in the form of o-H2. For DCO+, we observe a very rapid fall in abundance between 105 and 106 years. Around this time, H2O becomes an efficient destruction partner of DCO+ since the formation of H2O is very efficient (due to its highly abundant precursors H3O+ and o-H2). After 106 years, we observe an increase in abundance for DCO+ due its efficient formation via the reaction o-H2D+ + CO. Since around this time o-H2D+ becomes highly abundant due to low opr(H2). For the other deuterated ion N2D+, we observe a similar trend as with DCO+. Between 105 and 106 years, N2D+ is destroyed efficiently by H2O to form H2DO+. Similarly, after 106 years, rapid formation of N2D+ is due to the efficient formation via the reaction of o-H2D+ + N2.
Among the deuterated neutrals, we observe a slightly different behaviour for NH2D and C3H3D as compared to deuterated ions. For NH3 and NH2D, we find an increase in the abundances after 105 years. Around this time both NH3 and NH2D are formed via the dissociative recombination reactions of NH4+ and NH3D+. Both these ions are formed back again from various ion-molecular destruction reactions of NH3 and NH2D by the ions HCO+, H3O+. After 106 years, the abundance of NH3 drops quickly due its efficient depletion onto grain surface. But C3H4 and C3H3D show an increase in abundance in between 105 and 106 years due to their efficient formation via the barrier-less surface reactions s-H + s-C3H3 and s-H + s-C3H2D (here, ‘s’ represents species on the surface of grains). For the rest of the deuterated neutrals, we observe a general trend between 105 and 106 years i.e. abundances decrease. DNC, which is an isomer of DCN, shows a decrease in abundance around this time by several orders of magnitude. This is due to the efficient destruction of DNC by highly abundant p-H3+. HCN shows a peak in the abundance at 106 year due to its high abundant precursors H2CN+ and p-H2. HDCO is less destroyed than the other species at later times because its main destruction path is O + HDCO. DC3N, DC5N, HDCS, on the contrary, show a rapid fall in the abundance in between 105 and 106 years due to their efficient destruction by highly abundant p-H3+ and HCO+. In Table 2, we have listed major reactions of production and destruction for these species at high and low opr(H2) regimes.
| Species | Formation | Destruction | Formation | Destruction |
| ( yr) | ( yr) | ( yr) | ( yr) | |
| NH2D | NH3D+ + e- H+ NH2D | H3O+ + NH2D NH3D+ + H2O | NH3D+ + e- H + NH2D | H+ + NH2D NH2D+ + H |
| HCO+ + NH2D NH3D+ + CO | HCO+ + NH2D NH3D+ + CO | |||
| HDCO | O + CH2D HDCO + H | O + HDCO H + CO + OD | s-H + s-DCO HDCO | HCO+ + HDCO H2DCO+ + CO |
| O + HDCO D + CO + OH | p-H3+ + HDCO H3CO+ + HD | |||
| DCN | CH2D+ + HC3N DCN + c-C3H3+ | CH3+ + DCN C2H3DN+ | HDCN+ + p-H2p-H3+ + DCN | HCO+ + DCN HDCN+ + CO |
| N + DCO DCN + O | p-H3+ + DCN H2CN+ + HD | |||
| N + CHD DCN + H | o-H3+ + DCN HDCN+ + o-H2 | |||
| DNC | N + CHD DNC + H | p-H3+ + DNC H2CN+ + HD | C + NHD DNC + H | HCO+ + DNC HDCN+ + CO |
| HCO+ + DNC HDCN+ + CO | p-H3+ + DNC H2CN+ + HD | |||
| o-H3+ + DNC HDCN+ + o-H2 | o-H3+ + DNC HDCN+ + o-H2 | |||
| C2D | C + CHD C2D + H | O + C2D CD + CO | C2H2D+ + e- C2D + H + H | C2D + C3 C5 + D |
| C +C3D C2D + CO | C2D + C3C5 +D | |||
| C4D | C + c-C3HD C4D + H | C + C4D C5+ D | C + c-C3HD C4D + H | HCO+ + C4D C4HD+ + CO |
| O + C4D C3D+ CO | p-H3+ + C4D C4H2+ +HD | |||
| o-H3+ + C4D C4H2+ +HD | ||||
| DCO+ | HCO+ + D DCO+ + H | DCO+ + H2O H2DO+ + CO | o-H2D+ + CO DCO+ + o-H2 | DCO+ + e- CO + D |
| CH2D+ + O DCO+ + o-H2 | DCO+ + C CD+ + CO | HCO+ + D DCO+ + H | DCO+ + H2O H2DO+ + CO | |
| DCO+ + HCN HDCN+ + CO | ||||
| N2D+ | N2H+ + D N2D+ + H | N2D+ + H2O H2DO+ + N2 | o-H2D+ + N2 N2D+ + o-H2 | N2D+ + CO DCO+ + N2 |
| N2D+ + CO DCO+ + N2 | p-H2D+ + N2 N2D+ + p-H2 | |||
| N2H+ + D N2D+ + H | ||||
| c-C3HD | c-C3H2D+ + e- c-C3HD + H | C + c-C3HD C4D + H | H + C3H3D c-C3HD + o-H2 | HCO+ + c-C3HDC3H2D+ + CO |
| C + c-C3HD C4H + D | H + C3H3D c-C3HD + p-H2 | p-H3+ C3H3+ + HD | ||
| C3H3D | s-H + s-C3H2D C3H3D | C + C3H3D C4H2D + H | s-H + s-C3H2D C3H3D | C + C3H3D C4H2D + H |
| C + C3H3D C4H2 + HD | C + C3H3D C4H2 + HD | |||
| DC3N | C + CHDCN DC3N + H | p-H3+ + DC3N HC3NH+ + HD | C + CHDCN DC3N + H | HCO+ + DC3N C3HDN+ + CO |
| o-H3+ + DC3N HC3NH+ + HD | C3HDN+ + e- DC3N + H | p-H3+ + DC3N HC3NH+ + HD | ||
| DC5N | C5H2DN+ + e- DC5N + o-H2 | p-H3+ + DC5N H2C5N+ + HD | CN + C4HD DC5N + H | HCO+ + DC5N C5HDN+ + CO |
| o-H3+ + DC5N H2C5N+ + HD | p-H3+ + DC5N H2C5N+ + HD | |||
| HDCS | S + CH2D H + HDCS | p-H3+ + HDCS H3CS+ + HD | S + CH2D H + HDCS | HCO+ + HDCS H2DCS+ + CO |
| HCO+ + HDCS H2DCS+ + CO | p-H3+ + HDCS H3CS+ + HD |
3.2 Gas phase D/H ratios in TMC-1: comparison with observations and previous models
In the past, molecular D/H ratios observed towards TMC-1 were compared by various gas-grain chemical models (see for instance Roberts & Millar (2000b), Albertsson et al. (2013)). Roberts & Millar (2000b) have studied the chemical evolution with deuterium fractionation for temperatures 10100 K and densities cm-3. They used a time-dependent gas-phase model based on the UMIST’95 database. Their chemical network consists of 300 species linked by 5 000 reactions, and only includes singly deuterated species and limited surface chemistry for H2 and HD. Recently, Albertsson et al. (2013) have also studied deuterium fractionation with their newly constructed chemical network, which contains 55000 reactions in gas phase. But they restricted their study to avoid reactions with -OH end groups and also they did not consider spin chemistry of H2, H2+, and H3+ and their isotopologues. We did the same type of comparison but using our more complete model. In Table 3, we report molecular D/H ratios for several deuterated species observed in different positions of TMC-1 together with the abundances obtained with our model at yrs. For comparison, we also list the molecular D/H ratios reported by Roberts & Millar (2000b) and Albertsson et al. (2013) for the same physical conditions and the same age.
Our modelled abundances are in reasonable agreement with the observed ones. The D/H ratios predicted by our model are slightly smaller than the ones reported by Roberts & Millar (2000b), Albertsson et al. (2013). This can be explained by the fact that our network includes essential spin chemistry to take into account deuterium fractionation properly and the others not. Considering ortho and para species, reaction (1) becomes efficient in the backward direction. This results in efficient destruction of H2D+ which in turn globally reduces the abundances of deuterated species. This is the reason why we observe smaller molecular D/H ratios as compared to the other models.
.
Species
Our model
Roberts & Millar (2000a)
Albertsson et al. (2013)
Observation
Observed Position
& Refs.
NH2D/NH3
4.3
8.4
5.2
9.0 - 1.4
TMC1-N (1)
HDCO/H2CO
2.1
4.2
2.3
5.9 - 1.1
TMC1-CP (2 )
DCN/HCN
0.4
0.9
2.4
2.3
TMC1-CP (3)
DNC/HNC
0.6
1.5
1.6
1.5
TMC1-CP (2 )
C2D/C2H
0.4
1.1
1.5
1.0
TMC1-CP (4)
C4D/C4H
2.3
0.4
1.0
4.0
TMC1-CP (5)
DCO+/HCO+
0.3
1.9
1.8
2.0
TMC1-N (1)
N2D+/N2H+
0.2
2.5
0.8
8.0
TMC1-N (1)
c-C3HD/c-C3H2
1.6
0.6
1.3
8.0 - 1.6
TMC1-CP ( 6)
C3H3D/C3H4
4.4
8.3
1.6
5.4 - 6.5
TMC1-CP (7)
DC3N/HC3N
0.7
0.7
0.9
3.0 - 1.0
TMC1-CP (8)
DC5N/HC5N
0.3
2.3
1.2
1.3
TMC1-CP (9 )
HDCS/H2CS
1.6
4.0
1.8
2.0
TMC1-CP (10)
c-C3D2/c-C3HD
0.5
-
-
4
TMC1-C (11)
References: 1: Tiné et al. (2000); 2: Turner (2001); 3: Wootten (1987); 4: Millar
et al. (1989); 5: Turner (1989); 6: Bell et al. (1988); 7: Gerin et al. (1992); 8:
Howe et al. (1994); 9. MacLeod
et al. (1981); 10. Minowa et al. (1997); 12. Spezzano
et al. (2013)
Positions: TMC1-CP ( = 04h 41m 41s.88, = +25∘ 41m 27s), TMC1-N ( = 04h 41m 21s.01, = +25∘ 48m 11s),
TMC1-C ( = 04h 41m 16s.1, = +25∘ 49m 43.8s).
3.3 Effect of essential spin chemistry and deuteration on the observed non-deuterated species in TMC-1
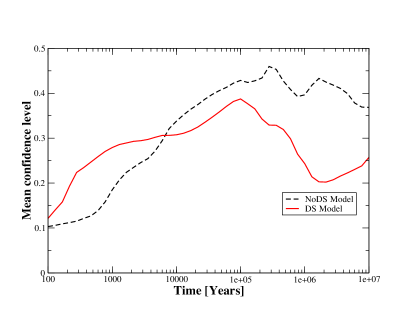
One of the goals of this study is to quantify the effect of essential spin chemistry and deuteration on the abundances of non-deuterated species. For that, we have run two models: (1) with deuteration and spin chemistry (DS) and (2) without deuteration and spin chemistry (NoDS). We then focus on the gas-phase species observed in the cold core TMC-1. In Table 4, we report the observed abundances in TMC-1 collected by Agúndez & Wakelam (2013) together with the abundances predicted by our two models. To define the “chemical age" for TMC-1 for both models, we have calculated the mean confidence level following the prescription of Garrod et al. (2007) to fit with the TMC-1 observations. First, we construct a log-normal distribution about each observational value, and then identify its defining standard deviation, , with an appropriate error factor (erf) on the observed value. Finally, the “confidence", , that the modelled abundance (, for species ) is associated with the observed value () is defined as:
| (2) |
where erfc is the complementary error function (erfc = 1 - erf); ranges between zero and unity. In our case, we define , hence 1 standard deviation corresponds to one order of magnitude higher or lower than the observed value. Fig. 5 represents the mean confidence level calculated using the method described above. As it can be seen, the DS model (37%) has a strong impact on the general confidence level as compared to the NoDS model (45%) at its maximum. The use of the DS model suggests a best fit chemical age for TMC-1 of 105 year whereas the NoDS model gives year. At the time of best agreement, for both the DS and NoDS models, 50% and 60% of the observed species in TMC-1 are reproduced within factor of 10. But all these estimates are very much dependent on the initial opr(H2) and our estimates are only valid for the initial statistical ratio of 3:1. For example, in order to perform more realistic age estimates for TMC-1, it needs to be done in the context of parameter-space exploration with assumed opr(H2) and this is out of scope of the current work. In Table 4, we have reported abundances for all the observed non-deuterated species using the above two models at their best chemical age.
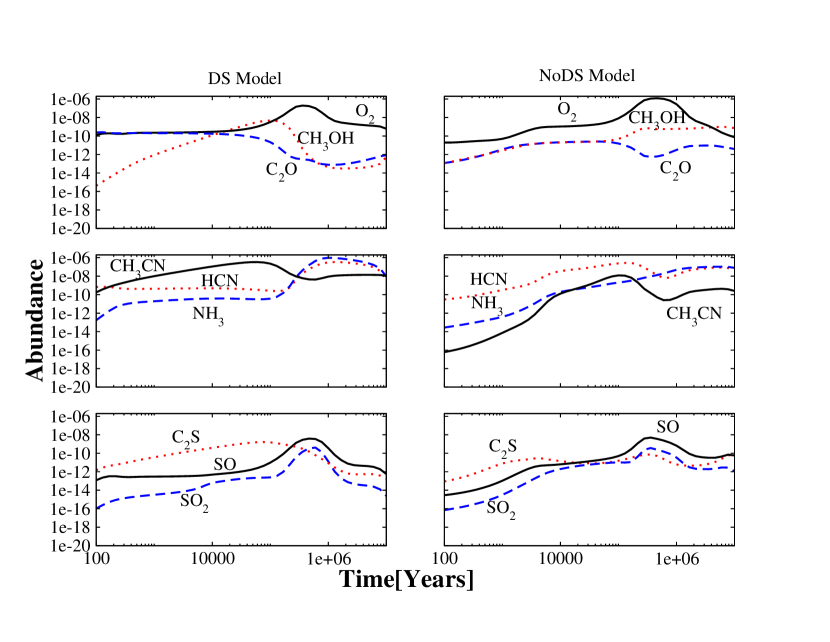
By investigating closely, we found three types of differences: (1) DS model results different from NoDS but in better agreement with the TMC-1 observation as compared to NoDS (Case I); (2) DS model results different from NoDS but in less agreement with the TMC-1 observation as compared to NoDS (Case II); (3) differences between the two models and the observations are both within a factor of 10 (Case III).The differences between the agreements are caused by changes in the chemical time scales. This can be clearly seen from Fig. 6 where we have shown the most affected oxygen, nitrogen and sulphur bearing species for which the chemical time scales for reaching their peak have changed. Here we will focus on the detailed chemistry for Case I and Case II, which shows the effect of deuteration and ortho-para chemistry on the observed non-deuterated species. For Case I, we found molecules such as O2, CH3OH, C2O, H2C4, HC5N, C2S, C6H-, C8H- and for Case II, we found CH3C2H, NH3, HCN, CH3CN, CH2CHCN, SO, SO2. The rest of the species belong to Case III.
Among the Case I species, O2 forms via the gas phase reaction O + OH in both models. But in model DS, as can be seen from Table 4, the abundance of OH is almost 10 times lower than in the NoDS model, which in turn produces less O2. In the DS model, OH forms via the gas phase photodissociation of H2O and by the neutral-neutral reaction O+ H2COH + OH + CO which has an activation barrier while in the NoDS model, OH forms via the fast dissociative recombination of H3O+. CH3OH forms via the dissociative recombination reaction of CH3OH2+ in the gas phase at 105 years in the DS model whereas in the NoDS model, it forms via the surface reaction s-H + s-CH3O and is destroyed rapidly via the barrier-less gas phase reaction CH3OH + C. Reaction s-H + s-CH3O becomes the main production reaction from 106 year in model DS i.e. well after the gas phase spin conversion of ortho to para H2. C2O is produced in model DS as well as in model NoDS via the gas phase reaction C + HCO. But we found that C2O is more abundant in the DS model as compared to the NoDS model. This is due to the chemistry of HCO. HCO produced in the NoDS model via the grain surface reaction s-H + s-CO which has a high activation barrier of 2500 K and in the DS model, it is produced via the barrier-less reaction CH2 + O. We produce less C4H2 in model DS due to the highly efficient destruction of this species via the barrier-less gas phase reaction C + C4H2 whereas in the NoDS model, this destruction process is not very efficient. For HC5N, we have better agreement with the observation and also it is more abundant in model DS than the NoDS. In both models, HC5N forms via the dissociative recombination of H2C5N+. But in model DS, HC5N efficiently destroyed by p-H3+ to form H2C5N+ which recombine again to form HC5N. For C2S, we observe that it is more abundant in DS model than NoDS model. This is due to the effect of the barrier-less gas phase reaction O + C2S. This reaction destroys C2S more rapidly in NoDS model as compared to the DS model. Among the anions, C6H- and C8H- both are efficiently produced in model DS as compared to NoDS. Since in model DS, the rate of production via the dissociative recombination reactions of C6H and C8H is very high due to high opr(H2).
Among the case II species, CH3C2H is produced efficiently in model NoDS due to its formation on the surface via the barrier-less reaction s-H + s-CH2CCH. Among the others, the chemistry of NH3 and HCN is already been discussed in our earlier section. For CH3CN, we observe a very high abundance in model DS as compared to the NoDS model. CH3CN is produced by the dissociative recombination reaction of CH3CNH+ in both models but in model NoDS, it is destroyed by severals other ion-molecule reactions with HCO+, H3+, H3O+, C+ whereas in model DS, it is only destroyed by p-H3+. We observe that CH2CHCN is less abundant in model DS since it is destroyed by several reactions of ortho and para H to form C3H3NH+ whereas in the NoDS model, it is destroyed mainly by HCO+. SO is mainly produced by the neutral-neutral reaction S + OH in model DS and OH is among the highly affected species in model DS. This corresponds to the decrease in abundance of SO in model DS. For SO2, it is formed on the surface in DS model via the reaction s-O + s-SO whereas in model NoDS, it is formed by the neutral-neutral gas phase reactions OH + SO, O + SO. But its decrease in abundance in DS model is due to the efficient gas phase destruction reaction C + SO2. The decrease in the abundance of NS in model DS as compared to NoDS is due to the efficient destruction by the various atoms i.e. C, O, N.
.
Species
TMC-1
NoDS
DS
Species
TMC-1
NoDS
DS
OH
3(-7)
3.2(-8)
2.6(-9)
*NH3
2.45(-8)
6.6(-9)
3.7(-11)
H2O
7(-8)
3.1(-7)
1.8(-5)
N2H+
2.8(-10)
7.9(-11)
7.5(-11)
*O2
7.7(-8)
7.3(-7)
3.2(-9)
CN
7.4(-10)
2.7(-8)
9.4(-9)
CO
1.7(-4)
6.0(-5)
6.7(-5)
*HCN
1.1(-8)
8.7(-8)
2.6(-10)
HCO+
9.3(-9)
4.2(-9)
1.0(-9)
HNC
2.6(-8)
3.1(-8)
4.8(-8)
H2CO
5(-8)
1.2(-8)
1.4(-9)
*CH3OH
3.2(-9)
7.3(-10)
4.8(-9)
*CH3CN
6(-10)
4.2(-10)
2.2(-7)
*C2O
6(-11)
6.9(-13)
2.1(-11)
CH2CHCN
1(-9)
1.2(-11)
1.3(-12)
CH2CO
6(-10)
9.0(-10)
2.0(-10)
C3N
6(-10)
1.9(-9)
8.6(-10)
CH3CHO
6(-10)
2.3(-12)
5.3(-12)
HC3N
1.6(-8)
1.0(-8)
1.0(-7)
C3O
1(-10)
7.7(-9)
7.9(-10)
HNC3
3.8(-11)
4.1(-10)
3.6(-10)
CH
2.0(-8)
2.0(-9)
3.5(-9)
C2H
7.2(-9)
3.1(-9)
1.5(-9)
-C3H
1.03(-9)
3.2(-9)
2.8(-9)
-C3H
8.4(-11)
2.4(-9)
1.5(-9)
C5N
3.1(-11)
2.1(-10)
5.6(-11)
-C3H2
5.8(-9)
2.6(-8)
2.6(-10)
HC5N
4(-9)
4.8(-10)
1.03(-9)
-C3H2
2.1(-10)
2.1(-8)
9.2(-9)
CH3C5N
7.4(-11)
4.8(-13)
5.1(-12)
CH3C2H
6(-9)
2.7(-10)
8.4(-12)
HC7N
1(-9)
3.9(-11)
1.7(-10)
HC9N
5(-10)
1.3(-12)
5.8(-11)
C4H
7.1(-8)
1.0(-9)
8.0(-10)
C4H-
3.7(-12)
1.7(-11)
1.9(-11)
NO
2.7(-8)
7.0(-8)
6.8(-10)
H2C4
7(-10)
2.7(-8)
1.9(-11)
HNCO
4(-10)
3.2(-13)
4.0(-11)
C5H
8(-10)
5.2(-10)
1.0(-10)
CH3C4H
1(-9)
6.1(-11)
3.8(-11)
C6H
4.1(-10)
3.7(-11)
3.7(-11)
H2S
5(-10)
4.5(-11)
2.1(-10)
C6H-
1.0(-11)
4.2(-12)
1.0(-11)
CS
2.9(-9)
2.6(-9)
2.2(-9)
H2C6
4.7(-11)
9.7(-11)
6.8(-12)
HCS+
3(-10)
2.7(-12)
2.0(-12)
C8H
4.6(-11)
9.3(12)
1.4(-11)
H2CS
7(-10)
1.37(-10)
2.1(-10)
C8H-
2.1(-12)
8.1(-13)
2.3(-12)
*C2S
7(-9)
6.8(-11)
1.5(-9)
C3S
1(-9)
6.2(-10)
4.7(-10)
OCS
2.2(-9)
2.7(-10)
6.0(-10)
*SO
1.5(-9)
3.9(-9)
9.6(-12)
NS
8.0(-10)
3.6(-11)
1.6(-13)
*SO2
3(-10)
2.4(-10)
2.4(-13)
a(b) refers to a 10b.
Abundances correspond to the positions TMC-1 = 04h 41m 41s.88, = +25∘ 41m 27s (cyanopolyyne peak). See Agundez & Wakelam (2013) for more details.
DS refers to modelled abundances with deuteration and spin chemistry taken into account
NoDS refers to modelled abundances without deuteration and spin chemistry
* Fig. 6 shows that the shift in the chemical time scale for the affected species (bold face) to reach the peak abundances.
3.4 Some new observable deuterated species in TMC-1 from our model
In Table 5, we list a set of potentially new observable deuterated species in TMC-1. For predicting the observability (in the frequency range of 73- 180 GHz) of all the species (for which frequencies are known) listed in Table 5, we have used the CASSIS555http://cassis.irap.omp.eu interactive spectrum analyser to calculate the line intensities under local thermodynamic equilibrium (LTE) conditions (though LTE might not be reasonable for some of those transitions at 104 cm-3, see for other alternatives in Liszt & Pety (2016)). For our calculations, we assume excitation temperature= 5 K (to take into account the fact that the populations of the molecular levels might not be at LTE), FWHM= 1 km/s, H2 column density = 1022 cm-2 and no beam dilution to simulate typical dark cloud conditions. We list only the brightest transitions along with their Einstein coefficients and upper level energies in Table 5.
| Species | Line | Aij [s-1] | Eup [K] | Frequency [GHz] | n(x)/n(H) | Line Intensity [K] |
|---|---|---|---|---|---|---|
| c-C3D | 3 1 3 2 1 2 | 2.2(-7) | 9.41 | 116.73 (JPL) | 2.0(-10) | 0.18 |
| l-C3HD | 4 0 4 3 0 3 | 4.05(-5) | 9.30 | 77.52 (CDMS) | 1.4(-10) | 0.055 |
| CH2ND | 2 0 2 1 0 1 | 5.4(-6) | 8.43 | 117.08 (JPL) | 3.2(-11) | 0.005 |
| DNCCC | 9 8 7 8 8 8 | 1.9(-8) | 19.01 | 79.20 (JPL) | 5.2(-11) | 0.019 |
| C4HD | 9 0 9 8 0 8 | 4.11(-5) | 18.30 | 76.27 (CDMS) | 2.3(-9) | 0.13 |
| DNO | 2 0 2 1 0 1 | 5.0(-6) | 10.52 | 146.117 (JPL) | 1.7(-11) | 0.003 |
| The table is limited to species with relative abundances . | ||||||
| a(b) refers to a 10b. | ||||||
4 Conclusions
In this work, we present the first publicly available chemical network of multiply deuterated species along with spin chemistry of H2, H2+, H3+ and their isotopologues. We also benchmarked our new model by comparing with existing works. Observed molecular D/H ratios at different positions of TMC-1 have been compared with our new comprehensive astrochemical model. By introducing an extensive description of deuteration along with nuclear spin state processes, we found that the chemical time scale for reaching the peak abundance of some non-deuterated species has changed by a factor of a few in some cases. Finally, we report a new set of potentially observable deuterated species in TMC-1.
Acknowledgements
LM, PG, MR, VW, FH thanks ERC starting grant (3DICE, grant agreement 336474) for funding during this work. PG postdoctoral position is funded by the INSU/CNRS. VW, AD, SG, FH also acknowledge the CNRS programme PCMI for funding of their research. We would like to thank the anonymous referee for constructive comments that helped to improve the manuscript.
References
- Agúndez & Wakelam (2013) Agúndez M., Wakelam V., 2013, Chemical Reviews, 113, 8710
- Aikawa et al. (2012) Aikawa Y., Wakelam V., Hersant F., Garrod R. T., Herbst E., 2012, ApJ, 760, 40
- Albertsson et al. (2013) Albertsson T., Semenov D. A., Vasyunin A. I., Henning T., Herbst E., 2013, ApJS, 207, 27
- Albertsson et al. (2014a) Albertsson T., Semenov D., Henning T., 2014a, ApJ, 784, 39
- Albertsson et al. (2014b) Albertsson T., Indriolo N., Kreckel H., Semenov D., Crabtree K. N., Henning T., 2014b, ApJ, 787, 44
- Bacmann (2004) Bacmann A., 2004, Baltic Astronomy, 13, 402
- Bell et al. (1988) Bell M. B., Avery L. W., Matthews H. E., Feldman P. A., Watson J. K. G., Madden S. C., Irvine W. M., 1988, ApJ, 326, 924
- Bergin et al. (1999) Bergin E. A., Neufeld D. A., Melnick G. J., 1999, ApJ, 510, L145
- Bergin et al. (2013) Bergin E. A., et al., 2013, Nature, 493, 644
- Bergman et al. (2011) Bergman P., Parise B., Liseau R., Larsson B., 2011, A&A, 527, A39
- Bottinelli et al. (2014) Bottinelli S., Wakelam V., Caux E., Vastel C., Aikawa Y., Ceccarelli C., 2014, MNRAS, 441, 1964
- Caselli et al. (2003) Caselli P., van der Tak F. F. S., Ceccarelli C., Bacmann A., 2003, A&A, 403, L37
- Caselli et al. (2008) Caselli P., Vastel C., Ceccarelli C., van der Tak F. F. S., Crapsi A., Bacmann A., 2008, A&A, 492, 703
- Ceccarelli et al. (2014) Ceccarelli C., Caselli P., Bockelée-Morvan D., Mousis O., Pizzarello S., Robert F., Semenov D., 2014, Protostars and Planets VI, pp 859–882
- Chabot et al. (2013) Chabot M., Béroff K., Gratier P., Jallat A., Wakelam V., 2013, ApJ, 771, 90
- Coutens et al. (2012) Coutens A., et al., 2012, A&A, 539, A132
- Coutens et al. (2014) Coutens A., et al., 2014, MNRAS, 445, 1299
- Das et al. (2015) Das A., Majumdar L., Sahu D., Gorai P., Sivaraman B., Chakrabarti S. K., 2015, ApJ, 808, 21
- Demyk et al. (2010) Demyk K., Bottinelli S., Caux E., Vastel C., Ceccarelli C., Kahane C., Castets A., 2010, A&A, 517, A17
- Dutrey et al. (2011) Dutrey A., et al., 2011, A&A, 535, A104
- Faure et al. (2013) Faure A., Hily-Blant P., Le Gal R., Rist C., Pineau des Forêts G., 2013, ApJ, 770, L2
- Flower et al. (2004) Flower D. R., Pineau des Forêts G., Walmsley C. M., 2004, A&A, 427, 887
- Flower et al. (2006) Flower D. R., Pineau Des Forêts G., Walmsley C. M., 2006, A&A, 449, 621
- Garrod et al. (2007) Garrod R. T., Wakelam V., Herbst E., 2007, A&A, 467, 1103
- Gerin et al. (1992) Gerin M., Combes F., Wlodarczak G., Encrenaz P., Laurent C., 1992, A&A, 253, L29
- Guelin et al. (1977) Guelin M., Langer W. D., Snell R. L., Wootten H. A., 1977, ApJ, 217, L165
- Guilloteau et al. (2006) Guilloteau S., Piétu V., Dutrey A., Guélin M., 2006, A&A, 448, L5
- Hasegawa & Herbst (1993) Hasegawa T. I., Herbst E., 1993, MNRAS, 261, 83
- Hasegawa et al. (1992) Hasegawa T. I., Herbst E., Leung C. M., 1992, ApJS, 82, 167
- Hincelin et al. (2011) Hincelin U., Wakelam V., Hersant F., Guilloteau S., Loison J. C., Honvault P., Troe J., 2011, A&A, 530, A61
- Howe et al. (1994) Howe D. A., Millar T. J., Schilke P., Walmsley C. M., 1994, MNRAS, 267, 59
- Huang & Öberg (2015) Huang J., Öberg K. I., 2015, ApJ, 809, L26
- Hugo et al. (2009) Hugo E., Asvany O., Schlemmer S., 2009, J. Chem. Phys., 130, 164302
- Linsky et al. (2006) Linsky J. L., et al., 2006, ApJ, 647, 1106
- Lis et al. (2002) Lis D. C., Roueff E., Gerin M., Phillips T. G., Coudert L. H., van der Tak F. F. S., Schilke P., 2002, ApJ, 571, L55
- Liszt & Pety (2016) Liszt H. S., Pety J., 2016, ApJ, 823, 124
- Loison et al. (2014a) Loison J.-C., Wakelam V., Hickson K. M., Bergeat A., Mereau R., 2014a, MNRAS, 437, 930
- Loison et al. (2014b) Loison J.-C., Wakelam V., Hickson K. M., 2014b, MNRAS, 443, 398
- Loren & Wootten (1985) Loren R. B., Wootten A., 1985, ApJ, 299, 947
- MacLeod et al. (1981) MacLeod J. M., Avery L. W., Broten N. W., 1981, ApJ, 251, L33
- Majumdar et al. (2014a) Majumdar L., Das A., Chakrabarti S. K., 2014a, A&A, 562, A56
- Majumdar et al. (2014b) Majumdar L., Das A., Chakrabarti S. K., 2014b, ApJ, 782, 73
- Majumdar et al. (2016) Majumdar L., Gratier P., Vidal T., Wakelam V., Loison J.-C., Hickson K. M., Caux E., 2016, MNRAS, 458, 1859
- Margulès et al. (2010) Margulès L., et al., 2010, ApJ, 714, 1120
- Miettinen et al. (2012) Miettinen O., Harju J., Haikala L. K., Juvela M., 2012, A&A, 538, A137
- Millar et al. (1989) Millar T. J., Bennett A., Herbst E., 1989, ApJ, 340, 906
- Minowa et al. (1997) Minowa H., Satake M., Hirota T., Yamamoto S., Ohishi M., Kaifu N., 1997, ApJ, 491, L63
- Neufeld et al. (2005) Neufeld D. A., Wolfire M. G., Schilke P., 2005, ApJ, 628, 260
- Öberg et al. (2015) Öberg K. I., Furuya K., Loomis R., Aikawa Y., Andrews S. M., Qi C., van Dishoeck E. F., Wilner D. J., 2015, ApJ, 810, 112
- Oka (2004) Oka T., 2004, Journal of Molecular Spectroscopy, 228, 635
- Pagani et al. (2009) Pagani L., et al., 2009, A&A, 494, 623
- Parise et al. (2004) Parise B., Castets A., Herbst E., Caux E., Ceccarelli C., Mukhopadhyay I., Tielens A. G. G. M., 2004, A&A, 416, 159
- Parise et al. (2011) Parise B., Belloche A., Du F., Güsten R., Menten K. M., 2011, A&A, 526, A31
- Parise et al. (2012) Parise B., et al., 2012, A&A, 542, L5
- Qi et al. (2008) Qi C., Wilner D. J., Aikawa Y., Blake G. A., Hogerheijde M. R., 2008, ApJ, 681, 1396
- Reboussin et al. (2014) Reboussin L., Wakelam V., Guilloteau S., Hersant F., 2014, MNRAS, 440, 3557
- Roberts & Millar (2000a) Roberts H., Millar T. J., 2000a, A&A, 361, 388
- Roberts & Millar (2000b) Roberts H., Millar T. J., 2000b, A&A, 364, 780
- Roueff et al. (2000) Roueff E., Tiné S., Coudert L. H., Pineau des Forêts G., Falgarone E., Gerin M., 2000, A&A, 354, L63
- Ruaud et al. (2015) Ruaud M., Loison J. C., Hickson K. M., Gratier P., Hersant F., Wakelam V., 2015, MNRAS, 447, 4004
- Sipilä et al. (2013) Sipilä O., Caselli P., Harju J., 2013, A&A, 554, A92
- Sipilä et al. (2015) Sipilä O., Caselli P., Harju J., 2015, A&A, 578, A55
- Spezzano et al. (2013) Spezzano S., et al., 2013, ApJ, 769, L19
- Stark et al. (1999) Stark R., van der Tak F. F. S., van Dishoeck E. F., 1999, ApJ, 521, L67
- Talukdar & Ravishankara (1996) Talukdar R. K., Ravishankara A., 1996, Chemical Physics Letters, 253, 177
- Taquet et al. (2013) Taquet V., Peters P. S., Kahane C., Ceccarelli C., López-Sepulcre A., Toubin C., Duflot D., Wiesenfeld L., 2013, A&A, 550, A127
- Taquet et al. (2014) Taquet V., Charnley S. B., Sipilä O., 2014, ApJ, 791, 1
- Tiné et al. (2000) Tiné S., Roueff E., Falgarone E., Gerin M., Pineau des Forêts G., 2000, A&A, 356, 1039
- Turner (1989) Turner B. E., 1989, ApJ, 347, L39
- Turner (1990) Turner B. E., 1990, ApJ, 362, L29
- Turner (2001) Turner B. E., 2001, ApJS, 136, 579
- Turner & Zuckerman (1978) Turner B. E., Zuckerman B., 1978, ApJ, 225, L75
- Vastel et al. (2004) Vastel C., Phillips T. G., Yoshida H., 2004, ApJ, 606, L127
- Vastel et al. (2006) Vastel C., Caselli P., Ceccarelli C., Phillips T., Wiedner M. C., Peng R., Houde M., Dominik C., 2006, ApJ, 645, 1198
- Vastel et al. (2010) Vastel C., et al., 2010, A&A, 521, L31
- Wakelam et al. (2014) Wakelam V., Vastel C., Aikawa Y., Coutens A., Bottinelli S., Caux E., 2014, MNRAS, 445, 2854
- Wakelam et al. (2015a) Wakelam V., et al., 2015a, ApJS, 217, 20
- Wakelam et al. (2015b) Wakelam V., Loison J.-C., Hickson K. M., Ruaud M., 2015b, MNRAS, 453, L48
- Walmsley et al. (2004) Walmsley C. M., Flower D. R., Pineau des Forêts G., 2004, A&A, 418, 1035
- Watanabe et al. (2010) Watanabe N., Kimura Y., Kouchi A., Chigai T., Hama T., Pirronello V., 2010, ApJ, 714, L233
- Wootten (1987) Wootten A., 1987, in Vardya M. S., Tarafdar S. P., eds, IAU Symposium Vol. 120, Astrochemistry. pp 311–318
- van Dishoeck et al. (2003) van Dishoeck E. F., Thi W.-F., van Zadelhoff G.-J., 2003, A&A, 400, L1
- van der Tak et al. (2009) van der Tak F. F. S., Müller H. S. P., Harding M. E., Gauss J., 2009, A&A, 507, 347