Shedding Light on the Compton-thick Active Galactic Nucleus in the Ultra-luminous Infrared Galaxy UGC 5101 with Broadband X-ray Spectroscopy
Abstract
We report the broadband X-ray spectra of the ultra-luminous infrared galaxy (ULIRG) UGC 5101 in the 0.25–100 keV band observed with Swift/Burst Alert Telescope (BAT), NuSTAR, Suzaku, XMM-Newton, and Chandra. A Compton-thick AGN obscured with a hydrogen column density of cm-2 is detected above 10 keV. A spectral fit with a numerical torus model favors a large half opening angle of the torus, degrees, suggesting that the covering fraction of material heavily obscuring the X-ray source is moderate. The intrinsic 2–10 keV luminosity is determined to be erg s-1, which is 2.5 times larger than the previous estimate using only data below 10 keV with a simple spectral model. We find that UGC 5101 shows the ratio between the [O IV] 26 m line and 2–10 keV luminosities similar to those of normal Seyfert galaxies, along with other ULIRGs observed with NuSTAR, indicating that a significant portion of local ULIRGs are not really “X-ray faint” with respect to the flux of forbidden lines originating from the narrow line region (NLR). We propose a possible scenario that (1) the AGN in UGC 5101 is surrounded not only by Compton-thick matter located close to the equatorial plane but also by Compton-thin ( cm-2) matter in the torus-hole region and (2) it is accreting at a high Eddington rate with a steep UV to X-ray spectral energy distribution. Nevertheless, we argue that AGNs in many ULIRGs do not look extraordinary (i.e., extremely X-ray faint), as suggested by recent works, compared with normal Seyferts.
Subject headings:
galaxies: active – galaxies: individual (UGC 5101) – X-rays: galaxies1. Introduction
Ultra-luminous infrared galaxies (ULIRGs) radiate the bulk of their large luminosities (L 1012L⊙) as dust emission. This indicates that powerful energy sources, starbursts and/or active galactic nuclei (AGNs), are hidden behind dust. ULIRGs are dominant contributors to the cosmic infrared radiation density at (Caputi et al. 2007, Goto et al. 2010, Murphy et al. 2011). Thus, distinguishing the energy sources in ULIRGs is critical to unveil the history of star-formation and SMBH mass growth in the dust-obscured galaxy population of the early universe. ULIRGs are major mergers of gas-rich galaxies and have large amounts of concentrated molecular gas and dust in their nuclei (Sanders & Mirabel, 1996). Hard X-ray ( keV) observations (e.g., Teng et al. 2009, Teng et al. 2015) are very useful to unambiguously detect hidden, even Compton-thick (with a hydrogen column density of NH 1024 cm-2) AGNs in ULIRGs thanks to their strong penetrating power, unless it largely exceeds cm-2.
| Object | Redshift | log (log /) | ||||
|---|---|---|---|---|---|---|
| [Jy] | [Jy] | [Jy] | [Jy] | [ergs s-1] | ||
| (1) | (2) | (3) | (4) | (5) | (6) | (7) |
| UGC 5101 | 0.040 | 0.25 | 1.03 | 11.54 | 20.23 | 45.5 (12.0) |
Note. — (1) Object. (2) Redshift. (3)–(6) f12, f25, f60, and f100 are the IRAS FSC fluxes at 12, 25, 60, and 100 m, respectively. (7) Decimal logarithm of the infrared (81000 m) luminosity in ergs s-1 calculated as follows: D(Mpc)2 (13.48 + 5.16 + ) ergs s-1 (Sanders & Mirabel, 1996). The values in parentheses are the decimal logarithms of the infrared luminosities in units of solar luminosities.
UGC 5101 (0.040), the subject of this paper, is a well-studied nearby ULIRG with an infrared (8–1000 m) luminosity of LIR 1012L⊙ (Table 1). It is optically classified as a LINER based on systematic investigation of luminous infrared galaxies (Veilleux et al., 1995), but there are some arguments that obscured AGN signatures (i.e., Seyfert 2) are detected in optical spectra using some combination of optical emission lines (Goncalves et al., 1999; Yuan et al., 2010). Armus et al. (2004) detected high-excitation forbidden emission lines in the mid-infrared 5–30 m, such as [Ne V] 14.3 m and [O IV] 26 m, which are naturally explained by the so-called narrow line regions (NLRs) photoionized by an AGN (Robson, 1996). Signatures of an obscured AGN in UGC 5101 have been also seen in various methods, which do not rely on the emission from the NLRs, at the wavelengths of low dust extinction. A compact high surface-brightness emission was detected in the near-infrared 1–2 m (Scoville et al., 2000) and mid-infrared 12.5 m (Soifer et al., 2000), which may indicate the presence of a luminous AGN. Infrared 2.5–5 m (Imanishi et al., 2001; Imanishi & Maloney, 2003; Imanishi et al., 2008) and 5–35 m (Armus et al., 2004; Nardini et al., 2009; Veilleux et al., 2009) spectral shapes, including the broad polycyclic aromatic hydrocarbon (PAH) emission features, are naturally explained by a luminous obscured AGN that contributes importantly to the observed flux at 2.5–35 m. Millimeter interferometric observations using the Nobeyama Millimeter Array (NMA) showed an enhanced HCN J=1–0 to HCO+ J=1–0 emission-line flux ratio, compared to starburst-dominated galaxies (Imanishi et al., 2006), which is often seen in galaxies containing energetically important AGNs (Kohno, 2005; Krips et al., 2008). Radio VLBI very high-spatial-resolution observations at 18 cm also suggest the presence of a luminous AGN (Smith et al., 1998; Lonsdale et al., 2003).
The AGN contribution to the bolometric luminosity in UGC 5101 is yet uncertain, however. According to Armus et al. (2007), the estimated AGN contribution based on the mid-infrared NLR-originated forbidden emission lines is less than 10%, which is substantially smaller than those by other energy diagnostic methods using mid-infrared continuum slope and equivalent width of the PAH emission features, %. Because these mid-infrared lines emitted from the NLR are expected to be little affected by extinction, it is unlikely that weak NLR lines are attributed to dust absorption by interstellar gas in the host galaxy. Instead, a possible hypothesis is that the AGN in UGC 5101 is almost fully surrounded by dust located on inner scale with respect to the NLR, i.e., UGC 5101 contains a so called “buried AGN”. In a buried AGN, the NLR is under-developed compared to the majority of optical Seyfert galaxies because a large fraction of ionizing UV photons from the central AGN may be absorbed by dust at the very inner part before reaching the NLR. On the basis of 2–10 keV X-ray observations using XMM-Newton and Chandra, Imanishi et al. (2003) detected X-ray emission that is likely to originate in a Compton-thick AGN. They estimated the intrinsic (absorption-corrected) 2–10 keV luminosity to be erg s-1. 111This luminosity has been converted from the original value erg s-1 obtained for a Hubble constant of to that for . However, due to the limitation of the X-ray spectral coverage at 10 keV, large ambiguity remains about it. This source is also detected in the Swift/Burst Alert Telescope (BAT) 70-month survey covering the 14–195 keV band, and is listed as a Compton-thick AGN candidate (Ricci et al. 2015).
In this paper, we report the broadband X-ray spectra of UGC 5101 covering the 0.25–100 keV band, observed with Swift/BAT, NuSTAR, Suzaku, XMM-Newton, and Chandra. A combination of all available data provides us with an ideal opportunity to scrutinize the properties of such a Compton thick AGN in UGC 5101 in a much more reliable manner than in previous studies. We organize this paper as follows. Section 2 presents the details of the observations and reduction. Section 3 describes the results of spectral analysis. Section 4 discusses implications from our results. Section 5 states the conclusion of this paper. We adopt . The solar abundances by Anders & Grevesse (1989) and the photoelectric absorption cross-sections by Balucinska-Church & McCammon (1992) are assumed throughout this paper. All errors attached to spectral parameters correspond to 90% confidence limits for a single parameter of interest.
| Instrument | Observation ID | Start Time∗ | End Time∗ | Exposure∗ | |
|---|---|---|---|---|---|
| [UT] | [UT] | [ks] | |||
| Swift | BAT | SWIFT J0935.9+6120 | 2004 December 16 00:00 | 2010 September 30 23:59 | 13428.3 |
| NuSTAR | FPMA, FPMB | 60001068002 | 2014 March 21 22:26 | 2014 March 22 09:01 | 18.3 |
| Suzaku | XIS-0,1,2,3, HXD | 701002010 | 2006 March 31 04:18 | 2006 April 1 08:25 | 49.0 |
| 701002020 | 2006 October 31 18:19 | 2006 November 1 09:30 | 42.2 | ||
| XMM-Newton | EPIC-MOS1,2, EPIC-pn | 0085640201 | 2001 November 12 09:02 | 2001 November 12 18:35 | 33.9 |
| Chandra | ACIS | 2033 | 2001 May 28 07:02 | 2001 May 28 21:21 | 42.1 |
| Instrument | source radius | background radius | encircled energy fraction | net count rate | |
|---|---|---|---|---|---|
| [arcsec] | [arcsec] | [%] | [10-3 count s-1] | ||
| (1) | (2) | (3) | (4) | ||
| Swift | BAT | – | – | – | 0.01 |
| NuSTAR | FPMs | 50 | 50 | 68 | 8.51 |
| Suzaku | FI-XISs | 60 | 100 | 50 | 2.84 |
| BI-XIS | 60 | 100 | 44 | 2.16 | |
| XMM-Newton | EPIC-MOSs | 22.5 | 60 | 80 | 6.94 |
| EPIC-pn | 22.5 | 60 | 84 | 26.8 | |
| Chandra | ACIS | 8.8 | 9.8–24.6 | 96 | 8.71 |
Note. — (1) The radius of the extraction region for the source spectrum. (2) The radius (or inner and outer radii) of the extraction region for the background spectrum. (3) The encircled energy fractions at 4.5 keV for Suzaku, at 6 keV for XMM-Newton, and at 6 keV for Chandra. (4) The net count rate after background subtraction.
2. Observations and Data Reduction
We utilize the data observed with NuSTAR, Suzaku,
XMM-Newton, and Chandra.
To better constrain the broadband spectrum, we also use
the time-averaged spectrum obtained in the Swift/BAT 70-month survey
(http://swift.gsfc.nasa.
gov/results/bs70mon).
Table 2 lists the details of the observations.
The spectral extraction regions and net count rate
for each observatory are summarized in Table 3.
These are chosen to maximize the signal-to-noise (S/N) ratio
by considering the size of the point spread function, and to
minimize the contamination from other sources.
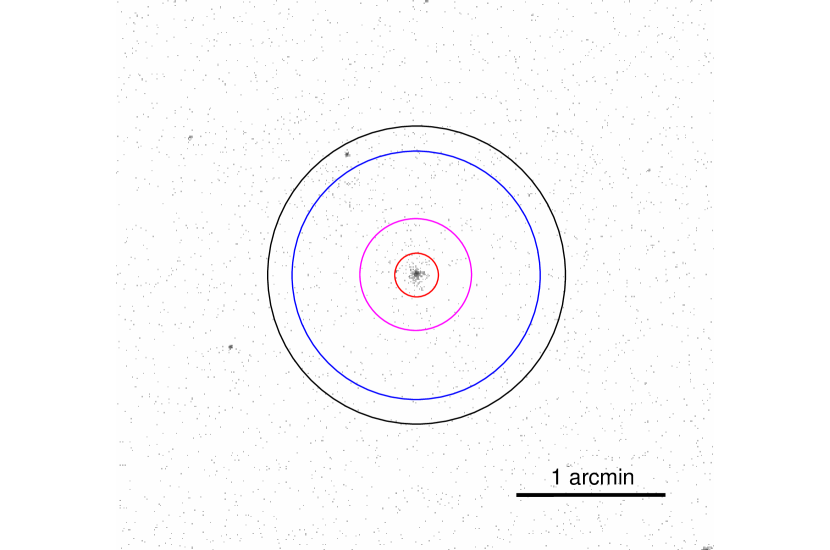
Figure 1 displays the Chandra image in the 0.3–7 keV band
centered at UGC 5101 (see Section 2.4 for detail), where the source extraction
regions are overlaid.
2.1. NuSTAR
The Nuclear Spectroscopic Telescope Array (NuSTAR) mission, launched on 2012 June 13, is the first focusing high-energy X-ray telescope, which covers the energy range of 3–78 keV (Harrison et al., 2013). It carries two co-aligned hard X-ray telescopes, each of which has its own focal plane module (FPMA and FPMB, FPMs). UGC 5101 was observed with NuSTAR on 2014 March 21 and 22 for a net exposure of 18.3 ksec. We reduce the data, using HEAsoft version 6.17 and calibration database version 2015 September 4. We use the scripts nupipeline and nuproducts to make the spectra of FPMA and FPMB. Photon events in a circular region with a radius of 50 arcsec around the target are selected. The background spectrum is extracted from a nearby source-free circular region with the same size as the source region. We have verified that the FPMA and FPMB spectra give fully consistent results including the normalizations. Then, to improve the photon statistics in a single spectrum, the data of FPMA and FPMB are combined by using the script addascaspec.
Figure 2 plots the background-subtracted NuSTAR light curves in the 3–8 and 8–24 keV bands. The bin size is set to be 5760 sec (96 minutes), the orbital period of the satellite, to avoid any possible modulation related to orbital phase. The source and background regions are the same as those used for the spectral extraction. The FPMA and FPMB light curves are summed by using the lcmath task. Performing a test to each light curve with a constant model, we find that time variability during the NuSTAR observation was not significant at confidence limits on timescales longer than 96 minutes in both energy bands.
2.2. Suzaku
Suzaku is the fifth observatory in a series of Japanese X-ray astronomy satellites (Mitsuda et al., 2007). It carries four X-ray CCD cameras called the X-ray Imaging Spectrometers (three Front-side-Illuminated XISs or FI-XISs, XIS-0, XIS-2, and XIS-3, and one Back-side-Illuminated XIS or BI-XIS, XIS-1, Koyama et al. 2007) and a non-imaging instrument that consist of Si PIN photo-diodes and Gadolinium Silicon Oxide (GSO) scintillation counters, called the Hard X-ray Detector (HXD, Takahashi et al. 2007). UGC 5101 was observed with Suzaku on 2006 March 31, April 1 and 2006 October 31, November 1 for exposures of 49.0 ksec and 42.2 ksec, respectively. We analyze the data in a standard manner, using HEAsoft version 6.17 and calibration database released on 2015 October 5.
2.2.1 XIS
The XISs cover the energy range below 10 keV. To extract the spectra, we accumulate photon events in the circle centered at the source with a radius of 60 arcsec. The background is taken from a source-free region in the field of view. In the source extraction region, the Chandra image (Figure 1) shows another, much fainter point-like source, whose distance from the target is arcsec, and therefore we add its estimated contribution to the background by analyzing the Chandra data. We confirm that the contribution of this source is negligible in the spectra of the other instruments, including NuSTAR/FPMs.
We sum up the spectra of XIS-0, XIS-2 and XIS-3, whereas the XIS-1 spectrum was treated independently. Since no significant variability in the spectra was found between the two observation epochs, we make the time averaged spectra by combining them.
2.2.2 HXD
We also examine the data of HXD/PIN, which covers the energy range of 14–70 keV and hence are suitable for detecting the transmitted component from a Compton-thick AGN. The “tuned” background file (version 2.0) released from the Suzaku team is used as the non Xray background (NXB), while the Cosmic X-ray Background (CXB) is estimated by assuming the spectral form presented in Boldt (1987). The response files ae_hxd_pinhxnome3_20080129.rsp and ae_hxd_pinflate3_20080129.rsp are used to estimate the source flux and the CXB, respectively.
No significant signals from UGC 5101 are detected with HXD/PIN. The count rate in the 15–40 keV after subtraction of the NXB and CXB is 0.00085 counts s-1, which is 0.30% of that of the NXB. The 3 upper limit on the count rates is 0.0085 counts s-1, which is 3% of the NXB rate (Fukazawa et al., 2009). This upper limit corresponds to a hard X-ray flux of erg cm-2 s-1 in the 15–40 keV band for Model Ib (see Section 3.1.2), which is 1.8 and 1.2 times larger than the actual fluxes measured with Swift/BAT and NuSTAR, respectively.
2.3. XMM-Newton
We analyze the XMM-Newton EPIC data obtained on 2001 November 12. To take into account the latest calibration, the data are reprocessed and analyzed by using the Science Analysis System (SAS) version 14.0.0 and the latest calibration files (CCF) as of 2015 October. We examine light curves of PATTERN=0 events in the energy range of 10–12 keV (for EPIC-pn) or above 10 keV (for EPIC-MOS), and find that the background fluxes are relatively stable, although some flux increases during the observation are seen. We apply no filter to discard such time intervals. The source and background spectra are extracted from a circular region with a radius of 22.5 arcsec and a source free region in the same CCD chip, respectively. Only PATTERN = 4 and PATTERN =12 events are used for EPIC-pn and EPIC-MOS, respectively. The redistribution matrix function (RMF) and auxiliary response file (ARF) are made using the SAS tasks rmfgen and arfgen.
2.4. Chandra
A Chandra observation of UGC 5101 was performed on 2001 May 28. The ACIS was operated in the FAINT mode. The Chandra data are reprocessed and analyzed using the Chandra Interactive Analysis of Observations (CIAO) software package version 4.7 combined with the calibration CALDB version 4.6.9. UGC 5101 is located in the ACIS-S3 back-illuminated CCD chip. The data are screened by applying the lc_clean script for the light curve in the 0.5–7 keV band of the whole ACIS-S3 excluding bright sources. Only the events with grade 0, 2, 3, 4, 6 are used in the following analysis. The source spectrum is extracted from a circular region with a radius of 8.8 arcsec centered at the position of UGC 5101. We find from the 0.3–7 keV image (Figure 1) that there is diffuse emission extending arcsec in the north-south direction and arcsec in the east-west direction around the point-like source. Most of these photon counts are also included in the spectral extraction region. The background spectrum is taken from an annular region around the source. The spectra, RMF and ARF are created by using the script specextract in the CIAO package. Benefiting from its unsurpassed high image quality (full width at half maximum arcsec), Chandra data are suitable for studying possible contamination from other sources (see Section 2.2.1).


3. Spectral Analysis
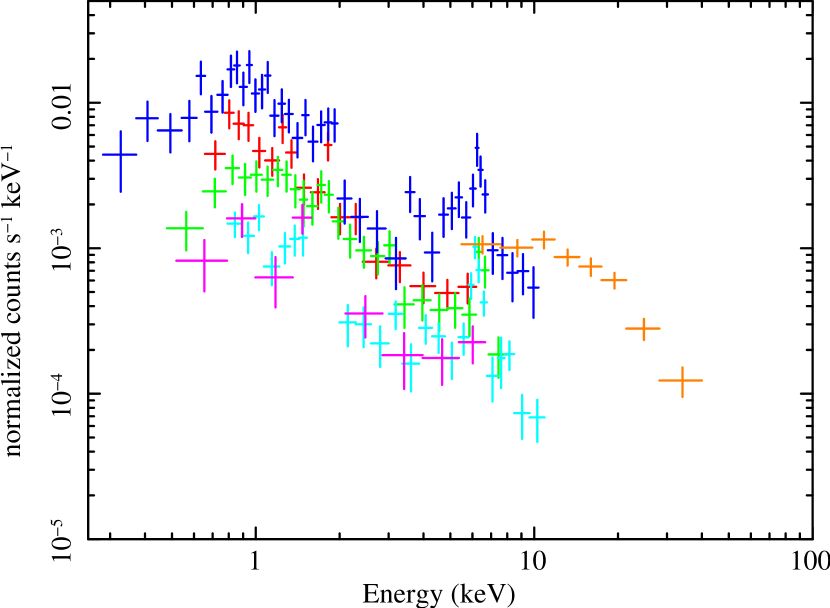
We simultaneously analyze the set of seven spectra (Swift/BAT, NuSTAR/FPMs, Suzaku/FI-XISs and BI-XIS, XMM-Newton/EPIC-pn and EPIC-MOSs, and Chandra/ACIS). Figure 3 shows the observed spectra folded with the energy responses except for Swift/BAT. A prominent Fe K line at 6.4 keV can be clearly seen in Figure 3.
For spectral analysis, we use the data of BAT, FPMs, FI-XISs, BI-XIS, MOSs, pn, and ACIS in the energy bands of 14–100 keV, 5.5–40 keV, 0.8–11 keV, 0.5–7 keV, 0.5–8 keV, 0.25–10 keV, and 0.65–6 keV, respectively, where the signal-to-noise ratio is sufficiently high. The data of FI-XISs and BI-XIS in the 1.6–1.9 keV band are excluded to avoid calibration uncertainties. The spectral bins are merged to contain at least 100, 50, 20, and 20 counts for each spectrum of NuSTAR, Suzaku, XMM-Newton, and Chandra, respectively. Spectral fit is performed on XSPEC with the minimization method. To take into account the Galactic absorption, phabs is always multiplied to the spectral model, whose hydrogen column density is fixed at the value based on the map (Kalberla et al., 2005). We multiply a constant factor (const0; , , , , and for FI-XISs, BI-XIS, EPIC-MOSs, EPIC-pn, and ACIS, respectively) to each spectrum in order to correct for cross calibration uncertainties in the absolute flux among different instruments. It is fixed at unity for the BAT spectrum, which is adopted as calibration references in this paper. For the other instruments, it is allowed to vary within a reasonable range, 0.8–1.2. Furthermore, we link the const0 factor of FPMs to those of MOSs because their relative normalizations are well calibrated within a few percents (Madsen et al., 2015); we confirm that these few percent uncertainties have negligible effects on the spectral parameters. In addition, we also consider possible time variability of the AGN emission (see below) with respect to the averaged flux measured with Swift/BAT over 70 months.
3.1. Analytical Models
3.1.1 Model Ia
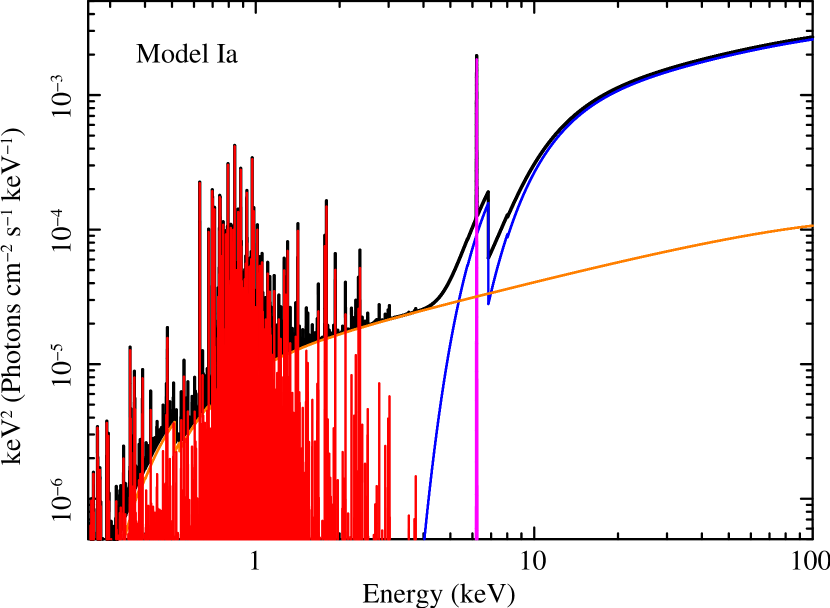
First we start with Model B in Imanishi et al. (2003) adopted to fit the XMM-Newton and Chandra spectra. The model consists of a primary, heavily absorbed power law with an exponential cutoff (hereafter “cutoff power law”), a less absorbed cutoff power law (or a scattered component), a narrow gaussian representing an iron-K emission line, and an optically-thin thermal component. In XSPEC, this model (hereafter “Model Ia”) is described as:
| (1) | |||||
We fix a cutoff energy 222This corresponds to an e-folding energy () in the zhighect model when is set to be zero. at 360 keV, the value adopted in the torus model by Ikeda et al. (2009) (Model II, see Section 3.2), because it cannot be well constrained from the data; variation of the cutoff energy within a reasonable range (100–500 keV) has little influence on the spectral parameters in Models Ia and Ib (Section 3.1.2). The constant factor const1 is introduced to account for possible time variability of the AGN component relative to the flux measured with Swift/BAT. Except for NuSTAR, it is found to be consistent with unity within the expected instrumental cross normalizations (const0). Hence, it is left free for the NuSTAR spectrum () and is fixed at unity for the other spectra in the final spectral fit. The const2 factor gives the scattering fraction, . We define it as the ratio of the unabsorbed fluxes at 1 keV between the scattered and primary power law components, whose normalizations are tied together. The photon index of the scattered component is set to be independent of that of the primary one. The weak absorption (zphabs1, cm-2) to the second power-law component is significantly required from the data, although this fact was (mistakenly) not mentioned in Imanishi et al. (2003); otherwise, the model leaves large negative residuals below 1 keV. We confirm that the presence of this absorption is robust against modelling of the scattered component in both Models Ia and Ib; it is still required when we include emission lines and radiative recombination continua of a photoionized plasma whose flux ratios are fixed to those in NGC 1068 (Guainazzi & Bianchi 2007), and when the photon index is tied to that of the primary component.
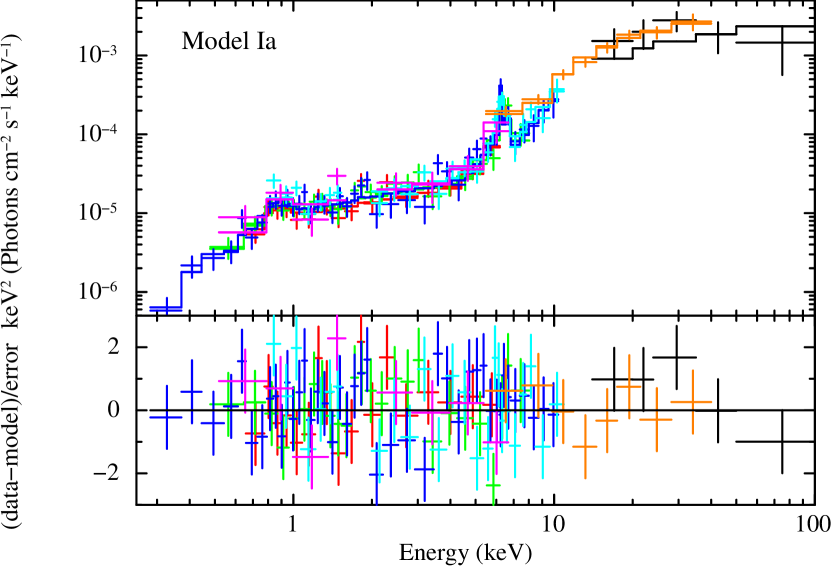
This phenomenological model gives an acceptable fit of our combined spectra (/d.o.f. = 123.40/117). Table 4 lists the best fit parameters, the observed fluxes and intrinsic (de-absorbed) luminosities in the 2–10 keV and 10–50 keV bands, and the equivalent width of the iron-K line with respect to the total continuum. The fluxes and luminosities are based on the Swift/BAT spectrum, for which const0 and const1 are set unity. Figure 4 and Figure 5 present the unfolded spectra and best-fit models for Model Ia, respectively. The line center energy becomes 6.46 keV. It is consistent with a fluorescence line from cold matter as the main component, although weak contribution from ionized lines (e.g., Iwasawa et al. 2011) is possible.
3.1.2 Model Ib
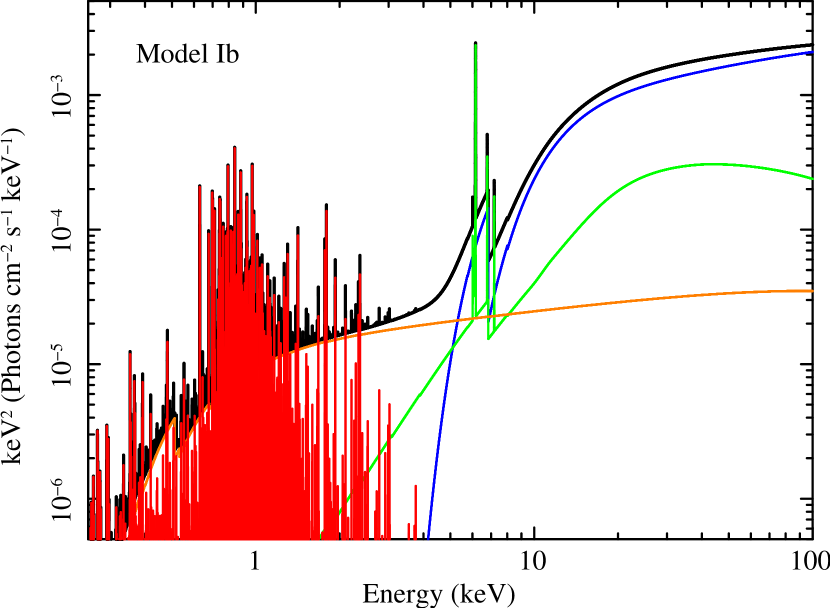
Next, we consider a more physically motivated model than Model Ia. Firstly, a Compton reflection continuum from the torus should be present, which accounts for the origin of the narrow iron-K line. Secondly, in the case of a Compton-thick torus, we should take into account Compton scattering for the transmitted component in addition to photoelectric absorption. Assuming an extreme case where the absorber is located only along the line of sight (i.e., photons scattering into the line of sight from other directions are ignorable), this can be modelled by multiplying cabs to the transmitted component. We thus adopt the following analytical model as our “Model Ib”. Similar spectra are often observed from ULIRGs (e.g., Teng et al. 2015). This model is expressed in the XSPEC terminology as:
| (2) | |||||
(1) The first term represents the transmitted component from the AGN, modelled by an absorbed cutoff power law with a cutoff energy of 360 keV. The const1 factor, which accounts for time variation with respect to the Swift/BAT spectrum, is linked to that for the reflection (second) component. (2) The second term approximately describes a reflection component from the torus. Here we utilize the pexmon code (Nandra et al., 2007). This combines the pexrav model, which calculates a Compton-reflection continuum from optically thick, cold matter (Magdziarz & Zdziarski 1995), with fluorescence lines from heavy elements. The relative intensity is defined as , where is the solid angle of the reflector. We leave free within a range of and fix the inclination angle at 60 degree as a representative value for a geometrically thick torus (e.g., Eguchi et al. 2009; Kawamuro et al. 2016). The negative values of indicate that the pexmon model represents only the reflection component. The photon index, cutoff energy, and normalization are linked to those of the transmitted component. We do not apply absorption to the reflection component, which is not significantly (90% confidence level) required from the data. The same constant factor const1 as the first term is multiplied to the second term in order to take into account time variability, although this assumption may not be trivial, depending on the location of the reflector. 333 We obtain when the const1 factor is not multiplied to the pexmon component. Thus, the conclusion of small is unchanged. (3) The third term is the scattered component of the intrinsic AGN spectrum, modelled with a cutoff power-law whose parameters except photon index are linked to those in the transmitted component, multiplied by const2 (). A weak absorption (zphabs1) is multiplied to the first, second and third terms. We assume that the third and fourth components did not vary among the multiple observation epochs, considering the large spatial scales of the emitting regions. (4) The fourth term accounts for optically-thin thermal emission in the host galaxy. Here we ignore any intrinsic absorption.
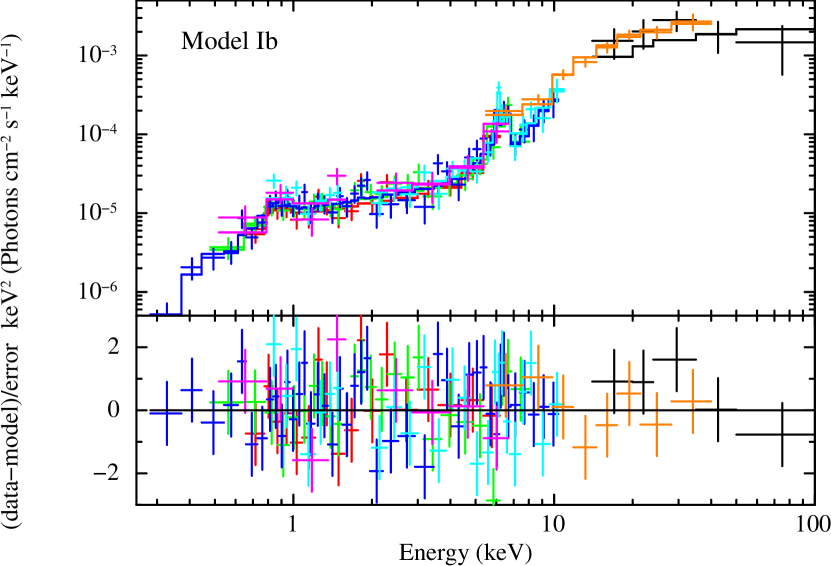
We find that this model also well reproduces the combined spectra covering the 0.25–100 keV band (/d.o.f = 130.59/118). Table 4 lists the best-fit parameters, the observed fluxes and intrinsic luminosities in the 2–10 keV and 10–50 keV bands based on the Swift/BAT spectrum, and the 6.4 keV line equivalent-width predicted from the best-fit model. The unfolded spectra and best-fit models are presented in Figures 4 and 5, respectively. The line-of-sight column density of the transmitted component is found to be cm-2, which identifies UGC 5101 as a Compton-thick AGN, consistent with the result of Model Ia.
3.2. Torus Model
As an even more realistic picture, we utilize the torus model by Ikeda et al. (2009) (hereafter “Ikeda torus model”), a numerical spectral model based on Monte Carlo simulations. The Ikeda torus model assumes a nearly spherical torus consisting of neutral, cold material and has two cone-shaped holes along the polar axis. The geometry is determined by the torus half-opening angle ( within a range of 0–70 degree), inclination angle ( within a range of 1-89 degree), and the ratio of the inner to outer radii, , which is fixed at 0.01. The variable half-opening angle is one of the advantages of this model among similar numerical models, because it is expected not to be constant in AGNs. The incident spectrum is a cutoff power law with a cutoff energy of 360 keV. The other free parameters of this model are photon index () and column density along the equatorial plane (), which are variable between 1.5–2.5 and between – cm-2, respectively (see Ikeda et al. 2009 for details). We fix the inclination angle at 80 degrees, in order to assure a type-2 AGN geometry, while the half opening angle is left free. The equatorial column density, photon index, and normalization are linked to those of the transmitted component.
In the XSPEC terminology, the total model (Model II) is represented as follows:
| (3) | |||||
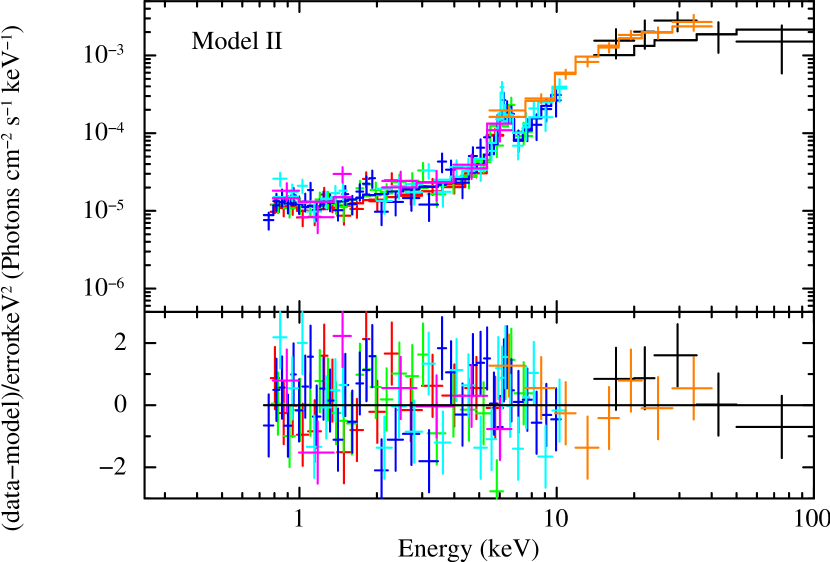
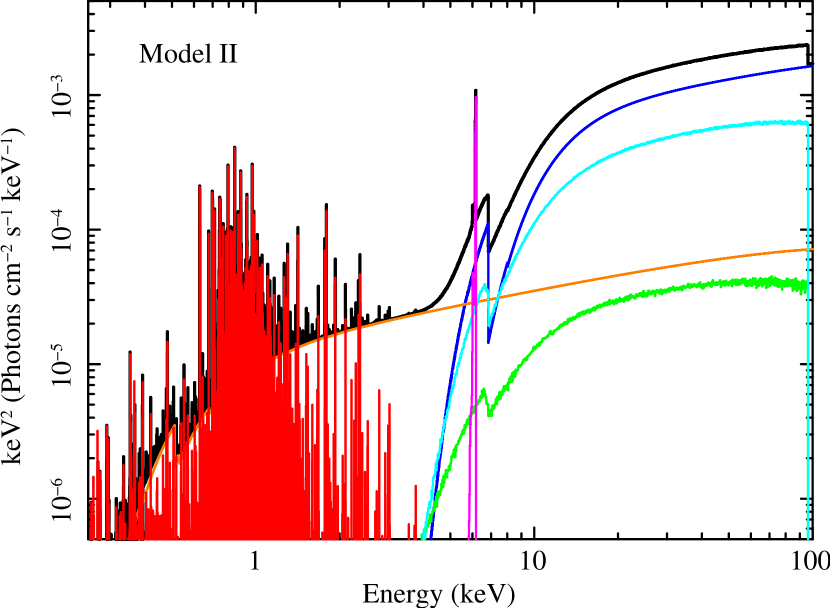
The model consists of six components: (1) the transmitted component from the AGN, (2) the torus reflection component absorbed by the near-side torus, (3) that not absorbed by the near-side torus, (4) the iron-K emission line, (5) the scattered component (with a photon index and a scattering fraction of ), and (6) the optically-thin thermal component. Similarly to the case of analytical models, we consider time variability of the (1)-(4) components for the NuSTAR data. We do not utilize the energy band below 0.7 keV with Model II, where the Ikeda torus model is not available. Hence, the absorption from the host galaxy and the parameters of the optically-thin thermal component are fixed at the same values as in Model Ib, which cannot be well constrained with the data above 0.7 keV. We confirm that changing the fixed parameters within the uncertainties does not affect the conclusions.
This model also well reproduces the combined spectra of UGC 5101 in the 0.7–100 keV band (/d.o.f = 126.22/111). Table 5 lists the best-fit parameters, the observed fluxes and intrinsic luminosities in the 2–10 keV and 10–50 keV bands based on the Swift/BAT spectrum, and the iron-K line equivalent width with respect to the total continuum. The unfolded spectra and best-fit model are plotted in Figures 4 and 5, respectively. The line-of-sight column density calculated from the equation (3) in Ikeda et al. (2009) becomes cm-2, confirming that the galaxy contains a Compton thick AGN. The data prefer a large half-opening angle, degrees, with the best-fit of 70 degrees (the maximum value in the table model). With this geometry ( and ), the fraction of the reflection component from the far-side torus absorbed (unabsorbed) by the near-side torus is % (%). We find that the 10–50 keV intrinsic luminosity would be reduced by 6% from our best estimate within the uncertainty in the torus opening angle (41–70 degrees). This uncertainty does not affect our conclusions.
| Note∗ | Parameter | Model Ia | Model Ib |
|---|---|---|---|
| (1) | |||
| (2) | |||
| (3) | |||
| (4) | |||
| (5) | – | ||
| (6) | – | ||
| (7) | – | ||
| (8) | |||
| (9) | |||
| (10) | |||
| (11) | |||
| (12) | |||
| (13) | |||
| (14) | |||
| (15) | |||
| (16) | 0.80 () | 0.80 () | |
| (17) | |||
| (18) | |||
| (19) | |||
| (20) | |||
| (21) | |||
| (22) | 361 (1433) | 202 (1433) | |
| dof | 123.40 / 117 | 130.59 / 118 |
| Note∗ | Parameter | |
|---|---|---|
| (1) | ||
| (2) | ||
| (3) | 70 () | |
| (4) | ||
| (5) | ||
| (6) | ||
| (7) | ||
| (8) | ||
| (9) | ||
| (10) | ||
| (11) | ||
| (12) | ||
| (13) | ||
| (14) | 0.80 () | |
| (15) | ||
| (16) | ||
| (17) | ||
| (18) | ||
| (19) | ||
| (20) | 245 | |
| dof | 126.22 / 111 |
4. Discussion
We have presented the first high-quality broadband X-ray spectra of UGC 5101 in the 0.25–100 keV band, observed with Swift, NuSTAR, Suzaku, XMM-Newton, and Chandra. The combined data, whose total exposure except Swift/BAT is 185.5 ksec, have enabled us to best constrain the spectral properties of this target. Besides the AGN contribution, we confirm the presence of optically-thin thermal emission at low energies (keV) as previously reported by Imanishi et al. (2003). The temperature (0.88 keV) and luminosity ( erg s-1 in the 2–10 keV band) of the thin thermal component, which is spatially resolved in the Chandra image (Imanishi et al. 2003), is typical of ULIRGs (e.g., Iwasawa et al. 2011).
As for the AGN contribution, we have shown that two analytical models (Models Ia and Ib) and Monte-Carlo based numerical torus model (Model II) can well reproduce the data in terms of test. Model Ia is a simple, phenomenological model, while Model Ib is a more physically motivated model including a reflection component from Compton-thick matter. In Model II, a more realistic geometry of the torus is considered. With our analysis, we firmly confirm the presence of a luminous Compton-thick AGN in UGC 5101, whose transmitted component is detected in the hard X-ray band above 10 keV. The basic spectral parameters (photon index and absorption) are consistent within their uncertainties among the three models. We note, however, that if the Compton reflection component, required by the data, is not considered in the model, a slightly flatter intrinsic photon index is derived for the primary power-law component, i.e., 1.4 (Model Ia) to be compared with 1.6 (Model Ib and Model II). More importantly, we find that if Compton scattering of the transmitted component is ignored (Model Ia), the intrinsic X-ray luminosity is significantly underestimated compared with Model II: a factor 2 in the 10–50 keV band and a factor 3 in the 2–10 keV band (see Tables 4 and 5). The Model Ia result is very similar to the previous estimate by Imanishi et al. (2003) ( erg s-1), in which the Compton scattering effects were also ignored. By contrast, in Model Ib, we apply the cabs model to the transmitted component, assuming an extreme geometry where the absorber is located only in the line of sight (see Section 3.1.2). In this case, the luminosities are slightly overestimated compared with Model II. Hereafter, we refer to the luminosities obtained with Model II unless otherwise stated, because we consider it the most physically self-consistent model among the three. We note that all luminosities listed in Table 4 and 5 are based on the Swift/BAT spectrum, because we are interested in time averaged values when discussing the spectral energy distribution. Even if we adopt the luminosity obtained with NuSTAR, which is higher than the Swift/BAT one by a factor of , our main conclusions are unaffected.
The fitting result with the torus model of Ikeda et al. (2009), degrees, suggests that the covering fraction of Compton-thick parts of the torus is only moderate. This result is consistent with the best-fit scattering fraction, , which implies that UGC 5101 is not a “low scattering fraction AGN” with , putative population of AGNs with small torus opening angles discovered by hard X-ray surveys (Ueda et al. 2007). The scattering fraction of UGC 5101 is similar to, and even larger than, the median values of an [O III] selected sample (; Noguchi et al. 2010) and a hard X-ray (14–195 keV) selected sample (; Kawamuro et al. 2016), respectively. We note, however, that given the large error in the scattering fraction and possible contamination by emission from high mass X-ray binaries in the host galaxy, we cannot make strong arguments based on the value.
These results imply that the nucleus in UGC 5101 cannot be fully surrounded by Compton-thick matter. Nevertheless, there could be the possibility that a lower column-density (Compton-thin) absorber is present in the torus-hole regions that attenuates the nuclear ionizing UV emission and causing the under-developed NLR in UGC 5101 (Section 1). By our analysis, we indeed find that a weak intrinsic X-ray absorption ( cm-2, zphabs1 in Section 3), in addition to the Compton-thick absorber, is required when the data below 0.7 keV, which are sensitive to determine such an absorption, are included in the fit (i.e., Models Ia and Ib). By assuming a Galactic dust-to-gas ratio, this column density corresponds to an optical extinction of mag (Güver & Özel 2009). This is sufficient to block a large fraction of ionizing UV lights from the central engine of the AGN, although we cannot discard the possibility that the absorption could be associated to interstellar medium of the host galaxy on a larger scale.

To further investigate the nuclear geometry and intrinsic spectral energy distribution, we compare the luminosity of an emission line from the NLR and the AGN X-ray luminosity. Figure 6 plots the correlation between the [O IV] 26 m luminosity and the absorption-corrected 2–10 keV AGN luminosity for UGC 5101 (square). Assuming that the ratio between the [O IV] 26 m and far-infrared (FIR) luminosity in pure starburst galaxies is typically (e.g., see Figure 22 of Veilleux et al. 2009), we estimate that starburst contamination in the observed [O IV] 26 m luminosity is very small, , where is the fractional AGN contribution to the total bolometric luminosity (see below). The flux ratio between [Ne V] 14.3 m and [O IV] 26 m lines also supports that the [O IV] luminosity is dominated by the AGN component (Armus et al. 2007). For comparison, we also plot the data of other ULIRGs, IRAS 05189–2524, IRAS 13120–5453, and Mrk 273, taken from the sample observed by Teng et al. (2015) by excluding Superantenna (IRAS F19254–7245), a candidate of a heavily Compton thick AGN ( cm-2), and Mrk 231, a probable outlier object (broad absorption line QSO). The curves represent the expected relations for Seyfert 1 (solid) and Compton-thin Seyfert 2 galaxies (dashed) based on the average Lbol/L ratio obtained by Rigby et al. (2009) with the 2–10 keV to bolometric luminosity conversion factor given by Marconi et al. (2004).
As noticed from Figure 6, the [O IV] to X-ray luminosity ratio in UGC 5101 is similar to those of normal Seyfert galaxies. This is also the case for the two ULIRGs except Mrk 273, demonstrating that a significant portion of ULIRGs in the current NuSTAR sample are not really “X-ray faint” with respect to the [O IV] 26 m flux. Since the luminosity of [O IV] 26 m is determined by that of ionizing UV photons leaked to the NLR out of surrounding matter, it should be roughly proportional to the product of ( 1 covering fraction ) and the intrinsic AGN luminosity in the UV band. Thus, there could be two explanations for this observational fact. The first one is that the AGN in UGC 5101 is not different from those in normal Seyfert galaxies in terms of the covering fraction of surrounding matter and UV to X-ray spectral energy distribution (SED). The second one is that, in UGC 5101, both [O IV] 26 m and X-ray luminosities are smaller with respect to the bolometric AGN luminosity than in normal Seyfert galaxies.
We find difficulties in the first explanation, however. The AGN bolometric luminosity converted from the 2–10 keV luminosity with the Marconi et al. (2004) relation (i.e., that for normal AGNs) turns out to be erg s-1 (with a bolometric correction factor of 19), corresponding to only 7% of the total bolometric luminosity. This fraction is smaller than those estimated from the Spitzer spectra with diagnostics not using the NLR lines, 52%–80% (Armus et al., 2007) (see their Table 7) or 14%–55% (Veilleux et al., 2009) (see their Table 12). This implies that the SED of the AGN in UGC 5101 is X-ray under-luminous relative to the UV luminosity, which dominates the bolometric one, as compared with normal AGNs. Also, as mentioned in Section 1, the [O IV] 26 m luminosity seems to underestimate the true bolometric AGN luminosity, implying that the total covering fraction of Compton-thick and Compton-thin matter is larger than those of normal AGNs.
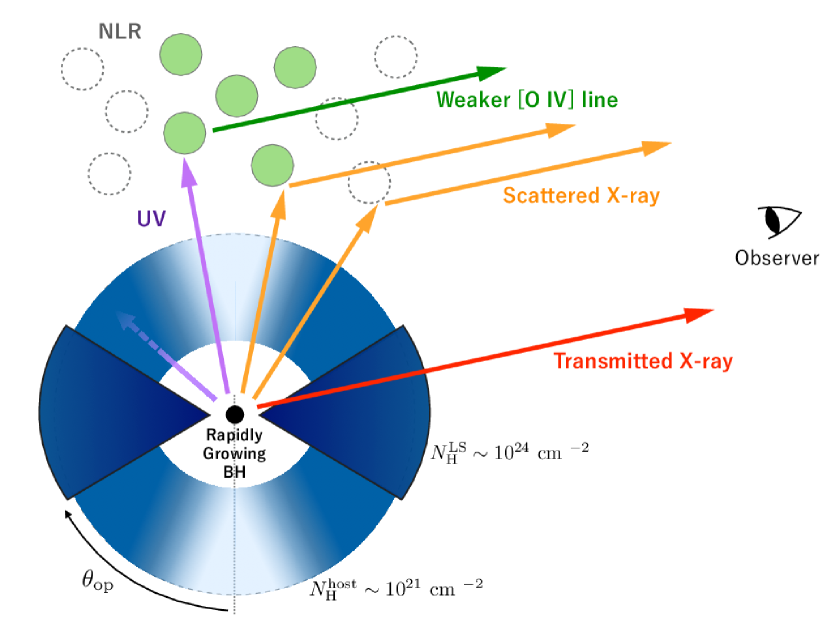
We therefore consider that the second explanation would be a likely scenario for UGC 5101. Our picture, illustrated in Figure 7, is summarized as follows, even though there are large uncertainties (by a factor of a few) in the numbers. The surrounding structure consists of two parts, a Compton-thick part ( cm-2) located close to the equatorial plane and a Compton-thin part ( cm-2) in the torus hole region, although they may not be discrete in reality. The covering fraction of Compton-thick matter is small, which is derived from the hard X-ray spectra. The total covering fraction of Compton-thick and Compton-thin matter that blocks UV lights is large, which accounts for the low [O IV] 26 m luminosity relative to the AGN bolometric luminosity. The intrinsic bolometric luminosity of the AGN is truly erg s-1, corresponding to 50% of the total luminosity, as inferred from the IR spectra. Because the intrinsic AGN luminosity in the 2–10 keV band we determine is erg s-1, the 2–10 keV to bolometric luminosity correction factor of this AGN is estimated to be 140. This value is relatively large (i.e., the UV to X-ray SED is steep) compared with those of typical Seyferts with similar X-ray luminosities (Marconi et al., 2004), but can be expected at high Eddington rates (Vasudevan & Fabian, 2007) i.e., in rapidly growing SMBHs. Thus, because both the [O IV] 26 m and X-ray luminosities are suppressed, their ratio remains almost the same as those of normal Seyferts. Nevertheless, we argue that AGNs in many ULIRGs do not look extraordinary (i.e., extremely X-ray faint), as suggested by recent works (e.g., Teng et al. 2015), compared with normal Seyferts. Since the strong starburst activity in the nuclear region may increase both the total covering fraction of surrounding matter and the mass accretion rate, it may not be a coincidence that a ULIRG shows a standard value of the [O IV] 26 m to X-ray luminosity ratio.
To summarize, we have revealed the complex structure of the circumnuclear region of UGC 5101; in short, the covering fraction of the Compton-thick torus is small, while the total covering fraction of Compton-thick and Compton-thin matter is large, making the nucleus “unburied” in X-rays but “buried” in UV. This implies that, in a more realistic geometry, there is a strong contrast in the column-density distribution as a function of inclination angle, that is, matter is highly concentrated toward the equatorial plane. We point out that the nearby Compton-thick AGN NGC 4945 may have a similar circumnuclear structure to that of UGC 5101. In NGC 4945, X-ray spectral and variability properties suggest a small covering fraction of the Compton-thick torus (e.g., Itoh et al. 2008; Marinucci et al. 2012), whereas, from observations of NLR lines (e.g., Pérez-Beaupuits et al. 2011), it is inferred that the AGN is surrounded by matter with a large covering fraction. To answer the question if this is a general property of obscuring material in Compton thick AGNs, it is important to perform sensitive broadband X-ray observations for a larger sample of heavily obscured AGNs.
5. Conclusion
Using all available data taken with Swift, NuSTAR, Suzaku, XMM-Newton, and Chandra, we have presented the best quality broadband X-ray spectra of UGC 5101 covering the 0.25–100 keV band. The spectra are well reproduced by conventional analytic models or a numerical torus model for an obscured AGN. The main conclusions are summarized below.
-
•
We detect a Compton-thick AGN with a line-of-sight column density of cm-2. The intrinsic 2–10 keV luminosity is determined to be erg s-1, which is 2.5 times larger than the previous estimate using only data below 10 keV.
-
•
A weak absorption of cm-2 to the soft X-ray scattered component is required.
-
•
A spectral fit with a smooth torus model favors a large ( degrees) half opening angle of the torus. This suggests that the covering fraction of a Compton-thick part is moderate.
-
•
The ratio between the [O IV] 26 m line and 2–10 keV luminosities of UGC 5101 and other typical ULIRGs is found to be similar to those of normal Seyfert galaxies. Thus, a significant portion of ULIRGs are not really “X-ray faint” with respect to the [O IV] 26 m flux.
-
•
To reconcile these results with the large AGN contribution (50%) to the total bolometric luminosity inferred by the IR spectra, a possible scenario is that (1) the AGN in UGC 5101 is surrounded not only by Compton-thick matter located close to the equatorial plane but also by Compton-thin matter with cm-2 in the torus-hole region, and (2) it has a steep UV to X-ray SED, which is expected at a high Eddington rate. These two effects work to somewhat (but not extraordinarily) reduce the [O IV] 26 m and X-ray luminosities, respectively, by keeping their ratio almost the same as in normal Seyfert galaxies.
-
•
The circumnuclear structure of UGC 5101 may be similar to that of NGC 4945, where the covering fraction of a Compton-thick part is small but the total covering fraction of Compton-thick and Compton-thin parts is large.
This research has made use of the NuSTAR Data Analysis Software (NuSTARDAS) jointly developed by the ASI Science Data Center (ASDC, Italy and the California Institute of Technology (Caltech, USA). Part of this work was financially supported by the Grant-in-Aid for Scientific Research 26400228 (Y.U.), 15K05030 (M.I.) and 15H02070 (Y.T.) from the Japan Society for the Promotion of Science (JSPS), and by the CONICYT-Chile grants “EMBIGGEN” Anillo ACT1101 (C.R.), FONDECYT 1141218 (C.R.), and Basal-CATA PFB–06/2007 (C.R.). C.R. acknowledges support from the China-CONICYT fund.
References
- Anders & Grevesse (1989) Anders, E., & Grevesse, N. 1989, Geochim. Cosmochim. Acta, 53, 197
- Armus et al. (2004) Armus, L., et al. 2004, ApJS, 154, 178
- Armus et al. (2007) Armus, L., Charmandaris, V., Bernard-Salas, J., et al. 2007, ApJ, 656, 148
- Balucinska-Church & McCammon (1992) Balucinska-Church, M., & McCammon, D. 1992, ApJ, 400, 699
- Bauer et al. (2015) Bauer, F. E., Arévalo, P., Walton, D. J., et al. 2015, ApJ, 812, 116
- Boldt (1987) Boldt, E. 1987, Observational Cosmology, 124, 611
- Caputi et al. (2007) Caputi, K. I., Lagache, G., Yan, L., et al. 2007, ApJ, 660, 97
- Eguchi et al. (2009) Eguchi, S., Ueda, Y., Terashima, Y., Mushotzky, R., & Tueller, J. 2009, ApJ, 696, 1657
- Fukazawa et al. (2009) Fukazawa, Y., Mizuno, T., Watanabe, S., et al. 2009, PASJ, 61, S17
- Goncalves et al. (1999) Goncalves, A. C., Veron-Cetty, M. -P., & Veron, P. 1999, A&AS, 135, 437
- Goto et al. (2010) Goto, T., Takagi, T., Matsuhara, H., et al. 2010, A&A, 514, A6
- Grimm et al. (2003) Grimm, H.-J., Gilfanov, M., & Sunyaev, R. 2003, MNRAS, 339, 793
- Guainazzi & Bianchi (2007) Guainazzi, M., & Bianchi, S. 2007, MNRAS, 374, 1290
- Güver & Özel (2009) Güver, T., & Özel, F. 2009, MNRAS, 400, 2050
- Harrison et al. (2013) Harrison, F. A., Craig, W. W., Christensen, F. E., et al. 2013, ApJ, 770, 103
- Ikeda et al. (2009) Ikeda, S., Awaki, H., & Terashima, Y. 2009, ApJ, 692, 608
- Imanishi et al. (2001) Imanishi, M., Dudley, C. C., & Maloney, P. R. 2001, ApJ, 558, L93
- Imanishi & Maloney (2003) Imanishi, M., & Maloney, P. R. 2003, ApJ, 588, 165
- Imanishi et al. (2003) Imanishi, M., Terashima, Y., Anabuki, N., & Nakagawa, T. 2003, ApJ, 596, L167
- Imanishi et al. (2008) Imanishi, M., Nakagawa, T., Ohyama, Y., et al. 2008, PASJ, 60, S489
- Imanishi et al. (2006) Imanishi, M., Nakanishi, K., & Kohno, K. 2006, AJ, 131, 2888
- Itoh et al. (2008) Itoh, T., Done, C., Makishima, K., et al. 2008, PASJ, 60, S251
- Iwasawa et al. (2011) Iwasawa, K., Sanders, D. B., Teng, S. H., et al. 2011, A&A, 529, A106
- Kalberla et al. (2005) Kalberla, P. M. W., Burton, W. B., Hartmann, D., et al. 2005, A&A, 440, 775
- Kawamuro et al. (2016) Kawamuro, T., Ueda, Y., Tazaki, F., Ricci, C., & Terashima, Y. 2016, ApJS, 225, 14
- Kohno (2005) Kohno, K. 2005, in AIP Conf. Ser. 783, The Evolution of Starbursts, ed. S. Hüttemeister, E. Manthey, D. Bomans, & K. Weis (New York: AIP), 203 (astro-ph/0508420)
- Koyama et al. (2007) Koyama, K., Tsunemi, H., Dotani, T., et al. 2007, PASJ, 59, 23
- Krips et al. (2008) Krips, M., Neri, R., Garcia-Burillo, S., Martin, S., Combes, F., Gracia-Carpio, J., & Eckart, A. 2008, ApJ, 677, 262
- Lonsdale et al. (2003) Lonsdale, C. J., Lonsdale, C. J., Smith, H. E., & Diamond, P. J. 2003, ApJ, 592, 804
- Madsen et al. (2015) Madsen, K. K., Harrison, F. A., Markwardt, C. B., et al. 2015, ApJS, 220, 8
- Magdziarz & Zdziarski (1995) Magdziarz, P., & Zdziarski, A. A. 1995, MNRAS, 273, 837
- Makishima et al. (1989) Makishima, K., Ohashi, T., Hayashida, K., et al. 1989, PASJ, 41, 697
- Marconi et al. (2004) Marconi, A., Risaliti, G., Gilli, R., et al. 2004, MNRAS, 351, 169
- Marinucci et al. (2012) Marinucci, A., Risaliti, G., Nardini, E., et al. 2012, American Institute of Physics Conference Series, 1427, 141
- Mitsuda et al. (2007) Mitsuda, K., Bautz, M., Inoue, H., et al. 2007, PASJ, 59, 1
- Murphy et al. (2011) Murphy, E. J., Chary, R.-R., Dickinson, M., et al. 2011, ApJ, 732, 126
- Nandra et al. (2007) Nandra, K., O’Neill, P. M., George, I. M., & Reeves, J. N. 2007, MNRAS, 382, 194
- Nardini et al. (2009) Nardini, E., Risaliti, G., Salvati, M., et al. 2009, MNRAS, 399, 1373
- Noguchi et al. (2010) Noguchi, K., Terashima, Y., Ishino, Y., et al. 2010, ApJ, 711, 144
- Pérez-Beaupuits et al. (2011) Pérez-Beaupuits, J. P., Spoon, H. W. W., Spaans, M., & Smith, J. D. 2011, A&A, 533, A56
- Ricci et al. (2015) Ricci, C., Ueda, Y., Koss, M. J., et al. 2015, ApJ, 815, L13
- Rigby et al. (2009) Rigby, J. R., Diamond-Stanic, A. M., & Aniano, G. 2009, ApJ, 700, 1878
- Robson (1996) Robson, I. 1996, Active Galactic Nuclei (New York: Wiley)
- Rosa-González et al. (2002) Rosa-González, D., Terlevich, E., & Terlevich, R. 2002, MNRAS, 332, 283
- Sanders & Mirabel (1996) Sanders, D. B., & Mirabel, I. F. 1996, ARA&A, 34, 749
- Sanders et al. (1988a) Sanders, D. B., Soifer, B. T., Elias, J. H., Madore, B. F., Matthews, K., Neugebauer, G., & Scoville, N. Z. 1988a, ApJ, 325, 74
- Sanders et al. (1988b) Sanders, D. B., Soifer, B. T., Elias, J. H., Neugebauer, G., & Matthews, K. 1988, ApJ, 328, L35
- Scoville et al. (2000) Scoville, N. Z. et al. 2000, AJ, 119, 991
- Smith et al. (1998) Smith, H. E., Lonsdale, C. J., & Lonsdale, C. J. 1998, ApJ, 492, 137
- Soifer et al. (2000) Soifer, B. T. et al. 2000, AJ, 119, 509
- Takahashi et al. (2007) Takahashi, T., Abe, K., Endo, M., et al. 2007, PASJ, 59, 35
- Teng et al. (2015) Teng, S. H., Rigby, J. R., Stern, D., et al. 2015, ApJ, 814, 56
- Teng et al. (2009) Teng, S. H., Veilleux, S., Anabuki, N., et al. 2009, ApJ, 691, 261
- Ueda et al. (2007) Ueda, Y., Eguchi, S., Terashima, Y., et al. 2007, ApJ, 664, L79
- Vasudevan & Fabian (2007) Vasudevan, R. V., & Fabian, A. C. 2007, MNRAS, 381, 1235
- Veilleux et al. (1995) Veilleux, S., Kim, D. -C., Sanders, D. B., Mazzarella, J. M., & Soifer, B. T. 1995, ApJS, 98, 171
- Veilleux et al. (2009) Veilleux, S., Rupke, D. S. N., Kim, D.-C., et al. 2009, ApJS, 182, 628-666
- Yuan et al. (2010) Yuan, T. -T., Kewley, L. J., & Sanders, D. B. 2010, ApJ, 709, 884