Hyperfine local probe study of alkaline-earth manganites SrMnO3 and BaMnO3
Abstract
We report perturbed angular correlation measurements with 111mCd/111Cd and 111In/111Cd probes, at the ISOLDE-CERN facility, in the manganite compounds BaMnO3, with the 6H and 15R polymorphs, and SrMnO3, with the 4H polymorph. The electric field gradient (EFG) is measured, and found approximately constant in a large temperature range for all the compounds. The EFG is also calculated from first-principles with density functional theory, and compared with the experimental results, by considering diluted substitutional Cd impurities. Based on the results, we assign as sites for the probes the Ba (for BaMnO3-6H, 15R), and Sr (for SrMnO3-4H) sites, apart from fractions of undetermined origin in the case of BaMnO3-6H. We predict the hyperfine parameters in the recently synthesized multiferroic manganite Sr0.5Ba0.5MnO3, and its variation with the structure and electric polarization, which is found to be very small.
pacs:
31.30.Gs, 75.47.Lx, 71.15.Mb1 Introduction
Manganites have been the subject of renewed interest in the last years, due to the coupling of various order parameters, resulting in effects such as colossal magnetoresistance and multiferroicity. The divalent alkaline-earth based manganites, of the form AMnO3 (where A is Ca, Sr or Ba) have a simpler electronic structure than the rare-earth based manganites, since the Mn ions can be considered formally as Mn4+, and there is no Jahn-Teller distortion resulting from partially filled orbitals. In these compounds, the observed structure is related to the ion sizes. The relation between interatomic distances and structure can be understood by the tolerance factor [1], where and are the interatomic distances: corresponds to the ideal perovskite structure; values greater than one are found in hexagonal manganites, where the number of MnO6 octahedra which share faces instead of vertices (as in the ideal perovskite) is increased; values of smaller than one are concomitant with an orthorhombic structure. In its ground state at low temperature, CaMnO3 is orthorhombic, due to the smaller radius of Ca2+ (and tolerance factor), while SrMnO3 and BaMnO3 are hexagonal. In spite of this apparent simplicity, the synthesis of the Sr or Ba systems is quite complex. An accurate control of the thermodynamic conditions, temperature and oxygen partial pressure, in the preparation and in the cooling steps (slow cool or quenching) is very important to obtain a given phase. The Ba manganite, for example, can be synthesized in the non-stoichiometric form BaMnO3-x with different values of (e.g. Adkin and Hayward [2]).
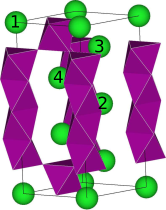
Various polymorphs of hexagonal structures can be synthesized, corresponding to different sizes for one-dimensional strings of face-sharing octahedra, for example: hexagonal two-layer 2H (AB), where strings of face-sharing Mn-O octahedra have infinite length, or hexagonal 6H (ABCACB), hexagonal 4H (ABAC), and rhombohedral 15R, where these strings are periodically broken (see figure 1).
There are some experimental measurements of structural and magnetic properties carried on different forms of BaMnO3 [3, 4, 5, 6, 7] and SrMnO3. [4, 8] The computational methods that enable first-principles calculations have also given a good understanding of these compounds. Density functional theory (DFT) calculations have been performed for the study of these systems, with detailed analysis of the density of states, band gaps, band structures and chemical bonding in the Ca/Ba/Sr manganites [9], of the magnetic and structural properties [10], and heat capacity and lattice dynamics [11] of cubic and hexagonal SrMnO3. Hartree-Fock calculations have also been used for the study of magnetic and electronic properties in CaMnO3 [12]. These works showed good reliability of the calculations.
There have been interesting developments in the perovskite type structure form of these compounds: recently, DFT studies have predicted ferroelectric instabilities in specific strain conditions for CaMnO3 [13], SrMnO3 [14], and BaMnO3 [15], giving these materials the possibility of being multiferroics. More recently, this promise was realized with the perovskite mixed manganite Sr1/2Ba1/2MnO3, which is ferroelectric, with large polarization due to displacement-type Mn off-centering, and possesses large magnetoelectric effects [16]. A DFT and model analysis [17] traced the ferroelectricity to the Mn-O in-plane hopping which is distortion dependent, and has shown that ferroelectricity appears in the magnetic ordered phase despite a large negative magnetoelectric coupling.
In this work, we will use a combined theoretical (DFT calculations) and experimental hyperfine [perturbed angular correlation spectroscopy (PAC)] approach. In a previous work [18], some of us have presented first-principles calculations on the CaMnO3 system, with the goal of understanding PAC results with a 111mCdCd probe. This probe has the particular advantage of keeping the element unchanged during the measurement. We considered the incorporation of a Cd impurity in the manganite matrix, to calculate the properties at the probe location. Here we use the same approach for the first-principles calculations, and expand the PAC study to the other alkaline-earth manganites, of Ba and Sr, with the same 111mCdCd probe, and also with the 111InCd probe in one case. Monophasic samples were synthesized: BaMnO3 in the 6H phase and 15R phases, and SrMnO3 in the 4H phase. We will direct our first-principles calculations to the electric field gradient (EFG), which is compared directly to the experimental PAC data. We selected these three single phase samples in order to have examples of different polymorphs, to see to what extent the different kinds of local environments affect the EFG, allowing us to simplify the fits and analysis of the spectra in each case. The diagonalized EFG tensor, with components conventionally named according to their magnitudes , is usually characterized by and the asymmetry parameter . A local hyperfine property has several advantages, e.g., it can be related to chemical bonding and structure and can distinguish between different local environments, such as different lattice sites, and local defects in the probe’s neighborhood. Since the EFG depends sensitively on the electron density its calculation will also be a good test of the theory in these systems.
Finally, due to the interest in the magnetoelectric coupling in this family of materials, the above mentioned multiferroic will be studied by ab initio calculations, in order to predict the measured EFGs in this compound, and its variation with the structural degrees of freedom.
In the next sections we present results of calculations for SrMnO3 (section 2.1) and for different polymorphs of BaMnO3 (section 2.2), and discuss the results. Direct comparison with the experiments is done by performing the calculations with diluted Cd supercells, for the cases of 4H-SrMnO3 and 6H-BaMnO3. The experimental results are presented in section 3 in the same order, with its interpretation in relation to calculations. In section 4 we show our analysis of EFG calculations in the multiferroic perovskite manganite Sr0.5Ba0.5MnO3 [16], and its possible variation with the polarization and structural changes. We conclude with a summary.
2 First-principles calculations - hexagonal manganites
For the study of hexagonal manganites, we use the mixed LAPW/APW+lo full potential method, as implemented in the wien2k package [19], which is known to provide accurate results, including the hyperfine parameters. In this method the space is divided in atom-centered spheres and the interstitial space. The wave functions inside the spheres are expanded in atomic like functions, linear combinations of spherical harmonics times radial functions. In the interstitial region the wave functions are expanded in plane waves. Several k-points grids and maximum wave numbers for the plane waves were tested in the simple cases to obtain a good convergence of total energy and EFGs. When calculating larger supercells the number of k-points is diminished in conformity with the increasing size of the supercell. The GGA functional from Wu and Cohen [20] is used for all the calculations except if noted otherwise. Core states are treated fully-relativistically while valence states are treated in the scalar-relativistic approximation.
The vasp code [21] also allows calculation of EFG tensors, and it will be used later (section 4) on in the multiferroic compound. It has been shown that both codes produce similar EFG values variations with polarization in ferroelectric perovskites [22].
2.1 SrMnO3
SrMnO3 with the 4H structure has the space group number 194, . The Wyckoff positions and fractional coordinates of the atoms in this structure are the following: Sr1: 2a; Sr2: 2c; Mn: 4f (, , ); O1: 6g; O2: 6h (-, , ). With the experimental data of Battle et al. [8] and , and the lattice parameters are Å, Å. We used this structure as a starting point for our calculations. After relaxing the free atomic coordinates to calculated atomic forces less than eV/Å, the atomic coordinates are and . This corresponds to small variations of and for and . The small variation of is within the experimental error. The lattice parameters were not optimized, since usually the experimental ones are more dependable. In this case we found that a mesh of k-points and (where is the smallest muffin-tin sphere radius, and is the largest wave number used in the plane wave expansion) is enough for reasonably converged results, but more stringent criteria are used in the actual results. Table 1 shows that the EFG values are similar for both experimental and theoretically relaxed structures, when assuming ferromagnetic (F) arrangement of Mn atoms, as should be expected if the calculations are accurate. (Units of V m-2 will be used throughout this paper.)
We also considered the magnetic state where neighbor Mn planes in the direction have opposite spin polarization. This antiferromagnetism, called A-AF [23], is the stable magnetic order at low temperatures. For this case the deviation of the theoretically optimized structure in relation to the initial experimental structure is even smaller, as expected. With the experimental structure, this order is stable in relation to the ferromagnetic state by eV/f.u. according to our calculations. The structural coordinates are not moved more than 0.09% relative to the experimental value in the case of . Both parameters are equal to the experimental ones within the experimental error. This translates into almost exactly equal hyperfine parameters for the theoretical and experimental structures, even more so than in the F case. Nevertheless, the agreement is already good for the F state, therefore, in the following calculations, when we introduce Cd impurities, ferromagnetism is considered for simplicity, and furthermore, because in the temperature range where we will measure and compare with theory SrMnO3 should be paramagnetic [8]. We show that the influence of the different magnetic states in the EFG is small, for all atoms, in table 1.
| Atom | (F, exp.) | (F, rel.) | (A-AF,exp.) | (A-AF,rel.) |
|---|---|---|---|---|
| Sr 1 | 3.94 | 4.11 | 4.01 | 4.09 |
| Sr 2 | 1.63 | 1.39 | 1.90 | 1.79 |
| Mn | -0.29 | -0.40 | -0.45 | -0.48 |
| O 1 | 7.66; 0.07 | 7.73; 0.06 | 7.56; 0.21 | 7.61; 0.21 |
| O 2 | -8.17; 0.01 | -8.10; 0.02 | -7.89; 0.10 | -7.84; 0.09 |
| Mn 2 (A-AF) | -0.45 | -0.47 |
In order to reproduce the experimental situation of a highly diluted Cd probe (approx. smaller than ppm), we start by assuming that the Cd occupies the Sr sites substitutionally. This substitution of Cd at the alkaline earth site has been found in the Ca manganite [18], and is usually found experimentally in other manganites as well [24]. It is also a good assumption based on the ionic picture Sr2+Mn4+O and considering that Cd has ionic charge 2+. Two cases are possible: Cd occupies the Sr1 site, or the Sr2 site (as defined above).
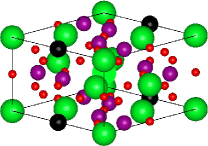
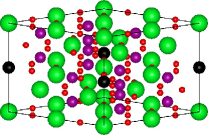
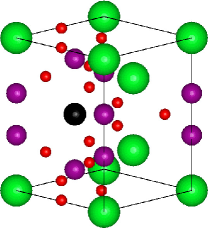
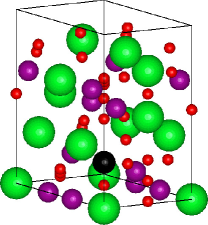
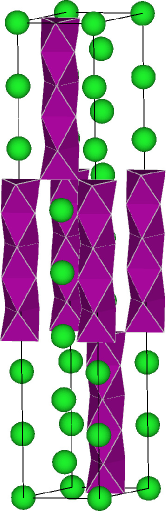
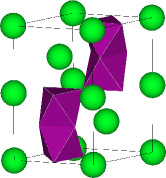
These two situations are considered in independent calculations, and since dilutions of the order are not feasible for calculations, we use a series of increasingly larger supercells with one Cd to calculate different impurity concentrations such that the EFG converges to the high dilution limit when Cd concentration is lowered. (See Figs. 2 and 3 for representations of some supercells.) As mentioned before, for this case we use only the F magnetic arrangement. With one atom of Cd substituting one of the sites in a single unit cell, Sr0.75Cd0.25MnO3 is obtained (25% of Sr sites are substituted). If we double the dimensions in the direction (), we get Sr0.875Cd0.125MnO3, while doubling both and directions gives a Sr0.9375Cd0.0625MnO3 composition (6.25%). Finally, for the case of substitution at the Sr 1 site, we also doubled the previous supercell in the direction, getting a supercell with 3.125% concentration. The use of high Cd concentrations when compared with experiment is justified by the locality of the EFG, as the convergence of the results will show.
Table 2 shows the calculated EFG for Cd at the Sr1 site, and the values of appear to be approximately converged, around V m-2 for concentrations of 12.5% and lower. The calculation with higher Cd dilution, with 3% (1/32) of Cd atoms substituted at Sr sites, gives . due to the hexagonal symmetry, except for the 2x1x1 supercell (where ) constructed for Sr0.875Cd0.125MnO3, where . Table 2 also contains the same type of calculations for the case where Cd is substitutional at the Sr2 site. In this situation is fairly converged at a value of the order of when considering the supercell ().
The calculated atomic forces are very low with just a maximum small force of 0.26 eV/Å in one of the sites. Comparing the values obtained with Cd and the at the corresponding Sr atom in the pure compound, we find that the value remains of the same order at the Sr2 site, but at the Sr1 site the value of with Cd is considerably higher. The changes due to Cd substitution, although small, are different for each site, showing that structural and electronic relaxations are essential to obtain accurate values.
The results for both cases with 6.25% of Cd have the same energy, within the accuracy of the calculations, with a meV/f.u. difference.
| (Sr1) | (Sr2) | |
|---|---|---|
| 0.25 | 3.85 | 0.36 |
| 0.125 | 6.08 | 1.38 |
| 0.0625 | 6.47 | 1.48 |
| 0.03125 | 6.22 |
2.2 BaMnO3
For the 6H-BaMnO3 compound, the starting point for the 6H structure was taken from the work of Adkin et al. [2]. This structure has the space group, lattice parameters , Å. The Wyckoff positions are: Ba1: 1a; Ba2: 1d; Ba3: 2h (, , ); Ba4: 2i (, , ); Mn1: 2g (, , ); Mn2: 2g (, , ); Mn3: 2i (, , ); O1: 3j (, , 0); O2: 3k (, , ); O3: 6n (, , zO3); O4: 6n (, , zO4). The experimental data is , , , , , , , , , , (as displayed in table 4 of [2], however, note that the coordinates of three oxygen atoms should be negative). Ferromagnetism was assumed, which is not a known state of BaMnO3, but this should be reasonable judging by the the similar system SrMnO3-4H (shown previously) where the EFG has small changes with a different magnetic state. 20 k-points in the irreducible Brillouin zone (but 5 k-points are already enough for converged results) and a maximum wave number with were used (, used in some supercells, already gives converged results). With this calculation the atomic forces are generally low (one force at 0.82 and the rest less than 0.33 eV/Å). The symmetrically unconstrained atomic parameters were permitted to vary and a theoretically more stable structure was obtained, where the atomic forces are lower than 0.05 eV/Å. The atomic coordinates obtained have at most a 0.88% difference with respect to the initial experimental ones.
Results of the EFG for the structure of Adkin et al. and after relaxation of internal parameters are summarized in Table 3. We show also the results with the GGA-PBE functional [28]. There are almost no changes in the results with the PBE, typically of the order or less than V m-2. The asymmetry parameter is also shown for the sites where symmetry allows it to be different from zero, and it is usually very small, except for one of the oxygen atoms. We also performed a test including spin-orbit coupling, using the previously relaxed structure, but this also produced insignificant changes in the results. Results for the EFG of the 15R phase and the hexagonal polymorphs 2H (which is the stable phase at low temperatures) and 4H are shown in tables 4 and 5. The 2H structure is taken from [3] [space group , , Å, with Wyckoff positions: Ba: 2d; Mn: 2a; O: 6h (, 2, ), with ] and the 4H structure is taken from our own X-ray diffraction measurements [space group , , Å, with Wyckoff positions: Ba1: 2a; Ba2: 2c; Mn: 4f (, , ); O: 6g, with . after DFT relaxation]. The 15R experimental structure is from Adkin et al. [2] [space group , Wyckoff positions: Ba: 1a; Ba2: 2c (, , ); Ba3: 2c (, , ); Mn1: 1b; Mn2: 2c (, , ); Mn3: (, , ); O1: 3e; O2: 6h (, , ); O3: 6h (, , ), with the experimental values being , , , , , , , (Table 2 from [2] with coordinates in the hexagonal system). The atomic coordinates were also optimized, and remain qualitatively equal to the experimental structure calculations.
These calculations show that the EFG has variations depending on the polymorph, particularly in the different atoms of Ba, due to the different packings of Mn-O octahedra. Mn atoms have between -2.6 and 0.2 V m-2 for all polymorphs, and O atoms have EFGs approximately between -9 and 9.5, and in absolute value are located in the range from 5.9 to 9.5. Ba has usually one high value between 10 and 13, and for other Ba atoms the EFG can be quite low, depending on the structure.
| Atom — | (exp) — | (exp.) — | (rel) — | (rel) — | (rel + so) — | (rel + so) |
|---|---|---|---|---|---|---|
| Ba 1 (chc) — | -0.26; -0.27 | -0.22; -0.13 | -0.24 | |||
| Ba 2 (hhh) — | 11.86; 11.82 | 13.05; 12.73 | 13.05 | |||
| Ba 3 (hch) — | 9.38; 9.38 | 9.09; 8.83 | 9.10 | |||
| Ba 4 (hhc)— | 5.01 ; 4.95 | 4.76; 4.67 | 4.76 | |||
| Mn 1 — | 0.03 ; -0.03 | 0.18; 0.10 | 0.17 | |||
| Mn 2 — | -1.79; -1.91 | -1.75; -1.85 | -1.76 | |||
| Mn 3 — | -0.20; -0.27 | -0.24; -0.31 | -0.25 | |||
| O 1 (chc) — | -9.01; -9.12 | 0.02; 0.01 | -8.96; -9.08 | 0.01; 0.02 | -8.95 | 0.01 |
| O 2 (hhh) — | -6.01; -6.10 | 0.07; 0.09 | -6.05; -6.21 | 0.03; 0.02 | -6.04 | 0.03 |
| O 3 (hch) — | 8.49 ; 8.66 | 0.001; 0.005 | 8.43; 8.69 | 0.003; 0.003 | 8.42 | 0.003 |
| O 4 (hhc) — | -7.69 ; -7.78 | 0.38; 0.38 | -7.66; -7.80 | 0.36; 0.35 | -7.65 | 0.36 |
| Atom | ||
|---|---|---|
| Ba 1(hch) | 7.12 | |
| Ba 2(hhh) | 11.35 | |
| Ba 3(hhc) | 4.55 | |
| Mn 1 | -1.73 | |
| Mn 2 | 0.19 | |
| Mn 3 | -1.79 | |
| O 1(hch) | 8.43 | 0.06 |
| O 2(hhh) | -6.13 | 0.03 |
| O 3(hhc) | -7.79 | 0.35 |
| Atom — | — | — | — | |
|---|---|---|---|---|
| Ba 1 | 9.99; 11.93 | 10.33; 10.22 | ||
| Ba 2 | 1.64; -0.38 | |||
| Mn 1 | 0.10; -0.29 | -1.92; -1.90 | ||
| O 1 | -9.45; -9.10 | 0.08; 0.05 | -6.52; -6.58 | 0.04; 0.06 |
| O 2 | 8.58; 8.56 | 0.07; 0.06 |
With c and h denoting horizontal layers of Ba and O where two MnO6 octahedra share corners or faces, respectively, and concerning the different hexagonal polymorphs, there are four possibilities for local (3 layers) Ba/O environments, corresponding to the central layers of the following sequences: chc, hch, hhc, and hhh (see figure 8 of [2]). In the 6H polymorph the four kinds of environments interact, and correspond, in the same order, to the Ba1/O1, Ba3/O3, Ba4/O4, and Ba2/O2 layers (see numbers in figure 1). The exact values for the same environment in the other polymorphs are obviously different, due to the different interactions between environments, however, there are general trends followed by the of Ba atoms in the different structures. In the 2H form, consisting of infinite chains of face sharing octahedra along the direction, there is only one type of Ba atom (hhh), with the high value reported (table 5). This environment also corresponds the highest value in BaMnO3-6H. The second largest value in 6H polymorph corresponds to the Ba3 site, with a hch layer (which is a corner-sharing layer, but also surrounded by face-sharing environments). In BaMnO3-4H, where there are hch and chc environments, hch corresponds to the largest value, with chc corresponding to a smaller , which also happens to be the smallest in 6H. Finally, in the 15R structure the following environments coexist: hhh, hch, and hhc. The same order is followed as in the 6H case, namely (hhh)(hch)(hhc). In summary, considering the different Ba environments, the following rule is general: (hhh)(hch)(hhc)(chc): the more neighboring face-sharing octahedra, the higher is. In the O environments, although the values are closer, there is also a general rule for all the polymorphs studied, (hhh)(hhc)(hch)(chc), considering only the absolute value. Considering the sign, it is notable that the environment (in BaMnO3-6H, BaMnO3-15R, and BaMnO3-4H) is a positive while the other environments correspond to negative values. As for the Mn atoms, the ones centering corner-sharing octahedra have while the others have . To finish this analysis, we can say this case clearly illustrates the locality of EFG, since sites with the same elements can be equated and distingued across polymorphs based only on their neighboring environments.
In order to compare with the PAC experiments with Cd probes, we introduce Cd impurities substitutional at the Ba site. We consider the case of the BaMnO3-6H structure, and note that the structure is already quite complicated without Cd, making large supercells computationally demanding. However, already with the unit cell we can substitute one atom of Cd to get the concentration . Having considered this fact we calculated the other Cd substitutions also for the high concentration , in order to reduce computational time, expecting this to be a good approximation to the low impurity concentration limit. We present the obtained at the Cd site substituted in each of the inequivalent Ba sites in the table 6. The asymmetry is zero at the Cd sites for all cases due to lattice symmetry.
The comparison of the EFG at Cd (table 6) with the EFG at the respective Ba sites in the pure compound (table 3) shows no proportionality, meaning that, as expected due to the different local environments, the Cd impurity probes provoke different changes in structure and in the local charge density. We also show the results of the total energies for those four supercells, according to which the probe should occupy preferentially the Ba1 site, followed by the Ba3 site.
| Site with Cd | — V m | — Total energy (eV) |
|---|---|---|
| Ba 1 | -1.72 | -0.65 |
| Ba 2 | 4.80 | 0 |
| Ba 3 | 2.27 | -0.41 |
| Ba 4 | 0.20 | -0.25 |
These cells are complicated, and yet their size may not be enough for a good convergence of the EFG. To get a good value for the Cd at the (hhh) environment, we used the simpler 2H polymorph and constructed a supercell, where the Cd atoms are separated by approximately the same distances as in a 6H supercell. The result is , which shows that probably at the Ba2 site would increase with the supercell size, and that the calculated values for Cd at BaMnO3-6H can only be taken as a qualitative approximation.
3 Experimental results - Hexagonal Manganites
Monophasic samples of BaMnO3 with the 6H structure, other monophasic samples with the 15R structure, and others of SrMnO3 with the 4H structure were prepared with the urea sol-gel combustion method [29] or with conventional solid state method.
In the combustion method stoichiometric amounts of BaCO3 and Mn(NO3)4H2O (ABCR %) were dissolved in diluted nitric acid. The pH of the solution was adjusted to 5.2 with ammonia solution. The added amount of urea was calculated so that 3 moles of urea were presented for each mole of cationic element (Ba+Mn). The solution was stirred and heated to evaporate all water and decompose the urea. At the end of the process (when the temperature reaches 200°C) the gel auto ignites and a controlled but fast combustion (3 to 5 seconds) yielded a dark powder. This powder was calcinated at 600°C for 1 hour followed by 700°C for 5 minutes, grounded with a mortar and a pestle, passed through a 38 sieve and pelletized. The pellet was thermal treated at 900°C for 40 hours regrounded with a mortar and a pestle, repelletized and treated at 1400°C for 100 hours with quench cooling (less then 1 minute (yielding phase Ba-6H)). For samples prepared by conventional solid state method, BaCO3 (or SrCO3) and MnO2 were mixed with ethanol and calcinated at 700°C during 40 hours. Thermal treatments were processed at 900°C, 1000°C and 1100°C during 40 hours with intermediate grindings. Final sintering was performed at 1275°C for 180 hours with quench cooling, yielding phases Ba-15R and Sr-4H.
The densities of the samples were measured by geometric factor using a vernier calliper. The x-ray diffraction patterns were obtained in /2 mode from 10 to 90°in an X’Pert Pro diffractometer equipped with a X’Celerator detector and a secondary monocromator. The data were analysed using the Powder Cell 2.3 software [30] and structural data from Adkin [2]. SEM was performed using a FEI Quanta 400 equipped with an EDS from EDAX.
These samples were subsequently implanted with the radioactive 111mCd and 111In probes, with concentrations in the order of ppm. The isotope beams were produced at the ISOLDE-CERN facility, and the implantation was done in high vacuum at room temperature, at 60 keV, with a dose of approximately atomscm-2.
In the time-differential perturbed angular correlation method, the directional correlation of the two gamma decays in a decay cascade of the radioisotope probe is perturbed by the hyperfine interactions, which depend on the nuclear properties of the isotope and on the extranuclear local environment [31]. The 111mCd probes decay to 111Cd with two consecutive decays. The intermediate state has a half life ns while the parent state decays with minutes. The quadrupole nuclear moment of the intermediate nuclear state, relevant for the hyperfine interactions, is (taken from [33]). The 111In probes decay to the same intermediate state.
All of the relevant experimental information is condensed in the anisotropic ratio function , expressed as , a function of time, where are called anisotropy coefficients and depend on the spins and multipolarity of the decays, and contains the information of the hyperfine parameters, relevant to the system under study. The anisotropy coefficients are shown in table 7.
| Parent nucleus | A22 | A24 | A42 | A44 |
|---|---|---|---|---|
| 111mCd | 0.1258 | -0.0956 | -0.0006 | -0.0004 |
| 111In | -0.1121 | -0.0716 | -0.0003 | -0.0004 |
A numerical fit of the R(t) function with its Fourier analysis, taking appropriate nuclear and transition parameters, yields the hyperfine parameters, EFG and magnetic hyperfine field [32]. The quadrupole electric interaction, with additional knowledge of the probe’s quadrupole moment, gives the EFG.
In our studies the magnetic hyperfine field is not detected. SrMnO3, known to have T [8] or K [4], will be paramagnetic at all temperatures measured, except for room temperature, where it may be antiferromagnetic. For BaMnO3, the Néel temperature depends of the polytype. For the phases of interest, 6H and 15R, its values are of the order 250 K [2], so that also on almost all temperatures measured it is paramagnetic. Therefore we assume there are no magnetic interactions, and start by considering one EFG (environment), increasing the number of environments until no more are needed to account for the experimental spectrum. The frequency, asymmetry parameter, and shape of the distribution are fitted to the spectrum in different runs of the fit program, after which we estimate its error by simple statistics of the output values obtained when running many independent fits starting from different, and reasonable, values of these parameters.
Each measurement at different temperatures was done with a different sample, this was required to get good statistics in the lifetime of the isotope. Preceding each measurement the samples were annealed in vacuum at 700°C during a period of 20 minutes, to remove defects from implantation. These conditions were found to be enough in previous studies of other manganites [24, 34, 35, 36].
3.1 X-ray powder diffraction
X-ray powder diffraction was used not only for the structural identification and quality check of the samples, but also to check that the conditions of implantation, annealing and measurement had no influence on the initial state of the samples. The Cu anode was used, with wavelenghts Å, Å, and Å. The scanning is continuous with a step size of 0.001 degrees, and . X-ray spectra were taken at various high temperatures, including several hours at a temperature of 900°C, to check that the annealing of 700°C, during 20 minutes before the PAC measurement has no influence on the structure. Refinement parameters of representative powder diffraction patterns are shown in table 8.
For BaMnO3, the several possibilities of different phases (4H, 7H, 15R, 6H, …) that could appear are not easily distinguishable in the diffraction patterns so it is possible that some structural changes occurred with the implantation, annealing, and PAC measurement. However, this is unlikely, given the consistent PAC results on the several temperatures measured for BaMnO3-6H, as we will show. BaMnO3-2H, the most stable low temperature structure, is easily eliminated from this set of possible structures on all diffraction patterns.
| Sample — | Phases — | RP — | Rwp — | Rexp — | — | |
|---|---|---|---|---|---|---|
| SrMnO3-1 | 4H | 12 | 18 | 3.15 | 5.4526 | 9.0841 |
| BaMnO3-1 | 6H | 6 | 10 | 0.52 | 5.6277 | 13.9730 |
| BaMnO3-21 | 6H | 39 | 51 | 0.54 | 5.6652 | 13.9678 |
| BaMnO3-22 | 6H | 32 | 44 | 0.45 | 5.7162 | 14.0316 |
| BaMnO3-3 | 15R | 3 | 4 | 0.65 | 5.6978 | 35.3354 |
3.2 Magnetization
Measurements of magnetization temperature dependence were also performed in the studied samples, one for each phase. A vibrating sample magnetometer was used, with magnetic field T for SrMnO3-4H and BaMnO3-15H, and T for BaMnO3-6H. The results are presented in figure 4. Small anomalies are detected, signalling magnetic transitions, in SrMnO3, at K ( ∘C) (consistent with previous measurements [8]), which are much sharper in the cases of BaMnO3-6H, at K, and in BaMnO3-15R, at K ( ∘C) (consistent with [2]).

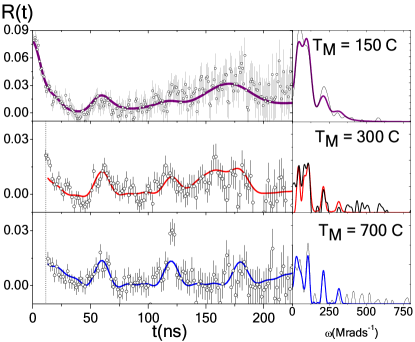
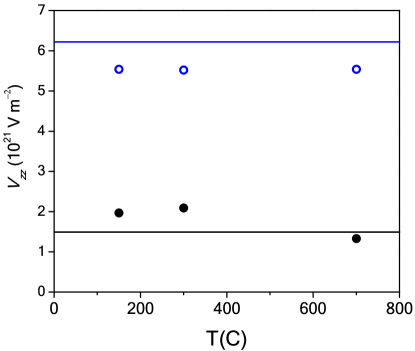
3.3 PAC - SrMnO3
The SrMnO3 PAC spectra for temperatures of 150, 300 and 700°C are shown in figure 5. The spectra can be reasonably fitted with two distinct local environments, fractions of 50 %. are shown for 50/50 fractions and asymmetry fixed to 0 in figure 5. However, the 50% values have a large estimated 20% uncertainty, due to the statistical error and highly attenuated spectra. In this interval reasonable fits are still achieved.
Assuming the fractions fixed at 50/50 and asymmetry values fixed at zero (also not crucial to the fit with these spectra), the higher, best defined value of , and the lower are found to be almost constant in the temperature range (150-700°C). This is consistent with the similar behavior in the CaMnO3 system [24]. The calculations of the two substitutions of Cd in the two Sr sites, shown earlier, give two values of in qualitative agreement, as the values are rather close (figure 5). The small differences from the calculations in the higher value may be due to both temperature effects and the incomplete convergence of with the size of the supercells. These results suggest that the Cd probe occupies substitutionally both Sr sites, which is in agreement with the similar total energies predicted by the calculations. The of lower magnitude is almost constant as, far as we can tell, since given the limited time window the fit of a low EFG is not very accurate.
3.4 PAC - BaMnO3
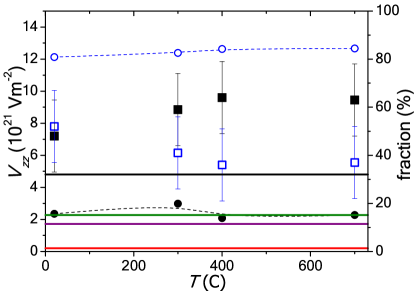
The spectra for the 6H-BaMnO3 taken between 16 and 700°C do not present appreciable frequency changes, and similarly the obtained EFG are constant, as shown in Figs. 6 and 6. In this case the comparison with the first-principles calculations shows that one of the experimental frequencies measured is too high ( V m-2) to be accounted by any of the values calculated with the Cd probe substitutional in a Ba site, even according to our previous (hhh) BaMnO3-2H supercell calculation which gives V m-2. Surprisingly this is also the most well defined fraction of the spectrum. Its fraction is very large (40-50%), of a unique local environment so it is unlikely that it it comes from a different phase, as such a large fraction should be detected in the powder X-ray spectra, in spite of the difficulties to distinguish between the polymorphs. Since the sample is a polycrystal, it may be due to probes located at or near grain boundaries. We may also speculate that the corresponding Cd probes are favorably located near vacancies or some other kind of defect, producing this high EFG. One test calculation, a supercell with Cd substitutional at one of the sites and an oxygen vacancy as a nearest neighbor produced, after atomic relaxations, a relatively small V m-2. It is however possible that other sites for vacancies or vacancy-probe separations may explain the present result.
The lower EFG values of the other fractions may be interpreted as substitutional Cd atoms at the Ba sites since its value is close to the different values calculated at the Cd atom substituting the inequivalent Ba sites, as can be seen by the lines in figure 6. It is especially close to the Ba1 and Ba3 site calculations, which is consistent with the fact that these sites are predicted to favor Cd substitution over the others (table 6).
Note that the fractions have a high estimated average error, shown in the figure by error bars, so that an increase/decrease of the different environments with temperature cannot be established definitely, although an increase of the lower fraction is likely. We further estimate a high accuracy for the higher () while the lower is less accurate ().
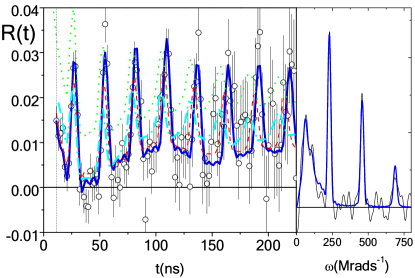
In this case, to get more information and confirm the previous measurements, we have also implanted the probe 111In/111Cd on 6H-BaMnO3 samples. The initial state of the cascade is different from the 111mCd and has different anisotropy coefficients, but the intermediate state of the - cascade is the same, and if the 111In probe goes to the same lattice sites as 111mCd when implanted and annealed, we should get the same quadrupole frequencies. The samples were measured with this probe in the temperature range 16-850°C. The spectra are, as expected, almost constant on this range of temperatures (13, 16, 206, 409, 510, 611, 782 and 858°C). R(t) representative functions and its Fourier transforms are shown in figure 7. Unlike the Cd probe case, the fit has to be done not with two, but three fractions. There are two fractions in agreement with the 111mCd case and there is a third fraction, also with V m-2, higher than with the calculations. This value is closer to the V m-2 calculated for the (hhh) environment, therefore the Ba2 site substitution might be an additional effect caused by the implantation of 111In, which in this case could not be removed with thermal annealing (which is the same as in 111mCd implantations). There is a slight increase of the frequencies of the higher with increasing temperature, as in the 111mCd probe case. Therefore, in this case a fraction of the probes () must still be substitutional at the Ba sites 1 or 3, with the lower , probably another fraction at the the Ba 2 site, and for the other environment we still cannot assign a specific site. The three environments have average values 26.2%, 27.3%, and 43.7%. The value of the fractions of each environment has an estimated error bar of around 5%. The results obtained at different temperatures are consistent with reasonably stable fractions of the three reported environments. The corresponding error bar in is V m-2.
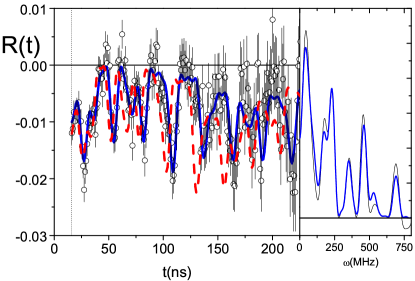
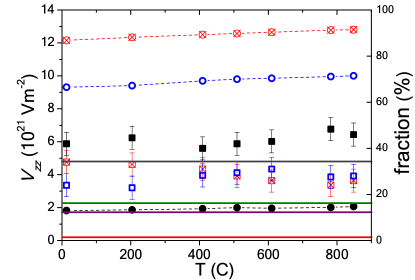
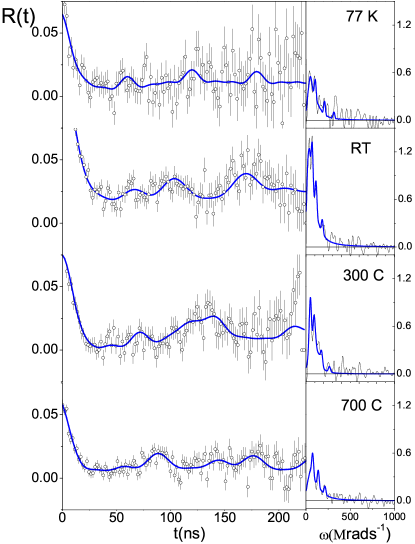
Figure 8 shows measurements in the 15-R polymorph samples. The perturbation functions are quite attenuated and low frequencies are measured at all temperatures 77 K, RT, 300°C and 700°C.
At room temperature and above, two different EFG environments clearly give a much better fit than just one EFG. At 77 K, due to the large statistical error, this is not so clear, but in order to be consistent with the RT measurement, two EFGs were used in all fits. The fractions of the two environments are approximately and in all the fits. Again, for the low temperature there was a large range allowed due to the larger statistical error, but the fits at all temperatures used starting values of and (values obtained by fitting the RT measurement), and the final values do not change significantly in any case. The experimental EFG parameters for both fractions are shown in table 9.
The parameters are interspersed values on the range to for fraction f1 and to V m-2 for fraction f2. These small variations may exist due to structural variations with temperature or dynamic effects, but these values are close to the calculated values at Cd in the 6H polymorph, indicating also substutional Cd at the Ba sites in this case.
| T | Vzz of f1 | of f2 |
|---|---|---|
| 77 K | 2.58 | 5.55 |
| 30 C | 1.89 | 3.12 |
| 300 C | 2.62 | 4.66 |
| 700 C | 3.00 | 3.72 |
4 Sr1/2Ba1/2MnO3
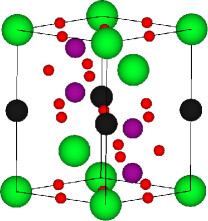
In this section we study the EFGs of the constituent elements in the mixed perovskite Sr1/2Ba1/2MnO3 and its variation with electric polarization. In this case we used the projector augmented wave (PAW) method [37], as implemented in vasp [21]. Following the previous DFT study of this case [17], we minimize the total energy relaxing the polar displacements of Mn and O atoms, with the experimental Å, and we also consider both and , which are representative experimental values of the paramagnetic and G-AF phases, respectively (see Sakai et al. [16], figure 3). The same GGA+U approach is used with eV and eV for the Mn electrons,. The G-type antiferromagnetic order is considered, and we assume the ordered structure for the Ba/Sr ions in the same alternating fashion.
After relaxation of the ionic position to forces less than eV/Å we obtain a spontaneous polarization of C cm-2, with , which is smaller than the value obtained by Giovannetti et. al. [17], and consistently also Mn-O-Mn angles closer to . This is probably due to different PAW potentials used, which also result in different ionic and electronic contributions. Table 10 summarizes the results. The calculation for follows the expected tendency to supress ferroelectricity, mainly with a change of electronic polarization, consistent with [17].
| 2.02 | -12.09 | -10.06 | 177.89 | |
| 2.39 | -7.64 | -5.25 | 178.82 |
Using the structure as a reference we considered a set of structures in the adiabatic path connecting this structure to the centrosymmetric () structure, by changing the amplitude of the polar distortion. In this way we can check what is the sensitivity of the EFG with distortion, and the possibility of probing polarization differences via EFG variations. The polarization varies linearly with the distortion, as is the case for other displacive ferroelectrics such as BaTiO3. The variation of EFG with the distortion (polarization) is quadratic, also similar to BaTiO3 [22]. However, contrary to that case, the EFG is almost insensitive to the polarization changes. figure 9 presents the variation of against for the inequivalent atoms of the structure.
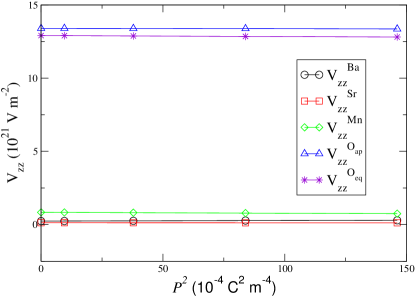
The values appear constant in the whole range studied. The Ba/Sr/Mn atoms have always values close to , which would be the case in the ideal cubic structure. The O site would have a high in the cubic structure, close to the ones calculated here for all distortions. In fact they have regular variations discernable by the calculations, as shown in table 11, but still very small. at the Ba atoms increases with distortion while it decreases for the other atoms. However, even this small variation appears only for artificially large polarization variations which are unlikely to be found.
One fact helps to understand this small variation of the EFG, in distinction to BaTiO3 [22]. Here, the Mn and O atoms are displaced Å, whereas in BaTiO3 the displacements are , and Å, and already in that case the EFG did not change much (V m-2 on average, in the complete distortion range). (However, note that the EFG is generally a function of the electron density, and its variation cannot be attributed to displacements only. In other cases, a change of magnetic order while keeping the same structure is enough to change the EFG at some atoms, such as hexagonal rare-earth manganites and YMn2O5 [38].) In the present case, the small changes, though essential to stabilize the considerable polarization, are not enough to produce appreciable changes in the EFG. By considering also the case (table 11, last row), with atomic relaxation, one can also check approximately the effect of the structural variation which is seen from the paramagnetic () to G-AF () order. Now the effect is larger, but still small, and may not be easily distinguised in an experience, where factors such as the statistical data acquisition error may decrease the accuracy of the measurements. Therefore, we conclude that the EFG at every site from the static contribution is approximately constant at the ferroelectric phase. However, this also brings an opportunity, since in this case the dynamic effects should dominate the EFG variation. This could be useful to analyze the phase transition, due to the increasing fluctuations near , where the EFG is expected to present an abrupt variation similar to the divergence of electric susceptibility [24, 39].
| 0 | 0.241 | 0.129 | 0.837 | 13.400 | 12.907 |
|---|---|---|---|---|---|
| 0.25 | 0.245 | 0.129 | 0.831 | 13.398 | 12.900 |
| 0.5 | 0.258 | 0.128 | 0.814 | 13.392 | 12.880 |
| 0.75 | 0.279 | 0.126 | 0.786 | 13.379 | 12.848 |
| 1 | 0.292 | 0.123 | 0.745 | 13.359 | 12.807 |
| 0.136 | 0.064 | 0.403 | 13.169 | 12.906 |
5 Summary
We present a hyperfine local probing of BaMnO3-6H, -15R, and SrMnO3-4H manganites. The values of the EFG were measured with the 111mCd and 111In probes using the PAC method. It is found that is roughly constant in a range of temperatures 20-700°C, for both BaMnO3-6H and SrMnO3. First-principles calculations of the EFG with the accurate (L)APW+lo method are reported. The calculated EFG at all atoms is shown, with SrMnO3 in the low temperature structure, and various polytype structures of BaMnO3. The values are largely insensitive to the magnetic order or approximation used, and the relaxed structures give consistent results the experimental structures. For direct comparison with the experiments, we performed calculations with supercells and introducing a Cd impurity substitutional at the alkaline-earth sites. In the case of SrMnO3 there is a good qualitative agreement, which shows that the Cd probe occupies the Sr sites. For the case of BaMnO3-6H, although the calculated values are of the order of one of the measured values, other high values remain incompatible with the divalent alkaline-earth substitution. For BaMnO3-15R, the EFG has values of the order expected if Cd occupies the Ba sites.
Finally, we analyze the EFGs in the multiferroic perovskite manganite Sr1/2Ba1/2MnO3, and find that they should be approximately constant for a wide range of structures.
This work is supported by the program COMPETE/FFEDER and FCT under projects PTDC/FIS/105416/2008, CERN/FP/123585/2011 and CICECO – (PEst-C/CTM/LA0011/2011 and PEst-C/CTM/LA0011/2013). Further support from the ISOLDE collaboration, with approved project IS487, European Union Seventh Framework through ENSAR (contract no. 262010) and the BMBF German research program under contracts 05KK7TS2 and 05K10TS2 is acknowledged. JNG acknowledges his postdoctoral grant from FCT (SFRH/BPD/82059/2011). We thank H. Haas for useful discussions.
References
References
- [1] Goldschmidt V M 1926 Naturwissenschaften 14 477 1926
- [2] Adkin J J and Hayward M A 2007 Chem. Mater. 19 755
- [3] Cussen E J and Battle P D 2000 Chem. Mater. 12 831
- [4] Chamberland B L, Sleight A W and Weiher J F (1970) J. Solid State Chem. 1 506
- [5] Hardy A 1962 Acta Crystallogr. 15 179
- [6] Negas T and Roth S 1971 J. Solid State Chem. 3 323
- [7] Christensen A N and Ollivier G 1972 J. Solid State Chem. 4 131
- [8] Battle P, Gibb T and Jones C 1988 J. Solid State Chem. 75 60
- [9] Søndenå R , Stølen S, Ravindran P, Grande T, Allan N L 2007 Phys. Rev. B 75 184105
- [10] Søndenå R, Ravindran P, Stølen P, Grande T and Hanfland M 2006 Phys. Rev. B 74 144102
- [11] Søndenå R , Stølen S, Ravindran P and Grande T 2007 Phys. Rev. B 75 214307
- [12] Fava F, D’Arco P, Orlando R and R. Dovesi 1997 J. Phys. Condens. Matter 9 489498
- [13] Bhattacharjee S, Bousquet E, Ghosez P 2009 Phys. Rev. Lett. 102 117602
- [14] Lee J H and Rabe K M 2010 Phys. Rev. Lett. 104 207204
- [15] Rondinelli J M, Eidelson A S and Spaldin N A 2009 Phys. Rev. B 79 205119
- [16] H. Sakai et al. 2011 Phys. Rev. Lett. 107 137601
- [17] Giovannetti G, Kumar S, Ortix C, Capone M and Brink J V D 2012 Phys. Rev. Lett. 109 107601
- [18] Gonçalves J N, Haas H, Lopes A M L, Amaral V S and Correia J G 2010 J. Magn. Magn. Mater. 322 1170
- [19] Blaha P, Schwarz K, Madsen G, Kvasnicka D and Luitz J 2001 WIEN2k, An Augmented Plane Wave Plus Local Orbitals Program for Calculating Crystal Properties Techn. Universität Wien, Vienna .
- [20] Wu Z and Cohen R E 2006 Phys. Rev. B 731926 235116
- [21] Kresse G and Furthmüller J 1996 Phys. Rev. B 54 11169
- [22] Gonçalves J N, Stroppa A, Correia J G, Butz T, Picozzi S, Fenta A S and Amaral V S 2012 Phys. Rev. B 86 035145
- [23] Wollan E and Koehler W 1955 Phys. Rev. B 73 545563
- [24] Lopes A M L, Araújo J P, Amaral V S, Correia J G, Tomioka Y and Tokura Y 2008 Phys. Rev. Lett. 100 155702
- [25] Feiock F and Johnson W 1969 Phys. Rev. B 187 3950
- [26] Schmidt P C, Sen K D, Das T P and Weiss A 1980 Phys. Rev. B 22 4167
- [27] Sen K D 1985 J. Phys. C: Solid State Phys. 18 3153
- [28] Perdew J P, Burke K and Ernzerhof M 1996 Phys. Rev. Lett. 77 3865
- [29] Ferreira W S, Moreira J A, Almeida A, Araújo J P, Tavares P B, Mendonça T M, Carvalho P S and Mendoça S 2008 Ferroelectrics 368 107
- [30] Krauz W and Nolze G, “Powder Cell for Windows, version 2.3”
- [31] Schatz G and Weidinger A 1996 Nuclear Condensed Matter Physics: Nuclear Methods and Applications (Wiley, New York)
- [32] Barradas N, Rots M, Melo A and Soares J 1993 Phys. Rev. B 47 8763
- [33] Stone N 2005 At. Data Nucl. Data Tables 90 75
- [34] Lopes A M L, Araújo J P, Ramasco J J , Amaral V S, Suryanarayanan R and Correia J G 2006 Phys. Rev. B 73 100408
- [35] Araújo J P, Lopes A M L, Mendonça T M, Rita E, Correia J G and V. S. Amaral 2005 Hyperfine Interact. 158 347
- [36] Araújo J P, Correia J G, Amaral V S, Tavares P B, Lencart-Silva L, Sousa J B, Vieira J M and Soares J C 2001 Hyperfine Interact. 133 89
- [37] Blöchl P E 1994 Phys. Rev. B 50 17953
- [38] submitted
- [39] Yeshurun Y 1978 Solid State Commun. 27 181