11email: daniel.tafoya@chalmers.se 22institutetext: Institute of Astronomy and Astrophysics, Academia Sinica (ASIAA), 10617 Taipei, Taiwan, R.O.C 33institutetext: Instituto de Astrofísica de Andalucía (IAA-CSIC), Glorieta de la Astronomía s/n, E-18008 Granada, Spain 44institutetext: Instituto de Astronomía, Universidad Católica del Norte, Av. Angamos 0610, Antofagasta, Chile 55institutetext: Institut für Astro- und Teilchenphysik, Universität Innsbruck, Technikerstr. 25/8, 6020 Innsbruck, Austria 66institutetext: Jodrell Bank Centre for Astrophysics, School of Physics and Astronomy, University of Manchester, Manchester M13 9PL, UK 77institutetext: I. Physikalisches Institut, Universität zu Köln, Zülpicher Str. 77, 50937 Cologne, Germany 88institutetext: Instituto de Ciencia de Materiales de Madrid, Sor Juana Inés de la Cruz 3, 28049 Cantoblanco, Madrid, Spain 99institutetext: Observatorio Astronómico Nacional, Apdo. 112, 28803 Alcalá de Henares Madrid, Spain
(sub)Millimeter Emission Lines of Molecules in Born-again Stars††thanks: This publication is based on data acquired with the Atacama Pathfinder Experiment (APEX) and IRAM 30m telescopes. APEX is a collaboration between the Max-Planck-Institut für Radioastronomie, the European Southern Observatory, and the Onsala Space Observatory. IRAM is supported by INSU/CNRS (France), MPG (Germany) and IGN (Spain).
Abstract
Context. Born-again stars offer us a unique possibility of studying the evolution of the circumstellar envelope of evolved stars in human timescales. To present, most of the observations of the circumstellar material in these stars have been limited to study the relatively hot gas and dust. In other evolved stars, the emission from rotational transitions of molecules, such as CO, is commonly used to study the cool component of their circumstellar envelopes. Thus, the detection and study of molecular gas in born-again stars would be of great importance to understand their composition and chemical evolution. In addition, the molecular emission would be an invaluable tool to explore the physical conditions, kinematics and formation of asymmetric structures in the circumstellar envelopes of these evolved stars. However, until now, all attempts to detect molecular emission from the cool material around born-again stars have failed.
Aims. We searched for emission from rotational transitions of molecules in the hydrogen-deficient circumstellar envelopes of born-again stars to explore the chemical composition, kinematics, and physical parameters of the relatively cool gas.
Methods. We carried out observations using the APEX and IRAM 30m telescopes to search for molecular emission toward four well studied born-again stars, V4334 Sgr, V605 Aql, A30 and A78, that are thought to represent an evolutionary sequence.
Results. We detected for the first time emission from HCN and H13CN molecules toward V4334~Sgr, and CO emission in V605~Aql. No molecular emission was detected above the noise level toward A30 and A78. The detected lines exhibit broad linewidths 150 km s-1, which indicates that the emission comes from gas ejected during the born-again event, rather than from the old planetary nebula. A first estimate of the H12CN/H13CN abundance ratio in the circumstellar environment of V4334 Sgr is 3, which is similar to the value of the 12C/13C ratio measured from other observations. We derived a rotational temperature of =13 K, and a total column density of =1.61016 cm-2 for V4334 Sgr. This result sets a lower limit on the amount of hydrogen that was ejected into the wind during the born-again event of this source. For V605 Aql, we obtained a lower limit for the integrated line intensities /¿4.
Key Words.:
stars: evolution – stars: AGB and post-AGB – stars: mass-loss – stars: circumstellar matter – stars: carbon – (ISM:) planetary nebulae: individual: A58/V605 Aql, V4334 Sgr, A78, A301 Introduction
| Source | Equatorial coordinates | Frequency range | Beam sizea𝑎aa𝑎aThe fullwidth at half maximum (FWHM) of the telescope primary beam can be computed approximately as FWHMAPEX=, and FWHMIRAM=, where is the observation frequency. | b𝑏bb𝑏bMain beam efficiency of the telescope. The main-beam brightness temperature is obtained as =/. | c𝑐cc𝑐cApperture efficiency of the telescope. | (1/d𝑑dd𝑑dInverse of the point source sensitivity of the telescope. The relation between antenna temperature and flux density is expressed as =/. |
| (Name) | (h m s ) | (GHz) | () | (Jy K-1) | ||
| APEX | ||||||
| V4334 Sgr | 17 52 32.69 17 41 08.0 | 352.5 - 356.5 | 17.3 - 17.1 | 0.73 | 0.60 | 40.7 |
| 343.8 - 347.8 | 17.8 - 17.6 | 0.73 | 0.60 | 40.7 | ||
| V605 Aql | 19 18 20.47 01 46 59.6 | 343.8 - 347.8 | 17.8 - 17.6 | 0.73 | 0.60 | 40.7 |
| 328.5 - 332.5 | 18.6 - 18.3 | 0.73 | 0.60 | 40.7 | ||
| IRAM 30m | ||||||
| V4334 Sgr | 17 52 32.69 17 41 08.0 | 228.5 - 236.5 | 10.8 - 10.4 | 0.59 | 0.46 | 8.5 |
| 100.5 - 116.5 | 24.5 - 21.1 | 0.78 | 0.62 | 6.4 | ||
| 84.5 - 100.5 | 29.1- 24.5 | 0.81 | 0.63 | 6.2 | ||
| A30 | 08 46 53.49 17 52 46.8 | 228.5 - 236.5 | 10.8 - 10.4 | 0.59 | 0.46 | 8.5 |
| 100.5 - 116.5 | 24.5 - 21.1 | 0.78 | 0.62 | 6.4 | ||
| 84.5 - 100.5 | 29.1- 24.5 | 0.81 | 0.63 | 6.2 | ||
| A78 | 21 35 29.38 31 41 45.3 | 228.5 - 236.5 | 10.8 - 10.4 | 0.59 | 0.46 | 8.5 |
| 100.5 - 116.5 | 24.5 - 21.1 | 0.78 | 0.62 | 6.4 | ||
| 84.5 - 100.5 | 29.1 - 24.5 | 0.81 | 0.63 | 6.2 | ||
The term born-again star is commonly used to refer to a post-Asymptotic Giant Branch (post-AGB) star that temporarily re-visits the AGB as a consequence of experiencing a final helium shell flash (Iben 1984). During this phase, the born-again star undergoes a sudden episode of intense mass-loss and results in the formation of a hydrogen-poor (H-poor) thick circumstellar envelope (CSE) that enshrouds the star and renders it invisible at optical wavelengths (e.g. Duerbeck et al. 2000). After most of the gas on top of the stellar core is blown away by the strong stellar wind, the surface temperature commences to rise and a tenuous fast stellar wind takes over. At this point the star begins to re-trace the post-AGB track, while still burning helium on a thin layer around its core. In a similar way to the interacting stellar winds scenario for the creation of a planetary nebula (PN, plural PNe), the fast wind sweeps up the recently formed H-poor CSE and creates a compressed shell (Kwok et al. 1978). Once the star becomes hot enough (30,000 K), the energetic stellar radiation ionizes the shell and a brand new PN forms (sometimes referred to as “born-again PN”; e.g. Guerrero et al. 2012). If the final helium shell flash occurs when the star is already on the white dwarf cooling track, which is known as a very late thermal pulse (VLTP), it is possible that the born-again PN becomes visible while the old PN is still detectable. This shows up in the images as a bright compact PN nested inside a faint extended PN (e.g. Jacoby 1979). Observations of stars that are undergoing the born-again event have shown that the evolution from the born-again AGB star to the formation of a born-again PN happens on a surprisingly rapid timescale of tens of years. This implies that these objects offer us the unique possibility of studying the transformation of an AGB star into a PN on human timescales.
There is a small group of sources that are thought to have experienced a VLTP in relatively recent epochs and that currently are at different stages of their post-final flash evolution (Zijlstra 2002). The most recent born-gain event was observed in the late 1990’s toward the central star of a planetary nebula (CSPN) located in the constellation of Sagittarius (Nakano et al. 1996; Benetti et al. 1996; Duerbeck et al. 1996). The object was cataloged with the variable star name V4334 Sgr, but it is commonly known as Sakurai’s object, since it was discovered by the amateur astronomer Y. Sakurai. Another object that is thought to have experienced a born-again event in a very similar way to Sakurai’s object, but 75 years earlier, is the star cataloged as V605 Aql, which is the central star of the planetary nebula A58 (PN A66 58; PN G037.5-05.1) (Wolf 1920; Seitter 1987; Guerrero & Manchado 1996; Clayton & De Marco 1997). At present, this star exhibits spectral characteristics of a Wolf-Rayet [WC] CSPN with a temperature of 100 kK and its H-poor CSE has been partially photo-ionized (Clayton et al. 2006; van Hoof et al. 2007). Finally, two post-VLTP objects that have already developed a born-again PN from the hydrogen-deficient material that was ejected during the born-again AGB phase are the central stars of the PNe A30 (PN A66 30; PN G208.5+33.2) and A78 (PN A66 78; PN G081.2-14.9) (Guerrero et al. 2012; Toalá et al. 2015). It has been estimated that these sources experienced a born-again event a thousand years ago (Fang et al. 2014).
The four objects described above are often considered in the literature to represent different stages of an evolutionary sequence of born-again stars. Moreover, a striking common characteristic of all these objects is that the circumstellar material ejected in the born-again event seems to be distributed in an equatorial disk-like structure and a bipolar outflow (Borkowski et al. 1993; Guerrero & Manchado 1996; Chu et al. 1997; Hinkle et al. 2008; Chesneau et al. 2009; Hinkle & Joyce 2014). This characteristic is particularly interesting because explaining the formation of bipolar structures in evolved stars represents one of the major current challenges in stellar evolution (Balick & Frank 2002; De Marco 2014). Thus, these objects, which are developing bipolar morphologies in real time, are ideal to study the formation of asymmetric PNe. Extensive theoretical work has been devoted to explain the evolution of born-again stars (e.g. Herwig 2002; Miller Bertolami et al. 2006; Fang et al. 2014; Woodward et al. 2015, and references therein). In addition, these sources have been observed over a broad range of wavelengths from X-rays to radio waves (e.g. Hajduk et al. 2005; Toalá et al. 2015, and references therein). However, to date the detection of molecular emission at millimeter and sub-millimeter wavelengths, which traces the cooler molecular component of the CSE, has been elusive. In this paper we present observations carried out with the 12m Atacama Pathfinder Experiment (APEX) and the 30 m Institute for Radio Astronomy in the Millimeter Range (IRAM 30m) telescopes. We report on the first detection of molecular emission lines toward born-gain stars. This result opens a new window to study in real time the evolution of the physical and chemical properties of the hitherto unexplored cool gas around born-again AGB stars.
| Molecule | Transition | Rest frequency | Line peak()e,f𝑒𝑓e,fe,f𝑒𝑓e,ffootnotemark: | Line peak()g𝑔gg𝑔gThe flux density can be obtained as = (or equivalently, =). | vLSRe,h𝑒ℎe,he,h𝑒ℎe,hfootnotemark: | ve,i𝑒𝑖e,ie,i𝑒𝑖e,ifootnotemark: | j𝑗jj𝑗jVelocity-integrated intensity of the line | rmsg,k𝑔𝑘g,kg,k𝑔𝑘g,kfootnotemark: |
|---|---|---|---|---|---|---|---|---|
| (GHz) | (mK) | (mJy) | (km s-1) | (km s-1) | (K km s-1) | (mJy) | ||
| V4334 Sgr | ||||||||
| HCN | =43 | 354.50548 | 16.51.8 | 49052 | 18116 | 29837 | 4.9 | 139 |
| HCN | =10 | 88.63185 | 6.20.4 | 312 | 12814 | 40534 | 2.5 | 7 |
| H13CN | =43 | 345.33976 | 7.20.8 | 21524 | 12313 | 23630 | 1.7 | 57 |
| V605 Aql | ||||||||
| CO | =32 | 345.79599 | 4.00.5 | 11916 | 9611 | 16425 | 0.7 | 29 |
2 Observations
The observations with APEX were carried out in July and November 2013, and March 2016, toward the sources V4334 Sgr and V605 Aql. The typical precipitable water vapor level during the observations was 1 mm and the total on-source integration time was about 1.7 and 5.5 hours for V4334 Sgr and V605 Aql, respectively. The heterodyne receiver APEX-2, which covers the frequency range from 267 to 378 GHz, was used as a frontend. In the backend we used the XFFTS spectrometer, which consists of two units that provide an instantaneous bandwidth of 2.5 GHz and 32,768 spectral channels each. There is a fixed overlap region of 1.0 GHz between the units, hence the effective bandwidth was 4.0 GHz centered at the rest frequency of the CO (=32) and HCN (=43) transitions.
The observations with the IRAM 30m telescope were carried out in May and June 2014. The frontend was the Eight MIxer Receiver (EMIR), which covers four bands in the frequency range from 80 to 360 GHz. The Fast Fourier Transform Spectrometer (FTS) was used as a backend. The observations were done in the EMIR bands E090 and E230, covering the frequency ranges 84–116 GHz and 228.5–240.5 GHz, respectively, with a spectral resolution of 200 kHz. The setup allowed to simultaneously look for emission lines of e.g. CO, 13CO and HCN. The observations with this telescope included scans toward the four born-again stars, V4334 Sgr, V605 Aql, A30 and A78. However, due to an error in the pointing of the observations on V605 Aql, we had to exclude those data from the present work.
The temperature scale of the data delivered by the observatories was in units of the antenna temperature corrected for the atmospheric attenuation, . In order to compare our observations with other results, the antenna temperature was converted to main-beam brightness temperature, , and to flux density, . The main-beam brightness temperature is obtained as =/, where is the main beam efficiency. The relation between antenna temperature and flux density is expressed as =/, where is the point-source sensitivity of the antenna. The sensitivity can be calculated as [/K Jy-1]=, where is the diameter of the telescope and is the aperture efficiency (Wilson et al. 2013). A summary of the observation parameters is presented in Table 1.
The software CLASS of GILDAS333See http://www.iram.fr/IRAMFR/GILDAS for more information about the GILDAS softwares. was used to average the spectral scans, remove baselines and smooth the spectral resolution. All the spectra were re-sampled to a spectral resolution of 20 km s-1.
3 Results
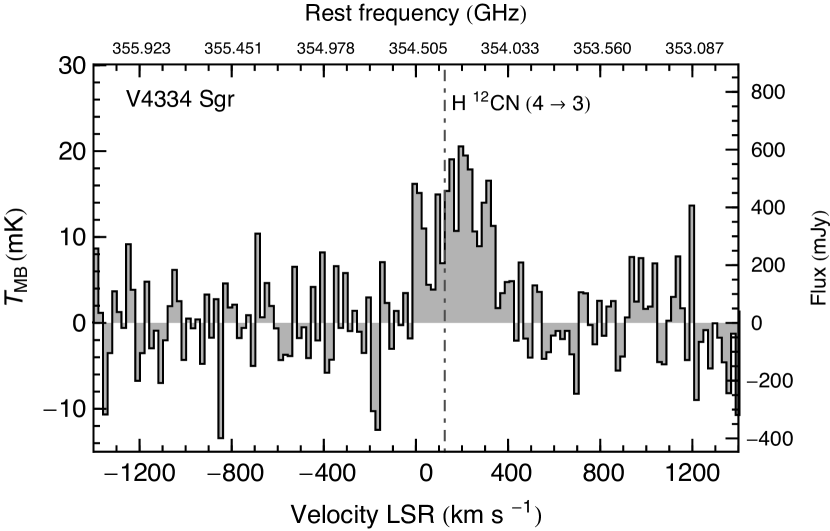
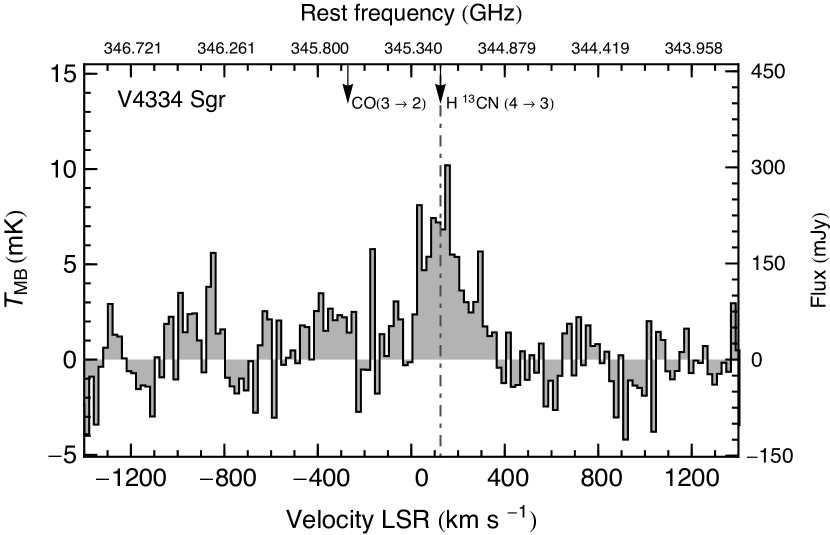
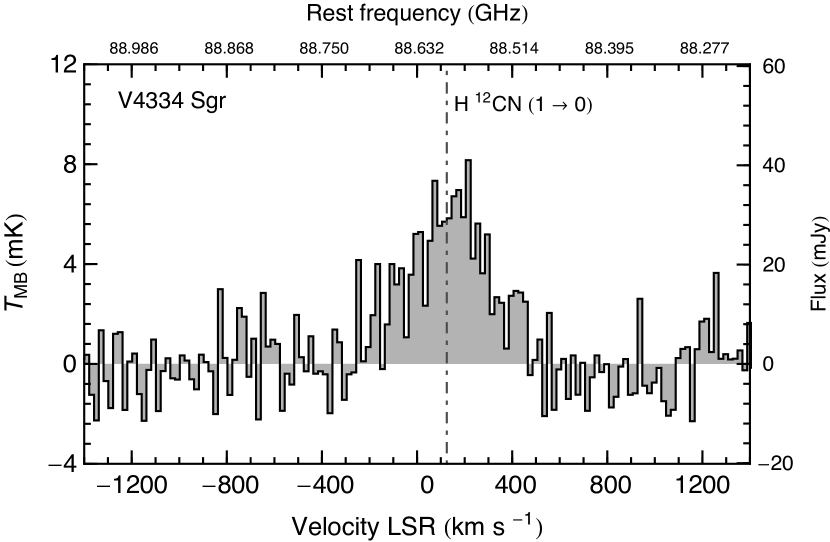
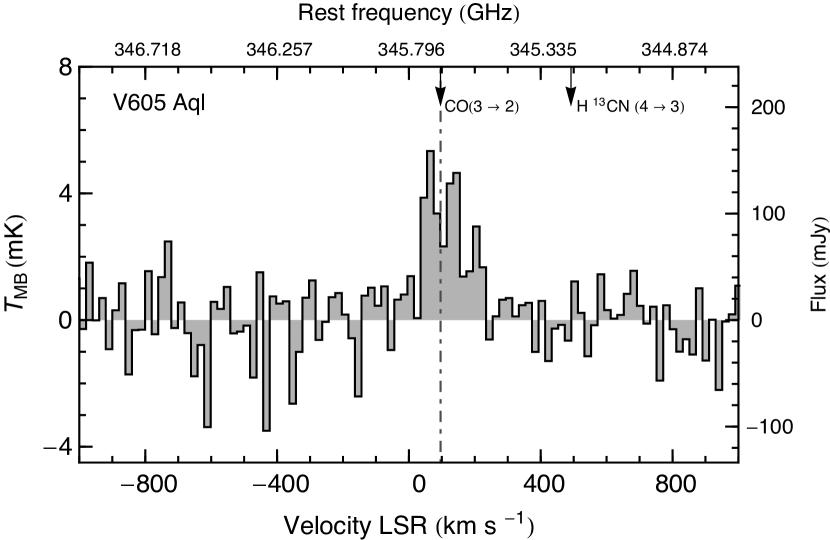
From our observations we detected, for the first time, molecular line emission toward two of the targeted born-again stars. Emission from the molecule HCN and its isotopologue H13CN was found in V4334 Sgr. On the other hand, CO (=32) emission was detected toward V605 Aql. Although the lines are relatively weak, our deep observations revealed emission of these molecules over a broad range of velocities with a signal-to-noise ratio 3 for the line peaks (see Figs. 1, 2 and 3). We fitted Gaussian profiles to the detected lines to obtain their relevant parameters. The best fit values for the peak-temperature, , central velocity, vLSR, and linewidths, v, are listed in Table 2. Table 3 shows the channel-to-channel rms noise level of the spectra where no molecular emission was detected. In the following we describe the results of the observations for each source.
| Molecule | Transition | Rest frequency | rmsl𝑙ll𝑙lChannel-to-channel 1- rms noise of the spectrum smoothed to a velocity resolution of 20 km s-1. |
| (GHz) | (mJy) | ||
| V4334 Sgr | |||
| CO | =32 | 345.79599 | 57 |
| CO | =21 | 230.53800 | 68 |
| CO | =10 | 115.27120 | 13 |
| 13CO | =10 | 110.20135 | 6 |
| V605 Aql | |||
| H13CN | =43 | 345.33976 | 29 |
| 13CO | =32 | 330.58797 | 86 |
| A30 | |||
| CO | =21 | 230.53800 | 24 |
| CO | =10 | 115.27120 | 16 |
| 13CO | =10 | 110.20135 | 9 |
| HCN | =10 | 88.63185 | 7 |
| A78 | |||
| CO | =10 | 115.27120 | 10 |
| 13CO | =10 | 110.20135 | 6 |
| HCN | =10 | 88.63185 | 6 |
3.1 V4334 Sgr (Sakurai’s object)
Among the initial goals of the APEX observations was the detection of CO (=32) emission toward V4334 Sgr, but it was not detected above a rms noise level of 57 mJy (Table 3). However, from these observations we serendipitously detected emission from the transition =43 of the isotopologue H13CN instead, which lies at a frequency 0.46 GHz away from the one of the CO (=32) line (see lower panel of Fig. 1 and Table 2). Since the H13CN (=43) line was detected, we carried out additional observations with APEX to search for HCN (=43) emission with the aim of comparing their relative intensities. The HCN (=43) emission was successfully detected with a peak-temperature 2.3 times higher than the one of its isotopologue H13CN (upper panel of Fig. 1).
From the IRAM 30m telescope observations we also obtained a clear detection of HCN (=10) emission at a frequency 88.6 GHz (Fig. 2). We did not detect CO nor 13CO emission above the rms noise level from these observations (see Table 3).
In general, the central velocities of the HCN and H13CN lines, obtained from the Gaussian fits, are in agreement with the systemic velocity of the source estimated from other observations, vsys125 km s-1 (Duerbeck et al. 1997), indicating that the emission is indeed associated with the source. It is worth noting that the central velocity of the HCN (=43) line differs from the systemic velocity of the source by 56 km s-1, which corresponds to a departure of 3.5 from the nominal value, given the standard deviation obtained from the Gaussian fit. However, since the other lines are consistent with the systemic velocity, it is likely that this discrepancy is due to limitations of the fit as a consequence of the lower signal-to-noise ratio of this line.
The widths of the lines show that the emitting material is expanding at a relatively large velocity (vexp=v/2100 km s-1). Similar expansion velocities have been derived from the emission of optical lines seen in this source (e.g. Worters et al. 2009; Hinkle & Joyce 2014). We notice that the widths of the HCN (=43) and H13CN (=43) lines seem to be narrower than the linewidth of the HCN (=10) emission (see Figs. 1 and 2 and Table 2). This could be indicating that the region from where the HCN (=10) emission is arising, probably cooler gas (i.e. brighter at lower transitions), is associated with a faster component of the circumstellar envelope. Another possibility is that emission from faint, high-velocity, wings of the =43 transitions is not detected due to the higher rms noise of their spectra.
3.2 V605 Aql
Emission from CO (=32) was detected toward V605 Aql using the APEX telescope (see Fig. 3 and Table 2). The emission is centered at the velocity vLSR=9611 km s-1. The value is in excellent agreement with the systemic velocity derived by Clayton et al. (2013), vsys,LSR=96 km s-1, from modeling the broad emission of optical lines of [Oiii] and [Nii], attributed to the compact hydrogen-deficient nebula (Pollacco et al. 1992).
The expansion velocity of the molecular gas, as suggested by the width of the CO line of our observations, is vexp80 km s-1. This is considerably lower than the value of vexp215 km s-1 derived from the spectral modeling of the [Oiii] and [Nii] lines performed by Clayton et al. (2013). This indicates that the neutral (denser) gas, traced by the CO emission, expands at lower velocities than the ionized (less dense) material, as it is actually found in numerical simulations of the formation of a born-again PN (Fang et al. 2014).
3.3 A30 and A78
These sources were observed only using the IRAM 30m telescope. We did not detect any line emission in the frequency bands of our observations. The channel-to-channel rms noise level of the spectra of these sources in the frequency ranges corresponding to rotational transitions of the molecules CO, 13CO and HCN is shown in Table 3.
4 Discussion
4.1 Molecular emission as a probe of the CSE of born-again stars
To date most of the studies on the morphology, kinematics and chemical composition of CSEs of born-again-stars are based on observations at optical and infrared wavelengths (e.g. Hinkle & Joyce 2014, and references therein). The observations have revealed that shortly after the star commences its journey back to the AGB track its chemical composition exhibits dramatic changes (e.g. Eyres et al. 1998). This is followed by the condensation of molecular material and dust into a thick circumstellar shell that enshrouds the star, which renders it invisible at optical wavelengths. Studies of absorption features in the near and mid-infrared have revealed the presence of molecules such as CO, C2, CN, HCN, among others in the CSE of the two youngest born-again stars (Clayton & De Marco 1997; Eyres et al. 1998; Pavlenko et al. 2004; Evans et al. 2006). Infrared emission from dust in globules has also been observed toward A30 and A78 (Borkowski et al. 1994; Kimeswenger et al. 1998; Phillips & Ramos-Larios 2007), but no molecular emission has been reported for these sources.
The emission of the CO molecule has proven to be an invaluable tool to study the morphology and kinematics, as well as the physical conditions, of the cool gas around a wide variety of evolved stars, from AGB stars to PNe. Previous searches of CO emission in born-again stars at millimeter and sub-millimeter wavelengths yielded inconclusive results and/or non-detections. Kameswara-Rao et al. (1991) reported a tentative 2.6- detection of CO (=10) emission using the Swedish-ESO Submillimetre Telescope (SEST) toward V605 Aql. The signal showed a peak main-beam temperature of =0.024 K (0.65 Jy) at the position of the LSR velocity of 138.5 km s-1. These authors concluded that this emission must be originating in the old PN based on the argument that the velocity of the hydrogen deficient nebula differs by 60 km s-1 from the LSR of the detected signal. However, given the relatively large expansion velocity of the molecular gas ejected during the born-again event, vexp80 km s-1, as obtained from our observations, CO (=10) emission from the hydrogen deficient nebula cannot be ruled out at such LSR velocity. Unfortunately, the spectrum of these observations was not published and it is not available in the SEST data archive anymore, preventing us from confirming their results. In addition, Nyman et al. (1992) used the SEST and the Onsala 20m Telescope to carry out a survey of CO emission toward a sample of IRAS point sources, including V605 Aql. However, their observations toward V605 Aql reached an rms limit of 1 Jy, which is higher than the peak main-beam temperature reported by Kameswara-Rao et al. (1991), and did not detect any emission.
On the other hand, soon after V4334 Sgr experienced the VLTP, and just before it disappeared from our view at optical wavelengths, Evans et al. (1998) carried out observations with the James Clerk Maxwell Telescope to search for the CO (=21) line toward this object, but no emission was detected above an rms level of 0.65 Jy. To our knowledge, this is the only attempt to search for millimeter/submillimeter CO emission toward V4334 Sgr published in the literature.
Our observations reveal that the molecular emission in the two youngest born-again stars is relatively weak, which explains why previous attempts to detect such emission had failed. On the other hand, the non-detection of molecular emission toward the more evolved objects A30 and A78 is in agreement with the picture of an evolutionary sequence where the molecules are dissociated as the envelope is photo-ionized by the hot central star. One particularly interesting result from our observations is the clear detection of HCN emission in V4334 Sgr, while the CO (=32) line does not appear in its spectrum (lower panel of Fig. 1). Conversely, CO (=32) emission is found in V605 Aql, but no H13CN (=43) emission is detected in this source (Fig. 3). It is not clear what could be the origin of this difference, leading one to wonder whether this could be due to an evolutionary effect in the chemical composition of CSE of these sources, or due to differences between their intrinsic chemical compositions. Particularly, the relatively high content of hydrogen-bearing gas in the recently created CSE of V4334 Sgr indicates that a considerable fraction of hydrogen was blown out instead of being ingested during the VLTP (see Sect. 4.3). Asplund et al. (1997) show that the surface hydrogen abundance of V4334 Sgr decreased during 1996 and thus the molecules may have formed in the earlier ejecta which still had some hydrogen.
The 12C/13C abundance ratio in the newly formed CSE of V4334 Sgr has been estimated independently by some authors
(Pavlenko et al. 2004; Evans et al. 2006; Worters et al. 2009). In general they find a low value of 25, which hints the occurrence
of a VLTP in this source. From our observations we find that the ratio of the integrated line intensities,
, is 3 (see Table 2). Under the assumption that both lines arise in the same region
and that they are optically thin, this ratio translates into the 12C/13C abundance ratio, which would be in agreement with the values
previously found by other authors. Following a similar argument for V605 Aql, using the upper limit for the 13CO emission (Table 3),
we obtain a lower limit for the integrated line intensities /4. Nonetheless, it is important to remark that the data of the HCN
and H13CN emission toward V4334 Sgr were taken more than 2 years apart and, for sources that evolve so rapidly, one has to be cautious
when comparing observations that were performed at different epochs.
4.2 Spatial extent of the molecular emission
The width of the detected molecular lines, in both sources, show that the emitting material is expanding at relatively large velocities, vexp80 km s-1. This clearly indicates that the observed molecular gas is not associated with the fossil planetary nebula, which is expanding at a much lower velocity, vexp20-30 km s-1, but rather with the material ejected during the born-again event. If one assumes that the gas expands at a constant velocity, the angular diameter of the emitting region can be estimated as =v, where is the time interval between the born-again event and the observation date, and is the distance to the source. For V605 Aql, the born-again event occurred 100 years ago and the distance to the source has been estimated to be 4.6 kpc (Clayton et al. 2013). Taking half the value of the linewidth of the CO emission as the expansion velocity, vexp=vCO/2, the angular diameter of the emitting region is . In the case of V4334 Sgr the time interval is 20 years; assuming a distance of 3 kpc (Kimeswenger 2002), and calculating the expansion velocity from the average of the linewidths of the HCN emission, vexp=/2, the corresponding angular diameter is .
From Hubble Space Telescope (HST) images of the [Oiii] and [Nii] emission, Wesson et al. (2008) measured the diameter of the hydrogen deficient nebula in V605 Aql to be . In the case of V4334 Sgr, Hinkle & Joyce (2014) estimate that the spatial extent of the material traced by emission of He I at 1.083 m might be up to . However, according to the linear relationship for the expansion of the dust shell found by Evans et al. (2006) and Hinkle & Joyce (2014), the size of the dust shell should be only in diameter. From our single dish observations we cannot tell the true distribution of the molecular emission, but it can be assumed that the molecular emission comes from a region of similar extent as the structures seen at other wavelengths. Interferometric observations with high angular-resolution are necessary to confirm this hypothesis.
4.3 Column density and rotational temperature of HCN in V4334 Sgr
Given that we detected emission of the HCN molecule at two different transitions in V4334 Sgr, we can attempt to estimate the rotational temperature and the column density of this molecule in the following way. Assuming LTE conditions, the rotational temperature, , and total column density, , can be obtained by fitting a linear function in the population diagram (also referred to as rotation diagram) to the observational data using the following equation (Goldsmith & Langer 1999):
| (1) |
where is the column density of molecules in the upper state; and are the statistical weight and energy of the upper level of the transition, respectively; is the partition function of the molecule and is the Boltzmann constant.
The observed column density of molecules in the upper state, , is obtained as
| (2) |
where is the rest frequency of the transition, is the Planck constant, is the speed of light in vacuum, is the Einstein A-coefficient for spontaneous emission, is the velocity-integrated intensity of the line, which is calculated as the product v; is the beam filling factor and is the optical depth at the peak of the line. The latter two parameters are the main source of uncertainty in determining .
In principle, the beam filling factor, defined as the fraction of the area of the beam of the telescope filled by the source, can be estimated directly from the angular size of the emitting region, which in the previous subsection was estimated to be in diameter, and assuming a uniform distribution of the gas. However, a clumpy structure of the emitting region would result in a smaller value of the beam filling factor. Furthermore, since the optical depths of the lines are not well constrained, we start by assuming that the distribution of the gas is uniform and that the emission of both transitions is optically thin, i.e. 1. Later we explore how the results change when these assumptions do not hold.
To calculate and for the two observed lines of the HCN molecule and to perform the linear fit using using Equation 1, we used the values of the Einstein A-coefficients, statistical weights and partition functions from the Cologne Database for Molecular Spectroscopy (Müller et al. 2001, 2005). The fit gives a rotational temperature of =13 K, and a total column density of =1.61016 cm-2. Moreover, assuming a distance of 3 kpc and an angular diameter of for this source, we derive a total HCN mass =1.410-7 . Evans et al. (2006) analyzed absorption lines of HCN in the infrared and derived values of the temperature and total column density =450 K and =1.41017 cm-2, respectively. The difference between their values and the ones derived from our observations is likely due to the fact that the gas probed by the infrared observations lies only in the direction between the infrared background and the observer, which is closer to the denser and hotter dust envelope, while we are obtaining an averaged value over the whole emitting region, which includes cooler and less dense gas.
However, it must be pointed out that the values obtained from the analysis above should be considered as a first approximation since they are fairly sensitive to the assumptions on the beam filling factor and optical depth of the lines as follows. From Equation 1 it can be seen that the rotational temperature is inversely proportional to the absolute value of the slope of the line that best fits the data. Accordingly, the total column density, , is proportional to the value where it crosses the ordinate axis. On the other hand, from Equation 2 it follows that is inversely proportional to the beam filling factor and linearly proportional to . Therefore, different beam filling factors and/or optical depths for each transition will cause the values of to move upwards and/or downwards in the population diagram, which will affect both the slope and the ordinate-crossing point of the best-fitting line. Indeed, as mentioned above, the beam filling factor could be overestimated if the emitting region has a rather clumpy distribution. In addition, if the transition of higher energy, HCN (=43), is preferentially excited closer to the star the emitting region of this line would be smaller, resulting in a different value of the beam filling factor for each line. Furthermore, our assumption of optically thin emission leads to an underestimation of the total column density, although the agreement between the and the 12C/13C ratios suggests that the lines are indeed optically thin. Hence, it is clear that more observations of several transitions at higher angular resolution are necessary to disentangle the physical properties and distribution of the molecular gas in this source.
5 Conclusions
Using the APEX and IRAM 30m telescopes, we carried out a search for molecular emission toward four sources that are known to have experienced a VLTP and detected emission from V4334 Sgr and V605 Aql. This is the first time that millimeter/sub-millimeter molecular emission is detected in born-again stars. While the HCN and H13CN emission is strong in V4334 Sgr, it does not appear in the spectrum of V605 Aql with the same rms noise level. Conversely, CO emission was detected in V605 Aql but not in V4334 Sgr. This result might be pointing to differences in the chemical composition of these sources, or to a chemical evolution of their circumstellar envelope. On the other hand, the non-detection of molecular emission in the other two, more evolved, born-again stars (A30 and A78) is in agreement with an evolutionary scenario where the molecules are destroyed as the central star re-heats and ionizes the CSE. For V4334 Sgr, under the assumptions of LTE and optically thin emission, we derived a rotational temperature for the molecular gas of =13 K, and a total column density of =1.61016 cm-2. Considering a distance of 3 kpc and a size of , the total HCN mass in V4334 Sgr is =1.410-7 . The ratio of the integrated line intensities, , is 3 in V4334 Sgr. Assuming that both lines are optically thin, this value represents the 12C/13C abundance ratio, which would be in agreement with previous estimations from infrared observations. Under similar assumptions for V605 Aql, we find a lower limit of /¿4. Future observations at high angular resolution will reveal the distribution and kinematics of the gas ejected by these born-again stars. This will be an important step toward understanding the formation of asymmetries in the CSE of evolved stars.
Acknowledgements.
The authors thank Karl Torstensson for his valuable help with the observations at the APEX site and to Magnus Persson for helpful discussions. The authors also thank the anonymous referee for constructive comments and suggestions that helped improve the manuscript. The APEX data were obtained via Onsala Space Observatory observing time and are archived with the program identification codes 092.F-9330 and 097.F-9341. DT and WV acknowledge support from ERC consolidator grant 614264. AAZ acknowledges funding from the UK STFC research council. Á. S.-M. thanks the Deutsche Forschungsgemeinschaft (DFG) for funding support via the collaborative research grant SFB 956, project A6. SPTM thanks the Spanish MINECO for funding support from grants AYA2012-32032, CSD2009-00038, FIS2012-32096, and ERC under ERC-2013-SyG, G. A. 610256 NANOCOSMOS.References
- Asplund et al. (1997) Asplund, M., Gustafsson, B., Lambert, D. L., & Kameswara-Rao, N. 1997, A&A, 321, L17
- Balick & Frank (2002) Balick, B. & Frank, A. 2002, ARA&A, 40, 439
- Benetti et al. (1996) Benetti, S., Duerbeck, H. W., Seitter, W. C., Harrison, T., & Hoff, W. 1996, IAU Circ., 6325
- Borkowski et al. (1994) Borkowski, K. J., Harrington, J. P., Blair, W. P., & Bregman, J. D. 1994, ApJ, 435, 722
- Borkowski et al. (1993) Borkowski, K. J., Harrington, J. P., Tsvetanov, Z., & Clegg, R. E. S. 1993, ApJ, 415, L47
- Chesneau et al. (2009) Chesneau, O., Clayton, G. C., Lykou, F., et al. 2009, A&A, 493, L17
- Chu et al. (1997) Chu, Y.-H., Chang, T. H., & Conway, G. M. 1997, ApJ, 482, 891
- Clayton et al. (2013) Clayton, G. C., Bond, H. E., Long, L. A., et al. 2013, ApJ, 771, 130
- Clayton & De Marco (1997) Clayton, G. C. & De Marco, O. 1997, AJ, 114, 2679
- Clayton et al. (2006) Clayton, G. C., Kerber, F., Pirzkal, N., et al. 2006, ApJ, 646, L69
- De Marco (2014) De Marco, O. 2014, in Asymmetrical Planetary Nebulae VI Conference, ed. C. Morisset, G. Delgado-Inglada, & S. Torres-Peimbert, Asymmetrical Planetary Nebulae VI Conference Proceedings, 122
- Duerbeck et al. (1997) Duerbeck, H. W., Benetti, S., Gautschy, A., et al. 1997, AJ, 114, 1657
- Duerbeck et al. (2000) Duerbeck, H. W., Liller, W., Sterken, C., et al. 2000, AJ, 119, 2360
- Duerbeck et al. (1996) Duerbeck, H. W., Pollacco, D., Verbunt, F., et al. 1996, IAU Circ., 6328
- Evans et al. (1998) Evans, A., Eyres, S. P. S., Naylor, T., & Salama, A. 1998, A&A, 335, 292
- Evans et al. (2006) Evans, A., Tyne, V. H., van Loon, J. T., et al. 2006, MNRAS, 373, L75
- Eyres et al. (1998) Eyres, S. P. S., Evans, A., Geballe, T. R., Salama, A., & Smalley, B. 1998, MNRAS, 298, L37
- Fang et al. (2014) Fang, X., Guerrero, M. A., Marquez-Lugo, R. A., et al. 2014, ApJ, 797, 100
- Goldsmith & Langer (1999) Goldsmith, P. F. & Langer, W. D. 1999, ApJ, 517, 209
- Guerrero & Manchado (1996) Guerrero, M. A. & Manchado, A. 1996, ApJ, 472, 711
- Guerrero et al. (2012) Guerrero, M. A., Ruiz, N., Hamann, W.-R., et al. 2012, ApJ, 755, 129
- Hajduk et al. (2005) Hajduk, M., Zijlstra, A. A., Herwig, F., et al. 2005, Science, 308, 231
- Herwig (2002) Herwig, F. 2002, Ap&SS, 279, 103
- Hinkle & Joyce (2014) Hinkle, K. H. & Joyce, R. R. 2014, ApJ, 785, 146
- Hinkle et al. (2008) Hinkle, K. H., Lebzelter, T., Joyce, R. R., et al. 2008, A&A, 479, 817
- Iben (1984) Iben, Jr., I. 1984, ApJ, 277, 333
- Jacoby (1979) Jacoby, G. H. 1979, PASP, 91, 754
- Kameswara-Rao et al. (1991) Kameswara-Rao, N., Nyman, L. A., Nandy, K., & Houziaux, L. 1991, in The Infrared Spectral Region of Stars, ed. C. Jaschek & Y. Andrillat (Cambridge University Press), 361
- Kimeswenger (2002) Kimeswenger, S. 2002, Ap&SS, 279, 79
- Kimeswenger et al. (1998) Kimeswenger, S., Kerber, F., & Weinberger, R. 1998, MNRAS, 296, 614
- Kwok et al. (1978) Kwok, S., Purton, C. R., & Fitzgerald, P. M. 1978, ApJ, 219, L125
- Miller Bertolami et al. (2006) Miller Bertolami, M. M., Althaus, L. G., Serenelli, A. M., & Panei, J. A. 2006, A&A, 449, 313
- Müller et al. (2005) Müller, H. S. P., Schlöder, F., Stutzki, J., & Winnewisser, G. 2005, Journal of Molecular Structure, 742, 215
- Müller et al. (2001) Müller, H. S. P., Thorwirth, S., Roth, D. A., & Winnewisser, G. 2001, A&A, 370, L49
- Nakano et al. (1996) Nakano, S., Sakurai, Y., Hazen, M., et al. 1996, IAU Circ., 6322
- Nyman et al. (1992) Nyman, L.-A., Booth, R. S., Carlstrom, U., et al. 1992, A&AS, 93, 121
- Pavlenko et al. (2004) Pavlenko, Y. V., Geballe, T. R., Evans, A., et al. 2004, A&A, 417, L39
- Phillips & Ramos-Larios (2007) Phillips, J. P. & Ramos-Larios, G. 2007, AJ, 133, 347
- Pollacco et al. (1992) Pollacco, D. L., Lawson, W. A., Clegg, R. E. S., & Hill, P. W. 1992, MNRAS, 257, 33P
- Seitter (1987) Seitter, W. C. 1987, The Messenger, 50, 14
- Toalá et al. (2015) Toalá, J. A., Guerrero, M. A., Todt, H., et al. 2015, ApJ, 799, 67
- van Hoof et al. (2007) van Hoof, P. A. M., Hajduk, M., Zijlstra, A. A., et al. 2007, A&A, 471, L9
- Wesson et al. (2008) Wesson, R., Barlow, M. J., Liu, X.-W., et al. 2008, MNRAS, 383, 1639
- Wilson et al. (2013) Wilson, T. L., Rohlfs, K., & Hüttemeister, S. 2013, Tools of Radio Astronomy, 6th edn., Astronomy and Astrophysics Library (Springer Berlin Heidelberg), 173
- Wolf (1920) Wolf, M. 1920, AN, 211, 119
- Woodward et al. (2015) Woodward, P. R., Herwig, F., & Lin, P.-H. 2015, ApJ, 798, 49
- Worters et al. (2009) Worters, H. L., Rushton, M. T., Eyres, S. P. S., Geballe, T. R., & Evans, A. 2009, MNRAS, 393, 108
- Zijlstra (2002) Zijlstra, A. A. 2002, Ap&SS, 279, 171