Properties of magnetars mimicking -powered light curves
in Type Ic superluminous supernovae
Abstract
Many Type Ic superluminous supernovae have light-curve decline rates after their luminosity peak which are close to the nuclear decay rate of , consistent with the interpretation that they are powered by and possibly pair-instability supernovae. However, their rise times are typically shorter than those expected from pair-instability supernovae, and Type Ic superluminous supernovae are often suggested to be powered by magnetar spin-down. If magnetar spin-down is actually a major mechanism to power Type Ic superluminous supernovae, it should be able to produce decline rates similar to the decay rate rather easily. In this study, we investigate the conditions for magnetars under which their spin-down energy input can behave like the nuclear decay energy input. We find that an initial magnetic field strength within a certain range is sufficient to keep the magnetar energy deposition within a factor of a few of the decay energy for several hundreds of days. Magnetar spin-down needs to be by almost pure dipole radiation with the braking index close to 3 to mimic in a wide parameter range. Not only late-phase -decay-like light curves, but also rise time and peak luminosity of most -powered light curves can be reproduced by magnetars. Bolometric light curves for more than 700 days are required to distinguish the two energy sources solely by them. We expect that more slowly-declining superluminous supernovae with short rise times should be found if they are mainly powered by magnetar spin-down.
Subject headings:
supernovae: general1. Introduction
Supernovae (SNe) were first thought to be the birth place of neutron stars by Baade & Zwicky (1934). Currently, most neutron stars are believed to be born during core collapse of massive stars leading to the core-collapse SNe. If newly-born neutron stars rotate rapidly and have strong magnetic fields (so-called “magnetars”), they can affect subsequent observational properties of exploding stars. This is because the huge rotational energy of neutron stars can be radiated on a short timescale if they are strongly magnetized (e.g., Ostriker & Gunn, 1971). Magnetars are suggested to be engines of several energetic events observed in the Universe, such as gamma-ray bursts (GRBs) and SNe with large explosion energies (e.g., Usov, 1992; Thompson et al., 2004; Maeda et al., 2007; Mazzali et al., 2006, 2014; Komissarov & Barkov, 2007; Burrows et al., 2007; Greiner et al., 2015; Metzger et al., 2015; Moriya et al., 2016).
In particular, magnetar spin-down has been suggested to be a candidate energy source to power superluminous SNe (SLSNe) (e.g., Kasen & Bildsten, 2010; Woosley, 2010; Dessart et al., 2012; Chatzopoulos et al., 2013b; Inserra et al., 2013; Nicholl et al., 2013, 2015b; McCrum et al., 2014; Metzger et al., 2014, 2015; Chen et al., 2015; Mösta et al., 2015; Kasen et al., 2016; Wang et al., 2016; Bersten et al., 2016; Sukhbold & Woosley, 2016). SLSNe are a recently-recognized class of SNe whose peak luminosity is more than times higher than that of canonical SNe (see Gal-Yam 2012 for a review). Among several spectral types of SLSNe, we focus here on Type Ic SLSNe whose optical spectra do not generally show hydrogen features (e.g., Quimby et al. 2011, see also a recent discovery by Yan et al. 2015 and its interpretation by Moriya et al. 2015).
One of the first discovered Type Ic SLSNe, SN 2007bi, is suggested to originate from a pair-instability SN (PISN) powered by a huge amount of which is synthesized when they explode (Gal-Yam et al. 2009, but see also Young et al. 2010; Moriya et al. 2010). This is because its light-curve (LC) decline rate after the LC peak is consistent with the nuclear decay rate of and strong nebular Fe emission lines are also observed, as expected in PISNe (e.g., Kasen et al., 2011; Dessart et al., 2013; Kozyreva et al., 2014; Whalen et al., 2014; Chatzopoulos et al., 2015).
However, subsequent theoretical and observational studies suggest that the short LC rise times and little line blanketing of slowly-declining Type Ic SLSNe like SN 2007bi are inconsistent with -powered PISNe and prefer the magnetar-powered model (e.g., Dessart et al., 2012; Inserra et al., 2013; Nicholl et al., 2013, 2015b, 2016a; McCrum et al., 2014; Chen et al., 2015; Jerkstrand et al., 2016a, b; Mazzali et al., 2016) or other power sources (e.g., Chevalier & Irwin, 2011; Ginzburg & Balberg, 2012; Moriya & Maeda, 2012; Ouyed et al., 2012; Chatzopoulos et al., 2013b; Dexter & Kasen, 2013; Baklanov et al., 2015; Sorokina et al., 2016; Nicholl et al., 2015a; Wang et al., 2016). In addition, there also exist many Type Ic SLSNe with fast LC declines that cannot be explained by the power (e.g., Pastorello et al., 2010; Chomiuk et al., 2011; Inserra et al., 2013; Howell et al., 2013; Nicholl et al., 2015b). The magnetar model can provide a unified explanation for fast-declining and slow-declining Type Ic SLSNe (e.g., Kasen & Bildsten, 2010).
Several environmental studies of SLSNe have been carried out, and low metallicity and high specific star-formation rate are commonly found in SLSN host galaxies (e.g., Neill et al., 2011; Chen et al., 2013, 2015; Lunnan et al., 2014; Thöne et al., 2015; Leloudas et al., 2015; Angus et al., 2016; Perley et al., 2016; Japelj et al., 2016). However, they are still insufficient to distinguish different possible powering mechanisms. Chen et al. (2016) recently find a possible relation between the initial spin obtained by fitting SLSN LCs assuming they are powered by magnetars and their host metallicity. If confirmed, this relation may prefer the magnetar model, but further studies are required.
One interesting feature of slowly-declining Type Ic SLSNe is that their LC decline rates are often consistent with the decay rate for a long time (e.g., Nicholl et al., 2016a; Chen et al., 2015; Papadopoulos et al., 2015; Yan et al., 2015; Lunnan et al., 2016; Vreeswijk et al., 2016). If we just examine the late-phase LCs, the simplest way to explain them is the decay. If magnetars are actually powering most of Type Ic SLSNe including slowly declining ones, it would be relatively easy for them to behave like the decaying for a long time. In this paper, we investigate how well magnetars can behave like in powering SNe. We examine whether magnetars can actually behave like or not, and derive conditions for magnetars to mimic the nuclear decay.
The rest of this paper is organized as follows. At first in Section 2, we investigate conditions under which magnetar spin-down energy can be similar to decay energy during late phases. Then, we also look into early LC properties (rise time and peak luminosity) in Section 3 to see if magnetar-powered SNe can be similar to -powered SNe in both early and late phases. We discuss our results in Section 4 and summarize our conclusions in Section 5.
2. Mimicking conditions at late phases
We first investigate conditions under which magnetars can have a similar energy input to the decay at late phases ( days, where is the time since the explosion). in SN ejecta appears as a result of the decay of synthesized at the explosion. At days, the energy input from the decay is negligible because of its short decay time (8.7 days). Thus, we approximate the energy input from the nuclear decay as
| (1) |
where is the initial mass in units of .
The total rotational energy available in a neutron star to power SN LCs is
| (2) |
where is the momentum of inertia of a neutron star, is its initial angular velocity, and is its initial rotational period scaled with 1 ms. We assume that the rotational energy is lost by dipole radiation during the spin-down timescale of
| (3) |
where km is the neutron star radius, is the speed of light, is the initial neutron star magnetic field strength, and is scaled with G (e.g., Gunn & Ostriker, 1969; Contopoulos et al., 1999; Kasen & Bildsten, 2010). In Eq. (3), we assume that the angle between the magnetic dipole and the rotational axis is . The energy deposited from magnetar spin-down is approximated as
| (4) |
The temporal index is 2 if magnetar spin-down is purely through dipole radiation, i.e., a braking index of 3.
We here investigate conditions under which the energy supply from magnetar spin-down remains within a factor of of the decay energy at late phases, i.e.,
| (5) |
We first consider the case of . In late phases of SNe as we are interested in here, is satisfied (see Section 3 for discussion on early phases). Thus, we can approximate the magnetic spin-down energy as
| (6) |
Using the luminosity inputs at late phases (Eqs. 1 and 6), we obtain the following condition from Eq. (5) in the cgs unit:
| (7) |
Equation (7) indicates that only the initial magnetic field strength needs to be in a certain range for magnetars to mimic the decay when .
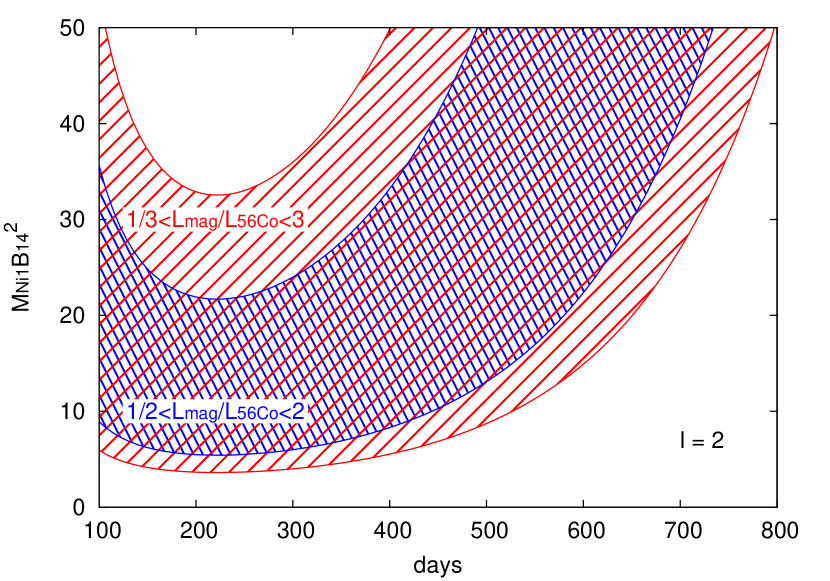
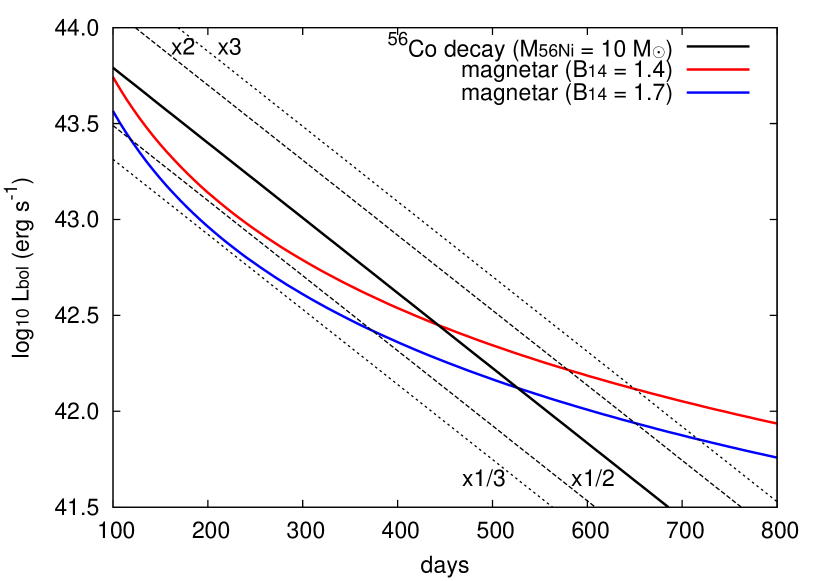
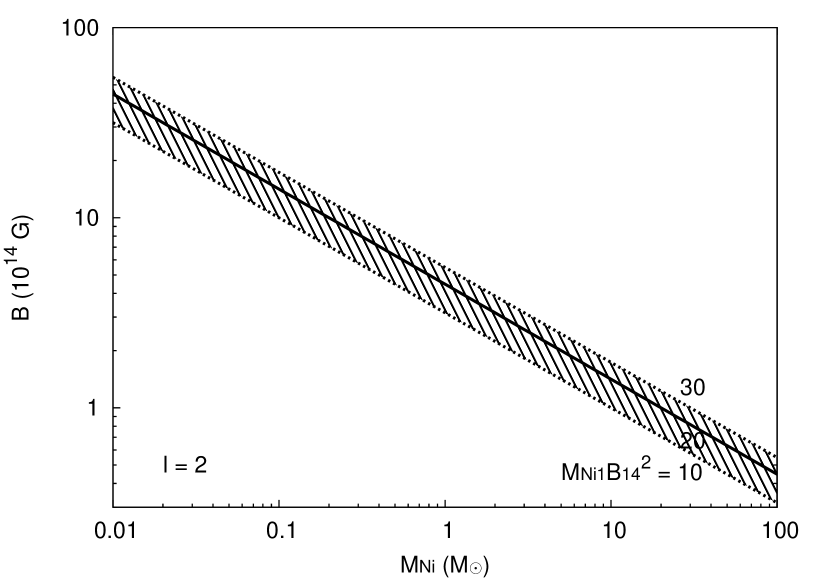
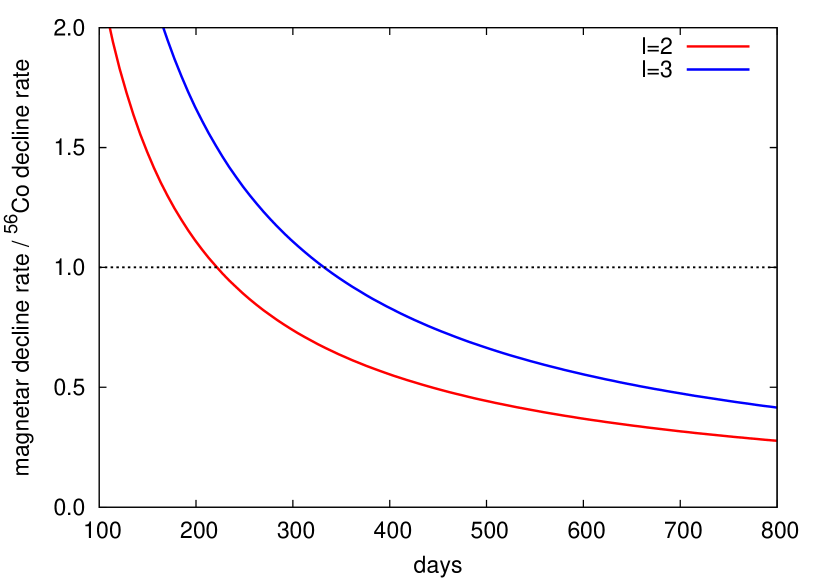
Figure 1 shows the ranges of (Eq. 7) as a function of time for the cases of and 3. A factor of difference in luminosity corresponds to a 0.75-mag difference in magnitudes. This figure shows that magnetar spin-down can mimic an energy deposition by decay within a factor of 2 until about 600 days after the explosion if . Roughly speaking, the energy deposition from the two different energy sources remains within a factor of 3 until about 700 days when . Figure 2 demonstrates this in the case of which is typically found in Type Ic SLSNe. satisfies and the energy released by magnetar spin-down is kept within a factor of 2 of the decay energy until about 600 days as expected. If , Fig. 1 indicates that the magnetar spin-down and the decay energies are kept within a factor of 3 until about 700 days after the explosion as is seen in Fig. 2. The magnetic field strength required to mimic a given amount of is summarized in Figure 3.
One interesting coincidence to note is that we get for magnetars to mimic of which are typically required for the -powered models of Type Ic SLSNe. Because the spin-down timescale needs to be for magnetars to explain Type Ic SLSN LCs, is often found for magnetars powering Type Ic SLSNe (Moriya & Tauris 2016 and references therein). Therefore, the magnetic field strengths required for Type Ic SLSNe happen to match the required magnetic field strengths to mimic the decay from of .
We have only discussed the case of the pure dipole radiation so far. However, there are several observational indications that might be larger than 2. For example, the braking index of the Crab pulsar is observed to be 2.5, indicating (e.g., Lyne et al., 2015). A even smaller braking index around 2 is required to explain the peculiar SN 2005bf which is suggested to be powered by magnetar spin-down (Maeda et al., 2007). There are several suggested mechanisms to make the braking index smaller, which makes larger (e.g., Menou et al., 2001; Wu et al., 2003).
If magnetar spin-down has a braking index of 2 (), the late magnetar energy input is approximated as
| (8) |
and the condition to keep the energy inputs within a factor of becomes
| (9) |
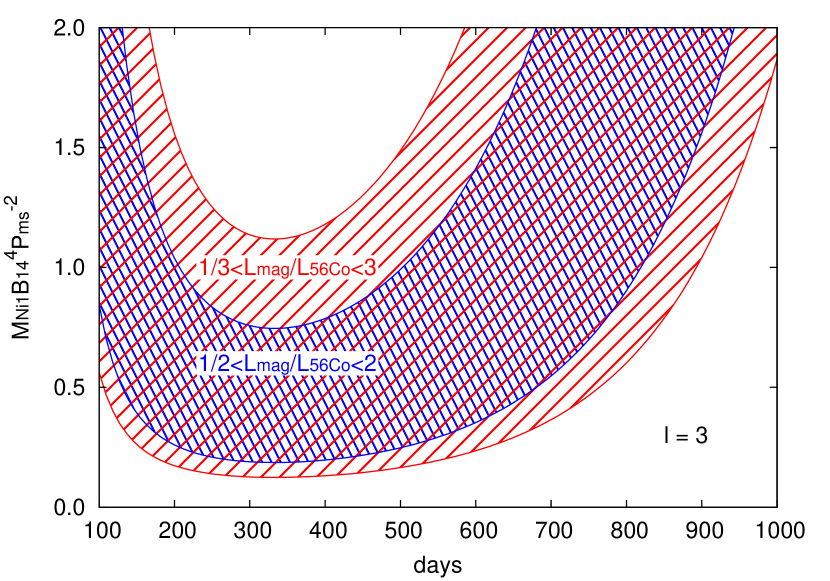
in the cgs unit. Figure 4 shows the parameter regions in which the difference of the two energy sources is kept within a factor of 2 or 3 in the case of . In the case of , only is needed to be within a certain range to obtain a similar energy input to the decay. However, in the case of , both and need to be in a specific limited range satisfying to mimic the decay energy within a factor of 3 for a long time. As becomes larger, the combinations of and required for magnetars to mimic the decay become more limited, and it becomes harder for magnetars to reproduce the decay. Therefore, we only naturally expect the two energy sources to be similar when magnetar spin-down occurs due to almost pure dipole radiation. On the other hand, observed braking indices of pulsars are below 3 and they are often close to 2 or even below (e.g., Espinoza et al. 2011 and references therein). Thus, the fact that the braking indices need to be close to 3 for magnetars to mimic is a strong constraint on the magnetar model for SLSNe. In the rest of this paper, we further investigate the properties of magnetars mimicking assuming . Note that the pure dipole spin-down is usually assumed in the current magnetar spin-down models for SLSNe (e.g., Kasen, 2010; Inserra et al., 2013; Chatzopoulos et al., 2013b; Metzger et al., 2014; Kasen et al., 2016; Wang et al., 2015; Bersten et al., 2016).
Even if the energy provided by magnetar spin-down and decay can be kept similar for a long time, the decline rates of the two energy sources may not remain similar for a long time. In Fig. 5, we show the ratio of the decline rates of the two energy sources in the cases of and . The decay rate is constant , while the decline rates from magnetar spin-down change as a function of time because its energy input follows a power-law. For example, in the case of (Fig. 2), the magnetar energy input is kept within a factor of 2 of the decay until about 600 days after the explosion, while the LC decline rates can differ as much as by about a factor of in (Fig. 5). See also Inserra et al. (2013) for discussion of the decay rates.
3. Early-phase light-curve properties
In the previous section, we find that the energy input from magnetar spin-down can be within a factor of 3 of the energy input from the decay out to days in late phases if the condition is satisfied111 We only consider the case of in the rest of this paper. . However, even if the late phases are consistent with the decay, early LC properties may differ from each other. In this section, we also look into early LC properties, namely, rise time and peak luminosity, to see if magnetar-powered SN LCs can mimic -powered SN LCs even in early phases .
3.1. Rise-time v.s. peak-luminosity relation
3.1.1 Magnetar-powered supernovae
Kasen & Bildsten (2010) formulate an analytical way to estimate the peak luminosity and rise time of SNe powered by magnetar spin-down. We use their prescription to estimate them. They show that the peak luminosity of magnetar-powered SNe for can be estimated as
| (10) |
where is the effective diffusion time determined by SN ejecta properties, i.e., ejecta mass , ejecta opacity , characteristic final ejecta velocity , and ejecta kinetic energy . The rise time for magnetar-powered SNe can be estimated as
| (11) |
3.1.2 -powered supernovae
The peak luminosity of -powered hydrogen-poor SNe () can be estimated by using “Arnett’s law” (Arnett, 1979). For a given rise time , the peak luminosity roughly matches the central energy input at . Therefore, when the central power source is and subsequently decay, the peak luminosity can be estimated as
| (12) | |||||
where is scaled to 1 day.
3.2. Mimicable rise time and peak luminosity
Given the relations between rise time and peak luminosity in magnetar-powered and -powered LCs, we can now investigate the parameter range where SNe from the two power sources can have similar LC properties in the early phases as well as in the late phases.
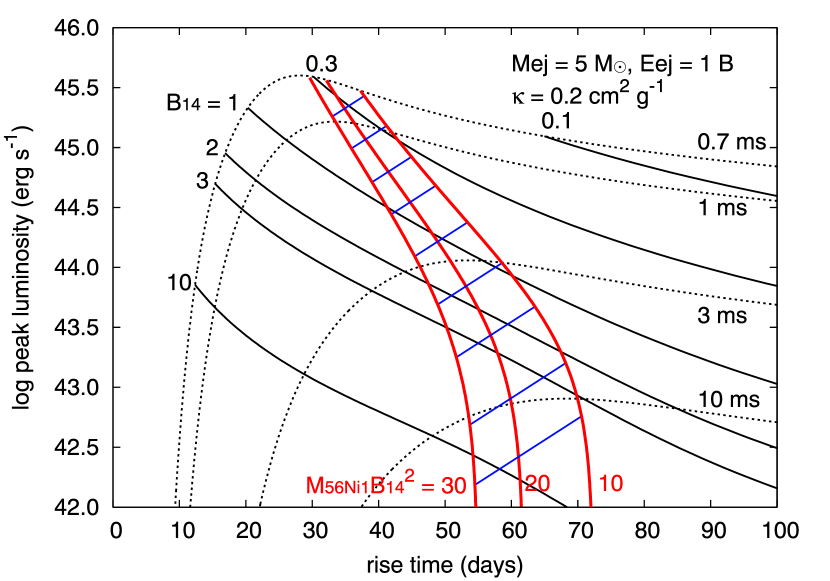
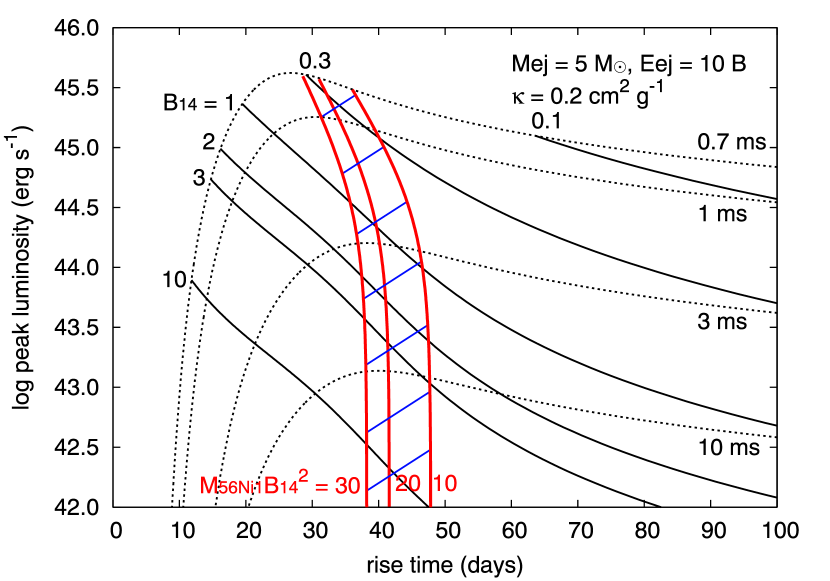
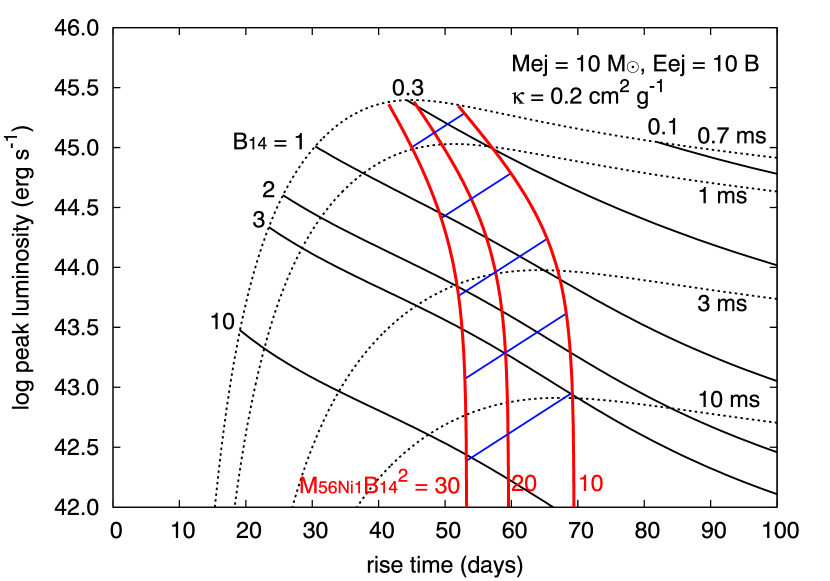
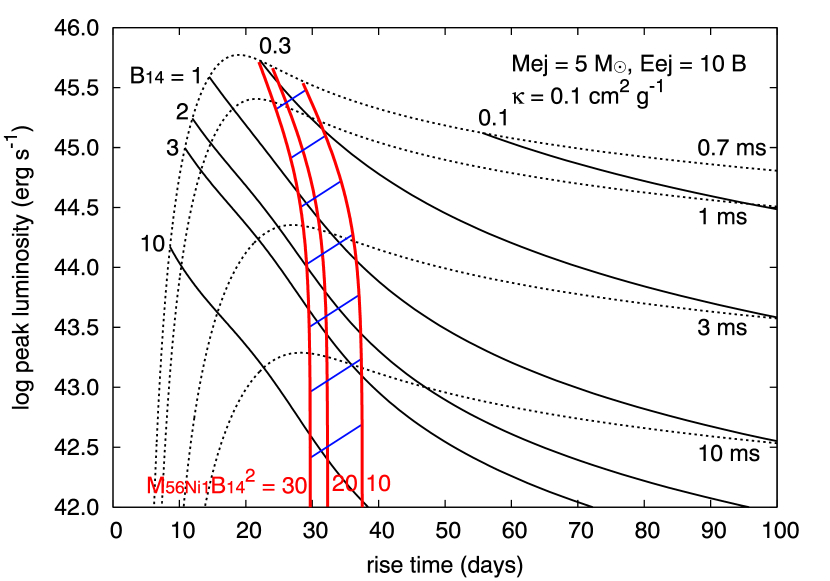
Rise time and peak luminosity of magnetar-powered LCs are determined by the initial magnetic field strength and the initial rotational period when the SN ejecta properties are fixed (Section 3.1.1). In Fig. 6, we show the relations between the rise time and the peak luminosity for the magnetar spin-down model for a given magnetic field strength and rotational period, for several combinations of , , and (see also Kasen & Bildsten, 2010). We note that the LC modeling of Type Ic SLSNe based on the magnetar-powered model indicates and (e.g., Inserra et al., 2013; Nicholl et al., 2014, 2015b). Their spectral modeling shows that the SN ejecta energy needs to be at least 1 B (Dessart et al., 2012), and it is probably close to 10 B with (Howell et al., 2013).
Given a magnetic field strength , the peak luminosity of -powered SNe satisfying is
| (13) | |||||
Equation (13) provides the value required for magnetars of a given to mimic the rise time and peak luminosity of -powered LCs during early phases. In Fig. 6, we plot the lines from Eq. (13) for several . These lines indicate the late-phase properties of magnetar-powered LCs and they are complimentary information to the early-phase properties in the figure which is discussed in, e.g., Kasen & Bildsten (2010); Metzger et al. (2015). Both the early and late LC properties in the region between and 10 can be reproduced by both magnetar-powered and -powered models. Note that the mass required to explain the peak luminosity by -powered models is sometimes higher than the assumed ejecta mass. For example, at the point where the lines of and cross, the mass required to account for the peak luminosity is 5 . The required mass is as much as the SN ejecta mass in some cases. As becomes larger, the required mass becomes smaller (Fig. 3).
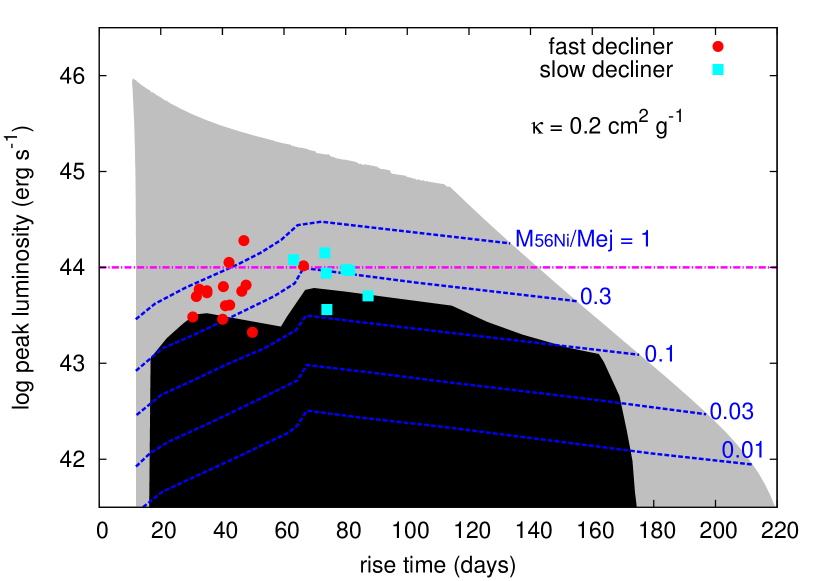
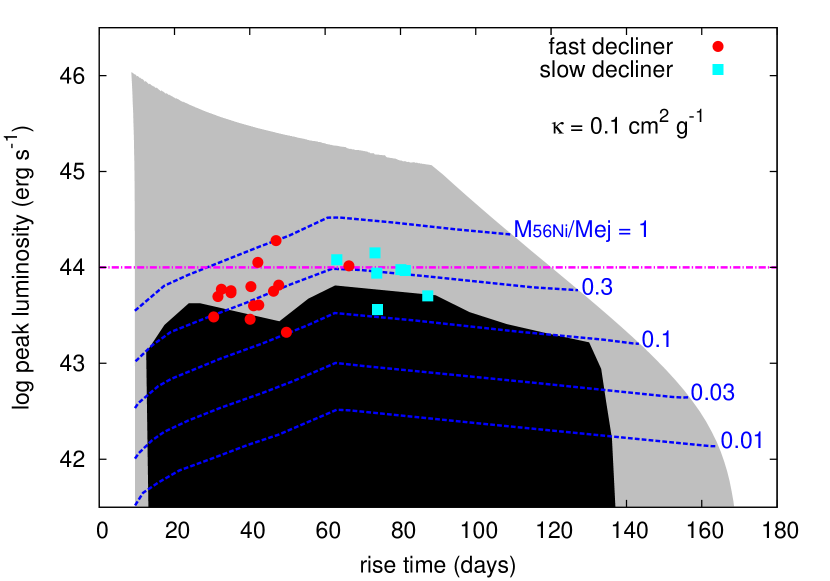
We now vary and within a reasonable range ( and ) and obtain the regions with for all combinations of and in this range. The gray region in Fig. 7 shows where for and . In this region, we can find at least one combination of , , , and for magnetar models to mimic -powered LCs during both early and late phases.
To further constrain realistic parameter ranges where magnetars can mimic , we show the minimum fraction of mass to SN ejecta mass required for the -powered model. The region beyond , is the “forbidden” region for the -powered model. We also show the black region in Fig. 7 where the following two conditions are satisfied: (i) the maximum mass for given and is restricted by those estimated by Umeda & Nomoto (2008), and (ii) the mean SN ejecta velocity () is between and . Umeda & Nomoto (2008) estimate the maximum mass that can be produced by given combinations of progenitor core masses and explosion energies. Assuming that their C+O core masses roughly correspond to in our estimates, they show that the maximum mass for a given explosion energy does not change when and then the maximum mass increases as increases. Therefore, we assume that the maximum mass is that of the 50 model (the C+O core mass of about 20 ) in Fig. 7 of Umeda & Nomoto (2008) when . When , we restrict the maximum mass to those obtained by linearly interpolating the 50 and 80 (the C+O core mass of about 30 ) models in Umeda & Nomoto (2008). Similarly, we interpolate the maximum mass of the 80 and 100 (the C+O core mass of about 40 ) models in Umeda & Nomoto (2008) when . The condition for the mean velocity is from the estimated photospheric velocity range of SLSNe (Nicholl et al., 2015b).
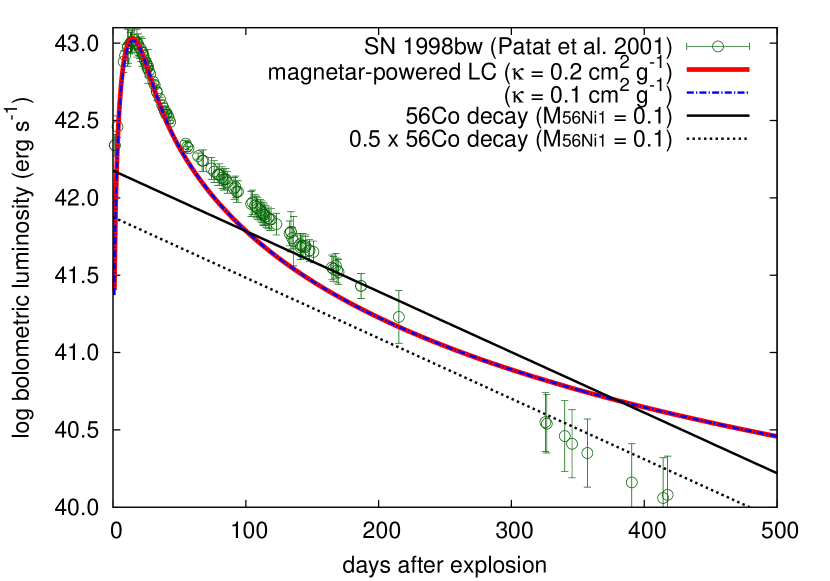
To demonstrate that magnetar-powered LC properties in the mimicable region in Fig. 7 can actually mimic -powered LCs, we present a magnetar-powered LC model for SN 1998bw as an example. SN 1998bw is a broad-line Type Ic SN associated with GRB980425 (e.g., Galama et al., 1998). Because its early-phase spectra are rather red and its late-phase spectra show strong Fe lines, it is likely that SN 1998bw is a -powered SN (e.g., Iwamoto et al., 1998; Mazzali et al., 2001). SN 1998bw is among the most luminous core-collapse SNe that are commonly thought to be powered by . The rise time of SN 1998bw is 15 days and the peak luminosity is (e.g., Clocchiatti et al., 2011; Patat et al., 2001), and thus it is in the mimicable region in Fig. 7. The late-phase LC of SN 1998bw is suggested to be powered by 0.1 of , although the LC declines faster than that of the decay, probably because of explosion asphericity (Maeda et al., 2003). Here, we look for a magnetar-powered LC model that has the -powered LC of SN 1998bw, assuming . Taking as the mimicking condition (Fig. 1), we obtain .
Figure 8 shows magnetar-powered LC models for SN 1998bw with . The magnetar-powered LCs are calculated in a semi-analytic way based on Arnett (1982) assuming full energy trapping from the magnetar spin-down. This method is the same as in previous studies of magnetar-powered SN LCs (e.g., Inserra et al., 2013; Chatzopoulos et al., 2013b). Our magnetar-powered LCs succeed in mimicking the -powered LC with the given magnetic field strength in both early and late phases. Our magnetar-powered LC models have , , and in both and models. The ejecta masses are () and (). The magnetar-powered LCs reproduce the early-phase LC as well as the late-phase energy deposition from the decay that powers the late-phase LC of SN 1998bw within a factor of 2 for more than 500 days. We note that Inserra et al. (2013) also show a magnetar-powered model for SN 1998bw. They independently found a model with , which is close to our and satisfies the mimicking condition.
Although the magnetar model can fit the LC of SN 1998bw, the required ejecta mass for the magnetar model ( with ) is smaller than those estimated by the LC and spectra ( with , e.g., Iwamoto et al. 1998; Nakamura et al. 2001; Mazzali et al. 2001). For this larger ejecta mass the magnetar model lies outside the parameter space where it can mimic the decay. This implies that SN 1998bw is not in the mimicable range for magnetars with the estimated ejecta mass and energy. Thus, we can decline the magnetar model for SN 1998bw based on the independent estimate for the explosion energy and the ejecta mass.
4. Discussion
4.1. Type Ic SLSNe
Nicholl et al. (2015b) summarize the rise time and the quasi-bolometric peak luminosity of well-observed SLSNe. They estimate the time required for SLSNe to reach the peak luminosity () from . In Fig. 7, we set the rise time as the time required to evolve from to assuming an exponential luminosity increase. We also note that uncertain bolometric corrections are applied for some SLSNe to estimate the peak luminosity. We further divide SLSNe based on their decline rates. Nicholl et al. (2015b) estimate the characteristic fading time of SLSNe, i.e., the time required to be from . Their SLSNe can be separated into two groups at . We call SLSNe with fast decliners and those with slow decliners. For example, the PISN candidate SN 2007bi which shows a LC decline consistent with the decay soon after the peak (e.g., Gal-Yam et al., 2009) has (Nicholl et al., 2015b). Most slow decliners have a similar slow decline rate to SN 2007bi within observational errors and therefore have the decline rate consistent with the decay.
Looking into the observed SLSNe in Fig. 7, most of them are located in the gray region where magnetars can mimic the decay. Thus, even if we find a LC decline consistent with the decay, we cannot rule out the magnetar model based just on the decline rate. Thus, it may not be suitable to classify slowly-decaying SLSNe as “SLSN-R” based on the interpretation that the slow decay is due to radioactive decay, as suggested by Gal-Yam (2012). Because most SLSNe are outside of the black region, core-collapse SN models are hard to explain most SLSNe with and if we adopt the maximum masses from core-collapse SNe in Umeda & Nomoto (2008). The mass to the ejecta mass ratio typically needs to be more than 0.3 to explain SLSNe by . Relatively less luminous SLSNe near the top end of the black region in Fig. 7 can still be explained by core-collapse SNe (cf. Moriya et al., 2010).
The black region in Fig. 7 is obtained by allowing a large range in and . However, once and are fixed, the mimicable range is limited as is shown in Fig. 6. As we demonstrated in the previous section, the small ejecta mass required for the magnetar-powered model disfavors this scenario for SN 1998bw. Thus, it is important to estimate and independently from the power sources by using spectra to distinguish -powered LCs from magnetar-powered LCs in both early and late phases. Nicholl et al. (2015b) have tried to estimate the ejecta masses, but the current large uncertainty in the mass estimates prevents us from clearly distinguishing the two sources.
As SN LCs tend to be rather symmetric when diffusion in the SN ejecta shapes them, it is not surprising that rapidly-rising SLSNe tend to be fast decliners and slowly-rising SLSNe tend to be slow decliners. However, it is still interesting to note that rapidly rising SLSNe are always fast decliners. This is because we expect slowly-declining LCs from the magnetar model even if the rise time is small. However, all SLSNe with short rise times in the mimicable region are observed as fast decliners (Fig. 7). If many slowly-declining SLSNe are actually from magnetars mimicking the decay, we would also expect to observe rapidly-rising SLSNe with slow declines. Meanwhile, we also find that magnetar-powered rapidly-rising SLSNe with slow declines with larger tend to have smaller . Therefore, the lack of rapidly-rising slowly-declining SLSNe may otherwise indicate that SLSNe powered by magnetars with faster rotations tend to have smaller ejecta mass.
4.2. Magnetar v.s.
Even rise times of days which are relatively long in the SLSN sample in Fig. 7 are too short to correspond to PISNe (Kasen et al. 2011; Dessart et al. 2013; Kozyreva et al. 2014; Chatzopoulos et al. 2015 but see also Kozyreva et al. 2016). On the contrary, many slowly-declining SLSNe have decline rates which are surprisingly similar to that of the decay as discussed in Section 1. We have shown in this study that only the initial magnetic field strength needs to be within a certain range for magnetars to mimic the decay and this can be simply a result of a similar initial magnetic field strength in magnetars powering SLSNe. However, it is important to note that there are several mechanisms by which -powered SLSNe can have short rise times. Strong mixing in PISNe can result in the short rise times (Kozyreva & Blinnikov, 2015), but multi-dimensional PISN simulations do not find strong mixing in PISNe, especially in the hydrogen-poor progenitors we are interested in (Joggerst & Whalen, 2011; Chatzopoulos et al., 2013a; Chen et al., 2014).
We have discussed one way to distinguish the two models in the previous section: constraining and . Another way to distinguish the two scenarios is to follow the LCs for more than days because the magnetar spin-down energy input will eventually becomes much larger than the decay energy input (Figs. 1 and 2, see also Inserra et al. 2013). In addition, although the two power sources can have a similar energy deposition for a long time, the energy decline rates from magnetar spin-down change with time (Fig. 2). For example, the bolometric LC of the frequently observed SN 1987A clearly follows the decay without significant deviations in the decline rate until about 1000 days after the explosion (e.g., Seitenzahl et al., 2014). Magnetars cannot mimic for this long, and SN 1987A is clearly not powered by magnetar spin-down. However, it is difficult to obtain high quality late-phase bolometric LCs for SLSNe which typically appear at high redshifts (e.g., Quimby et al., 2013). In addition, as seen in the LC of SN 1998bw (Fig. 8), even -powered LCs may not exactly follow the decay because of asphericity. Late-phase spectra can also be a way to distinguish them (e.g., Mazzali et al., 2001; Gal-Yam et al., 2009; Dessart et al., 2012; Jerkstrand et al., 2016a, b; Nicholl et al., 2016b). Observations in X-rays and -rays may also distinguish the two energy sources (e.g., Levan et al., 2013; Metzger et al., 2014).
We note that even if there is large energy input from magnetar spin-down, it does not likely result in a sufficiently large production of to make the SNe superluminous in the magnetar spin-down model (Suwa & Tominaga, 2015). Likely, only small amounts of ( or less) are synthesized during the explosion in magnetar-powered SLSNe (cf. Chen et al., 2013).
Finally, it is impossible to explain SLSNe that have a peak luminosity exceeding about by in the parameter range in Fig. 7. The required mass needs to exceed the ejecta mass in this region.
4.3. Effect of opacity
We have compared the intrinsic energy deposition rates of the magnetar spin-down and the decay in this study. However, not all the deposited energy is necessarily absorbed by SN ejecta. In the case of the decay, mainly -rays from the decay are absorbed in SN ejecta to power late-phase LCs. The effective -ray opacity in SN ejecta is estimated to be (Axelrod, 1980; Sutherland & Wheeler, 1984). On the other hand, opacity for high-energy photons created by electron-positron pairs from magnetar spin-down in SN ejecta is poorly investigated (Kotera et al., 2013; Metzger et al., 2014). Chen et al. (2015) found that the magnetar model for the slowly-declining Type Ic SLSN PTF12dam cannot account for its late-phase LC if all of the magnetar spin-down energy is deposited in the SN ejecta. They found that the magnetar model requires to match the late-phase LC (see also Wang et al. 2015). This -ray opacity is similar to the -ray opacity for the decay. If the -ray opacity is similar in the two energy sources, LCs from the two energy sources are expected to be similar once the intrinsic energy inputs from the two sources are similar. Even if the optical depth in the magnetar spin-down model is different from the -decay model, a different that is scaled by the difference in the opacity is still likely to make the two energy sources produce similar LCs over long timescales.
5. Conclusions
We have shown that magnetars have a large parameter range where they can mimic the decay energy input in both early and late phases of SLSNe. Only the initial magnetic field strength of magnetars needs to be within a certain range () for late-phase LCs powered by mangetars to be similar to those powered by decay out to several hundreds of days after the LC peak. Magnetars require to mimic of which is required for SLSNe and this magnetic field strength corresponds to those expected by SLSN LC durations. This condition only holds if magnetar spin-down occurs by almost pure dipole radiation and the braking index is close to 3. As the braking index decreases, the parameter range for magnetars to behave like becomes more limited and magnetars are less likely to be able to mimic the decay. Because magnetars can mimic the decay in late phases rather easily, it may not be appropriate to classify SLSNe as “SLSN-R” assuming that the slow LC decay is from radioactive decay. With a proper combination of and , we can obtain magnetar-powered SN LCs mimicking -powered SN LCs both in the early and late phases (Fig. 6).
The region where magnetars can mimic in Fig. 7 indicates that there can be slowly-declining SLSNe with short rise times. However, all the rapidly rising SLSNe found so far also have rapid declines as shown in Fig. 7. If SLSNe are powered by magnetars, rapidly rising SLSNe with slow declines should be observed.
The range of the parameters where magnetars can mimic is large if there are no constraints on and (Fig. 7), but once the two SN properties are fixed, there is only a limited range in rise time and peak luminosity where magnetar-powered LCs can mimic -powered LCs (Fig. 6). Thus, it is important to obtain the SN ejecta properties independently to distinguish the two energy sources in slowly declining SLSNe. Bolometric LCs which extend to more than about 700 days after the explosion can also distinguish the two sources.
References
- Angus et al. (2016) Angus, C. R., Levan, A. J., Perley, D. A., et al. 2016, MNRAS, 458, 84
- Arnett (1979) Arnett, W. D. 1979, ApJ, 230, L37
- Arnett (1982) —. 1982, ApJ, 253, 785
- Axelrod (1980) Axelrod, T. S. 1980, PhD thesis, California Univ., Santa Cruz.
- Baade & Zwicky (1934) Baade, W., & Zwicky, F. 1934, Contributions from the Mount Wilson Observatory, vol. 3, pp.79-83, 3, 79
- Baklanov et al. (2015) Baklanov, P. V., Sorokina, E. I., & Blinnikov, S. I. 2015, Astronomy Letters, 41, 95
- Bersten et al. (2016) Bersten, M. C., Benvenuto, O. G., Orellana, M., & Nomoto, K. 2016, ApJ, 817, L8
- Burrows et al. (2007) Burrows, A., Dessart, L., Livne, E., Ott, C. D., & Murphy, J. 2007, ApJ, 664, 416
- Chatzopoulos et al. (2015) Chatzopoulos, E., van Rossum, D. R., Craig, W. J., et al. 2015, ApJ, 799, 18
- Chatzopoulos et al. (2013a) Chatzopoulos, E., Wheeler, J. C., & Couch, S. M. 2013a, ApJ, 776, 129
- Chatzopoulos et al. (2013b) Chatzopoulos, E., Wheeler, J. C., Vinko, J., Horvath, Z. L., & Nagy, A. 2013b, ApJ, 773, 76
- Chen et al. (2014) Chen, K.-J., Woosley, S., Heger, A., Almgren, A., & Whalen, D. J. 2014, ApJ, 792, 28
- Chen et al. (2016) Chen, T.-W., Smartt, S. J., Yates, R. M., et al. 2016, ArXiv e-prints, arXiv:1605.04925
- Chen et al. (2013) Chen, T.-W., Smartt, S. J., Bresolin, F., et al. 2013, ApJ, 763, L28
- Chen et al. (2015) Chen, T.-W., Smartt, S. J., Jerkstrand, A., et al. 2015, MNRAS, 452, 1567
- Chevalier & Irwin (2011) Chevalier, R. A., & Irwin, C. M. 2011, ApJ, 729, L6
- Chomiuk et al. (2011) Chomiuk, L., Chornock, R., Soderberg, A. M., et al. 2011, ApJ, 743, 114
- Clocchiatti et al. (2011) Clocchiatti, A., Suntzeff, N. B., Covarrubias, R., & Candia, P. 2011, AJ, 141, 163
- Contopoulos et al. (1999) Contopoulos, I., Kazanas, D., & Fendt, C. 1999, ApJ, 511, 351
- Dessart et al. (2012) Dessart, L., Hillier, D. J., Waldman, R., Livne, E., & Blondin, S. 2012, MNRAS, 426, L76
- Dessart et al. (2013) Dessart, L., Waldman, R., Livne, E., Hillier, D. J., & Blondin, S. 2013, MNRAS, 428, 3227
- Dexter & Kasen (2013) Dexter, J., & Kasen, D. 2013, ApJ, 772, 30
- Espinoza et al. (2011) Espinoza, C. M., Lyne, A. G., Kramer, M., Manchester, R. N., & Kaspi, V. M. 2011, ApJ, 741, L13
- Gal-Yam (2012) Gal-Yam, A. 2012, Science, 337, 927
- Gal-Yam et al. (2009) Gal-Yam, A., Mazzali, P., Ofek, E. O., et al. 2009, Nature, 462, 624
- Galama et al. (1998) Galama, T. J., Vreeswijk, P. M., van Paradijs, J., et al. 1998, Nature, 395, 670
- Ginzburg & Balberg (2012) Ginzburg, S., & Balberg, S. 2012, ApJ, 757, 178
- Greiner et al. (2015) Greiner, J., Mazzali, P. A., Kann, D. A., et al. 2015, Nature, 523, 189
- Gunn & Ostriker (1969) Gunn, J. E., & Ostriker, J. P. 1969, Nature, 221, 454
- Howell et al. (2013) Howell, D. A., Kasen, D., Lidman, C., et al. 2013, ApJ, 779, 98
- Inserra et al. (2013) Inserra, C., Smartt, S. J., Jerkstrand, A., et al. 2013, ApJ, 770, 128
- Iwamoto et al. (1998) Iwamoto, K., Mazzali, P. A., Nomoto, K., et al. 1998, Nature, 395, 672
- Japelj et al. (2016) Japelj, J., Vergani, S. D., Salvaterra, R., Hunt, L. K., & Mannucci, F. 2016, A&A, 593, A115
- Jerkstrand et al. (2016a) Jerkstrand, A., Smartt, S. J., & Heger, A. 2016a, MNRAS, 455, 3207
- Jerkstrand et al. (2016b) Jerkstrand, A., Smartt, S. J., Inserra, C., et al. 2016b, ArXiv e-prints, arXiv:1608.02994
- Joggerst & Whalen (2011) Joggerst, C. C., & Whalen, D. J. 2011, ApJ, 728, 129
- Kasen (2010) Kasen, D. 2010, ApJ, 708, 1025
- Kasen & Bildsten (2010) Kasen, D., & Bildsten, L. 2010, ApJ, 717, 245
- Kasen et al. (2016) Kasen, D., Metzger, B. D., & Bildsten, L. 2016, ApJ, 821, 36
- Kasen et al. (2011) Kasen, D., Woosley, S. E., & Heger, A. 2011, ApJ, 734, 102
- Komissarov & Barkov (2007) Komissarov, S. S., & Barkov, M. V. 2007, MNRAS, 382, 1029
- Kotera et al. (2013) Kotera, K., Phinney, E. S., & Olinto, A. V. 2013, MNRAS, 432, 3228
- Kozyreva & Blinnikov (2015) Kozyreva, A., & Blinnikov, S. 2015, MNRAS, 454, 4357
- Kozyreva et al. (2014) Kozyreva, A., Blinnikov, S., Langer, N., & Yoon, S.-C. 2014, A&A, 565, A70
- Kozyreva et al. (2016) Kozyreva, A., Gilmer, M., Hirschi, R., et al. 2016, MNRAS, arXiv:1610.01086
- Leloudas et al. (2015) Leloudas, G., Schulze, S., Krühler, T., et al. 2015, MNRAS, 449, 917
- Levan et al. (2013) Levan, A. J., Read, A. M., Metzger, B. D., Wheatley, P. J., & Tanvir, N. R. 2013, ApJ, 771, 136
- Lunnan et al. (2014) Lunnan, R., Chornock, R., Berger, E., et al. 2014, ApJ, 787, 138
- Lunnan et al. (2016) —. 2016, ArXiv e-prints, arXiv:1605.05235
- Lyne et al. (2015) Lyne, A. G., Jordan, C. A., Graham-Smith, F., et al. 2015, MNRAS, 446, 857
- Maeda et al. (2003) Maeda, K., Mazzali, P. A., Deng, J., et al. 2003, ApJ, 593, 931
- Maeda et al. (2007) Maeda, K., Tanaka, M., Nomoto, K., et al. 2007, ApJ, 666, 1069
- Mazzali et al. (2014) Mazzali, P. A., McFadyen, A. I., Woosley, S. E., Pian, E., & Tanaka, M. 2014, MNRAS, 443, 67
- Mazzali et al. (2001) Mazzali, P. A., Nomoto, K., Patat, F., & Maeda, K. 2001, ApJ, 559, 1047
- Mazzali et al. (2016) Mazzali, P. A., Sullivan, M., Pian, E., Greiner, J., & Kann, D. A. 2016, MNRAS, 458, 3455
- Mazzali et al. (2006) Mazzali, P. A., Deng, J., Nomoto, K., et al. 2006, Nature, 442, 1018
- McCrum et al. (2014) McCrum, M., Smartt, S. J., Kotak, R., et al. 2014, MNRAS, 437, 656
- Menou et al. (2001) Menou, K., Perna, R., & Hernquist, L. 2001, ApJ, 559, 1032
- Metzger et al. (2015) Metzger, B. D., Margalit, B., Kasen, D., & Quataert, E. 2015, MNRAS, 454, 3311
- Metzger et al. (2014) Metzger, B. D., Vurm, I., Hascoët, R., & Beloborodov, A. M. 2014, MNRAS, 437, 703
- Moriya et al. (2010) Moriya, T., Tominaga, N., Tanaka, M., Maeda, K., & Nomoto, K. 2010, ApJ, 717, L83
- Moriya et al. (2015) Moriya, T. J., Liu, Z.-W., Mackey, J., Chen, T.-W., & Langer, N. 2015, A&A, 584, L5
- Moriya & Maeda (2012) Moriya, T. J., & Maeda, K. 2012, ApJ, 756, L22
- Moriya et al. (2016) Moriya, T. J., Metzger, B. D., & Blinnikov, S. I. 2016, ArXiv e-prints, arXiv:1606.09316
- Moriya & Tauris (2016) Moriya, T. J., & Tauris, T. M. 2016, MNRAS, 460, L55
- Mösta et al. (2015) Mösta, P., Ott, C. D., Radice, D., et al. 2015, Nature, 528, 376
- Nakamura et al. (2001) Nakamura, T., Mazzali, P. A., Nomoto, K., & Iwamoto, K. 2001, ApJ, 550, 991
- Neill et al. (2011) Neill, J. D., Sullivan, M., Gal-Yam, A., et al. 2011, ApJ, 727, 15
- Nicholl et al. (2013) Nicholl, M., Smartt, S. J., Jerkstrand, A., et al. 2013, Nature, 502, 346
- Nicholl et al. (2014) —. 2014, MNRAS, 444, 2096
- Nicholl et al. (2015a) —. 2015a, ApJ, 807, L18
- Nicholl et al. (2015b) —. 2015b, MNRAS, 452, 3869
- Nicholl et al. (2016a) Nicholl, M., Berger, E., Smartt, S. J., et al. 2016a, ApJ, 826, 39
- Nicholl et al. (2016b) Nicholl, M., Berger, E., Margutti, R., et al. 2016b, ApJ, 828, L18
- Ostriker & Gunn (1971) Ostriker, J. P., & Gunn, J. E. 1971, ApJ, 164, L95
- Ouyed et al. (2012) Ouyed, R., Kostka, M., Koning, N., Leahy, D. A., & Steffen, W. 2012, MNRAS, 423, 1652
- Papadopoulos et al. (2015) Papadopoulos, A., D’Andrea, C. B., Sullivan, M., et al. 2015, MNRAS, 449, 1215
- Pastorello et al. (2010) Pastorello, A., Smartt, S. J., Botticella, M. T., et al. 2010, ApJ, 724, L16
- Patat et al. (2001) Patat, F., Cappellaro, E., Danziger, J., et al. 2001, ApJ, 555, 900
- Perley et al. (2016) Perley, D. A., Quimby, R. M., Yan, L., et al. 2016, ApJ, 830, 13
- Quimby et al. (2013) Quimby, R. M., Yuan, F., Akerlof, C., & Wheeler, J. C. 2013, MNRAS, 431, 912
- Quimby et al. (2011) Quimby, R. M., Kulkarni, S. R., Kasliwal, M. M., et al. 2011, Nature, 474, 487
- Seitenzahl et al. (2014) Seitenzahl, I. R., Timmes, F. X., & Magkotsios, G. 2014, ApJ, 792, 10
- Sorokina et al. (2016) Sorokina, E., Blinnikov, S., Nomoto, K., Quimby, R., & Tolstov, A. 2016, ApJ, 829, 17
- Sukhbold & Woosley (2016) Sukhbold, T., & Woosley, S. E. 2016, ApJ, 820, L38
- Sutherland & Wheeler (1984) Sutherland, P. G., & Wheeler, J. C. 1984, ApJ, 280, 282
- Suwa & Tominaga (2015) Suwa, Y., & Tominaga, N. 2015, MNRAS, 451, 282
- Thompson et al. (2004) Thompson, T. A., Chang, P., & Quataert, E. 2004, ApJ, 611, 380
- Thöne et al. (2015) Thöne, C. C., de Ugarte Postigo, A., García-Benito, R., et al. 2015, MNRAS, 451, L65
- Umeda & Nomoto (2008) Umeda, H., & Nomoto, K. 2008, ApJ, 673, 1014
- Usov (1992) Usov, V. V. 1992, Nature, 357, 472
- Vreeswijk et al. (2016) Vreeswijk, P. M., Leloudas, G., Gal-Yam, A., et al. 2016, ArXiv e-prints, arXiv:1609.08145
- Wang et al. (2016) Wang, S. Q., Liu, L. D., Dai, Z. G., Wang, L. J., & Wu, X. F. 2016, ApJ, 828, 87
- Wang et al. (2015) Wang, S. Q., Wang, L. J., Dai, Z. G., & Wu, X. F. 2015, ApJ, 807, 147
- Whalen et al. (2014) Whalen, D. J., Smidt, J., Heger, A., et al. 2014, ApJ, 797, 9
- Woosley (2010) Woosley, S. E. 2010, ApJ, 719, L204
- Wu et al. (2003) Wu, F., Xu, R. X., & Gil, J. 2003, A&A, 409, 641
- Yan et al. (2015) Yan, L., Quimby, R., Ofek, E., et al. 2015, ApJ, 814, 108
- Young et al. (2010) Young, D. R., Smartt, S. J., Valenti, S., et al. 2010, A&A, 512, A70