Opening a nodal gap by fluctuating spin-density-wave in lightly doped La2-xSrxCuO4
Abstract
We investigate whether the spin or charge degrees of freedom are responsible for the nodal gap in underdoped cuprates by performing inelastic neutron scattering and x-ray diffraction measurements on La2-xSrxCuO4, which is on the edge of the antiferromagnetic phase. We found that fluctuating incommensurate spin-density-wave (SDW) with a the bottom part of an hourglass dispersion exists even in this magnetic sample. The strongest component of these fluctuations diminishes at the same temperature where the nodal gap opens. X-ray scattering measurements on the same crystal show no signature of charge-density-wave (CDW). Therefore, we suggest that the nodal gap in the electronic band of this cuprate opens due to fluctuating SDW with no contribution from CDW.
There are several indications by now from angle-resolved photoemission spectroscopy (ARPES) that in underdoped cuprates a gap opens at the Fermi surface in the diagonal (nodal) direction Drachuck ; AHarter ; vishik2012 ; razzoli2013evolution ; peng2013disappearance . In La2-xSrxCuO4 (LSCO) this nodal gap (NG) extends to . At doping around samples develop a charge-density-wave (CDW) below K croft14 . Traces of antiferromagnetism (AFM) in the form of spin-density-waves (SDW) matsuda2002 or spin-glass Niedermayer98 appear at doping up to and temperatures K. It is therefore natural to speculate that one of these symmetry breaking phenomena is responsible for the opening of a nodal gap. In this work, we would like to clarify which one is the most likely. Our strategy is to carefully examine a sample which is known to at least have both AFM and SDW order, and opens a nodal gap at low temperatures. The sample is LSCO with Drachuck .
Previous neutron diffraction measurements on LSCO Drachuck showed a magnetic Bragg peak at the AFM wave vector below K, and two satellites that stand for static SDW order (on top of the AFM one). The satellites appear below K. Like in Matsuda et al. matsuda2002 , there are two domains in the sample. We focus on one of them, in which the AFM peak is observed when scanning near (1,0,0), with no contribution from SDW. In contrast, the SDW peaks are observed when scanning near (0,1,0), with no contribution from the AFM peak. Neutron scattering detects the component of spin fluctuations perpendicular to the momentum transfer q squires2012introduction . Hence, the SDW fluctuations are perpendicular to the AFM order. ARPES measurements on the same sample found that a nodal gap opens below K Drachuck . Even though there is a temperature mismatch between the NG and SDW appearance, the two phenomena might be related. Moreover, CDW in LSCO is expected to be very weak capati2015 , and indeed this sample is out of the CDW dome croft14 ; Hucker14 . Therefore, a priori, CDW is not expected to generate the nodal gap.
Here we add to the available ARPES and neutron diffraction data, inelastic neutron scattering (INS) and x-ray diffraction data on the same piece of LSCO . We show that the fluctuating SDW amplitude of the frequency where it is the strongest, decreases at a temperature equal to within experimental error. In addition, we could not find any indications for CDW in our sample. We argue that these findings explain the previously measured K discrepancy between the SDW freezing and the opening of a NG, and tie the latter to fluctuating SDW.
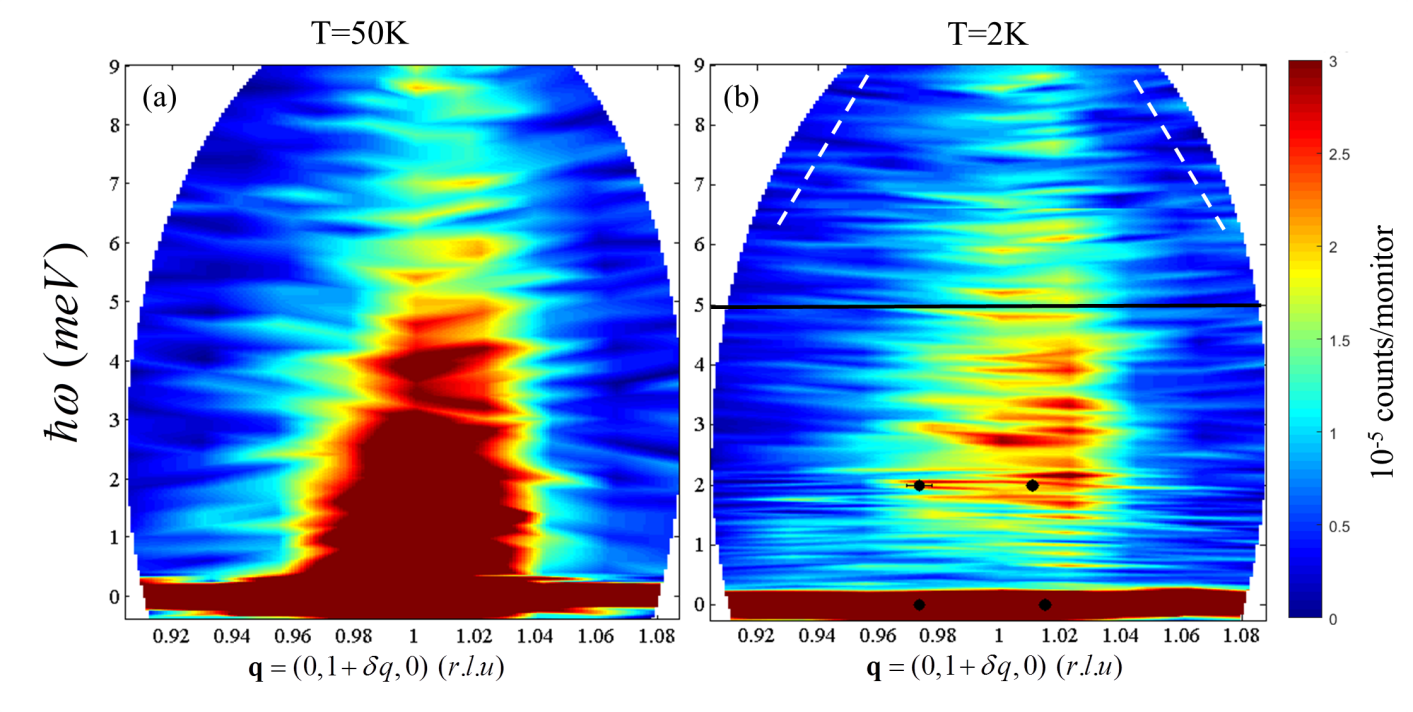
The neutron experiment was performed at Rita-II, the cold neutrons triple axis spectrometer at the Paul Scherrer Institut. Throughout this paper, we work in orthorhombic notation, with cell parameters Å, Å and Å at K. In this notation, the tetragonal 2D is equivalent to in reciprocal lattice units (r.l.u) of . More information is available in the Methods section. In Fig. 1 we present a false color map of neutron counts versus energy transfer and momentum transfer q. The raw data, in this figure alone, is interpolated for presentation purpose. Data is presented at two temperatures, K and K, which are below and above the freezing temperature of the incommensurate magnetic order of K Drachuck . In both cases, strong intensity is observed at . This is due to high order contamination of the incoming beam scattering from a nuclear Bragg peak at , despite the use of Br filter. Around , the intensity extends to energy transfers as high as 8 meV for both temperatures, in a cone shape, which is in fact a poorly-resolved bottom part of an hourglass. This will be demonstrated subsequently. The scattering intensity is stronger at elevated temperatures. Interestingly, at K spectral weight is missing at low energies, suggesting the presence of a soft gap for spin excitations. A similar spectrum, including the gap, was observed at the fully developed hourglass dispersion of La1.875Ba0.125CuO4 tranquada2004 , La1.88Sr0.12CuO4 matsuda2008 ; Romer13 , and La1.6Sr0.4CoO4 drees2013hour .
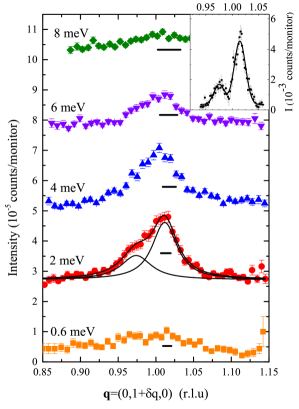
q-scans at specific constant energies at K are presented in Fig. 2, showing the evolution of the SDW peaks with energy transfer. The intensities are shifted vertically for clarity. At meV, some intensity is detected around above the background. However, this could stem from the tail of the high order contamination. At meV two clear peaks appear
For fitting, the instrument was modeled using Popovici ResCal5 Popovici (1975), and the resolution was calculated. Black horizontal lines in Fig. 2 represent the q-resolution at each energy. This was taken into account as a constant width Gaussian at each energy, which was convoluted with a Lorentzian (Voigt function). The fit with two Voigt functions is demonstrated in Fig. 2 by solid lines. The fit to the meV data indicates a peak separation of 0.04 r.l.u. The same separation is found in the elastic peaks Drachuck , as demonstrated in the inset. The peaks centers are illustrated in Fig. 1(b) by the solid points. The static and dynamic SDW correlation lengths, determined from the peaks width, are and respectively. With increasing energy to meV and then to meV, the two peaks are no longer resolved. However, the measured peak is asymmetric because of the two underlying incommensurate peaks coming closer together. At meV the intensity diminishes. This behavior reminds two “legs” dispersing downwards from some crossing energy as in the hourglass.
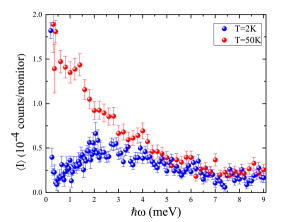
To further investigate the inelastic behavior, we sum the intensity over q at constant energy cuts. The horizontal line in Fig. 1(b) presents one such cut. Background contribution is estimated from the data along the dashed diagonal lines in Fig. 1(b), and subtracted. Fig. 3 presents the background subtracted q-integrated intensity versus energy transfer , starting from meV to avoid the high intensity elastic peak. At K, monotonically grows as the frequency decreases. In contrast, at K, reaches a maximum at some between 2 and 3 meV, and drops towards , although residual elastic scattering intensity is observed near . Measurements on La2-xBaxCuO4 with which were limited to energies below 1meV agree with our results Wagman et al. (2013). This plot demonstrates more clearly the aforementioned soft gap in spin excitations which develops at low temperatures.
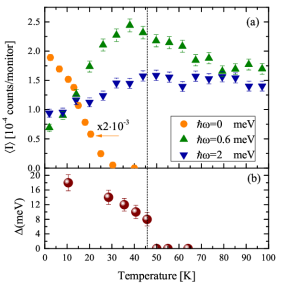
We summarize the available data on LSCO in Fig. 4(a). In this figure we show the temperature dependence of the q-integrated scattering intensity at three different energies. The data at is taken from Ref. Drachuck and multiplied by for clarity. It shows that a long range static SDW appears at a temperature of K. The intensity at meV increases as the temperature is lowered, peaks at K, and then decreases. This result demonstrates that dynamically fluctuating SDW at diminishes upon cooling before long range static incommensurate order develops. The same effect, although less sharp, is observed for meV at K.
Figure 4(b) depicts the temperature dependence of the nodal gap from Ref. Drachuck as measured by ARPES. This gap opens at K, which is the same temperature where the spectral density at begins to diminish. The maximum electronic gap value agrees with isolated dopant-hole bound state calculations sushkov2005 . We note that and are of the same order of magnitude. Our result indicates a strong link between the dynamically fluctuating SDW and the nodal gap.
In order to investigate whether CDW plays a role in the nodal gap Berg08 , we conducted a search for CDW in this sample by two different methods: off resonance x-ray diffraction (XRD) and resonance elastic x-ray scattering (REXS). The experiments were done at PETRA III on the P09 beam-line and at BESSY on the UE46-PGM1 beam-line, respectively. In REXS, the background subtraction is not trivial, so we only present here our XRD data. Nonetheless, the final conclusion from both methods is the same.
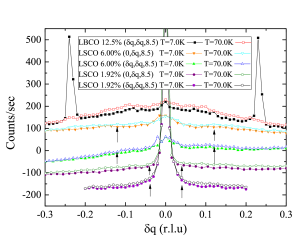
In Fig. 5 we show results from LSCO samples with , , and La2-xBaxCuO4 (LBCO) . The data sets are shifted vertically for clarity. The LBCO sample is used as a test case, since it has well established CDW and presents strong diffraction peaks. The measurements were taken at K and at K, which are below and above the CDW critical temperature of LBCO Tranquada2008cdw . We performed two types of scans: a “stripes” scan along direction and a “checkerboard” scan along direction. We chose to work at to minimize contribution from a Bragg peak at or . For LBCO at K, there is a clear CDW peak at in the “checkerboard” scan, which is absent at high temperatures. In contrast, for the LSCO samples there is no difference between the signal at high and low temperatures. Since of the CDW peak depends on doping, in our sample it is expected to be close to , where a tail of the Bragg peak could potentially obscure the CDW peak. Arrows in Fig. 5 show where we might expect the CDW peaks, should they appear, based on linear scaling with doping. These positions are out of the peak tail, and not obscured. Thus, although we are in experimental conditions appropriate to find a CDW, it is not observed within our sensitivity. In fact, CDW is even absent at higher doping as demonstrated by our experiment with LSCO sample. We observed the same null-result with the REXS experiment. It is important to mention that hourglass excitations with no stripe-like CDW were observed previously drees2013hour .
Our main results are as follows: we find the bottom part of an hourglass dispersion inside the AFM phase of LSCO. The hourglass does not start from zero energy, but has a soft gap from the static SDW order. A CDW order seems to be absent in our sample. Upon cooling the system, a nodal gap in electronic excitations opens just when the strongest spin excitations start to diminish. It is therefore sufficient for the SDW fluctuations to slow down without completely freezing out in order to modify the band structure.
Methods
For the Neutron scattering experiment, the sample was mounted on aluminum holder covered with Cd foils, and oriented in the (h,k,0) scattering plane. A Be filter was used to minimize contamination from high order monochromator Bragg reflections. The scattered neutrons are recorded with a nine bladed graphite analyzer. All the blades are set to scatter neutrons at the same final energy of 5 meV, and direct the scattered neutrons through an adjustable radial collimator to different predefined areas on a position sensitive detector bahl2006inelastic ; lefmann2006realizing . This monochromatic q dispersive mode allows for an efficient mapping of magnetic excitations with an excellent q resolution.
Two types of scans were used: I) energy scan, in which the incoming neutrons energy is swept, and the q information is embedded in the position of each blade. II) momentum scan, in which the incoming neutrons energy is fixed, the nine blades cover a small window in q, and the entire window is scanned. The contribution to a given q is a weighted sum from the different blades.
Despite the Be filter, some contribution from the nuclear structure is unavoidable. For elastic scattering, this contribution survives to higher temperature than does the magnetic part, and therefore can be easily subtracted. For inelastic scattering, the contribution from phonons could not be subtracted, but it is expected to vary slowly with temperature close to the magnetic phase transitions. Therefore, all features in this scattering experiment which show abrupt temperature dependence around and below K are associated with the electronic (magnetic) system.
References
- (1) Drachuck, G. et al. Comprehensive study of the spin-charge interplay in antiferromagnetic . Nat Commun 5 (2014). .
- (2) Harter, J. W. et al. Nodeless superconducting phase arising from a strong (, ) antiferromagnetic phase in the infinite-layer electron-doped compound. Phys. Rev. Lett. 109, 267001 (2012).
- (3) Vishik, I. et al. Phase competition in trisected superconducting dome. Proceedings of the National Academy of Sciences 109, 18332–18337 (2012).
- (4) Razzoli, E. et al. Evolution from a nodeless gap to -wave in underdoped . Physical review letters 110, 047004 (2013).
- (5) Peng, Y. et al. Disappearance of nodal gap across the insulator–superconductor transition in a copper-oxide superconductor. Nature communications 4 (2013).
- (6) Croft, T. P., Lester, C., Senn, M. S., Bombardi, A. & Hayden, S. M. Charge density wave fluctuations in and their competition with superconductivity. Phys. Rev. B 89, 224513 (2014).
- (7) Matsuda, M. et al. Electronic phase separation in lightly doped . Phys. Rev. B 65, 134515 (2002).
- (8) Niedermayer, C. et al. Common phase diagram for antiferromagnetism in and as seen by muon spin rotation. Phys. Rev. Lett. 80, 3843–3846 (1998).
- (9) Squires, G. L. Introduction to the theory of thermal neutron scattering (Cambridge university press, 2012).
- (10) Capati, M. et al. Electronic polymers and soft-matter-like broken symmetries in underdoped cuprates. Nature communications 6 (2015).
- (11) Hücker, M. et al. Competing charge, spin, and superconducting orders in underdoped . Phys. Rev. B 90, 054514 (2014).
- (12) Tranquada, J. et al. Quantum magnetic excitations from stripes in copper oxide superconductors. Nature 429, 534–538 (2004).
- (13) Matsuda, M. et al. Magnetic dispersion of the diagonal incommensurate phase in lightly doped . Physical review letters 101, 197001 (2008).
- (14) Rømer, A. T. et al. Glassy low-energy spin fluctuations and anisotropy gap in La1.88Sr0.12CuO4. Phys. Rev. B 87, 144513 (2013).
- (15) Drees, Y., Lamago, D., Piovano, A. & Komarek, A. Hour-glass magnetic spectrum in a stripeless insulating transition metal oxide. Nature communications 4 (2013).
- Popovici (1975) Popovici, M. On the resolution of slow-neutron spectrometers. IV. The triple-axis spectrometer resolution function, spatial effects included. Acta Crystallographica Section A: Crystal Physics, Diffraction, Theoretical and General Crystallography 31, 507–513 (1975).
- Wagman et al. (2013) Wagman, J. J. et al. Two-dimensional incommensurate and three-dimensional commensurate magnetic order and fluctuations in La2-xBaxCuO4. Phys. Rev. B 88, 014412 (2013).
- (18) Sushkov, O. P. & Kotov, V. N. Theory of incommensurate magnetic correlations across the insulator-superconductor transition of underdoped . Physical review letters 94, 097005 (2005).
- (19) Berg, E., Chen, C.-C. & Kivelson, S. A. Stability of nodal quasiparticles in superconductors with coexisting orders. Phys. Rev. Lett. 100, 027003 (2008).
- (20) Tranquada, J. M. et al. Evidence for unusual superconducting correlations coexisting with stripe order in . Phys. Rev. B 78, 174529 (2008).
- (21) Bahl, C. R. H. et al. Inelastic neutron scattering experiments with the monochromatic imaging mode of the rita-ii spectrometer. Nuclear Instruments and Methods in Physics Research Section B: Beam Interactions with Materials and Atoms 246, 452–462 (2006).
- (22) Lefmann, K. et al. Realizing the full potential of a rita spectrometer. Physica B: Condensed Matter 385, 1083–1085 (2006).
I Acknowledgments
The Technion team is supported by the Israeli Science Foundation (ISF). G.D. is also funded by the Gordon and Betty Moore Foundation’s EPiQS Initiative through Grant GBMF4411. We thank the SINQ, Petra, and BESSY beam line staff for their excellent support. Parts of this research were carried out at the light source PETRA III at DESY, a member of the Helmholtz Association (HGF).