Dust-deficient Palomar-Green Quasars and the Diversity of AGN Intrinsic IR Emission
Abstract
To elucidate the intrinsic broadband infrared (IR) emission properties of active galactic nuclei (AGNs), we analyze the spectral energy distributions (SEDs) of 87 Palomar-Green (PG) quasars. While the Elvis AGN template with a moderate far-IR correction can reasonably match the SEDs of the AGN components in of the sample (and is superior to alternatives such as that by Assef), it fails on two quasar populations: (1) hot-dust-deficient (HDD) quasars that show very weak emission thoroughly from the near-IR to the far-IR, and (2) warm-dust-deficient (WDD) quasars that have similar hot dust emission as normal quasars but are relatively faint in the mid- and far-IR. After building composite AGN templates for these dust-deficient quasars, we successfully fit the 0.3-500 SEDs of the PG sample with the appropriate AGN template, an infrared template of a star-forming galaxy, and a host galaxy stellar template. 20 HDD and 12 WDD quasars are identified from the SED decomposition, including seven ambiguous cases. Compared with normal quasars, the HDD quasars have AGNs with relatively low Eddington ratios and the fraction of WDD quasars increases with AGN luminosity. Moreover, both the HDD and WDD quasar populations show relatively stronger mid-IR silicate emission. Virtually identical SED properties are also found in some quasars from to 6. We propose a conceptual model to demonstrate that the observed dust deficiency of quasars can result from a change of structures of the circumnuclear tori that can occur at any cosmic epoch.
Subject headings:
galaxies:active — infrared:galaxies — quasars:general1. Introduction
The intrinsic UV to mid-IR spectral energy distributions (SEDs) of active galactic nuclei (AGNs) seem universal. Albeit large SED variations are seen among individual quasars, after removing the contamination from the host galaxies and the extinction caused by dust, and averaging the measurements of a sample of reasonable size, the mean SEDs of luminous AGNs are remarkably similar (e.g., Elvis et al., 1994; Richards et al., 2006; Shang et al., 2011). Two broad and prominent bumps dominate the UV-to-infrared SED – one in the optical-UV (known as the Big Blue Bump), contributed mainly by the thermal emission from the gas in an accretion disk, and another in the near- to mid-IR, dominated by the emission of dust heated by optical through soft X-ray photons (e.g., Rieke, 1978; Barvainis, 1987; Neugebauer et al., 1987; Sanders et al., 1989; Elvis et al., 1994). An inflection around 1.25 separates these two bumps, as a result of dust sublimation at a temperature of K (e.g., Barvainis, 1987). The mean AGN SEDs of quasars show little variation across a broad luminosity range as well as redshift (e.g., Wang et al., 2008; Elvis et al., 2012; Hao et al., 2014; Lyu et al., 2016), suggesting that these massive black hole accreting systems and their nearby surroundings share similar properties (e.g., Scott & Stewart, 2014). Most importantly, the dusty obscuration structure, typically traced by the near- to mid-IR emission and termed as a ‘torus,’ lay the foundation for AGN unification (e.g., Antonucci 1993; see the recent review by Netzer 2015), and its formation is a vital part of the make-up of a quasar (e.g., Sanders et al., 1988; King, 2003; Di Matteo et al., 2005; Hopkins et al., 2005, 2012; Vollmer et al., 2008).
Given the great importance of the AGN torus, it would be intriguing to look for quasars with abnormal IR SED features that could be potentially linked with the structure of the torus and its evolution. Jiang et al. (2010) reported the non-detection of hot dust emission from AGNs for two quasars, claiming they are likely to be the first-generation quasars in a dust-free environment. Hao et al. (2010, 2011) reported a population of “hot-dust-poor” quasars at moderate redshift and argued that there is a higher fraction at these redshifts compared to nearby quasars. Others have explored the redshift evolution of this special population of quasars based on large sky surveys but found contradictory results (Mor & Netzer, 2012; Jun & Im, 2013). Due to the limited observations at high redshift, the identifications of these quasars have been based on simple color selections, which is unlikely to be completely accurate. Meanwhile, since the mid-IR to far-IR infrared SEDs of these dust-deficient quasars are unknown, we lack a complete picture of the dust distribution in these systems.
A simple characterization of the torus is provided by the dust-covering factor, which is typically quantified by the relative luminosity between the torus and the accretion disk emission (e.g., Maiolino et al., 2007). In a number of papers, the mid-IR to optical luminosity ratios of quasars are found to reduce with increasing AGN luminosity (e.g., Maiolino et al. 2007; Treister et al. 2008; Mor & Trakhtenbrot 2011; Calderone et al. 2012; Gu 2013; Ma & Wang 2013; Roseboom et al. 2013), which is typically viewed as support for the model that the torus recedes as the luminosity increases (e.g., Lawrence, 1991; Simpson, 2005; Assef et al., 2013). In contrast, Richards et al. (2006) show that the mid-IR parts of the AGN SEDs are similar, but the most luminous quasars are much brighter at mid-IR bands compared with the least optically luminous quasars (see also, e.g., Edelson & Malkan 1986; Krawczyk et al. 2013). Meanwhile, others have reported that the fraction of quasars with weak hot dust emission was generally independent of the AGN luminosity (Hao et al., 2010, 2011; Mor & Netzer, 2012). These apparent discrepancies again demonstrate our limited knowledge of quasars with weak dust emission as well as of the connection between the weak dust emission and AGN properties.
This work reports on the dust-deficient quasars among 87 Palomar-Green (PG) quasars from the Palomar Bright Quasar Survey (Schmidt & Green, 1983; Boroson & Green, 1992). The PG sample is representative of bright optical-selected quasars and has been a cornerstone for quasar studies in the past 40 years. Thanks to the ample multiband observations made previously, we can calibrate the host galaxy properties derived from SED analysis with other independent methods and reveal the intrinsic AGN infrared emission. We will use SED decomposition to explore how well the classical AGN spectral template fits the behavior of these low-redshift AGNs and to identify any with a deficiency of hot or warm dust emission. The distributions of various AGN properties, such as AGN luminosities, black hole masses, and Eddington ratios, will be compared between the dust-deficient quasar population and the normal quasar population. Finally, we will make comparative studies of the PG sample with the high-redshift results (e.g., Hao et al., 2010, 2011; Jiang et al., 2010; Leipski et al., 2014) and discuss the nature of the dust-deficient quasars in general.
The paper is organized as follows. A description of the data collection and the issue of AGN variability is provided in Section 2. We present the infrared SED templates for normal quasars as well as dust-deficient quasars in Section 3. Section 4 introduces the SED decomposition method. Section 5 contains the results from the SED analysis. We discuss the diversity of AGN infrared intrinsic emission, the characteristics of the dust-deficient quasars, as well as similar quasars found at high- in Section 6. A summary is given in Section 7.
Throughout this paper, we adopt the cosmology , , and km s-1Mpc-1.
2. Data
2.1. Data Compilation
To construct the IR SEDs of the 87 PG quasars, we compiled mid-IR to far-IR photometry measured by Spitzer/MIPS at 24, 70, and 160 (Shi et al., 2014), and far-IR and sub-millimeter photometry observed by Herschel PACS and SPIRE at 70, 100, 160, 250, 350, 500 (Petric et al., 2015). We also gathered the near-IR photometry at (1.24), (1.66), and (2.16) from the 2 Micron All Sky Survey (2MASS; Skrutskie et al. 2006) and the UKIRT Infrared Deep Sky Survey (UKIDSS; Lawrence et al. 2007), and mid-IR photometry at (3.4), (4.6), (12), and (22) from the AllWISE program (Wright et al. 2010). Since we are going to compare the host galaxy stellar emission retrieved from SED decomposition with that from image analysis, particular attention has been paid to the selection of photometry data with appropriate apertures to include the whole light (AGN plus the host galaxy) of the quasar and reduce possible contamination. We used the Standard Photometry with isophotal apertures based on the Ks 20 mag/arcsec2 elliptical isophote from the 2MASS extended source catalog if the quasar light profile is not identified to be a single point-spread-function by 2MASS. The Wide-field Infrared Survey Explorer (WISE) and bands can also be contaminated by the stellar emission. If a quasar has been identified as an extended object by 2MASS and the WISE W1/W2 aperture photometry flux is larger than that based on the default profile-fit photometry optimized for point sources, we chose the WISE W1/W2 band scaled-2MASS-aperture photometry with the largest aperture as long as no other source was included. UKIDSS has observed 29 PG quasars from our sample up to its Data Release 10. Compared with 2MASS, the UKIDSS data has a smaller time gap with the WISE data, reducing the effect on the SED due to long-term IR variability. However, UKIDSS used a 2.0 arcsec diameter aperture to record the quasar flux (Dye et al., 2006). We only use the UKIDSS data when the quasar is a 2MASS point source.111We replaced the 2MASS data with the UKIDSS data for the following quasars: PG 0003+158, PG 0026+129, PG 0043+039, PG 1001+054, PG 1049005, PG 1103006, PG 1151+117, PG 1211+143, PG 1216+069, PG 1307+085, PG 1309+355, PG 1552+085, PG 1612+261, PG 2251+113, and PG 2308+098. Although PG 1004+130 is also a 2MASS point source that was matched in the UKIDSS catalog, we removed it from the list due to its lack of the UKIDSS -band observation. For 2MASS point-source PG quasars without the complete UKIDSS near-IR data, we used the profile-fit photometry in the 2MASS catalog. The WISE W3 and W4 band profile-fit photometry was adopted for all the PG quasars.
For the UV-optical data, the Galaxy Evolution Explorer (GALEX; Martin et al. 2005) has observed these PG quasars with far-UV (0.15) detections for 72 of them and near-UV (0.23) detections for 78 in GALEX Release 7 (Bianchi et al., 2014). We have archival optical (0.35 ), (0.48 ), (0.62 ), (0.76 ), and (0.91 ) observations for 75 of our quasars from the Sloan Digital Sky Survey (SDSS; York et al. 2000) Data Release 12 (Alam et al., 2015). We adopted the SDSS Model Magnitude, modelMag, to account for the optical emission of both resolved and unresolved objects. For quasars without SDSS or GALEX observations, we complete their SEDs with literature data222Broadband 1450 continuum flux for PG 0844+349, PG 0953+414, and PG 0804+761 (Kaspi et al., 2005); CIV continuum flux (0.15 ) for PG 1535+547 and PG 2308+098 (Baskin & Laor, 2005); broadband 1350 and 5500 continuum flux for PG 1416129 (Labita et al., 2006; Hamilton et al., 2008); XMM-Newton 0.21-0.29 UV measurements for PG 0844+349, PG 0953+414, PG 1126041, PG 1352+183, PG 1535+547, and PG 1626+554 (Brocksopp et al., 2006; Ballo et al., 2008; Gallo et al., 2011; Giustini et al., 2011; Page et al., 2012); interpolated 0.25 flux from published data for PG 0838+770 and PG 0804+761 (Steffen et al., 2006); integrated Johnson (0.44 ) and I (0.88 ) band flux for PG 0838+770, PG 1126041, and PG 1613+658 (Surace et al., 2001); Broadband 5100 continuum flux for PG 1700+518 (Kaspi et al., 2000); Johnson R photometry for PG 1700+518 (Carini et al., 2007); Johnson , , , photometry for PG 1302102 and PG 0804+761 (Ojha et al., 2009); Johnson band from the original PG Catalog for PG 1011040, PG 1310108 (Green et al., 1986); (), (), (), or () photometry for PG 1048090, PG 1149110, PG 1435067 from the AAVSO Photometric All Sky Survey (Henden et al., 2016); DENIS -band (0.89 ) photometry for PG 1011040, PG 1310108 (Paturel et al., 2003). with the aid of the NASA/IPAC Extragalactic Database (NED) and the VizieR service (Ochsenbein et al., 2000).
We compared the SED composed by us with the observed SED data of 27 PG quasars presented in Elvis et al. (1994)333We only focus on the quasars in the UVSX sample that have been analyzed in detail (Table 1A in Elvis et al. 1994). The optical-to-near-IR SED shapes of these quasars do not show substantial changes over a timescale of 20 years. The mid- to far-IR SEDs of 16 of these quasars show a clear drop in the most recent data, which is due to the smaller beam sizes and higher sensitivities of Spitzer, WISE, and Herschel compared with those of the Infrared Astronomical Satellite (IRAS) whose data product was used in Elvis et al. (1994).
2.2. Photometric Variability
Since the photometric data used in this work were taken at various times spanning 20 years, AGN variability could be a potential factor to produce unphysical SED features between different data sets. Various programs of quasar monitoring have demonstrated that the variability deceases at longer wavelengths (e.g., Cutri et al., 1985; Neugebauer et al., 1989; di Clemente et al., 1996; de Vries et al., 2005). Although the UV variability of some quasars can be as large as 2-3 mag (e.g., Paltani & Courvoisier, 1994; Wheatley et al., 2008; Welsh et al., 2011), the optical variability amplitudes are typically at 0.2-1.5 mag (e.g. Giveon et al., 1999; de Vries et al., 2005), and the near-IR bands only at 0.2-0.3 mag (e.g., Enya et al., 2002a, b). For example, in the heterogeneous sample of 200 quasars observed by Enya et al. (2002a, b), excluding blazars, only 23 exceeded 0.1 dex in variation and only 5 exceeded 0.2 dex. This sample had disproportionate numbers of AGNs expected to vary, such as radio-loud ones. More relevant to our study, Neugebauer et al. (1989) reported on a comprehensive study of near infrared variability of PG quasars. Only 6 of 108 sources in their study varied by more than 0.15 mag and only 3 sources varied by more than 0.25 mag (0.1 dex). Of the 32 quasars that will be classified as being deficient in warm or hot dust by us (see section 5.2), 28 quasars were included in their study; only one (PG 0049+171) varied by more than 0.15 mag (= 0.06 dex). A longer baseline can be studied by comparing the photometry in Neugebauer et al. (1989) with 2MASS and UKIDSS photometry. However, differences in the measured fluxes could also be due to instrumental changes (i.e., aperture photometer versus array camera), so we can only identify candidates PG 1048090, PG 1115+407, PG 1216+069, PG 1307+085, PG 1426+015, and PG 1617+175. For PG 1115+407 and PG 1426+015, the host galaxies are comparable in brightness to the AGNs (McLeod & Rieke 1994, Veilleux et al. 2009 respectively), so the evidence for variations is ambiguous, since different measurement strategies could include more or less of the host galaxy in the signal. PG 1226+023 (3C273) is one of the few blazars in the PG sample (Massaro et al., 2015). None of the changes are larger than 0.25 dex, even over the 25 year baseline represented by these measurements.
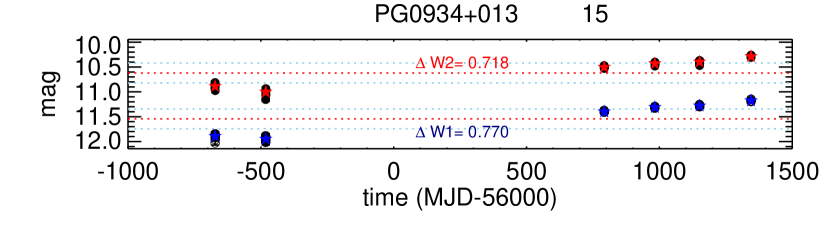
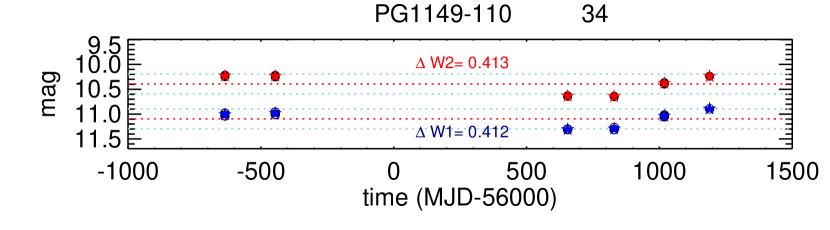
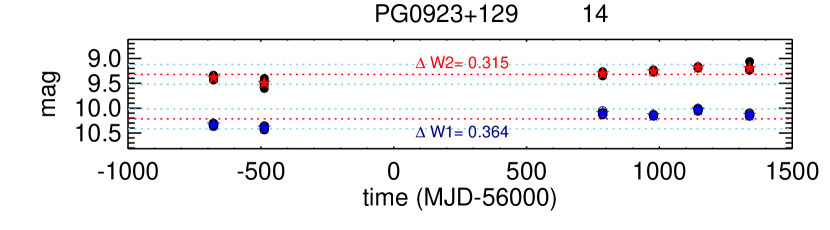
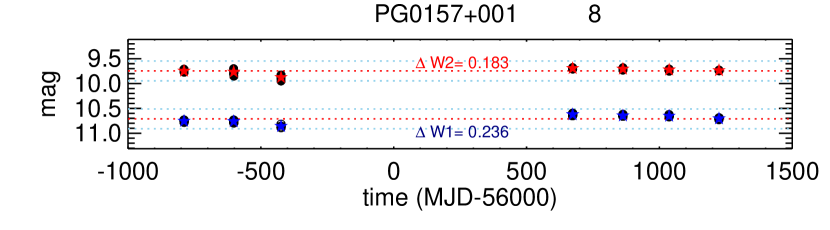
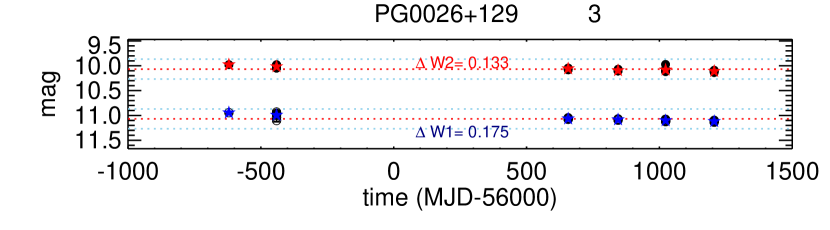
To explore the longer-wavelength infrared variability of these quasars, we collected the and band observations from the WISE (Wright et al., 2010) and newly released data from the Near-Earth Object WISE Reactivation mission (NEOWISE-R; Mainzer et al. 2014). During a time period of five years (2010-2016), each quasar was observed for five to seven epochs with 10-20 individual exposures in a single epoch. To reduce the systematic uncertainties, we average the photometric values during an epoch, after removing exposures with poor quality.444e.g., being influenced by the moon light or contaminated by halos due to nearby bright stars. See: http://wise2.ipac.caltech.edu/docs/release/allsky/expsup/sec2_4b.html Figure 1 presents example WISE light curves for a few PG quasars with different variability amplitudes. For the mid-IR (3.4-4.6) light curves probed by WISE, of the PG quasars have W1 or W2 variability amplitudes smaller than mag. For a few extreme cases (e.g., PG 0003+199, PG 0934+013, PG 1534+580, PG 2304+042), the variability can be as large as 0.6-0.7 mag. Neugebauer & Matthews (1999) studied the mid-IR (3.7 and 10 ) light curves of 25 PG quasars in 1974-1998, and reported similar variability amplitudes. Runnoe et al. (2012) compared the ALLWISE and magnitudes with synthetic values derived from Spitzer/IRS spectra for 22 PG quasars in our sample and reported less than 0.2 mag variability amplitudes (i.e., less than 0.1 dex) over a period of four to five years. For these reasons, there could be a non-physical shift between the WISE and 2MASS data in a small number of cases. However, the influence is still within dex.
Since the separation of the host galaxy and the AGN is mostly dependent on the near- and mid-IR for the great majority of cases, we conclude that the differing SED behavior we find below is not significantly influenced by variability over the time span for the various measurements.
3. The IR SED Templates for AGNs
3.1. Normal Quasars
After subtracting the near-IR and far-IR emission from host galaxies, a number of common dust features emerge in AGN SEDs. One such feature is hot dust emission peaked at (e.g., Sanders et al., 1989; Elvis et al., 1994; Richards et al., 2006), which originates from the innermost region of the torus (e.g., Netzer et al., 2007). Another major feature is a relatively flat continuum that spans 3-20 with silicate emission at and , contributed by the warm dust emission from the torus (e.g., Fritz et al., 2006; Nenkova et al., 2008). The mid-IR emission of AGNs is strongly correlated with the hard X-ray flux (e.g., Lutz et al., 2004; Horst et al., 2006; Asmus et al., 2015; Mateos et al., 2015), further suggesting the similar SED properties of most luminous AGNs. In the far-IR, although the contamination from the host galaxy can become severe in many cases, the SED of AGNs is believed to drop quickly (e.g., Deo et al., 2009).
Elvis et al. (1994) built an AGN SED template based on a sample of both optically selected and radio-selected quasars that have strong X-ray emission and are optically blue. Although a number of these quasars were not detected by IRAS due to the limited sensitivity, the far-IR SED of Elvis et al. (1994) agrees remarkably well with later work (e.g., Richards et al., 2006; Shang et al., 2011). In Elvis et al. (1994), the host galaxy IR contribution of the AGN SED was not corrected since the dispersion of the mean template of spiral galaxies used then was too large to be useful. The lack of understanding of the galaxy IR SED was mitigated by later work (e.g., Rieke et al. 2009; Rujopakarn et al. 2011, 2013): for the same IR luminosity surface density, the IR SEDs of star-forming galaxies are similar. Based on the correlation between the 11.3 aromatic feature strength and the infrared colors, Xu et al. (2015) removed the IR contribution from star formation in the Elvis et al. (1994) template. The validity of this updated AGN template to fit the UV-to-IR SED of high-redshift quasars has been demonstrated in Xu et al. (2015) and Lyu et al. (2016).
Based on an iterative algorithm to derive the SED templates of AGNs at 0-5.6, Assef et al. (2010) reported an AGN empirical template with a much deeper 1 inflection (or stronger hot dust emission) than the Richards et al. (2006) AGN template. Assef et al. (2010) suggested that the Elvis et al. (1994)-like AGN templates intrinsically have considerable amounts of host stellar contamination in the near-IR. We disagree with this argument. For the most luminous quasars at , where the host galaxy contamination can be ignored, the Elvis et al. (1994)-like AGN templates match the observed UV-to-mid-IR SEDs well in most cases (e.g., Jiang et al., 2007, 2010; Wang et al., 2008; Lyu et al., 2016). In Section 5.3.1, we will show that the Assef et al. (2010) AGN template systematically overestimates the host stellar emission in fitting normal PG quasars with HST image decomposition results as an independent calibrator.
Recently, some authors have claimed that the intrinsic AGN IR SED should contain much more far-IR emission, even compared with the far-IR uncorrected Elvis et al. (1994) template (e.g., Kirkpatrick et al., 2015; Symeonidis et al., 2016). The derivations of these templates are highly dependent on the detection of mid-IR spectral features related to host galaxy star formation and on use of appropriate SED templates for star forming galaxies to relate these features to the far IR emission. In fact, if we make a mock quasar SED by combining the Rieke et al. (2009) star-formation galaxy template and Elvis et al. (1994) AGN template, when the host galaxy contribution is only in the mid-IR, the galaxy still contributes of the total IR (8-1000 ) luminosity of the system. Given the limited signal-to-noise of the Spitzer/IRS spectra, the uncertainties in extrapolating to the far infrared make the derived quasar SEDs highly uncertain.
3.2. Dust-Deficient Quasars
PG quasars with weak near- and mid-infrared emission were first noted in the early 1990s (Barvainis, 1990; McDowell et al., 1992) and later by Hao et al. (2011). In this paper, we use the classical Elvis et al. (1994) quasar template as a standard ruler to look for abnormal quasars in the near-IR or the mid-IR bands. Elvis et al. (1994) reported that the dispersion of quasar SEDs has a 68 percentile distribution within a factor of two to three of the mean throughout. Thus, we adopt a near- or mid-IR SED deviation from the normal quasar template by dex to look for quasars with persuasive evidence of weak emission.
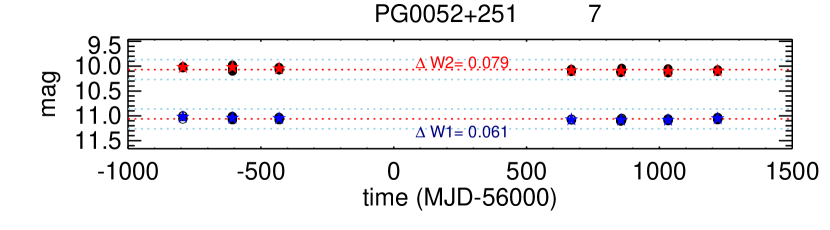
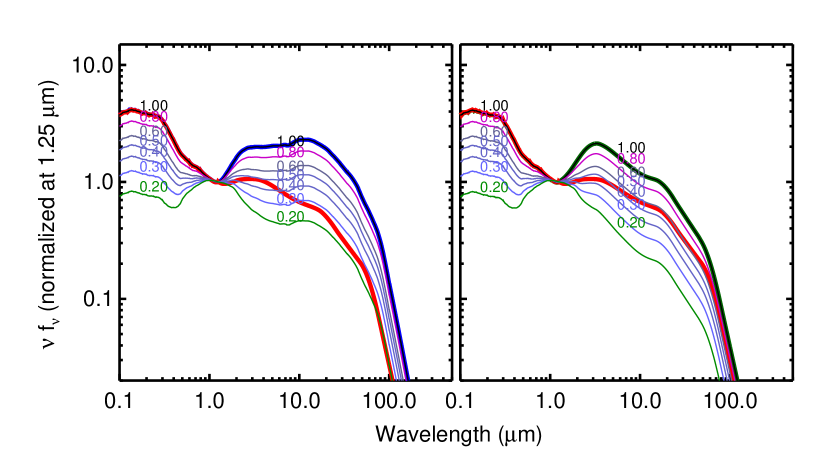
After visually inspecting the SEDs, we found a population of PG quasars with a deficiency of hot dust emission and very weak far-IR emission. However, host galaxy contamination in the near-IR (due to stellar emission) and the far-IR (due to star formation in HII regions) can make the identification of these quasars difficult. Therefore, we postulate that there is an intrinsic hot-dust-deficient (hereafter HDD) SED and make a template by averaging the SEDs of quasars that clearly present a deficiency of hot dust emission and do not have strong host galaxy contamination in their SEDs. After a detailed inspection of the observed SEDs of the whole sample, we ended up with four purest examples of HDD quasars: PG 0026+129, PG 0049+171, PG 1121+422, and PG 1626+554. Normalized at 1.25, their IR SEDs look quite similar, as shown in the left panel of Figure 2. Three of the four are not detected in the far-IR and one – PG 0039+171 – is not much above the SPIRE confusion noise (Nguyen et al., 2010). Their infrared emission is not likely to be strongly contaminated by radio synchrotron emission considering the small value of radio loudness (see Table 1). Therefore, as found in Xu et al. (2015), we scale a blackbody of 118 K and with a wavelength-dependent emissivity proportional to to match the HDD template at . The optical SEDs of these four quasars show some variation but the SED obtained by averaging the individual quasar measurements is still similar to that of normal quasars. Thus, we assume the same average SED as that of normal quasars for the HDD template at .
| Source | Reference | Variability | |||
|---|---|---|---|---|---|
| (1) | (2) | (3) | (4) | (5) | (6) |
| HDD template | |||||
| PG 0026+129 | 0.14 | 0.80 | 1 | N | 1.08 |
| PG 0049+171 | 0.06 | – | – | N | 0.32 |
| PG 1121+422 | 0.23 | 0.93 | 2 | N | 0.10 |
| PG 1626+544 | 0.13 | 0.72 | 1 | N | 0.11 |
| WDD template | |||||
| PG 0804+761 | 0.11 | 0.90 | 3 | N | 0.60 |
| PG 0923+201 | 0.19 | 0.77 | 1 | N | 1.74 |
| PG 1116+215 | 0.18 | 0.95 | 1 | N | 0.72 |
| PG 1617+175 | 0.11 | 0.89 | 1 | Y | 0.72 |
Note. — Column (1): object name; column (2): redshift; column (3): the contribution of the PSF component in the observed band from the HST image decomposition; column (4): references for HST image decomposition results: 1-Veilleux et al. (2009); 2-McLeod & McLeod (2001); 3-Guyon et al. (2006). column (5): if the quasar shows strong near-IR variability; column (6): radio loudness, taken from Petric et al. (2015).
A standard procedure for making an AGN template should include the subtraction of the host galaxy contribution in the near-IR (e.g., Elvis et al., 1994; Richards et al., 2006; Shang et al., 2011). Nevertheless, the host galaxy contamination in these four HDD quasars is small. For the three quasars with HST images, the quasar light substantially outshines the stellar emission in the near-IR (see Table 1). The other quasar, PG 0049+171, is not resolved in the 2MASS images despite its low redshift. It is barely resolved in band by Smith et al. (1986), who concluded that the host galaxy is two magnitudes fainter than the quasar at this wavelength. Its optical to near-IR colors are bluer than or identical to classical quasars, suggesting that the near-IR emission is not significantly boosted by the host galaxy. As a result, we conclude that the near-IR host galaxy stellar contamination for these four quasars is too small to have any visible influence on the derived HDD AGN template.
In addition, we have found that there are a number of quasars whose SEDs cannot be fitted adequately by either the normal or HDD templates, or by any combination of them. Their near-IR SEDs present the typical bump peaked at 2.0 m, but they drop quickly at 5.0 m. In other words, hot dust emission is present in these quasars, but their mid-IR emission is relatively weak compared with normal quasars. Host galaxy contamination would not produce this type of SED, and should be small in any case as shown in Table 1. We combine the IR SEDs of four such quasars, PG 0804+761, PG 0923+201, PG 0953+414, PG 1116+215, and make a composite SED similarly to the HDD template (right panel of Figure 2). These four quasars all have small radio loudnesses and weak near-IR variability. We will describe this SED as the warm-dust-deficient (WDD) AGN template from now on.
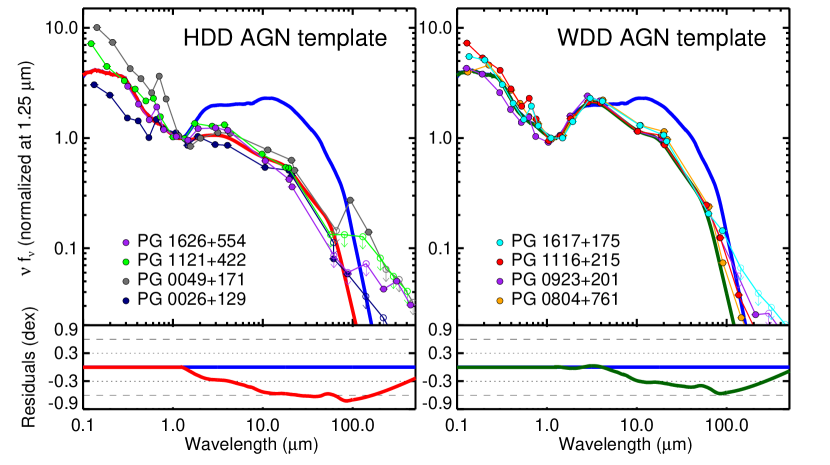
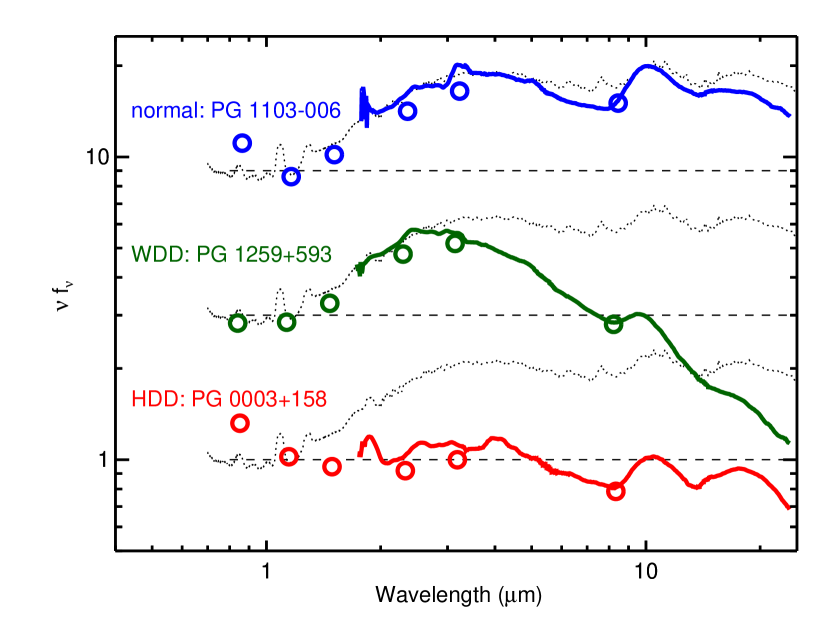
We can confirm the distinct features of the three AGN SED templates for normal quasars, HDD quasars and WDD quasars by the Akari and Spitzer/IRS infrared spectra of example quasars, as shown in Figure 3. PG 0003+158, PG 1259+593, and PG 1103006 were selected because their redshifts () allow Akari spectra to cover the near-IR band (). The differences among normal, WDD and HDD quasars are due to the dust continuum, not any emission features like aromatic bands or silicate features. With the same UV-optical luminosity, the HDD AGN template has only 40% of the emission of the normal AGN template at 1.25-1000 . For the WDD AGN template, this value is 70%.
3.3. Are the HDD and WDD Templates Bona Fide?
An artificial SED similar to that of quasars with weak infrared emission could result if there is a strong contribution from the population of old stars in the host galaxy, which would peak near 1 micron and fill in the typical minimum near that wavelength in the normal (Elvis) quasar SED. In this subsection, we check if the HDD and WDD templates could be derived from the combination of normal quasar SED and stellar template.
In the top panel of Figure 4, we combine the Elvis et al. (1994) AGN template with a single stellar population template for 13 Gyr old stars from Bruzual & Charlot (2003) to explore the SEDs of normal quasars with different stellar contamination in the near-IR (as indicated by the AGN light fraction in the near-IR, ). As the stellar emission in the near-IR increases, the prominence of the near-IR dust spectral bump gradually decreases. However, we also see a change of the optical slope away from that of normal quasars. As shown in Section 3.2, the HDD quasars share similar optical colors as other local quasars. Meanwhile, compared with the composite SEDs, the HDD template has relatively weaker emission in the mid-IR. For these reasons, we conclude that the HDD quasar template cannot be produced by a normal quasar template plus stellar emission in the near-IR. A similar argument can also be found in Hao et al. (2010, 2011).
We also investigate if the HDD quasar template is a result of the combination of the WDD quasar template and an old stellar population template. As shown in the right panel of Figure 4, though the =0.40-0.50 composite SEDs resemble the WDD template in the infrared, their optical colors differ from the WDD quasars (see the right panel of Figure 2). Additionally, we expect the stellar contributions to both HDD and WDD templates to be low (see the previous Subsection). As a result, we conclude that the HDD and WDD templates represent two different groups of quasars, rather than the results of different stellar near-IR contaminations.
The WDD AGN template is distinguished from the normal AGN template by its very weak mid-IR and far-IR emission. Normalized at 1.25, the former has only of the total infrared luminosity (8-1000) of the latter. As stated in Appendix C of Xu et al. (2015), the IR modified Elvis et al. (1994) AGN template provides a limiting case for the maximum plausible FIR contribution from star formation in a quasar. Given the consistent star formation rates (SFRs) based on the IR luminosities of the host galaxies and the mid-IR 11.3 aromatic feature strengths (see Section 5.3.2), we have no reason to suggest that the intrinsic AGN emission of normal quasars could be as low as the case of the WDD AGN template. In other words, although sharing a similar hot dust emission feature, the normal AGN template and the WDD AGN template reflect two populations of quasars with distinct mid- to far-IR emission properties.
4. SED Decomposition of PG quasars
We now use the three AGN SED templates to fit the behavior of the full set of 87 PG quasars.
The wide wavelength range covered by the photometry of PG quasars enables accurate SED decomposition of the emission from the AGN and the host galaxy. SED fitting methods using multiple components have been developed and demonstrated in a number of works (e.g., Bongiorno et al., 2007, 2012; Pozzi et al., 2010; Lusso et al., 2011; Xu et al., 2015). The decomposition depends on the large differences in the behavior of the optical to near-IR SEDs of the stellar and AGN emission. As summarized in the Introduction, the AGN SED shows two broad maxima separated by a dip at . Meanwhile, the galaxy emission is a result of multiple stellar populations with different star formation histories. For the nearby massive galaxies, the stellar SEDs generally peak at , dominated by the emission from stars in old stellar populations, and drop quickly as a Rayleigh-Jeans tail toward the mid-IR. Examples of using a galaxy plus AGN component to decompose the optical-near-IR quasar SEDs can be seen in e.g., Bongiorno et al. (2007, 2012); Pozzi et al. (2010), and Lusso et al. (2011). For the mid-IR and far-IR emission of a quasar, both AGN and galaxy will contribute some emission by dust. With proper consideration of templates used to represent the intrinsic AGN emission and the host dust emission, separation of the contributions from these two are possible (e.g., Dale et al., 2014; Xu et al., 2015; Lyu et al., 2016)
We model the 0.5-500 SED of each PG quasar with a combination of three components.
-
1.
AGN component with possible extinction: As stated in Section 3.1, we select the AGN intrinsic template developed based on Elvis et al. (1994) by Xu et al. (2015) (see their Appendix C) to represent the AGN emission for normal quasars. This normal AGN template will be combined with the HDD or WDD AGN template to characterize the possible transitional infrared SEDs between the normal cases and dust-deficient cases, while keeping the SED of the UV-optical emission unchanged. To take into account the obscuration caused by dust in the AGN ambient regions as well as the host galaxy, we assume that the AGN component is reddened by an SMC-like () plus MW-like () composite extinction curve, as in Xu et al. (2015). Such a combination is proposed based on the statistical study of quasar UV-optical extinction based on SDSS (Hopkins et al., 2004) and the lack of knowledge of the AGN near- to mid-IR extinction curves.
-
2.
IR emission of a luminous infrared galaxy: Many PG quasar host galaxies are found to have SFRs 10-100 (based on the strength of aromatic feature, see Shi et al., 2014), which roughly puts them in the LIRG () category. We adopt the templates in Rieke et al. (2009) with =9.75-12.00. In Rieke et al. (2009), the shape of the infrared SED of nearby galaxies is found to be dependent on their infrared luminosity. We will pick the one that best fits the far-IR SED of the quasar in combination with the other components, without imposing a luminosity constraint.
-
3.
Stellar emission of an old stellar population: We use the stellar SEDs from Bruzual & Charlot (2003) with a Salpeter initial mass function, Padova evolutionary tracks, and solar metallicity. Considering the similarity between the SEDs for a range of ages, we pick one single stellar population template for each quasar with an age of 0.5 Gyr, 1.6 Gyr, 7.2 Gyr, or 13 Gyr, to represent the overall SED properties of the stellar emission that contributes to the near-IR emission (in most cases, any differences in the optical and UV stellar SEDs are overwhelmed by the emission by the quasars).
Our SED model can be summarized by the following equation
where is the normalized extinction curve, and , , , are the SED templates for normal AGN, HDD or WDD AGN, stellar emission, and galaxy infrared emission. There are five normalizing factors, denoted as . With the selection of the stellar templates and galaxy IR templates, there are seven free parameters in total. The modeled photometry will be computed by convolving the corresponding filter with the modeled SED. Since the multiband photometry includes a large set of data with a diverse level of relative uncertainty, to reflect the overall SED shape rather than focusing on a few data points with the smallest uncertainties, we give the same weight to all data points in - space during the fitting. We will use the classical definition of the statistic to evaluate the goodness of the fitting at first, and then check the residuals of the points with large values in detail.
5. Results
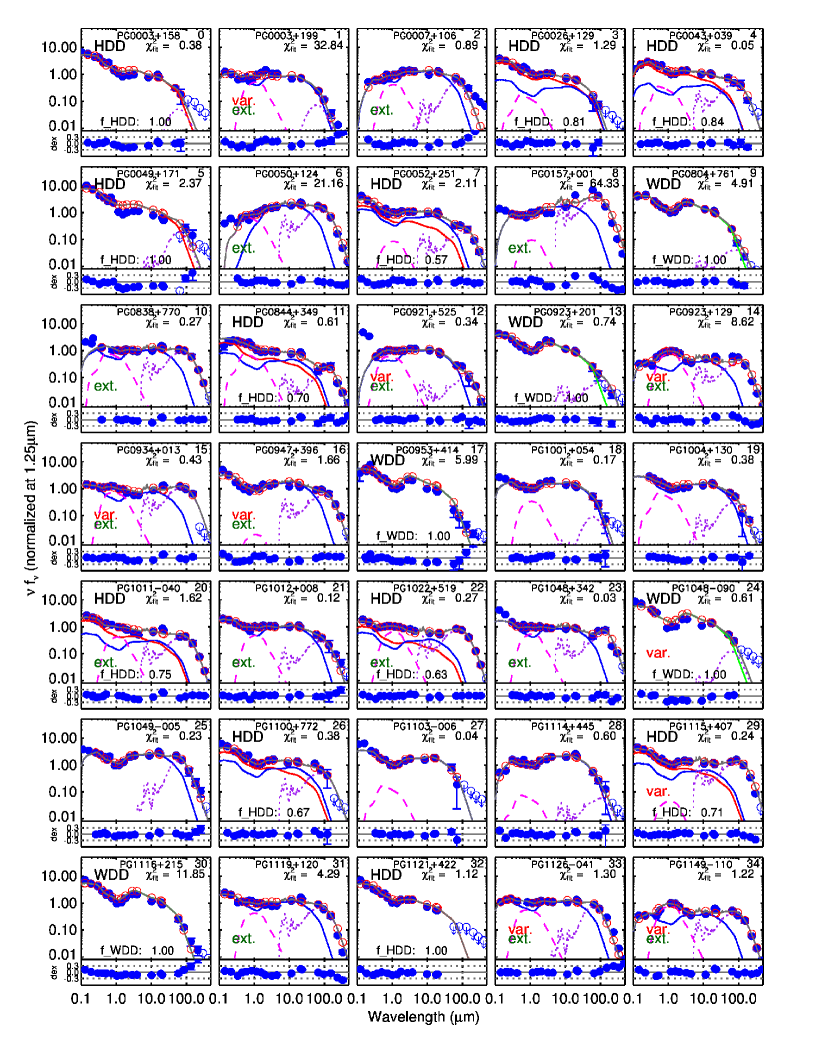
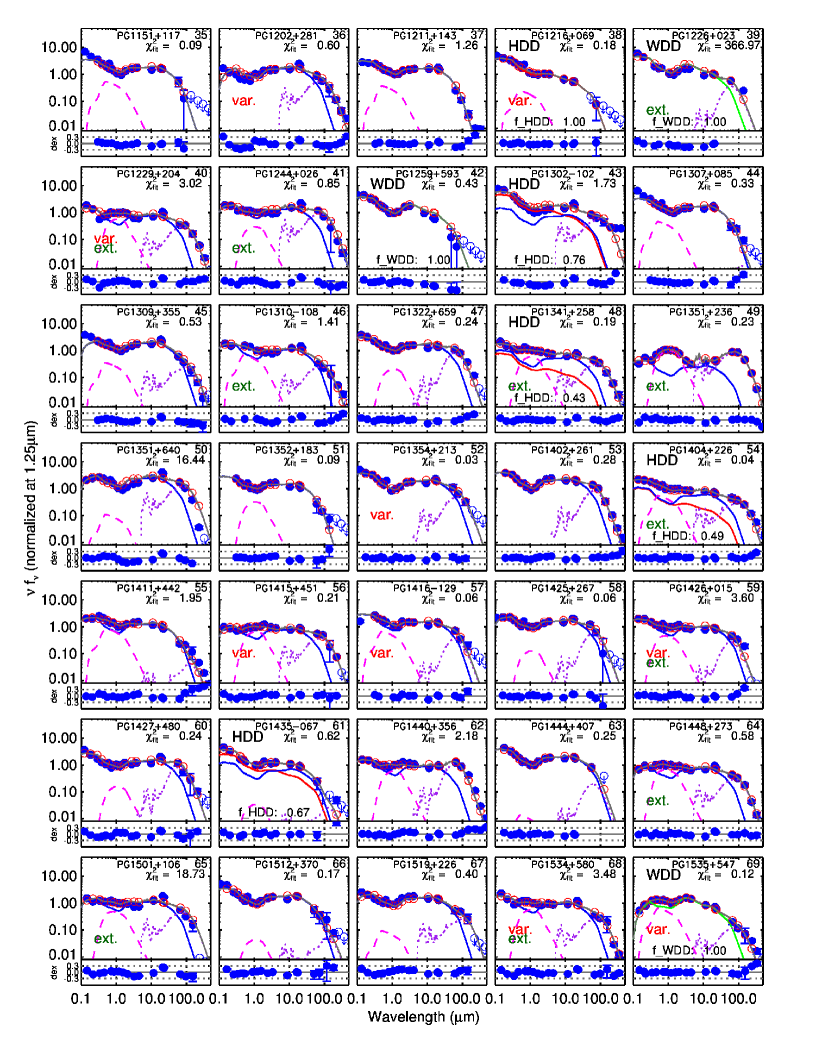
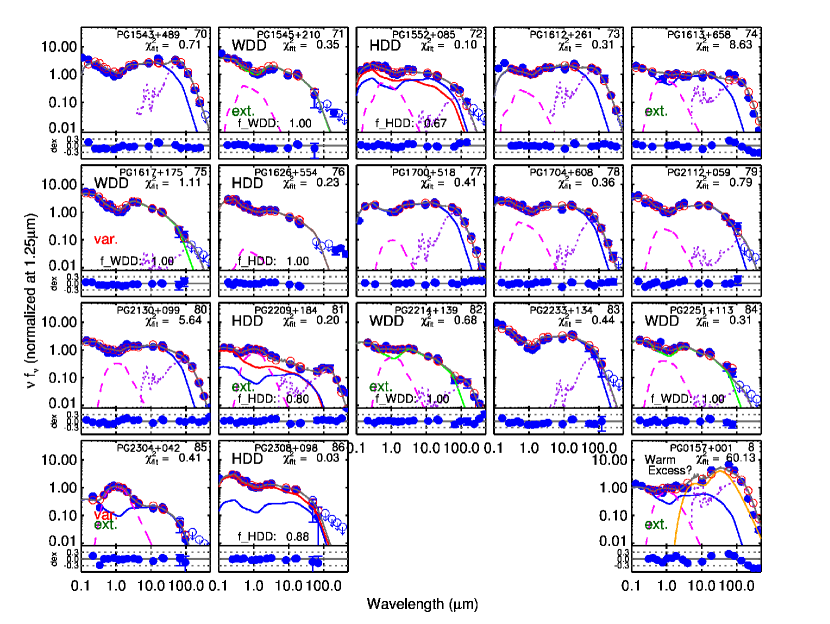
The SED fitting results for the 87 PG quasars are described in Figure 5 and Table 2. As introduced briefly in Section 2.2, the AGN variability potentially embedded in different data sets could introduce some offset from the intrinsic SED ( dex in the UV, 0.1-0.2 dex in the near-IR). As a result, the UV-optical SEDs are hard to interpret. We will mainly focus on the reproduction of the overall shape of the SED, and the host galaxy contribution to the near-IR and far-IR.
| ID | Source | Type | SFR | |||||||
|---|---|---|---|---|---|---|---|---|---|---|
| (1) | (2) | (3) | (4) | (5) | (6) | (7) | (8) | (9) | (10) | (11) |
| 0 | PG 0003+158 | 0.45 | HDD | 1.00 | 0.00 | 0.00 | 9.95 | 0.05 | 68.76 | 8.7 |
| 1 | PG 0003+199 | 0.03 | – | 0.00 | 0.56 | 0.48 | 0.33 | 0.06 | 2.22 | 0.4 |
| 2 | PG 0007+106 | 0.09 | – | 0.00 | 0.44 | 0.38 | 2.02 | 0.24 | 11.11 | 8.5 |
| 3 | PG 0026+129 | 0.14 | HDD | 0.81 | 0.11 | 0.10 | 1.62 | 0.00 | 11.81 | 0.0 |
| 4 | PG 0043+039 | 0.38 | HDD? | 0.84 | 0.17 | 0.18 | 10.40 | 0.35 | 49.50 | 62.2 |
| 5 | PG 0049+171 | 0.06 | HDD | 1.00 | 0.00 | 0.00 | 0.22 | 0.12 | 1.42 | 0.4 |
| 6 | PG 0050+124 | 0.06 | – | 0.00 | 0.52 | 0.40 | 6.66 | 0.44 | 26.92 | 51.1 |
| 7 | PG 0052+251 | 0.16 | HDD | 0.57 | 0.10 | 0.09 | 3.37 | 0.21 | 19.49 | 12.0 |
| 8 | PG 0157+001 | 0.16 | – | 0.00 | 0.12 | 0.10 | 25.35 | 0.69 | 56.82 | 303.4 |
| 9 | PG 0804+761 | 0.10 | WDD | 1.00 | 0.00 | 0.00 | 3.19 | 0.04 | 22.34 | 2.1 |
| 10 | PG 0838+770 | 0.13 | – | 0.00 | 0.52 | 0.47 | 2.66 | 0.49 | 9.91 | 22.5 |
| 11 | PG 0844+349 | 0.06 | HDD? | 0.70 | 0.40 | 0.36 | 0.62 | 0.23 | 3.49 | 2.4 |
| 12 | PG 0921+525 | 0.04 | – | 0.00 | 0.56 | 0.47 | 0.22 | 0.11 | 1.45 | 0.4 |
| 13 | PG 0923+201 | 0.19 | WDD | 1.00 | 0.00 | 0.00 | 3.39 | 0.09 | 22.59 | 5.0 |
| 14 | PG 0923+129 | 0.03 | – | 0.00 | 0.82 | 0.77 | 0.40 | 0.54 | 1.33 | 3.7 |
| 15 | PG 0934+013 | 0.05 | – | 0.00 | 0.64 | 0.58 | 0.40 | 0.62 | 1.10 | 4.3 |
| 16 | PG 0947+396 | 0.21 | – | 0.00 | 0.02 | 0.02 | 6.71 | 0.29 | 34.75 | 33.5 |
| 17 | PG 0953+414 | 0.24 | WDD | 1.00 | 0.00 | 0.00 | 7.31 | 0.00 | 53.24 | 0.0 |
| 18 | PG 1001+054 | 0.16 | – | 0.00 | 0.31 | 0.29 | 2.15 | 0.04 | 14.99 | 1.6 |
| 19 | PG 1004+130 | 0.24 | – | 0.00 | 0.37 | 0.36 | 8.87 | 0.16 | 54.24 | 24.6 |
| 20 | PG 1011040 | 0.06 | HDD | 0.75 | 0.42 | 0.39 | 0.60 | 0.47 | 2.31 | 4.8 |
| 21 | PG 1012+008 | 0.19 | – | 0.00 | 0.50 | 0.48 | 3.76 | 0.24 | 20.82 | 15.6 |
| 22 | PG 1022+519 | 0.05 | HDD? | 0.63 | 0.61 | 0.58 | 0.30 | 0.65 | 0.77 | 3.3 |
| 23 | PG 1048+342 | 0.17 | – | 0.00 | 0.56 | 0.54 | 2.05 | 0.43 | 8.53 | 15.2 |
| 24 | PG 1048090 | 0.34 | WDD | 1.00 | 0.00 | 0.00 | 6.08 | 0.06 | 41.46 | 6.7 |
| 25 | PG 1049005 | 0.36 | – | 0.00 | 0.00 | 0.00 | 30.49 | 0.31 | 152.93 | 164.0 |
| 26 | PG 1100+772 | 0.31 | HDD | 0.67 | 0.00 | 0.00 | 11.87 | 0.32 | 58.76 | 65.7 |
| 27 | PG 1103006 | 0.43 | – | 0.00 | 0.10 | 0.11 | 13.13 | 0.00 | 95.56 | 0.0 |
| 28 | PG 1114+445 | 0.14 | – | 0.00 | 0.05 | 0.04 | 4.04 | 0.03 | 28.58 | 2.0 |
| 29 | PG 1115+407 | 0.15 | HDD | 0.71 | 0.04 | 0.04 | 3.70 | 0.60 | 10.81 | 38.3 |
| 30 | PG 1116+215 | 0.18 | WDD | 1.00 | 0.00 | 0.00 | 7.23 | 0.00 | 52.60 | 0.0 |
| 31 | PG 1119+120 | 0.05 | – | 0.00 | 0.43 | 0.37 | 0.90 | 0.40 | 3.96 | 6.2 |
| 32 | PG 1121+422 | 0.23 | HDD | 1.00 | 0.00 | 0.00 | 1.73 | 0.00 | 12.62 | 0.0 |
| 33 | PG 1126041 | 0.06 | – | 0.00 | 0.48 | 0.42 | 1.76 | 0.34 | 8.46 | 10.4 |
| 34 | PG 1149110 | 0.05 | – | 0.00 | 0.82 | 0.78 | 0.53 | 0.56 | 1.69 | 5.2 |
| 35 | PG 1151+117 | 0.18 | – | 0.00 | 0.27 | 0.25 | 1.77 | 0.00 | 12.85 | 0.0 |
| 36 | PG 1202+281 | 0.17 | – | 0.00 | 0.01 | 0.01 | 3.36 | 0.26 | 18.10 | 15.2 |
| 37 | PG 1211+143 | 0.09 | – | 0.00 | 0.22 | 0.18 | 2.57 | 0.00 | 18.72 | 0.0 |
| 38 | PG 1216+069 | 0.33 | HDD | 1.00 | 0.13 | 0.14 | 5.55 | 0.00 | 40.38 | 0.0 |
| 39 | PG 1226+023 | 0.16 | WDD | 1.00 | 0.00 | 0.00 | 30.11 | 0.21 | 173.72 | 108.0 |
| 40 | PG 1229+204 | 0.06 | – | 0.00 | 0.61 | 0.56 | 0.90 | 0.29 | 4.66 | 4.5 |
| 41 | PG 1244+026 | 0.05 | – | 0.00 | 0.31 | 0.26 | 0.37 | 0.42 | 1.53 | 2.7 |
| 42 | PG 1259+593 | 0.47 | WDD | 1.00 | 0.00 | 0.00 | 16.16 | 0.00 | 117.63 | 0.0 |
| 43 | PG 1302102 | 0.29 | HDD | 0.76 | 0.00 | 0.00 | 14.82 | 0.33 | 72.63 | 83.7 |
| 44 | PG 1307+085 | 0.16 | HDD | 0.00 | 0.26 | 0.23 | 2.79 | 0.01 | 20.18 | 0.3 |
| 45 | PG 1309+355 | 0.18 | – | 0.00 | 0.19 | 0.18 | 5.47 | 0.12 | 34.95 | 11.5 |
| 46 | PG 1310108 | 0.04 | – | 0.00 | 0.45 | 0.37 | 0.20 | 0.20 | 1.18 | 0.7 |
| 47 | PG 1322+659 | 0.17 | – | 0.00 | 0.21 | 0.19 | 3.53 | 0.28 | 18.65 | 16.8 |
| 48 | PG 1341+258 | 0.09 | HDD? | 0.43 | 0.56 | 0.53 | 0.62 | 0.35 | 2.95 | 3.7 |
| 49 | PG 1351+236 | 0.05 | – | 0.00 | 0.89 | 0.86 | 0.63 | 0.79 | 0.98 | 8.6 |
| 50 | PG 1351+640 | 0.09 | – | 0.00 | 0.06 | 0.04 | 4.55 | 0.35 | 21.64 | 27.2 |
| 51 | PG 1352+183 | 0.16 | – | 0.00 | 0.31 | 0.29 | 1.63 | 0.00 | 11.84 | 0.0 |
| 52 | PG 1354+213 | 0.30 | – | 0.00 | 0.00 | 0.00 | 5.65 | 0.19 | 33.33 | 18.6 |
| 53 | PG 1402+261 | 0.16 | – | 0.00 | 0.00 | 0.00 | 6.79 | 0.24 | 37.39 | 28.6 |
| 54 | PG 1404+226 | 0.10 | HDD? | 0.49 | 0.38 | 0.34 | 0.64 | 0.33 | 3.11 | 3.6 |
| 55 | PG 1411+442 | 0.09 | – | 0.00 | 0.46 | 0.40 | 2.06 | 0.03 | 14.58 | 1.0 |
| 56 | PG 1415+451 | 0.11 | – | 0.00 | 0.64 | 0.61 | 1.61 | 0.34 | 7.69 | 9.5 |
| 57 | PG 1416129 | 0.13 | – | 0.00 | 0.36 | 0.32 | 0.89 | 0.16 | 5.46 | 2.4 |
| 58 | PG 1425+267 | 0.37 | – | 0.00 | 0.14 | 0.14 | 13.00 | 0.21 | 75.05 | 46.5 |
| 59 | PG 1426+015 | 0.09 | – | 0.00 | 0.46 | 0.40 | 2.86 | 0.18 | 17.18 | 8.7 |
| 60 | PG 1427+480 | 0.22 | – | 0.00 | 0.19 | 0.18 | 3.94 | 0.32 | 19.40 | 22.0 |
| 61 | PG 1435067 | 0.13 | HDD | 0.67 | 0.03 | 0.03 | 1.14 | 0.02 | 8.07 | 0.5 |
| 62 | PG 1440+356 | 0.08 | – | 0.00 | 0.58 | 0.53 | 2.92 | 0.50 | 10.64 | 25.2 |
| 63 | PG 1444+407 | 0.27 | – | 0.00 | 0.01 | 0.01 | 9.36 | 0.07 | 63.43 | 11.2 |
| 64 | PG 1448+273 | 0.06 | – | 0.00 | 0.63 | 0.57 | 0.74 | 0.31 | 3.75 | 3.9 |
| 65 | PG 1501+106 | 0.04 | – | 0.00 | 0.44 | 0.37 | 0.67 | 0.30 | 3.41 | 3.5 |
| 66 | PG 1512+370 | 0.37 | – | 0.00 | 0.05 | 0.05 | 9.43 | 0.03 | 66.95 | 4.1 |
| 67 | PG 1519+226 | 0.14 | – | 0.00 | 0.07 | 0.06 | 2.37 | 0.15 | 14.67 | 6.2 |
| 68 | PG 1534+580 | 0.03 | – | 0.00 | 0.55 | 0.48 | 0.22 | 0.24 | 1.24 | 0.9 |
| 69 | PG 1535+547 | 0.04 | – | 0.00 | 0.37 | 0.29 | 0.18 | 0.16 | 1.10 | 0.5 |
| 70 | PG 1543+489 | 0.40 | – | 0.00 | 0.00 | 0.00 | 41.26 | 0.45 | 165.92 | 319.3 |
| 71 | PG 1545+210 | 0.27 | WDD | 1.00 | 0.19 | 0.19 | 4.17 | 0.00 | 30.29 | 0.1 |
| 72 | PG 1552+085 | 0.12 | HDD? | 0.67 | 0.25 | 0.22 | 0.86 | 0.11 | 5.51 | 1.7 |
| 73 | PG 1612+261 | 0.13 | – | 0.00 | 0.17 | 0.15 | 3.47 | 0.40 | 15.15 | 24.1 |
| 74 | PG 1613+658 | 0.13 | – | 0.00 | 0.56 | 0.52 | 8.49 | 0.42 | 35.89 | 61.6 |
| 75 | PG 1617+175 | 0.11 | WDD | 1.00 | 0.00 | 0.00 | 1.19 | 0.05 | 8.28 | 1.0 |
| 76 | PG 1626+554 | 0.13 | HDD | 1.00 | 0.03 | 0.02 | 0.77 | 0.00 | 5.61 | 0.0 |
| 77 | PG 1700+518 | 0.28 | – | 0.00 | 0.09 | 0.09 | 33.94 | 0.26 | 181.59 | 155.5 |
| 78 | PG 1704+608 | 0.37 | – | 0.00 | 0.25 | 0.26 | 32.05 | 0.19 | 189.74 | 103.5 |
| 79 | PG 2112+059 | 0.47 | – | 0.00 | 0.20 | 0.21 | 37.35 | 0.05 | 257.26 | 34.8 |
| 80 | PG 2130+099 | 0.06 | – | 0.00 | 0.34 | 0.29 | 1.99 | 0.25 | 10.92 | 8.5 |
| 81 | PG 2209+184 | 0.07 | HDD? | 0.80 | 0.72 | 0.70 | 0.37 | 0.43 | 1.54 | 2.8 |
| 82 | PG 2214+139 | 0.07 | WDD | 1.00 | 0.52 | 0.47 | 0.74 | 0.13 | 4.68 | 1.6 |
| 83 | PG 2233+134 | 0.32 | – | 0.00 | 0.00 | 0.00 | 11.03 | 0.11 | 71.29 | 21.3 |
| 84 | PG 2251+113 | 0.32 | WDD | 1.00 | 0.37 | 0.37 | 7.24 | 0.07 | 49.18 | 8.3 |
| 85 | PG 2304+042 | 0.04 | – | 0.00 | 0.91 | 0.89 | 0.07 | 0.02 | 0.51 | 0.0 |
| 86 | PG 2308+098 | 0.43 | HDD | 0.88 | 0.00 | 0.00 | 9.22 | 0.00 | 67.13 | 0.0 |
Note. — Column (2): object name; column (3): redshift; column (4): identification of HDD and WDD; column (5): the relative contribution of the HDD template (for HDD quasars) or the WDD template (for WDD quasars) to the AGN emission at rest-frame 1.25; column (6): the contribution fraction of the stellar template to the total quasar emission at rest-frame 1.25; column (7): the host galaxy contribution to the total quasar light in observed band from SED decomposition; column (8): the total infrared luminosity (8-1000 ) of the object; column (9): the host SF template fraction for ; column (10): the bolometric luminosity of the AGN. We adopted for all the quasars; column (11): the derived star formation rate based on following the Kennicutt (1998) star-formation law.
5.1. Quality of the SED Reproduction
The optical-to-far-IR SEDs of most PG quasars studied in this work have been well reproduced by our model. The fitting residuals of the 0.5-100 SEDs of all 87 quasars are less than 0.3 dex (see the residual panels in Figure 5). For nearly all cases where the far-IR emission is strong, the fit selected a host galaxy template of luminosity - as expected. The fitted extinction levels are small, usually zero. In 72 of the 87 cases the reduced is 3 and only 11 have . The HDD template is required by 20 quasars to best reproduce the SED. Twelve quasars required the WDD template to be included in the model. We comment on the fitted SEDs and discuss some notable discrepancies between observations and model results below.
In the optical/UV bands, a few quasars show broadband excess emission if we normalize the model SED to the observed near-IR data points (e.g., PG 0003+158 and PG 0049+171). This behavior can be explained by contamination from AGN optical variability or the emission of young stellar populations in the AGN host galaxies. As shown in Giveon et al. (1999), the most variable quasars become bluer when they are brighter. For the second possibility, even a relatively small population of young stars can change the color of the host galaxy since their emitting power is very strong. In the UV band (0.1-0.3 ), we see some moderate flux excess above the AGN templates in a few cases (e.g., PG 0921+525), which might arise from UV emission by very young stars.
With the combination of the normal, WDD, and HDD AGN templates with a stellar template, the near-IR to mid-IR SEDs of all quasars are reasonably reproduced. The template selections for some quasars (e.g., PG 1001+054 and PG 2251+113) are ambiguous, since some transition among these three populations of AGN are possible. Notably, PG 0157+001 has an exceptionally strong mid- to far-IR excess (20-100). PG 0923+129 and PG 1613+658 also show warm excess with a moderate strength. We will discuss these quasars later.
The far-IR SEDs of most quasars are fitted with our model, suggesting that their dust emissivities lie between normal galaxies (=0.7-1, Rieke et al. 2009) and typical AGNs (=1.5 for large grains, as assumed in Xu et al. 2015 and this work). However, we find 12 quasars that show a much slower drop of the far-IR emission: PG 0003+199, PG 0007+106, PG 0947+396, PG 0953+414, PG 1116+215, PG 1211+143, PG 1302102, PG 1341+258, PG 1411+442, PG 1426+015, PG 1535+547, and PG 2214+139. Only two of them – PG 1211+143 and PG 1302102 – are radio-loud, in which case synchrotron emission may have a substantial influence on the far-IR slope. The reasons for the different dust emissivity of the other quasars are unknown.
5.2. Identification of the HDD and WDD Quasars
Based on the SED decomposition with different AGN templates, we identify 13 confirmed HDD quasars and another 7 candidate HDD quasars. For the 10 confirmed HDD quasars with image decomposition results, the stellar contribution in the observed -band is less than 30%. The of the fit with the HDD template is at least a factor of two better than that with the normal AGN template only (see Table 3). Additionally, the HDD template model fits yield stellar near-IR contributions roughly consistent with the image decomposition results. For another four HDD quasars without image decomposition data, the host galaxy contamination is low. According to our fits, the near-IR AGN luminosities of these quasars are mainly contributed () by the HDD AGN component, suggesting the dominant HDD behavior. In addition, they have the same blue optical colors as the pure AGN template. Besides PG 1011+772, all the confirmed HDD quasars have not been resolved in 2MASS images, suggesting their weak host galaxy contamination in the near-IR. For PG 1011+772, we confirmed its HDD character because of a strong deficiency (with the peak discrepancy 0.3 dex) of the near- to mid-IR emission if the normal AGN template is used.
The identifications of hot dust deficiency are less secure for the HDD candidate quasars. We show the comparison of fitting results with various AGN templates in Figure 6. For PG 0043+039, PG 0844+349, PG 1341+258, and PG 1404+226, the mid- to far-IR SEDs are better produced by the introduction of the HDD AGN template with reduced values. However, the host galaxy contribution in the near-IR seems to be strong (30-50%), and these four quasars present relatively flat slopes in the optical. For PG 1022+519, PG 1552+085, and PG 2209+184, their dust deficiency is revealed by the overestimated mid-IR emission from the normal AGN template, however, whether they should be picked as HDD or WDD quasars is a question. Consequently, we suggest the HDD quasar fraction in this PG sample is 15%-23%.
The number of identified WDD quasars in the PG sample is 15 with 12 confirmed cases and three candidates. All confirmed WDD quasars show weak mid-infrared emission and a clear hot dust emission peak at 3 . As stated below, there are three HDD candidates that may be WDD candidates as well. Given these numbers, we estimate the WDD quasar fraction in the PG sample 14-17%.
| ID | Source | Reference | Extended? | |||
|---|---|---|---|---|---|---|
| (1) | (2) | (3) | (4) | (5) | (6) | (7) |
| HDD Quasars | ||||||
| 0 | 0003+158 | 0.45 | – (1.00) | 0 | N | 1.8 (13.2) |
| 3 | 0026+129* | 0.14 | 0.80 (0.64) | 1 | N | 1.5 (22.2) |
| 5 | 0049+171* | 0.06 | – (1.00) | – | N | 9.4 (53.1) |
| 7 | 0052+251 | 0.16 | – (0.91) | – | N | 2.7 (11.3) |
| 20 | 1011040 | 0.06 | – (0.61) | – | Y | 10.7 (34.1) |
| 26 | 1100+772 | 0.31 | 0.78 (1.00) | 4 | N | 0.3 (4.5) |
| 29 | 1115+407 | 0.15 | – (0.96) | – | N | 3.1 (12.2) |
| 32 | 1121+422* | 0.23 | 0.93 (1.00) | 2 | N | 0.4 (11.1) |
| 38 | 1216+069 | 0.33 | 0.91 (0.95) | 4 | N | 1.2 (15.7) |
| 43 | 1302102 | 0.29 | 0.81 (1.00) | 1 | N | 10.9 (20.3) |
| 61 | 1435067 | 0.13 | 0.73 (0.97) | 1 | N | 0.4 (6.6) |
| 76 | 1626+544* | 0.13 | 0.72 (0.98) | 1 | N | 0.5 (10.8) |
| 86 | 2308+098 | 0.43 | – (0.87) | – | N | 0.5 (5.2) |
| 4 | 0043+039? | 0.38 | – (0.92) | – | N | 0.32 (0.62) |
| 11 | 0844+349? | 0.06 | 0.40 (0.40) | 1 | N | 7.00 (12.6) |
| 22 | 1022+519? | 0.05 | – (0.32) | – | Y | 0.7 (2.8) |
| 48 | 1341+258? | 0.09 | – (0.47) | – | Y | 0.6 (1.2) |
| 54 | 1404+226? | 0.10 | – (0.66) | – | Y | 0.4 (1.2) |
| 72 | 1552+085? | 0.12 | – (0.29) | – | N | 0.3 (1.4) |
| 81 | 2209+184? | 0.07 | – (0.75) | – | Y | 1.5 (7.0) |
| WDD Quasars | ||||||
| 9 | 0804+761* | 0.11 | 0.90 (1.00) | 3 | N | 18.7 (152.8) |
| 13 | 0923+201* | 0.19 | 0.77 (1.00) | 1 | N | 2.5 (16.9) |
| 17 | 0953+414 | 0.24 | – (1.00) | – | N | 16.3 (18.5) |
| 24 | 1048090 | 0.34 | – (1.00) | – | N | 2.7 (5.2) |
| 30 | 1116+215* | 0.18 | 0.95 (1.00) | 1 | N | 46.0 (171.7) |
| 39 | 1226+023 | 0.16 | – (1.00) | – | Y | 947.4 (1740.6) |
| 42 | 1259+593 | 0.47 | 0.94 (1.00) | 4 | N | 1.4 (8.4) |
| 69 | 1535+547 | 0.04 | – (0.37) | – | Y | 2.1 (5.2) |
| 71 | 1545+210 | 0.27 | – (0.81) | – | N | 3.5 (9.6) |
| 75 | 1617+175* | 0.11 | 0.89 (1.00) | 1 | N | 2.6 (63.4) |
| 82 | 2214+139 | 0.07 | 0.47 (0.63) | 1 | Y | 2.1 (37.6 |
| 84 | 2251+113 | 0.32 | 0.94 (0.66) | 1 | N | 1.0 (3.6) |
| 22 | 1022+519? | 0.05 | – (0.61) | – | Y | 0.6 (2.8) |
| 72 | 1552+085? | 0.12 | – (0.41) | – | N | 0.4 (1.4) |
| 81 | 2209+184? | 0.07 | – (0.72) | – | Y | 1.2 (7.0) |
Note. — Column (1): object id; column (2): object name (“PG” is omitted). We denote the ambiguous cases with “?”, and the quasars used to derive the template with ‘*’. ; column (3): redshift; column (4): the contribution of PSF component in the observed band from the HST image decomposition with the same quantity based on the SED decomposition in the brackets; column (5): references for HST image decomposition results: 1-Veilleux et al. (2009); 2-McLeod & McLeod (2001); 3-Guyon et al. (2006); 4-Shang et al. (2011); column (6): whether the object is picked out as an extended source by 2MASS; column (7): the values for data points in the rest-frame 0.5-30 range, the numbers outside and inside the brackets corresponding to the fitting with the dust-deficient template and the fitting with the classical AGN template only.

5.3. Host Galaxy Contamination
To test if the three SED templates introduced in Section 3 are convincing representatives for the infrared emission coming from the AGN component in these PG quasars, we compare the strength of the AGN host galaxy emission deduced from the SED decomposition with that from other independent methods.
5.3.1 Near-IR Stellar Emission
Detailed morphology decomposition of quasars can be applied on deep and high-resolution image observations in the near-IR (e.g., McLeod & McLeod, 2001; Guyon et al., 2006; Veilleux et al., 2009). By comparing the magnitudes of the AGN and the host components, we can calculate the host galaxy fraction at given bands. A similar host galaxy fraction can also be derived from the SED decomposition model. We can compare the host galaxy fractions from these two methods to check the validity of our model.
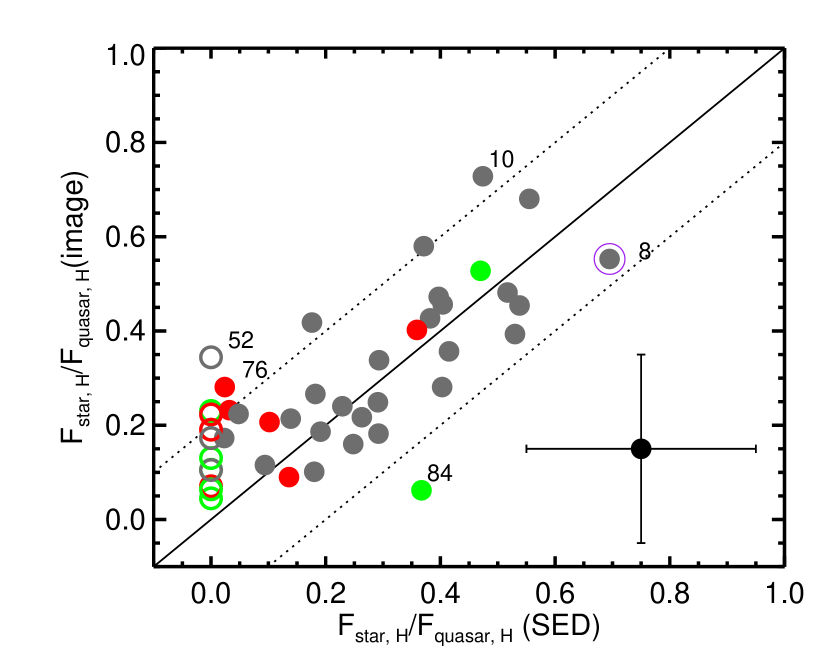
Based on the SED decomposition, we computed the host galaxy contribution to the total quasar emission in the observed frame -band, . Figure 7 shows the comparison of the literature results on the host light fraction of 44 PG quasars retrieved from HST/ground-AO image decomposition (McLeod & McLeod, 2001; Hamilton et al., 2002; Marble et al., 2003; Guyon et al., 2006; Hamilton et al., 2008; Veilleux et al., 2009)555See Zhang et al. (2016) for a summary of the image decomposition results of PG quasars in the literature. with our results based on the SED model. For the majority of these quasars, the host galaxy contributions derived from the SED decomposition and image decomposition are consistent, with an offset of less than 20%.
However, it seems the correlation disappears in the bottom-left corner of Figure 7: when the relative contribution of the near-IR stellar light is small (as indicated by the low values from image decomposition), our SED model underestimated – or even failed to identify – the host galaxy emission compared with the HST image decomposition. This is a known systematic bias of such SED models (see Section 5.3.1 in Xu et al. 2015). Meanwhile, we note that the image decomposition technique suffers a number of systematics. For example, Kim et al. (2008) found that the flux of the host galaxy can be easily overestimated from image decompositions when due to realistic PSF mismatches. It is likely that the systematics and uncertainties present in both AGN-host decomposition methods contribute to the discrepancies. However, the cases with weak host stellar emission are also the ones where the identification of HDD behavior is least likely affected.
Given the fact that our SED decomposition gives consistent results on the near-IR host stellar contamination with that based on the 2D image decompositions, the stellar emission contribution is not likely to lead to any incorrect identifications of HDD or WDD quasars.
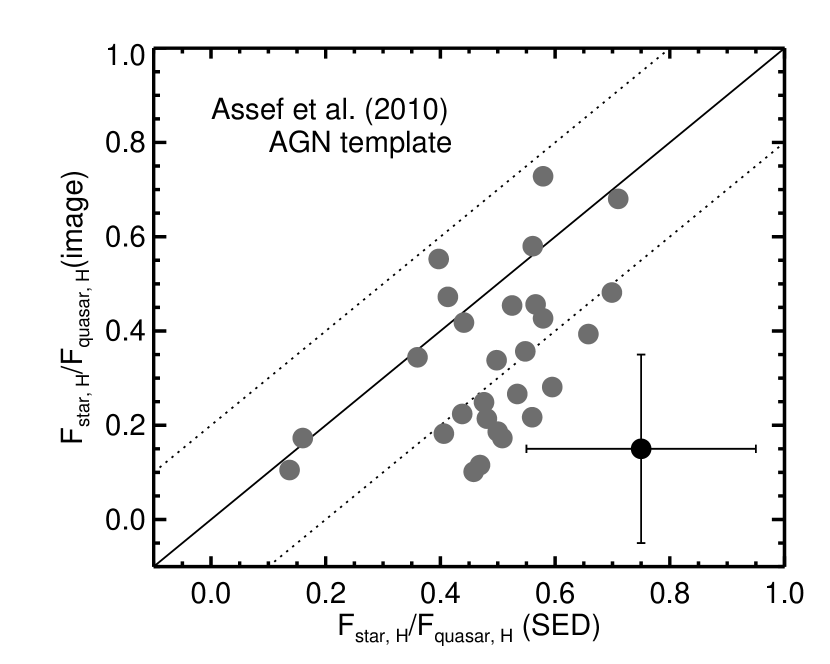
With the -band image decomposition results for 28 normal PG quasars, we can also test the validity of the Assef et al. (2010) AGN template to represent the AGN emission. In Figure 8, we compare the relative observed-frame -band stellar emission strength derived from the SED model with the Assef et al. (2010) AGN template with the image decomposition results. It is clear that the Assef et al. (2010) template model overestimates the stellar contamination for these quasars, suggesting that the much stronger 1 dip of the Assef et al. (2010) is unphysical. In other words, the Elvis et al. (1994)-like templates are preferred over the Assef et al. (2010) template to represent the AGN intrinsic near-IR emission of normal quasars.
5.3.2 Mid- to Far-IR Dust Emission
The bolometric infrared luminosity of a galaxy is believed to be dominated by the dust thermal emission heated by hot, young stars, providing a measure of the SFR (e.g., Kennicutt, 1998). To calibrate the infrared emission of the quasar host galaxies, we can compare the SFRs based on the IR luminosities of the host galaxies from the SED decompositions with the SFRs based on another independent method. For quasars, the aromatic feature is perhaps the only plausible spectroscopic star formation indicator where the AGN influence is negligible (Diamond-Stanic & Rieke, 2010; Esquej et al., 2014; Alonso-Herrero et al., 2014). Assuming the Kennicutt (1998) law, we compare the IR-derived SFRs with the SFR measurements based on the aromatic feature strength by Shi et al. (2014) in Figure 9. The SFR results for the majority of PG quasars are consistent666Among the three outlier quasars, PG 1216+069 (#38) and PG 2308+098 (#86) have low signal-to-noise spectra, which make the spectral measurements uncertain. PG 1259+593 (#42) shows a very broad and prominent silicate feature. The two Gaussian functions used to fit the silicate profile are widely separated, producing a local dip at (see the online Figure 1 of Shi et al. 2014) that is unphysical. As a result, for PG 1258+593, the equivalent width of the 11.3 aromatic feature above such a silicate feature continuum could be overestimated.. There is an indication that the SFRs based on the aromatic feature are lower than the IR-derived SFRs when the SFRs are low (e.g., SFR). This could be due to (1) the difficulty of measuring the aromatic features when the AGN dominates the Spitzer/IRS infrared spectra; (2) that the aromatic feature strength is reduced by the prominent AGN emission in luminous quasars; (3) the possible dust far-IR emission heated by old stars (e.g., Devereux & Eales, 1989; Popescu et al., 2002) in quasar host galaxies. Nevertheless, for the science goals of this paper, such deviations are only a secondary effect. At high SFRs, where the fits are best-constrained, there is no evidence for such a shift in the calibration. Thus, we suggest the infrared emission of the host galaxies is properly retrieved from our model.
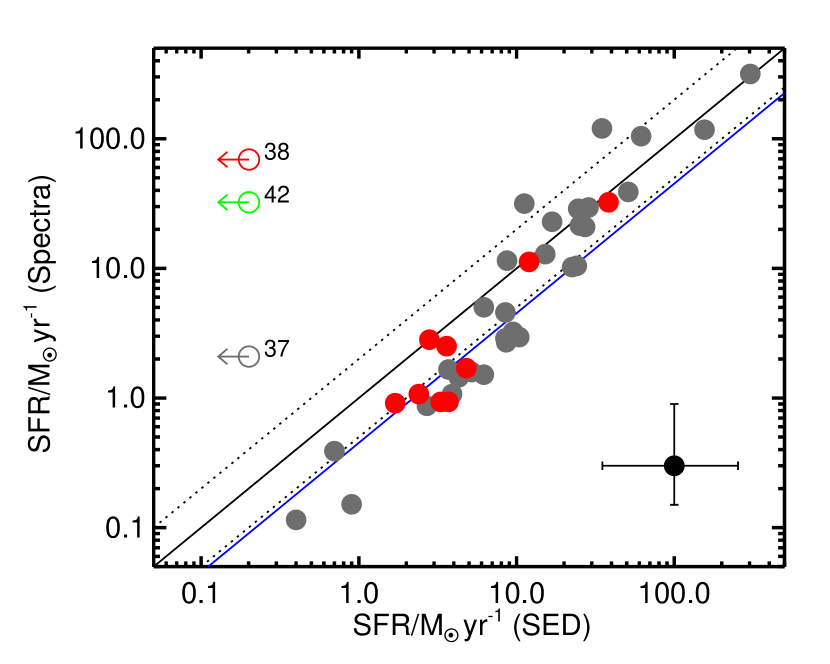
The consistent SFR results with both of the methods in Figure 9 show that both the WDD and normal AGN templates are being applied appropriately. For the same near-IR luminosities, the WDD AGN template produces of the total infrared luminosity (8-1000) of the normal AGN template. As there is no necessity to shift the positions of the normal quasars to match the 1:1 line in Figure 9, we can conclude that the WDD template is not the best choice to represent the intrinsic IR emission of normal quasars.
6. Discussion
6.1. The Diversity of Infrared Colors of PG Quasars
With the three AGN templates (Section 3) and our SED model (Section 4), we can explain the diversity of the near- to mid-IR colors of the PG quasars. For a normal AGN, the infrared SED is characterized by a quick upturn from the inflection and a broad mid-infrared plateau in - space from 3-20 . The relative strengths of these SED features can be found by normalizing the corresponding peak flux by the flux at the inflection. As shown in Figure 2, a 0.3 dex deviation from the classical AGN template starts at for the HDD templates and at for the WDD template. As a result, we propose to use luminosities at 3.0 and to reflect the relative strengths of the hot and warm dust. For the Elvis template, we have
-
•
intrinsic hot dust peak:
-
•
intrinsic warm dust peak:
We derive the observed quasar SED continuum by logarithmic interpolation on the UV-to-IR photometry and calculate the corresponding color , and . In Figure 10, we present the color distribution of all 87 PG quasars as well as their individual continuum SEDs.
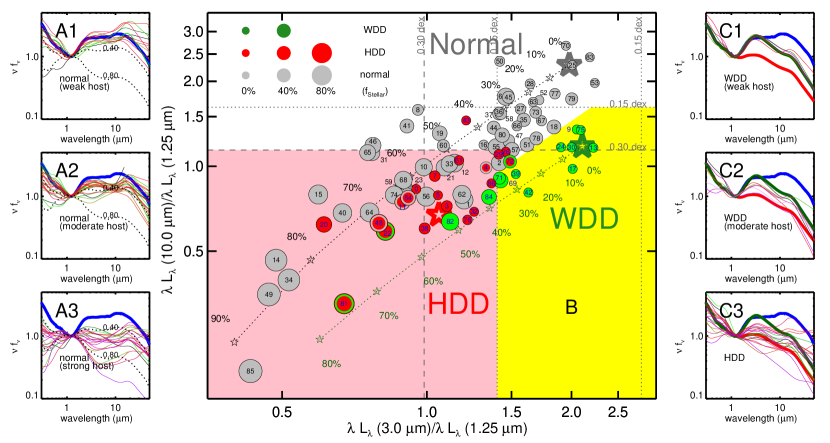
The most obvious feature of panel B in Figure 10 is that most quasars are distributed along the diagonal direction with changes of both apparent hot and warm dust emission. Such a diagonal distribution is mainly caused by the increasing near-IR contamination from the host stellar emission. For a normal quasar, as the host galaxy contribution increases, the position in Figure 10 is shifted to the lower left corner. To demonstrate this, we combine the normal (Elvis) AGN template with a single old stellar population template, and calculate the colors of the composite SED as a function of the galaxy contribution in the near-IR (shown as small five-pointed stars connected with the dotted gray line in Figure 10). As expected, all normal quasars are randomly distributed along this normal quasar color line, and their galaxy contributions in the near-IR from the individual SED decompositions are roughly consistent with the model line. From panels A1, A2, to A3, as the apparent warm dust emission decreases, we see a systematic decrease of the optical slope for the normal quasars. The observed SEDs in these panels are also roughly consistent with the mock quasar SEDs using a combination of the normal AGN template and old stellar template with different relative strengths.
As Figure 10 shows, the colors of the HDD PG quasars typically deviate from the Elvis template by more than dex for and dex for (see Figure 2). Thus, we denote an HDD region in Figure 10 as
-
•
apparent hot dust strength:
-
•
apparent warm dust strength:
A large number of normal quasars are also located in the HDD region. The cause of this contamination can be identified from Panels C3 and A3. HDD quasars have a blue UV-optical continuum similar to the AGN template, while normal quasars in the same region show strong galaxy contamination in the optical and near-IR.
In the lower-right region of Figure 10 are the WDD quasars, with the color within dex of the classical AGN, but deviation greater than 0.15 dex. We can define a WDD region, where
-
•
apparent hot dust strength:
-
•
apparent warm dust strength:
-
•
diagonal direction cut:
The third cut along the diagonal direction is based on the mock SED mixing galaxy and AGN templates. The contamination of normal quasars in this WDD region is quite low. We also see an increasing host galaxy contribution along the diagonal direction in the central panel, consistent with the prediction from the mock SEDs composed of the WDD template and a near-IR stellar template. The increasing host contribution among WDD quasars can also be seen in panel C1 ( dex of the Elvis template) and panel C2 ( dex of the Elvis template), for which the decrease of apparent warm dust emission is caused by the stronger host galaxy contamination at . This behavior emphasizes the risk of host galaxy contamination in any purely photometric means to identify HDD quasars. However, it appears that such simple methods may work reasonably well for WDD objects, though there is still a mixture of normal quasars in their color space in the figure.
Broad IR spectral features may also influence the infrared colors of quasars. On average, type 1 quasars have moderate silicate emission at with strength777 The silicate strength is defined as where is the wavelength of the 10 silicate feature peak, and are the corresponding observed and continuum intensities, respectively. 0.20 (e.g., Hao et al., 2007), which corresponds to 0.08 dex of the local continuum. This is much smaller compared to the dex difference we picked to separate the HDD quasars. However, for individual quasars, the 10 silicate feature strength can be very large, in which cases its influence should be considered.
A number of normal quasars above the normal quasar color line present a smooth SED gradually peaked at the mid-infrared, e.g., PG 0157+001, PG 0934+013, PG 1119+120, PG 1244+026, PG 1310108, PG 1351+640, PG 1501+106. Our best fitted model underpredicts the emission at 20-100, suggesting a warm excess. Similar behavior has also been found for type-1 AGN at 0.3-3 (Xu et al., 2015; Kirkpatrick et al., 2015) as well as the low-luminosity AGNs in nearby Seyfert galaxies (e.g., Ho, 1999, 2008; Prieto et al., 2010). One possibility to generate this component is a very compact (1 pc) starbursting disk in the nucleus of the galaxy (Thompson et al., 2005; Ballantyne, 2008). In most cases, our test fitting with an additional warm component following Xu et al. (2015) hardly improved the , suggesting that even if the warm-excesses are present, their contribution should be moderate. Another possibility is the additional IR-processed AGN emission by dust either in the galactic interstellar medium (e.g., Schneider et al., 2015; Roebuck et al., 2016) or in the polar region of the nucleus (e.g., Raban et al., 2009; Hönig et al., 2012, 2013; Tristram et al., 2014; Asmus et al., 2016; López-Gonzaga et al., 2016). For PG 0157+001, it could also be its strong shocks (e.g., Leipski et al., 2006), which may break up the surrounding dust into much smaller grains and boost the mid-IR emission.
6.2. Characteristics of the Dust-deficient PG Quasars
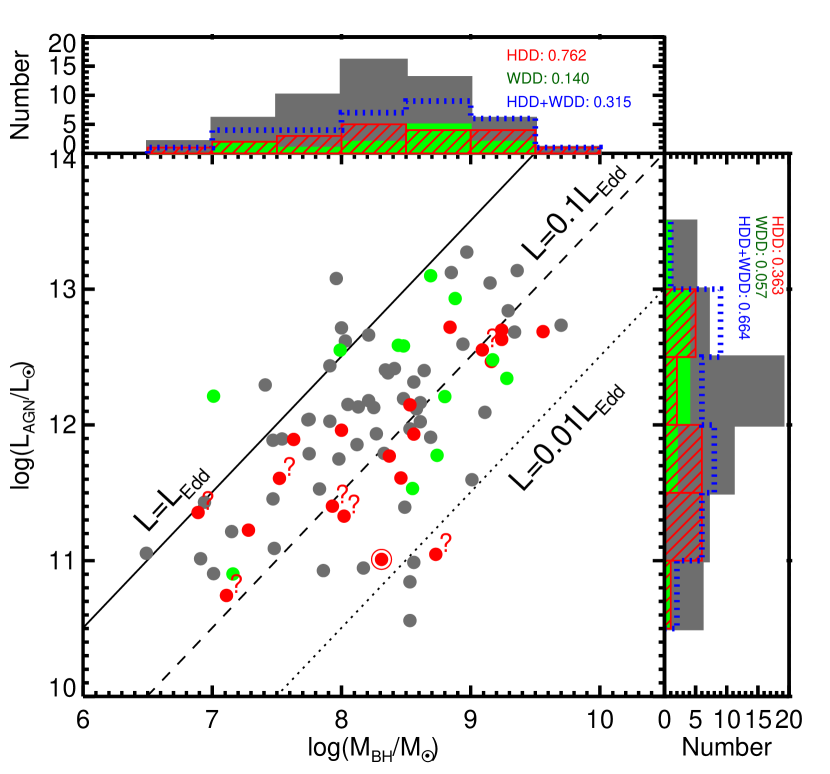
To judge if the dust-deficient population has special AGN properties, we compare the distributions of the black hole masses, AGN luminosities, as well as Eddington ratios between the dust-deficient quasars and normal quasars, as shown in Figure 11. We collect the black hole mass measurements from Peterson et al. (2004); Vestergaard & Peterson (2006), and Denney et al. (2010) with a virial factor from Woo et al. (2010). The AGN luminosities are derived from the AGN templates with the normalization from our SED decomposition results. Although the HDD population has identical luminous AGNs and massive black holes compared to the normal quasar population, its members have lower Eddington ratios () compared with normal quasars (=0.1-1). The Kolmogorov-Smirnov (K-S) test yields a probability of only that the Eddington ratios of the HDD quasars are drawn from the same distribution as those of normal quasars. Additionally, we note the most HDD PG quasar, PG 0049+171, has the lowest Eddington ratio among the confirmed HDD quasars. All these observations suggest the hot dust deficiency is possibly linked to the AGN Eddington ratio. Compared with normal quasars, the WDD quasars have higher AGN luminosities with a K-S probability of 0.057 that the parameter is drawn from the same distributions as for normal quasars. For both HDD and WDD quasar populations, their black hole masses do not show strong differences compared with the normal quasar population. We also explore if the dust deficiency is related to the quasar radio loudnesses, which was defined and measured by Kellermann et al. (1989). The fractions of radio-loud quasars among the HDD, WDD, and normal sample are quite similar (12%, 20%, 16%, respectively), suggesting the radio properties may not influence the dust deficiency.
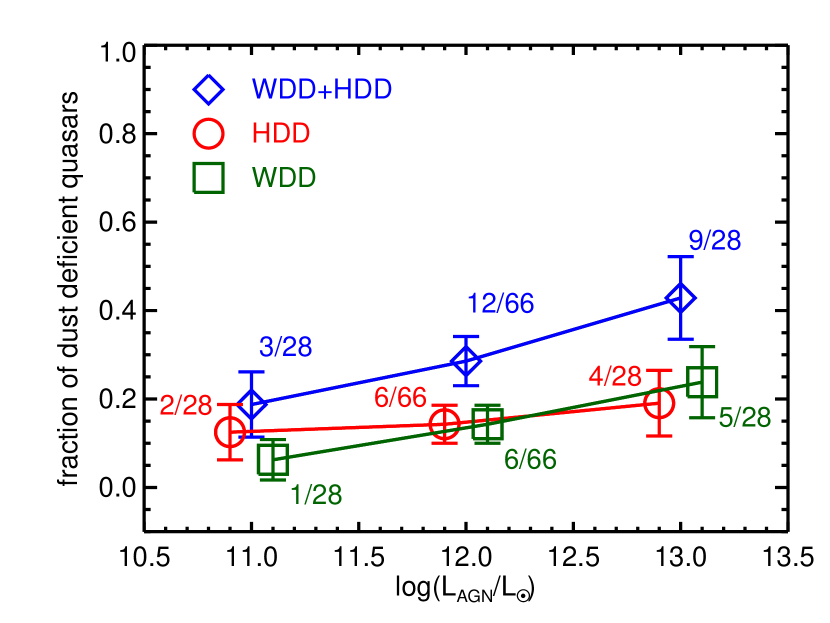
We now explore whether the fraction of dust-deficient quasars is dependent on AGN luminosity. In Figure 12, we show the number fraction of dust-deficient quasars compared with normal quasars in three luminosity bins, . The ambiguous cases for the HDD and WDD quasars are removed in the analysis. We can see the HDD quasar fraction is not sensitive to AGN luminosity, confirming similar conclusions reached by Hao et al. (2010, 2011) and Mor & Trakhtenbrot (2011). In contrast, the fraction of WDD quasars shows a clear boost with increasing AGN luminosity, which is generally consistent with the anti-correlation between the IR-optical luminosity ratio and AGN luminosity, as found by many authors (e.g., Maiolino et al., 2007; Roseboom et al., 2013; Mateos et al., 2016).
Results from previous studies on the relation between the hot dust deficiency and AGN properties are contradictory. Jiang et al. (2010); Jun & Im (2013) suggested that the quasars with weak hot dust emission tend to have relatively low black hole masses (), and high Eddington ratios. On the contrary, Hao et al. (2010); Mor & Trakhtenbrot (2011) argued that the hot-dust-poor quasars are identical to normal quasars in and . We firstly note that all these studies focus on the very luminous quasars, with Hao et al. (2010); Mor & Trakhtenbrot (2011); Jun & Im (2013) at and Jiang et al. (2010) at . As argued in Section 6.3, there is a bias toward more efficient dust-deficient quasar identification at higher AGN luminosity (also at higher redshift) using an optical-to-NIR color selection (e.g., Jiang et al. 2010; Jun & Im 2013). The AGN luminosities of the 87 PG quasars range from to . Since the Eddington ratios of AGN are positively correlated with their bolometric luminosities (e.g., Lusso et al., 2012), we are probing the dust deficiency in the weak accretion state of the black hole, different from previous studies.
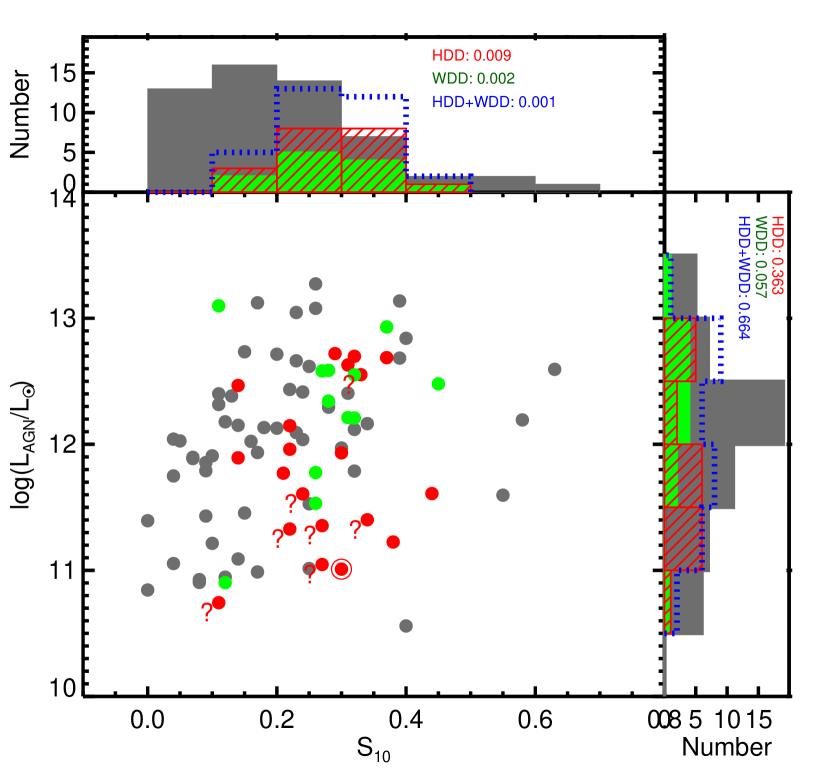
The silicate feature is an important diagnostic of the dust structure around the AGN. In Figure 13, we investigate the strength of this feature, , for different types of quasars compared with the AGN luminosity. The silicate measurements are adopted from Shi et al. (2014). We do not find any strong dependence of the silicate emission strength on the AGN luminosity, as seen by, e.g., Maiolino et al. (2007), which is possibly due to the limited dynamical range of the AGN luminosities of the PG sample. Meanwhile, the two dust-deficient populations peak at stronger silicate emission compared with the normal quasar population with K-S probabilities 0.01 of being drawn from the same distribution.
The K-S probabilities of the AGN properties discussed in this section are summarized in Table 4. We caution that the PG sample is known to be incomplete (e.g., Jester et al., 2005) and the sample size is relatively small. Statistical studies on a much larger sample with a similar rich set of multiband observations are needed to solidify these arguments.
against normal quasars
| Property | HDD | WDD | HDD+WDD |
|---|---|---|---|
| 0.363 | 0.057**We indicate significant differences in bold. | 0.664 | |
| 0.762 | 0.140 | 0.315 | |
| 0.025 | 0.688 | 0.074 | |
| 0.009 | 0.002 | 0.001 |
6.3. Are the High- Dust-deficient Quasars Abnormal
in Terms of Their SEDs?
6.3.1
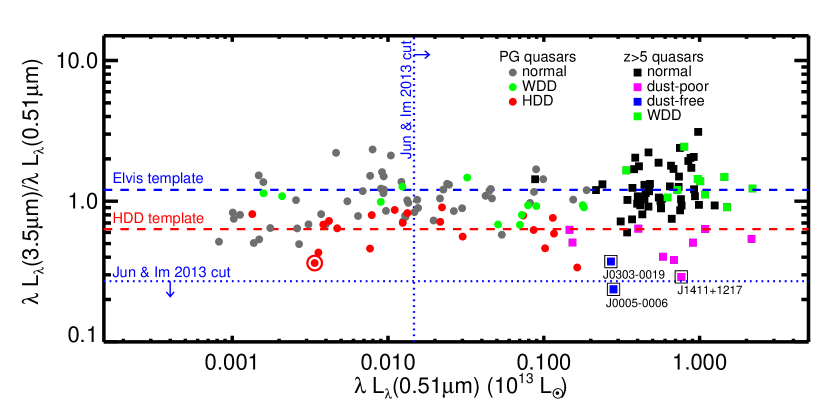
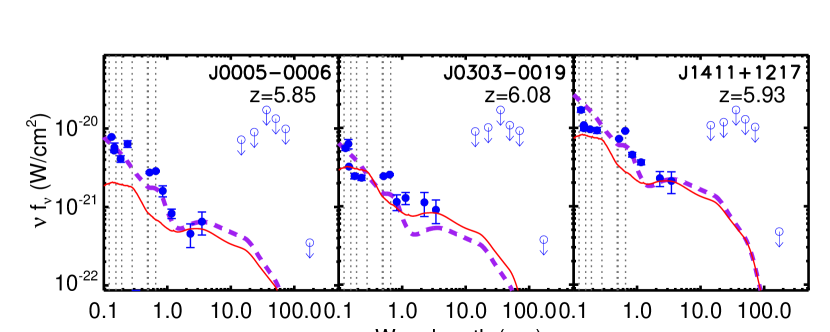
Jiang et al. (2010) suggested that the two quasars, J00050006 and J03030019, are dust-free due to their exceptionally low rest-frame to 5,100 Å luminosity ratios. In the upper panel of Figure 14, we plot the near-IR to optical ratios as a function of luminosity for the sample with the photometry data in Leipski et al. (2014) and the PG quasars. The 11 quasars with a dearth of hot dust emission (see Leipski et al. 2014, Lyu et al. 2016) are distributed around the value for the HDD AGN template. In the lower panel of the same figure, we compare the SEDs of three extreme cases: SDSS J00050006, SDSS J03030019, and SDSS J1411+1217, to the HDD AGN template as well as the SED of the most extreme HDD PG quasar PG 0049+171. We can see the SEDs of SDSS J00050006 and SDSS J1411+1217 are quite similar to that of PG 0049+171, suggesting that the latter could be a counterpart to the most dust-poor quasars at . Additionally, the Spitzer/IRAC band (rest-frame ) is possibly contaminated by the optical H and [N II] emission lines at , thus a very low rest-frame to ratio may result. Therefore, the overall SEDs of the hot-dust-free quasars resemble the HDD template, given the possible variation of the UV/optical slopes and emission line contaminations.
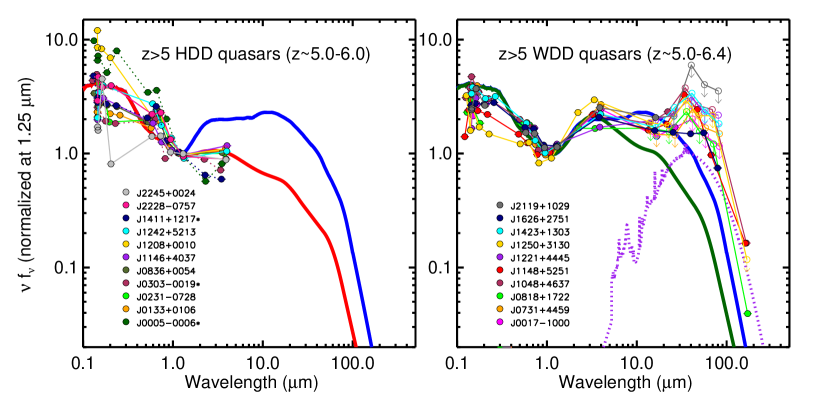
Besides the three extreme HDD quasars above, Leipski et al. (2014) also suggested another eight HDD candidates (see also Lyu et al. 2016), as listed in Table 5 . We show their rest-frame SEDs in the top-left panel of Figure 15. These quasar SEDs are matched by our HDD AGN template reasonably well. At , we also identified 10 WDD quasars from the Leipski et al. (2014) sample (as also listed in Table 5). Their SEDs present a strong near-IR hot dust emission bump but are weak in the mid-IR, as indicated by faint emission or even non-detections in the Herschel PACS bands (the top-right panel in Figure 15). As argued in Lyu et al. (2016), the host galaxies of these quasars are likely to have a strong contribution to the mid-IR SEDs, due to their low-metallicity and compact starbursting properties. We expect that the mid-IR emission contributed by the AGN is smaller than the rest-frame mid-IR data points indicate. The number fraction of the WDD quasars in Leipski et al. (2014) is .
| Source | Type | |
|---|---|---|
| (1) | (2) | (3) |
| quasars in Leipski et al. (2014) | ||
| SDSS J001714.67100055.4 | 5.01 | WDD |
| SDSS J073103.12+445949.4 | 5.01 | WDD |
| SDSS J081827.40+172251.8 | 6.00 | WDD |
| SDSS J104845.05+463718.3 | 6.23 | WDD |
| SDSS J114816.64+525150.3 | 6.43 | WDD |
| SDSS J122146.42+444528.0 | 5.19 | WDD |
| SDSS J125051.93+313021.9 | 6.13 | WDD |
| SDSS J142325.92+130300.7 | 5.08 | WDD |
| SDSS J162626.50+275132.4 | 5.30 | WDD |
| SDSS J211928.32+102906.6 | 5.18 | WDD |
| SDSS J000552.34000655.8* | 5.85 | HDD |
| SDSS J013326.84+010637.7 | 5.30 | HDD |
| SDSS J023137.65072854.5 | 5.41 | HDD |
| SDSS J030331.40001912.9* | 6.08 | HDD |
| SDSS J083643.85+005453.3 | 5.81 | HDD |
| SDSS J114657.79+403708.7 | 5.01 | HDD |
| SDSS J120823.82+001027.7 | 5.27 | HDD |
| SDSS J124247.91+521306.8 | 5.05 | HDD |
| SDSS J141111.29+121737.4* | 5.93 | HDD |
| SDSS J222845.14075755.2 | 5.14 | HDD |
| WFS J2245+0024 | 5.17 | HDD |
| AGN with MIPS Flux mJy in Xu et al. (2015) | ||
| LoCuSS J131107.34012857.9 | 0.92 | WDD |
| LoCuSS J164116.66+463946.3 | 1.13 | WDD |
| LoCuSS J163950.35+463327.1 | 2.09 | WDD |
| LoCuSS J024725.09033807.9 | 2.42 | WDD |
| LoCuSS J090021.93+210803.9 | 0.70 | HDD |
| LoCuSS J164025.01+464449.2 | 0.54 | HDD |
| LoCuSS J024851.43032249.3 | 0.30 | HDD |
| AGN with MIPS Flux mJy ** | ||
| LoCuSS J010720.40+005435.2 | 1.47 | HDD |
| LoCuSS J084218.48+362504.1 | 2.24 | HDD |
| LoCuSS J084258.80+361444.2 | 2.50 | HDD |
| LoCuSS J015208.74+010823.6 | 0.56 | HDD |
| LoCuSS J015202.95+010445.3 | 1.05 | HDD |
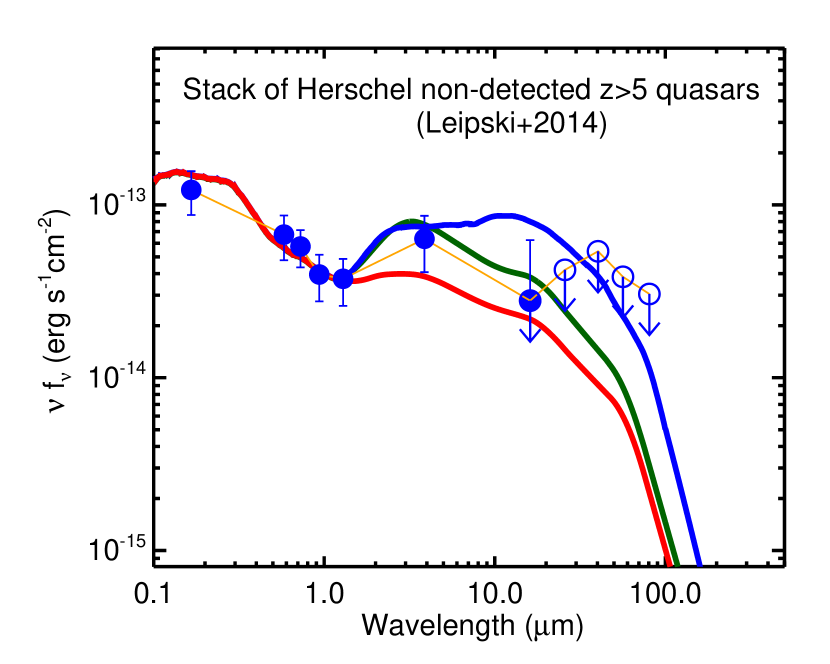
As shown by Leipski et al. (2014), the stacked SED of 33 Herschel non-detected quasars is not matched optimally with the classical AGN template (also see Lyu et al. 2016). With the AGN templates derived in this work, we find the average SED of the far-IR non-detected quasars lies between the WDD and HDD AGN templates, as seen in Figure 16. Combining our previous work (Lyu et al., 2016) with the discussion in this section, we can conclude that the SEDs of the luminous quasars at can be characterized by the normal AGN template, WDD template, and HDD template derived from the PG quasars. In other words, there is no indication of strong evolution of AGN infrared SEDs at .
6.3.2 0.5-2.5
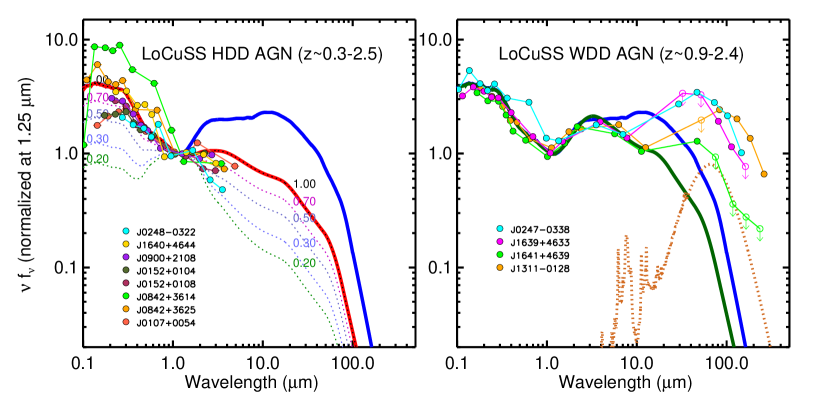
For the majority of AGNs with Spitzer/MIPS flux density mJy in the Local Cluster Substructure Survey (LoCuSS888http://www.sr.bham.ac.uk/locuss/), Xu et al. (2015) presented accurate decompositions with the same normal AGN template used in this work. We also searched for HDD and WDD quasars in this survey. Eight LoCuSS quasars with redshifts of 0.3-2.5 show indications of weak hot dust emission (see Table 5 and the bottom-left panel of Figure 15). Besides J084218.48+362504.1, all the rest of these LoCuSS HDD quasars are not detected by Herschel, indicating their weak far-IR emission. The variation of the SEDs of these quasars can be easily explained by adding an old stellar component to the HDD template. Thus we again confirm that similar HDD quasars are also seen at intermediate redshifts. We also find four WDD quasars at =0.9-2.4 in the LoCuSS type-1 AGN sample (see Table 5 and the bottom-right panel of Figure 15). Although the observed far-IR emission is high (due to the host galaxy star-formation), the 0.1-10.0 SEDs of these AGNs show a clear SED turnover at 3 and are matched well by the WDD AGN template. Similarly to the situation at , no evidence among the LoCuSS sample indicates the AGN SEDs at =0.5-2.5 differ from those in the PG sample.
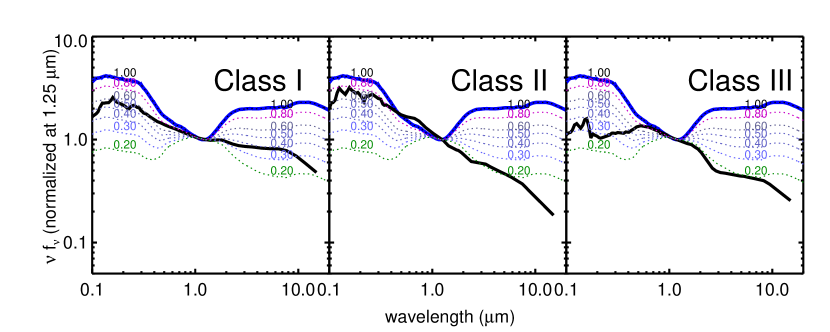
Hao et al. (2010, 2011) reported the discovery of hot-dust-poor (HDP) quasars at =0.1-3 in the XMM-COSMOS sample (Elvis et al., 2012), the Spitzer+SDSS selected sample (Richards et al., 2006), and the Elvis et al. (1994) sample. These quasars are identified by their special combination of optical (0.3-1 ) and near-IR (1-3 ) slopes ( and , respectively), and are further grouped into three classes based on the locations in a - plot (see details in Hao et al. 2010). We compare our AGN templates to the mean SEDs of the three classes of HDP quasars derived from the XMM-COSMOS sample (Hao et al., 2010) in Figure 17. Since the majority of HDP quasars in Hao et al. (2010) are at =1-3, their mid-IR SEDs (3-10) are poorly constrained by the MIPS and IRAC photometry. Thus we limit the comparison to . Firstly, we find that all three HDP templates prefer the HDD AGN template to represent their AGN component. As shown in the upper panels of Figure 17, if the normal AGN template is assumed, a strong contribution of the host galaxy is required to match the IR SEDs of these quasars ( for class I, for class II and class III), leaving a strong underestimation of the UV-optical observed SED. Adding an extremely strong young stellar contribution to match such an SED deficiency is unlikely to be a reasonable solution. In contrast, if the AGN components in class I HDP quasars are represented by the HDD template, the host galaxy contamination in the near-IR would be small (). The difference between the UV-optical SED of class I HDP quasars and the HDD AGN template can be completely mitigated by introducing moderate extinction to the AGN component. For the class II and class III HDP quasars, if a strong host galaxy contribution (0.6-0.7) is added, the HDD AGN template can also recover the HDP SEDs reasonably well. As a result, we do not find that the HDP quasars presented by Hao et al. (2010, 2011) are atypical compared to the PG sample.
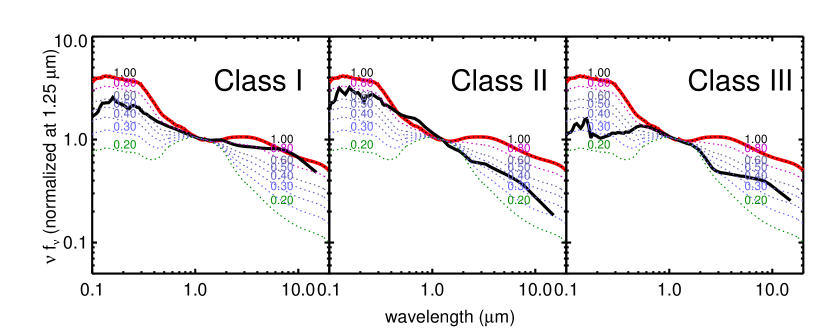
In summary, quasars with weak hot dust emission at =0.5-2.5 do not have significantly different SEDs compared with the dust-deficient quasars in the PG sample, if AGN extinction and the possible host galaxy near-IR contamination are considered.
6.4. Does the HDD Quasar Fraction Evolve with Redshift?
6.4.1 Bias Due to the Parent Sample
The HDD fractions are subject to the selection criteria of the parent sample. For the MIPS mJy complete type-1 LoCuSS AGN sample (Xu et al., 2015), we only identify 3 out of 107 quasars to be HDD, making the HDD fraction only 3%. For the 19 quasars identified by other means (e.g., SDSS) in the same field but with MIPS mJy and relatively complete infrared SED observations, 5 quasars are HDD, making an HDD fraction . Because the LoCuSS type-1 quasars were selected on flux density, they are biased against quasars with weak infrared emission. A similar effect for near-IR color selection is also seen in the 2MASS sample in Shi et al. (2014), where no HDD quasars have been found. The 2MASS sample is characterized by a red AGN population with (Cutri et al., 2001; Smith et al., 2002), while the HDD quasars tend to have 1.0-1.5.
A luminosity bias of the parent sample may also produce specious evolution of the HDD fraction. As shown in Section 6.1, strong near-IR SED contamination by host galaxy stellar emission can mimic hot dust deficiency in normal quasars. In Figure 18, we combine the Elvis AGN template and an elliptical galaxy template to explore the host galaxy fraction as a function of AGN luminosity. The host galaxy mass is assumed to be , which is likely to be the maximum value for most quasars (e.g., Reines & Volonteri, 2015; Bongiorno et al., 2016). We convert the stellar mass to the near-IR luminosity, adopting the mass to light ratio for local field galaxies (Bell et al., 2003). We can see at , the host galaxy contamination at the optical bands as well as the near-IR to mid-IR bands is negligible (with ), so the simple two color identification adopted in Jiang et al. 2010 should be good enough to pick out dust-deficient quasars. At , we see a gradual increase of . Below , the host galaxy contamination increases rapidly from , in which case the identification of HDD quasars becomes very difficult.
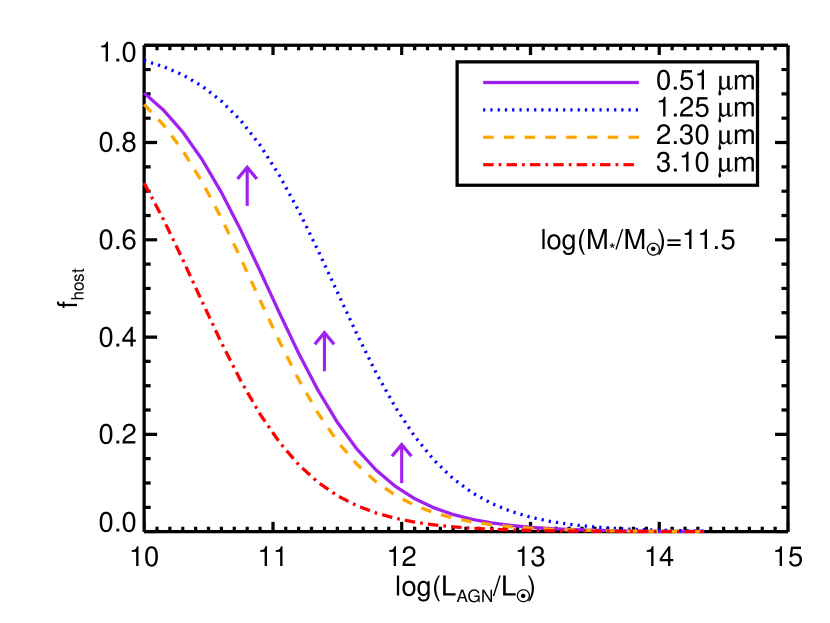
In the upper panel of Figure 14, we show the cut in Jun & Im 2013. For the same HDD quasar criteria (), no PG quasars are selected above the luminosity cut. A large number of dust-deficient PG quasars are still hidden in this simple selection. In contrast, similar HDD quasars at are easily identified. As we observe more luminous quasars at higher redshift, this color selection becomes more productive. As a result, we will get an increasing HDD quasar fraction even if the real value is constant. Nevertheless, for the samples in Jiang et al. (2010) (), Jun & Im (2013) (), and Mor & Trakhtenbrot (2011) (), the values of at 0.51, 2.30, 3.10 are smaller than 10%. In other words, the host galaxy contribution has very limited impact on the dust-deficient quasar selection in these papers.
6.4.2 Bias Due to the Selection Methods
Different selection criteria are another important reason for the discrepancies in the HDD fractions in the literature. Hao et al. (2010) introduced the AGN-galaxy mixing diagram, which takes account of both host galaxy contamination and quasar reddening, to search for dust-deficient quasars. Following Hao et al. (2010, 2011), we fit power laws () at 0.3-1 and 1-3 to derive an optical slope () and an NIR slope () for each quasar in the PG sample, and show their distribution in the AGN-galaxy mixing diagram as Figure 19. For the HDD PG quasars, four out of the seven ambiguous cases, PG 0043+039,PG 1022+519, PG 1341+258, and PG 2209+184 locate below the AGN-galaxy mixing curve. Meanwhile, six other HDD PG quasars have deviations of and within the 1 dispersion of the Elvis et al. (1994) sample. HDD quasars like PG 1100+772, PG 1121+422, PG 1115+407, PG 1216+069, PG 1302102, and PG 1626+554 are not revealed by the stringent selection. Besides PG 1011040, the remaining HDD PG quasars are grouped into class I, suggesting the Hao et al. (2010) selection only recovers of the HDD quasars identified through SED decomposition. Additionally, the near-IR SEDs of class II and class III HDP quasars selected from this diagram are likely dominated by host galaxy emission, making the identification of the real dust-deficient quasars ambiguous.
Mor & Trakhtenbrot (2011) defined the dust-covering factor as the ratio between the luminosities of dust emission at 2-35 and the AGN power-law component, , to look for quasars with low dust-covering. They also apply a luminosity cut at rest-frame , to remove quasars with possible strong host contamination. As demonstrated in their Figure 3, normal quasars have peaked around 0.23, and low dust-covering quasars have = 0.1-0.13. These values are consistent with our Elvis normal AGN template and HDD template. The 15-20% fraction in Mor & Trakhtenbrot (2011) is also similar to our value for HDD quasars (15-23%). However, since they did not study the IR SED shapes, the Mor & Trakhtenbrot (2011) low dust-covering quasar sample is not guaranteed to be purely HDD-like quasars.
Jun & Im (2013) required the luminosity ratio to define HDD quasars, whereas the HDD AGN template we derived based on the PG sample has . Only the extreme HDD PG 0049+171 has a . As a result, Jun & Im (2013) only looked at the extreme HDD and rare quasars. These quasars may be extremely optically blue HDD quasars (as is the case for PG 0049+171).
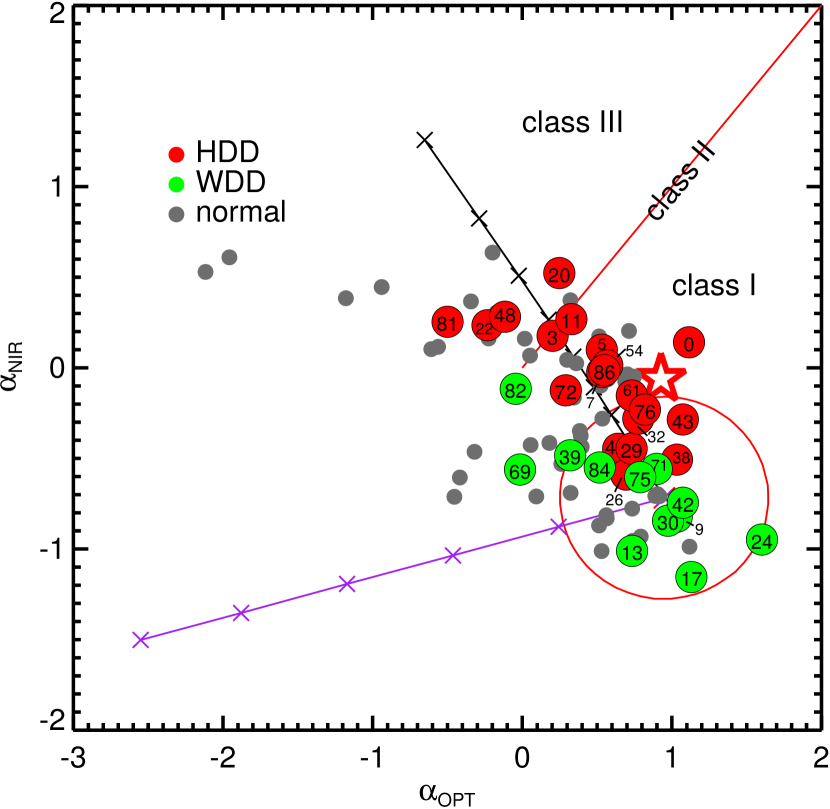
6.4.3 the HDD Quasar Fraction
Richards et al. (2009) showed that optical-only selection would miss 50% of the whole type 1 quasar sample (their Figure 9). As a rough estimation, the 20% HDD fraction in the PG sample should translate into about 10% in a complete sample to similar luminosity. This value is similar to HDP quasar fraction of the XMM-COSMOS AGN sample and the SDSS-Spitzer sample for AGN with (0.5-4, Hao et al. 2010, 2011), whose host stellar contamination is negligible.
In the Leipski et al. (2014) sample (selected by blue colors in the rest optical bands), the fraction of dust-deficient quasars is , which is identical to that of our PG sample (optically selected). As shown in Figure 15, the SEDs of HDD quasars are similar to our HDD AGN template, suggesting a similar incidence of HDD AGNs. The luminosities of these quasars are very high (, Lyu et al. 2016), so that the host galaxy stellar contamination can be ignored. However, most of these quasars are selected from SDSS and it is well-known that such a quasar sample could have very low completeness (e.g., McGreer et al., 2013). As a result, we should be cautious in comparing the sample to the intermediate-redshift or low-redshift results directly.
Hao et al. (2010) argued that the fraction of HDP AGNs shows a jump from to . Nevertheless, at , there is a large number of AGN with (Figure 2 in Elvis et al. 2012, assuming ). As shown above, the Hao et al. (2010) selection may miss a large number of HDD quasars with strong near-IR host galaxy contamination. As a result, we do not think the redshift evolution of the HDP quasar fraction in the XMM-COSMOS sample (Hao et al., 2010) is convincing since the degeneracy between the AGN luminosity and redshift was not considered. In agreement, in the subsequent paper by Hao et al. (2011), no detectable redshift evolution of the HDP quasar fraction was reported. For the Richards et al. (2006) SDSS-Spitzer sample studied in the second paper (Hao et al., 2011), the vast majority of AGNs have and therefore are bright enough that the host galaxies do not confuse the identification of hot-dust-poor quasars.
In summary, the HDD fraction of quasars from an optical sample is about 15-20%, with no strong evidence for redshift evolution. A purely NIR-selected quasar sample could miss a large number of HDD quasars due to their abnormal IR SEDs. In a complete sample, either selected by optical-IR techniques or by X-ray emission, the HDD fraction is around 10%.
6.5. Dust-deficient Quasars: What is the Cause?
The standard unified model of active nuclei (e.g., Urry & Padovani, 1995) suggests that the accretion disk lies within the central hole of a circumnuclear torus that is optically thick in the optical and near infrared; the torus is in turn surrounded by cold interstellar clouds. Within the main body of the torus, where much of the dust is shielded from direct illumination by the central source, the temperature decreases with increasing radius and the resulting SEDs are complex and depend on radiative transfer and viewing angle (e.g., Fritz et al., 2006). With this classical picture, several possibilities have been proposed in the literature to explain the dust-deficient behavior of AGNs.
For example, Haas et al. (2003) proposed that quasars with weak near-IR and mid-IR emission might arise due to reduced optical-UV emission from the accretion disk, reducing the energy to be absorbed by the hot dust. However, we find that the UV/optical SEDs of the HDD quasars are similar to those of normal quasars, and their luminosities are not low (also see, e.g., Hao et al. 2010, 2011; Jiang et al. 2010; Mor & Netzer 2012; Jun & Im 2013), contrary to this hypothesis.
Jiang et al. (2010) suggested that the extremely IR-weak quasars could be the first-generation of quasars that live in a dust-free medium and hence do not have the torus structure. However, as we have shown, similar quasars can also be found in the nearby Universe (Section 6.3) and there is no evidence for strong redshift evolution of the fraction of HDD quasars (Section 6.4). Additionally, considering that quasars are already metal-rich (Nagao et al., 2006, 2012; Jiang et al., 2007; Juarez et al., 2009) at 5-6, and very dusty quasars already exist at (Barnett et al., 2015), a significant population of dust-free quasars at would be surprising.
On the other hand, Kawakatu & Ohsuga (2011) argued that the weak near-IR dust emission of quasars is associated with a super Eddington ratio and stated that the IR-weak quasars in Jiang et al. (2010) have super Eddington ratios as a support for this model. However, we note that accurate Eddington ratios are hard to get for these quasars because of their lowest luminosities among quasars with UV to far-IR SED constraints at (Lyu et al., 2016) and the uncertainties in the calibration of the black hole mass estimators at high redshifts (e.g., see review by Shen, 2013). More importantly, our analysis of the HDD quasars suggests the opposite: the deficiency of hot dust emission is more easily seen in quasars with low accretion rates.
The receding torus model (e.g., Lawrence, 1991; Simpson, 2005; Assef et al., 2013) has been frequently invoked to explain the decrease in the infrared-to-optical luminosity ratios of quasars with increasing AGN luminosity (e.g., Maiolino et al., 2007; Roseboom et al., 2013; Mateos et al., 2016). The classical picture assumes the torus has an approximately constant scale height (e.g., Lawrence, 1991). The size of the inner wall of the torus is determined by the dust sublimation radius, , where is the dust sublimation temperature and is the dust grain size (e.g., Barvainis, 1987). With increasing AGN luminosity , will grow, increasing the solid angle through which energy from the central engine can escape. As shown in Section 6.2, the fraction of WDD quasars grows with increasing AGN luminosity, seemingly consistent with this prediction.
However, the relatively stronger silicate emission feature observed in the WDD quasars (see Section 6.2) may be inconsistent with the assumption of a constant scale height for the torus. The silicate emission arises from warm dust relatively far from the central engine and of moderate optical depth (e.g., Fritz et al., 2006; Nenkova et al., 2008). If the torus scale height were constant, with the receding of the torus we should observe similar silicate emission strength due to the identical structure of the warm dust emission region. In fact, we can explain the stronger silicate emission of dust-deficient quasars if the scale height of the warm dust above the torus mid-plane is reduced and the tori intercept less energy from their accretion disks (reducing the mid-IR continuum, while the outermost zones responsible for the silicate emission are relatively unchanged). Observations show the hydrogen column density for high-luminosity AGNs is lower than that for low-luminosity AGNs (e.g., Ueda et al., 2003; Barger et al., 2005; La Franca et al., 2005; Akylas et al., 2006), also favoring a smaller torus scale height with increasing AGN luminosity.
Finally, we propose a schematic model for the torus geometry evolution to explain the observed behavior of dust-deficient quasars through modifications in the standard model. As pointed out by, e.g., Stalevski et al. 2016, if the torus structure is not changed, the AGN luminosity alone does not modify the IR SED shape of the torus. Consequently, we focus on the geometry of the torus, not on the self-similar scale expansion of various structures with increasing AGN luminosity. In cartoon A of Figure 20, we picture the key components of our model. Heated by the UV-optical emission from the nucleus, the dust that makes up the torus assumes a temperature gradient as a function of distance to the accretion disk, resulting in a distribution of cold dust, warm dust and hot dust. Due to gravity, the dusty structures (e.g., clumpy clouds or a smooth distribution) have a higher density closer to the accretion disk and torus equatorial plane. In the innermost region of the torus, since the emission from the black hole accretion disk is anisotropic (e.g., Netzer, 1987), the dust grains sublimate and form a concave structure for the hot dust emission region (Kawaguchi & Mori, 2010). Following Kawaguchi & Mori (2010), we also assume the innermost region of the hot dust emission region is connected with the outermost region of the accretion disk. In the zoom-in plot of the inner region of the torus (panel A1), we show the concave part of the host dust emission is truncated at and , controlled by the thickness of the torus and the thickness of the accretion disk, respectively.
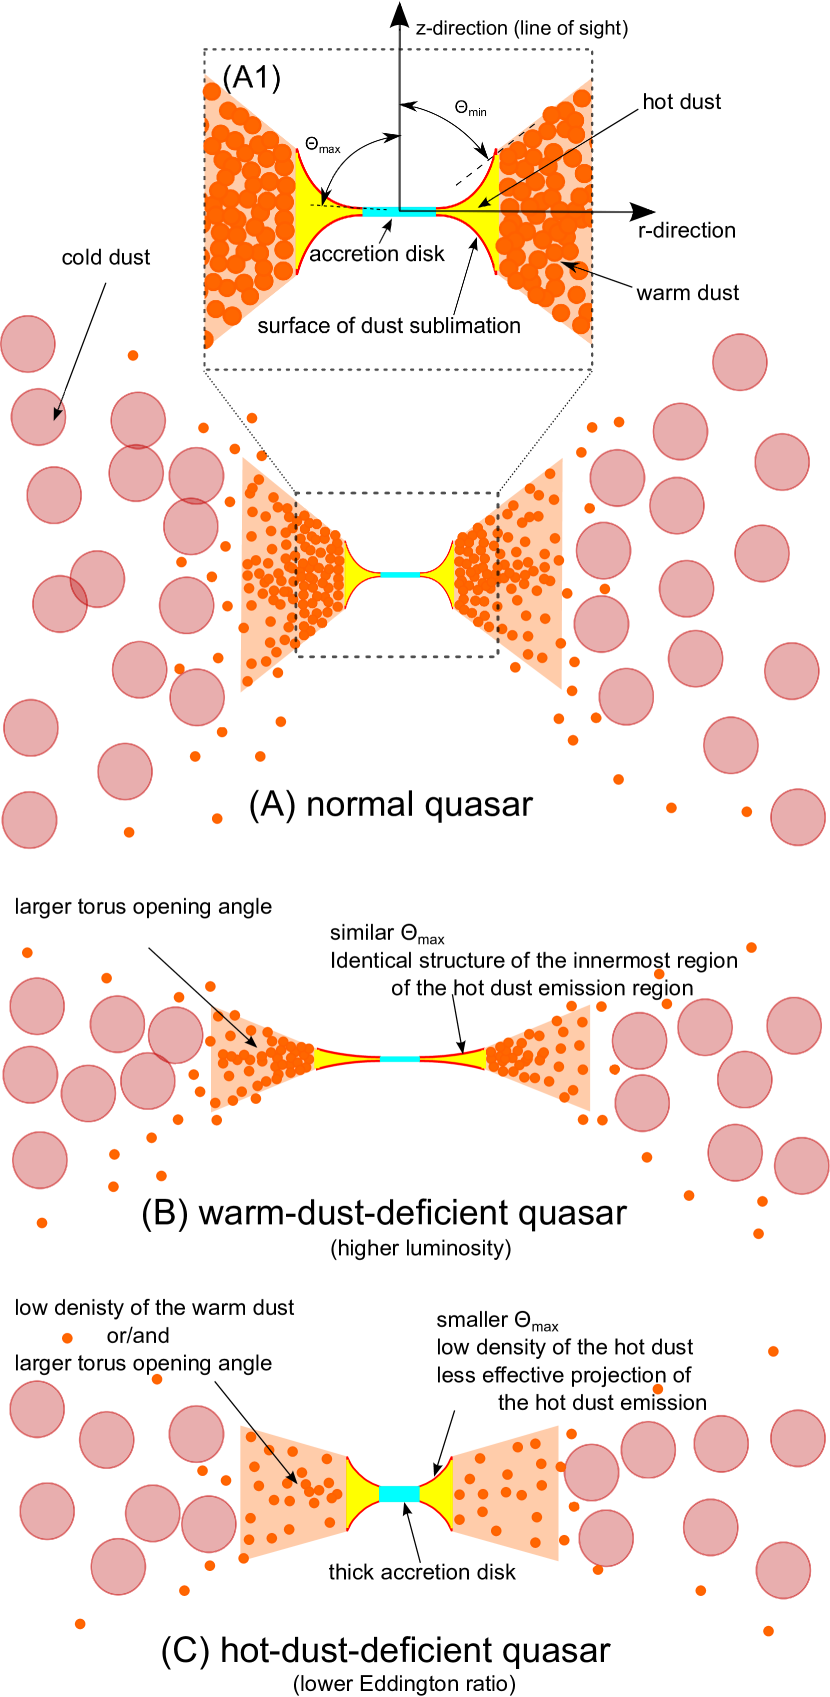
For WDD quasars, an increase of AGN luminosity results in a smaller torus scale height or larger opening angle, reducing the volume of the warm dust emission region (cartoon B in Figure 20) and causing its output to drop. This reduction may be enhanced according to the suggestion by Hönig & Beckert (2007), that dust clouds at large torus scale heights would be destroyed by their exposure to the increased AGN luminosity. However, the structure of the innermost range of the hot dust emission region is identical to that of normal quasars due to a constant . Thus, there is little change in hot dust emission.
The HDD quasars tend to have lower Eddington ratios. For the outer part of the accretion disk, where gas pressure provides most of the vertical support, the scale height (e.g., Krolik, 1999). Consequently, the hot dust emission region has a reduced and smaller dust density with increasing (cartoon C in Figure 20). In addition, the projection of hot dust emission in the polar direction is less effective due to the relatively high skewness of the dust sublimation surface. As a result, we will not observe much hot dust emission. We may also expect that the cloud density in the warm dust emission region is decreased or that the opening angle of warm dust emission is increased, which would explain the observed stronger silicate emission (see Section 6.2) as well as the weak mid-IR emission.
In brief, we suggest that the observed deficiency of emission by warm and hot dust in some quasars can result from modifications of the torus structure: (1) WDD quasars can arise from an increase in the torus opening angle and the resulting reduction in the volume of warm dust; and (2) HDD quasars can arise from the increase of the accretion disk thickness for quasars with relatively low Eddington ratios, and the accompanying adjustment in the geometry of the regions dominating hot dust emission.
7. Summary
Elvis et al. (1994) proposed what has become the classic template for quasar SEDs, shown since to be appropriate for the majority of luminous AGNs. However, a minority of objects seem to depart from this standard in the infrared (e.g., Hao et al., 2010, 2011; Jiang et al., 2010). We have studied the AGN infrared SED variations in an archetypical optically selected sample composed of 87 PG quasars. The optical to far-IR SEDs of these quasars were investigated with the aid of a three-component model including the AGN emission, the host galaxy stellar emission, and the host galaxy infrared emission powered by star formation. The host galaxy properties derived from the SED decomposition are consistent with those determined through other methods: the stellar contributions in the near-IR band based on the SED analysis are similar to the values derived from image decompositions on the high-resolution images obtained by HST or ground-based adaptive optics; and the infrared luminosities of the host galaxies yield SFRs consistent with the strength of the mid-IR 11.3 aromatic features. Our SED model fits generally have residuals within 0.3 dex of the observed SEDs at 0.2-500 and reproduce the 0.5-70 region especially well. The principal results can be summarized as follows.
-
1.
The intrinsic infrared SEDs of the PG quasars cannot be represented by one single SED template. Normal quasars occupy of the sample and their AGN SEDs can be described by the Elvis et al. (1994) template reasonably well. In comparison, the AGN template derived by Assef et al. (2010) appears to have too deep a minimum near 1.0 , as indicated by the overestimate of host galaxy brightness using it in SED deconvolution.
-
2.
There is a substantial fraction (30-40%) of abnormal quasars with weak infrared emission in the PG sample, which have often been overlooked by previous studies. These IR-weak quasars can be classified into two populations with distinct SED properties.
-
3.
The hot-dust-deficient (HDD) quasars are characterized by a deficiency of dust emission at . The AGN SEDs of these quasars do not have the typical hot dust emission peaked at and present very weak warm and cold dust emission. In the PG sample, they contribute 15-23% of the total population.
-
4.
The warm-dust-deficient (WDD) quasars have a similar near-IR SED bump peaked at as is the case for normal quasars but have a very quick drop in the mid-IR. The fraction of the WDD quasars in the PG sample is 14-17%.
-
5.
Compared with normal quasars, the HDD quasars are similar in terms of AGN luminosities and black hole masses, but they tend to have lower Eddington ratios with a K-S probability of 0.025 of being drawn from the same distribution. We also find that the HDD quasar fraction is not luminosity dependent, consistent with previous work by Hao et al. (2010, 2011) and Mor & Netzer (2012). These HDD objects account for roughly 10% of quasar samples selected on the basis of bolometric luminosity.
-
6.
The WDD quasars do not differ from normal quasars in Eddington ratio, but their fraction increases with AGN luminosity. The decreased mid-IR to optical luminosity ratios of quasars with increasing AGN luminosity (as found by, e.g., Maiolino et al. 2007; Treister et al. 2008; Mor & Trakhtenbrot 2011; Calderone et al. 2012; Ma & Wang 2013; Gu 2013; Roseboom et al. 2013) may be mostly contributed by the more frequent appearance of WDD quasars.
-
7.
Compared with normal quasars, both WDD and HDD quasars tend to have stronger silicate emission features at , which can be explained by a reduced scale height of the warm dust above the equatorial plane of the circumnuclear torus.
-
8.
The high- dust-free or dust-poor quasars found by, e.g., Jiang et al. (2010), Hao et al. (2010) share similar SEDs to the HDD quasars in the PG sample. WDD quasars are also seen at . Although the near- to mid-infrared SEDs of high- quasars vary to some degree, they show no obvious difference from the archetypal PG sample.
-
9.
Considering biases in the parent sample and the selection methods, there is no evidence for a strong cosmic evolution of the dust-deficient quasars. Instead, we suggest that observed dust-deficient behavior of quasars is caused by a change of the torus structure controlled by AGN luminosity and Eddington ratio.
References
- Akylas et al. (2006) Akylas, A., Georgantopoulos, I., Georgakakis, A., Kitsionas, S., & Hatziminaoglou, E. 2006, A&A, 459, 693
- Alam et al. (2015) Alam, S., Albareti, F. D., Allende Prieto, C., et al. 2015, ApJS, 219, 12
- Alonso-Herrero et al. (2014) Alonso-Herrero, A., Ramos Almeida, C., Esquej, P., et al. 2014, MNRAS, 443, 2766
- Antonucci (1993) Antonucci, R. 1993, ARA&A, 31, 473
- Asmus et al. (2015) Asmus, D., Gandhi, P., Hönig, S. F., Smette, A., & Duschl, W. J. 2015, MNRAS, 454, 766
- Asmus et al. (2016) Asmus, D., Hönig, S. F., & Gandhi, P. 2016, ApJ, 822, 109
- Assef et al. (2010) Assef, R. J., Kochanek, C. S., Brodwin, M., et al. 2010, ApJ, 713, 970
- Assef et al. (2013) Assef, R. J., Stern, D., Kochanek, C. S., et al. 2013, ApJ, 772, 26
- Ballantyne (2008) Ballantyne, D. R. 2008, ApJ, 685, 787
- Ballo et al. (2008) Ballo, L., Giustini, M., Schartel, N., et al. 2008, A&A, 483, 137
- Barger et al. (2005) Barger, A. J., Cowie, L. L., Mushotzky, R. F., et al. 2005, AJ, 129, 578
- Barnett et al. (2015) Barnett, R., Warren, S. J., Banerji, M., et al. 2015, A&A, 575, A31
- Barvainis (1987) Barvainis, R. 1987, ApJ, 320, 537
- Barvainis (1990) —. 1990, ApJ, 353, 419
- Baskin & Laor (2005) Baskin, A., & Laor, A. 2005, MNRAS, 356, 1029
- Bell et al. (2003) Bell, E. F., McIntosh, D. H., Katz, N., & Weinberg, M. D. 2003, ApJS, 149, 289
- Bianchi et al. (2014) Bianchi, L., Conti, A., & Shiao, B. 2014, Advances in Space Research, 53, 900
- Bongiorno et al. (2007) Bongiorno, A., Zamorani, G., Gavignaud, I., et al. 2007, A&A, 472, 443
- Bongiorno et al. (2012) Bongiorno, A., Merloni, A., Brusa, M., et al. 2012, MNRAS, 427, 3103
- Bongiorno et al. (2016) Bongiorno, A., Schulze, A., Merloni, A., et al. 2016, A&A, 588, A78
- Boroson & Green (1992) Boroson, T. A., & Green, R. F. 1992, ApJS, 80, 109
- Brocksopp et al. (2006) Brocksopp, C., Starling, R. L. C., Schady, P., et al. 2006, MNRAS, 366, 953
- Bruzual & Charlot (2003) Bruzual, G., & Charlot, S. 2003, MNRAS, 344, 1000
- Calderone et al. (2012) Calderone, G., Sbarrato, T., & Ghisellini, G. 2012, MNRAS, 425, L41
- Carini et al. (2007) Carini, M. T., Noble, J. C., Taylor, R., & Culler, R. 2007, AJ, 133, 303
- Cutri et al. (2001) Cutri, R. M., Nelson, B. O., Kirkpatrick, J. D., Huchra, J. P., & Smith, P. S. 2001, in Astronomical Society of the Pacific Conference Series, Vol. 232, The New Era of Wide Field Astronomy, ed. R. Clowes, A. Adamson, & G. Bromage, 78
- Cutri et al. (1985) Cutri, R. M., Wisniewski, W. Z., Rieke, G. H., & Lebofsky, M. J. 1985, ApJ, 296, 423
- Dale et al. (2014) Dale, D. A., Helou, G., Magdis, G. E., et al. 2014, ApJ, 784, 83
- de Vries et al. (2005) de Vries, W. H., Becker, R. H., White, R. L., & Loomis, C. 2005, AJ, 129, 615
- Denney et al. (2010) Denney, K. D., Peterson, B. M., Pogge, R. W., et al. 2010, ApJ, 721, 715
- Deo et al. (2009) Deo, R. P., Richards, G. T., Crenshaw, D. M., & Kraemer, S. B. 2009, ApJ, 705, 14
- Devereux & Eales (1989) Devereux, N. A., & Eales, S. A. 1989, ApJ, 340, 708
- di Clemente et al. (1996) di Clemente, A., Giallongo, E., Natali, G., Trevese, D., & Vagnetti, F. 1996, ApJ, 463, 466
- Di Matteo et al. (2005) Di Matteo, T., Springel, V., & Hernquist, L. 2005, Nature, 433, 604
- Diamond-Stanic & Rieke (2010) Diamond-Stanic, A. M., & Rieke, G. H. 2010, ApJ, 724, 140
- Dye et al. (2006) Dye, S., Warren, S. J., Hambly, N. C., et al. 2006, MNRAS, 372, 1227
- Edelson & Malkan (1986) Edelson, R. A., & Malkan, M. A. 1986, ApJ, 308, 59
- Elvis et al. (1994) Elvis, M., Wilkes, B. J., McDowell, J. C., et al. 1994, ApJS, 95, 1
- Elvis et al. (2012) Elvis, M., Hao, H., Civano, F., et al. 2012, ApJ, 759, 6
- Enya et al. (2002a) Enya, K., Yoshii, Y., Kobayashi, Y., et al. 2002a, ApJS, 141, 31
- Enya et al. (2002b) —. 2002b, ApJS, 141, 45
- Esquej et al. (2014) Esquej, P., Alonso-Herrero, A., González-Martín, O., et al. 2014, ApJ, 780, 86
- Fritz et al. (2006) Fritz, J., Franceschini, A., & Hatziminaoglou, E. 2006, MNRAS, 366, 767
- Gallo et al. (2011) Gallo, L. C., Grupe, D., Schartel, N., et al. 2011, MNRAS, 412, 161
- Giustini et al. (2011) Giustini, M., Cappi, M., Chartas, G., et al. 2011, A&A, 536, A49
- Giveon et al. (1999) Giveon, U., Maoz, D., Kaspi, S., Netzer, H., & Smith, P. S. 1999, MNRAS, 306, 637
- Green et al. (1986) Green, R. F., Schmidt, M., & Liebert, J. 1986, ApJS, 61, 305
- Gu (2013) Gu, M. 2013, ApJ, 773, 176
- Guyon et al. (2006) Guyon, O., Sanders, D. B., & Stockton, A. 2006, ApJS, 166, 89
- Haas et al. (2003) Haas, M., Klaas, U., Müller, S. A. H., et al. 2003, A&A, 402, 87
- Hamilton et al. (2002) Hamilton, T. S., Casertano, S., & Turnshek, D. A. 2002, ApJ, 576, 61
- Hamilton et al. (2008) —. 2008, ApJ, 678, 22
- Hao et al. (2011) Hao, H., Elvis, M., Civano, F., & Lawrence, A. 2011, ApJ, 733, 108
- Hao et al. (2010) Hao, H., Elvis, M., Civano, F., et al. 2010, ApJ, 724, L59
- Hao et al. (2014) —. 2014, MNRAS, 438, 1288
- Hao et al. (2007) Hao, L., Weedman, D. W., Spoon, H. W. W., et al. 2007, ApJ, 655, L77
- Henden et al. (2016) Henden, A. A., Templeton, M., Terrell, D., et al. 2016, VizieR Online Data Catalog, 2336
- Hernán-Caballero et al. (2016) Hernán-Caballero, A., Hatziminaoglou, E., Alonso-Herrero, A., & Mateos, S. 2016, MNRAS, 463, 2064
- Ho (1999) Ho, L. C. 1999, ApJ, 516, 672
- Ho (2008) —. 2008, ARA&A, 46, 475
- Hönig & Beckert (2007) Hönig, S. F., & Beckert, T. 2007, MNRAS, 380, 1172
- Hönig et al. (2012) Hönig, S. F., Kishimoto, M., Antonucci, R., et al. 2012, ApJ, 755, 149
- Hönig et al. (2013) Hönig, S. F., Kishimoto, M., Tristram, K. R. W., et al. 2013, ApJ, 771, 87
- Hopkins et al. (2012) Hopkins, P. F., Hayward, C. C., Narayanan, D., & Hernquist, L. 2012, MNRAS, 420, 320
- Hopkins et al. (2005) Hopkins, P. F., Hernquist, L., Martini, P., et al. 2005, ApJ, 625, L71
- Hopkins et al. (2004) Hopkins, P. F., Strauss, M. A., Hall, P. B., et al. 2004, AJ, 128, 1112
- Horst et al. (2006) Horst, H., Smette, A., Gandhi, P., & Duschl, W. J. 2006, A&A, 457, L17
- Jester et al. (2005) Jester, S., Schneider, D. P., Richards, G. T., et al. 2005, AJ, 130, 873
- Jiang et al. (2007) Jiang, L., Fan, X., Vestergaard, M., et al. 2007, AJ, 134, 1150
- Jiang et al. (2010) Jiang, L., Fan, X., Brandt, W. N., et al. 2010, Nature, 464, 380
- Juarez et al. (2009) Juarez, Y., Maiolino, R., Mujica, R., et al. 2009, A&A, 494, L25
- Jun & Im (2013) Jun, H. D., & Im, M. 2013, ApJ, 779, 104
- Kaspi et al. (2005) Kaspi, S., Maoz, D., Netzer, H., et al. 2005, ApJ, 629, 61
- Kaspi et al. (2000) Kaspi, S., Smith, P. S., Netzer, H., et al. 2000, ApJ, 533, 631
- Kawaguchi & Mori (2010) Kawaguchi, T., & Mori, M. 2010, ApJ, 724, L183
- Kawakatu & Ohsuga (2011) Kawakatu, N., & Ohsuga, K. 2011, MNRAS, 417, 2562
- Kellermann et al. (1989) Kellermann, K. I., Sramek, R., Schmidt, M., Shaffer, D. B., & Green, R. 1989, AJ, 98, 1195
- Kennicutt (1998) Kennicutt, Jr., R. C. 1998, ARA&A, 36, 189
- Kim et al. (2008) Kim, M., Ho, L. C., Peng, C. Y., Barth, A. J., & Im, M. 2008, ApJS, 179, 283
- King (2003) King, A. 2003, ApJ, 596, L27
- Kirkpatrick et al. (2015) Kirkpatrick, A., Pope, A., Sajina, A., et al. 2015, ApJ, 814, 9
- Krawczyk et al. (2013) Krawczyk, C. M., Richards, G. T., Mehta, S. S., et al. 2013, ApJS, 206, 4
- Krolik (1999) Krolik, J. H. 1999, Active galactic nuclei : from the central black hole to the galactic environment
- La Franca et al. (2005) La Franca, F., Fiore, F., Comastri, A., et al. 2005, ApJ, 635, 864
- Labita et al. (2006) Labita, M., Treves, A., Falomo, R., & Uslenghi, M. 2006, MNRAS, 373, 551
- Lawrence (1991) Lawrence, A. 1991, MNRAS, 252, 586
- Lawrence et al. (2007) Lawrence, A., Warren, S. J., Almaini, O., et al. 2007, MNRAS, 379, 1599
- Leipski et al. (2006) Leipski, C., Falcke, H., Bennert, N., & Hüttemeister, S. 2006, A&A, 455, 161
- Leipski et al. (2014) Leipski, C., Meisenheimer, K., Walter, F., et al. 2014, ApJ, 785, 154
- López-Gonzaga et al. (2016) López-Gonzaga, N., Burtscher, L., Tristram, K. R. W., Meisenheimer, K., & Schartmann, M. 2016, A&A, 591, A47
- Lusso et al. (2011) Lusso, E., Comastri, A., Vignali, C., et al. 2011, A&A, 534, A110
- Lusso et al. (2012) Lusso, E., Comastri, A., Simmons, B. D., et al. 2012, MNRAS, 425, 623
- Lutz et al. (2004) Lutz, D., Maiolino, R., Spoon, H. W. W., & Moorwood, A. F. M. 2004, A&A, 418, 465
- Lyu et al. (2016) Lyu, J., Rieke, G. H., & Alberts, S. 2016, ApJ, 816, 85
- Ma & Wang (2013) Ma, X.-C., & Wang, T.-G. 2013, MNRAS, 430, 3445
- Mainzer et al. (2014) Mainzer, A., Bauer, J., Cutri, R. M., et al. 2014, ApJ, 792, 30
- Maiolino et al. (2007) Maiolino, R., Shemmer, O., Imanishi, M., et al. 2007, A&A, 468, 979
- Marble et al. (2003) Marble, A. R., Hines, D. C., Schmidt, G. D., et al. 2003, ApJ, 590, 707
- Martin et al. (2005) Martin, D. C., Fanson, J., Schiminovich, D., et al. 2005, ApJ, 619, L1
- Massaro et al. (2015) Massaro, E., Maselli, A., Leto, C., et al. 2015, Ap&SS, 357, 75
- Mateos et al. (2015) Mateos, S., Carrera, F. J., Alonso-Herrero, A., et al. 2015, MNRAS, 449, 1422
- Mateos et al. (2016) —. 2016, ApJ, 819, 166
- McDowell et al. (1992) McDowell, J. C., Elvis, M., & Wilkes, B. J. 1992, in American Institute of Physics Conference Series, Vol. 254, American Institute of Physics Conference Series, ed. S. S. Holt, S. G. Neff, & C. M. Urry, 532–535
- McGreer et al. (2013) McGreer, I. D., Jiang, L., Fan, X., et al. 2013, ApJ, 768, 105
- McLeod & McLeod (2001) McLeod, K. K., & McLeod, B. A. 2001, ApJ, 546, 782
- McLeod & Rieke (1994) McLeod, K. K., & Rieke, G. H. 1994, ApJ, 431, 137
- Mor & Netzer (2012) Mor, R., & Netzer, H. 2012, MNRAS, 420, 526
- Mor & Trakhtenbrot (2011) Mor, R., & Trakhtenbrot, B. 2011, ApJ, 737, L36
- Nagao et al. (2012) Nagao, T., Maiolino, R., De Breuck, C., et al. 2012, A&A, 542, L34
- Nagao et al. (2006) Nagao, T., Maiolino, R., & Marconi, A. 2006, A&A, 447, 863
- Nenkova et al. (2008) Nenkova, M., Sirocky, M. M., Nikutta, R., Ivezić, Ž., & Elitzur, M. 2008, ApJ, 685, 160
- Netzer (1987) Netzer, H. 1987, MNRAS, 225, 55
- Netzer (2015) —. 2015, ARA&A, 53, 365
- Netzer et al. (2007) Netzer, H., Lutz, D., Schweitzer, M., et al. 2007, ApJ, 666, 806
- Neugebauer et al. (1987) Neugebauer, G., Green, R. F., Matthews, K., et al. 1987, ApJS, 63, 615
- Neugebauer & Matthews (1999) Neugebauer, G., & Matthews, K. 1999, AJ, 118, 35
- Neugebauer et al. (1989) Neugebauer, G., Soifer, B. T., Matthews, K., & Elias, J. H. 1989, AJ, 97, 957
- Nguyen et al. (2010) Nguyen, H. T., Schulz, B., Levenson, L., et al. 2010, A&A, 518, L5
- Ochsenbein et al. (2000) Ochsenbein, F., Bauer, P., & Marcout, J. 2000, A&AS, 143, 23
- Ojha et al. (2009) Ojha, R., Zacharias, N., Hennessy, G. S., Gaume, R. A., & Johnston, K. J. 2009, AJ, 138, 845
- Page et al. (2012) Page, M. J., Brindle, C., Talavera, A., et al. 2012, MNRAS, 426, 903
- Paltani & Courvoisier (1994) Paltani, S., & Courvoisier, T. J.-L. 1994, A&A, 291, 74
- Paturel et al. (2003) Paturel, G., Petit, C., Rousseau, J., & Vauglin, I. 2003, A&A, 405, 1
- Peterson et al. (2004) Peterson, B. M., Ferrarese, L., Gilbert, K. M., et al. 2004, ApJ, 613, 682
- Petric et al. (2015) Petric, A. O., Ho, L. C., Flagey, N. J. M., & Scoville, N. Z. 2015, ApJS, 219, 22
- Popescu et al. (2002) Popescu, C. C., Tuffs, R. J., Völk, H. J., Pierini, D., & Madore, B. F. 2002, ApJ, 567, 221
- Pozzi et al. (2010) Pozzi, F., Vignali, C., Comastri, A., et al. 2010, A&A, 517, A11
- Prieto et al. (2010) Prieto, M. A., Reunanen, J., Tristram, K. R. W., et al. 2010, MNRAS, 402, 724
- Raban et al. (2009) Raban, D., Jaffe, W., Röttgering, H., Meisenheimer, K., & Tristram, K. R. W. 2009, MNRAS, 394, 1325
- Reines & Volonteri (2015) Reines, A. E., & Volonteri, M. 2015, ApJ, 813, 82
- Richards et al. (2006) Richards, G. T., Lacy, M., Storrie-Lombardi, L. J., et al. 2006, ApJS, 166, 470
- Richards et al. (2009) Richards, G. T., Deo, R. P., Lacy, M., et al. 2009, AJ, 137, 3884
- Rieke (1978) Rieke, G. H. 1978, ApJ, 226, 550
- Rieke et al. (2009) Rieke, G. H., Alonso-Herrero, A., Weiner, B. J., et al. 2009, ApJ, 692, 556
- Roebuck et al. (2016) Roebuck, E., Sajina, A., Hayward, C. C., et al. 2016, ApJ, 833, 60
- Roseboom et al. (2013) Roseboom, I. G., Lawrence, A., Elvis, M., et al. 2013, MNRAS, 429, 1494
- Rujopakarn et al. (2011) Rujopakarn, W., Rieke, G. H., Eisenstein, D. J., & Juneau, S. 2011, ApJ, 726, 93
- Rujopakarn et al. (2013) Rujopakarn, W., Rieke, G. H., Weiner, B. J., et al. 2013, ApJ, 767, 73
- Runnoe et al. (2012) Runnoe, J. C., Brotherton, M. S., & Shang, Z. 2012, MNRAS, 426, 2677
- Sanders et al. (1989) Sanders, D. B., Phinney, E. S., Neugebauer, G., Soifer, B. T., & Matthews, K. 1989, ApJ, 347, 29
- Sanders et al. (1988) Sanders, D. B., Soifer, B. T., Elias, J. H., et al. 1988, ApJ, 325, 74
- Schmidt & Green (1983) Schmidt, M., & Green, R. F. 1983, ApJ, 269, 352
- Schneider et al. (2015) Schneider, R., Bianchi, S., Valiante, R., Risaliti, G., & Salvadori, S. 2015, A&A, 579, A60
- Scott & Stewart (2014) Scott, A. E., & Stewart, G. C. 2014, MNRAS, 438, 2253
- Shang et al. (2011) Shang, Z., Brotherton, M. S., Wills, B. J., et al. 2011, ApJS, 196, 2
- Shen (2013) Shen, Y. 2013, Bulletin of the Astronomical Society of India, 41, 61
- Shi et al. (2014) Shi, Y., Rieke, G. H., Ogle, P. M., Su, K. Y. L., & Balog, Z. 2014, ApJS, 214, 23
- Simpson (2005) Simpson, C. 2005, MNRAS, 360, 565
- Skrutskie et al. (2006) Skrutskie, M. F., Cutri, R. M., Stiening, R., et al. 2006, AJ, 131, 1163
- Smith et al. (1986) Smith, E. P., Heckman, T. M., Bothun, G. D., Romanishin, W., & Balick, B. 1986, ApJ, 306, 64
- Smith et al. (2002) Smith, P. S., Schmidt, G. D., Hines, D. C., Cutri, R. M., & Nelson, B. O. 2002, ApJ, 569, 23
- Stalevski et al. (2016) Stalevski, M., Ricci, C., Ueda, Y., et al. 2016, MNRAS, 458, 2288
- Steffen et al. (2006) Steffen, A. T., Strateva, I., Brandt, W. N., et al. 2006, AJ, 131, 2826
- Surace et al. (2001) Surace, J. A., Sanders, D. B., & Evans, A. S. 2001, AJ, 122, 2791
- Symeonidis et al. (2016) Symeonidis, M., Giblin, B. M., Page, M. J., et al. 2016, MNRAS, 459, 257
- Thompson et al. (2005) Thompson, T. A., Quataert, E., & Murray, N. 2005, ApJ, 630, 167
- Treister et al. (2008) Treister, E., Krolik, J. H., & Dullemond, C. 2008, ApJ, 679, 140
- Tristram et al. (2014) Tristram, K. R. W., Burtscher, L., Jaffe, W., et al. 2014, A&A, 563, A82
- Ueda et al. (2003) Ueda, Y., Akiyama, M., Ohta, K., & Miyaji, T. 2003, ApJ, 598, 886
- Urry & Padovani (1995) Urry, C. M., & Padovani, P. 1995, PASP, 107, 803
- Veilleux et al. (2009) Veilleux, S., Rupke, D. S. N., Kim, D.-C., et al. 2009, ApJS, 182, 628
- Vestergaard & Peterson (2006) Vestergaard, M., & Peterson, B. M. 2006, ApJ, 641, 689
- Vollmer et al. (2008) Vollmer, B., Beckert, T., & Davies, R. I. 2008, A&A, 491, 441
- Wang et al. (2008) Wang, R., Carilli, C. L., Wagg, J., et al. 2008, ApJ, 687, 848
- Welsh et al. (2011) Welsh, B. Y., Wheatley, J. M., & Neil, J. D. 2011, A&A, 527, A15
- Wheatley et al. (2008) Wheatley, J. M., Welsh, B. Y., & Browne, S. E. 2008, AJ, 136, 259
- Woo et al. (2010) Woo, J.-H., Treu, T., Barth, A. J., et al. 2010, ApJ, 716, 269
- Wright et al. (2010) Wright, E. L., Eisenhardt, P. R. M., Mainzer, A. K., et al. 2010, AJ, 140, 1868
- Xu et al. (2015) Xu, L., Rieke, G. H., Egami, E., et al. 2015, ApJS, 219, 18
- York et al. (2000) York, D. G., Adelman, J., Anderson, Jr., J. E., et al. 2000, AJ, 120, 1579
- Zhang et al. (2016) Zhang, Z., Shi, Y., Rieke, G. H., et al. 2016, ApJ, 819, L27