Dynamical modelling of galactic disc outskirts
Abstract
I review briefly some dynamical models of structures in the outer parts of disc galaxies, including models of polar rings, tidal tails and bridges. I then discuss the density distribution in the outer parts of discs. For this, I compare observations to results of a model in which the disc galaxy is in fact the remnant of a major merger, and find good agreement. This comparison includes radial profiles of the projected surface density and of stellar age, as well as time evolution of the break radius and of the inner and outer disc scale lengths. I also compare the radial projected surface density profiles of dynamically motivated mono-age populations and find that, compared to older populations, younger ones have flatter density profiles in the inner region and steeper in the outer one. The break radius, however, does not vary with stellar age, again in good agreement with observations.
keywords:
galaxies: structure, galaxies: spiral, galaxies: kinematics and dynamics, galaxies: evolution, galaxies: interactions, galaxies: haloes, galaxies: general, galaxies: photometry1 Introduction
What distinguishes the outskirts from the inner parts of galactic discs, to the extent that a specific IAU symposium should be devoted to their study? Why and how is the modelling of galactic disc outskirts different from that of their inner parts? Several points come immediately to mind.
Compared to the inner parts, the outer parts of galactic discs:
-
•
are more exposed to accretion, to interactions and to minor mergers.
-
•
have dynamics which are more dominated by the (spheroidal) halo than by the (thin) disc.
-
•
have stronger asymmetries (m=1 features) and multi-arm (high-m) spirals, but have no bars.
-
•
formed more recently that the inner parts, given the generally admitted inside out disc formation.
As a result:
-
•
the outer parts of discs are well suited for studies of galaxy environment, accretion, interactions and mergers, i.e. for many drivers of galactic evolution (secular or not).
-
•
their study can lead to invaluable constraints on the mass of dark matter haloes, its distribution and shape.
-
•
their outer parts allow us to study disc assembly using nearby galaxies, rather than galaxies at higher redshifts, and thus at much higher resolution and sensitivity.
Here I will review briefly several attempts to model structures in the outskirts of disc galaxies. These will include polar rings (Sect. 2), tidal tails and bridges (Sect. 3) and type II outer discs (Sect. 4). Warps and type III profiles were included in the oral version of this talk, but are not included here due to strict time and space limitations.
2 Polar rings
Polar rings111For more detailed reviews of this subject see [Athanassoula & Bosma 1985], [Schweizer 1996] and [Sparke 2004]. are rings of gas, dust and stars rotating in a plane perpendicular to the main disc, in a polar configuration. They are relatively rare objects in S0 galaxies and even rarer in spirals ([Athanassoula & Bosma 1985], [Whitmore et al. 1990], [Reshetnikov, Faúndez-Abans & de Oliveira-Abans 2011]). NGC 4650A is a prototype polar ring galaxy.
The formation of two discs at right angles seems a most unlikely thing to happen in situ, so that one can safely conclude that polar rings are due to some external event such as the accretion of an external satellite galaxy, or perhaps a mass transfer during an encounter. A number of models around this basic scheme have been proposed ([Bekki 1997], [Reshetnikov & Sotnikova 1997], [Tremaine & Yu 2000], [Bournaud & Combes 2003], etc.). More recently [Macció, Moore & Stadel (2006)], [Brook et al. (2008)] and [Snaith et al. (2012)], using cosmological simulations and their zoom re-simulations, showed that polar rings can be an extreme case of accretion of gas whose angular momentum is near-perpendicular to that of the central galaxy.
Polar rings offer a unique opportunity for probing galactic potentials far from the galactic centre and in a polar plane. They, therefore, can be used to get information on the shape of the dark matter halo (e.g. [Whitmore, McElroy & Schweizer 1987], [Sackett & Sparke 1990], [Sackett et al. 1994], [Combes & Arnaboldi 1996], Iodice et al. 2003, [Khoperskov et al. 2014]). This last paper provides also a statistics of the values of the halo minor-to-major axis ratio (c/a) obtained for polar ring galaxies. Their histogram shows a strong clear peak near c/a = 1, i.e. a strong preference for near-spherical shapes. The total distribution, however, is bimodal, with a second, albeit much less important, maximum around c/a = 0.4. The physical significance of this second peak is unclear, but Khoperskov and his collaborators underline that the c/a value is in fact a function of distance from the centre, with the central parts (where the gravitational influence of the disc is most important) being flatter than the outer parts, which can be more spherical or even prolate. They, furthermore, stress the existence of limitations arising from model assumptions and observational difficulties.
3 Tidal bridges and tails
Tidal bridges and tails222For more detailed reviews of this subject see [Barnes & Hernquist 1992a], [Barnes 1996], [Schweizer 1996], [Struck 1999], etc. are very spectacular structures which may form during close encounters of two galaxies. Bridges are relatively narrow and link the two galaxies, while their shape – in particularly in their central part – can appear not far from linear. Each of the two discs forms also a long curving tail which emanates from the part of the disc which is roughly opposite to the other galaxy. This tail can reach very large distances from its parent galaxy. Prototypes of such structures are NGC 4038/4039 (better known as the Antennae) and NGC 4676 (better known as the Mice), which have been extensively modelled. [Toomre & Toomre (1972)] deliberately used very simple test particle simulations in which each of the two galaxies is a massive point surrounded by massless test particles which just follow the potential. With these they performed ground breaking work in this field, and established that gravity on its own is sufficient to explain such features. They also showed that the results of direct encounters (where the sense of rotation of the companion is the same as that of the particles in the disc) are much more spectacular than the results of retrograde encounters (where the sense of rotation of the companion is opposite to that of the particles in the disc).
These simulations were followed by more realistic ones, in which the gravity of all components (disc, halo and bulge) is fully taken into account and calculated at each simulation step. These of course necessitate much more computer time. The necessary computer time was even more substantially increased when gas, as well as its physics (star formation, feedback and cooling) were included in the simulations of interacting and merging systems. Nevertheless, the introduction of self-consistency and of gas did not alter much the large-scale dynamics and corresponding formation of bridges and tails, so that the main results of [Toomre & Toomre (1972)] were not substantially affected ([Barnes & Hernquist 1996]). It allowed, however, studies which could not have been done with the previous techniques.
[Dubinski, Mihos & Hernquist (1996)] suggest that the length of the tidal tails can be used to estimate the masses of dark matter haloes in disc galaxies. Indeed, they found that for more massive and more extended dark haloes, the resulting tidal tails become shorter, less massive, and less striking, even under the most favourable conditions for producing these features. Thus the large halo-to-disc mass ratio expected in CDM cosmologies seems at odds with the observed tidal tails. This conclusion, however, was based on a rather restricted number of progenitor models (but see also [Dubinski, Mihos & Hernquist (1999)] for a more extended set of models). [Springel & White (1999)] using a set of progenitor models based on the [Mo, Mao & White (1998)] analytical models, demonstrate that even the discs which are embedded in very massive dark matter haloes could well develop long tidal tails, provided the halo spin parameter is large enough. They thus argued that halo-to-disc mass ratio is not a good indicator of the ability to produce tails, and cast doubts as to whether tidal tails could be expected to constrain the values of the cosmological parameters.
[Bournaud, Duc & Masset (2003)] and [Duc, Bournaud & Masset (2004)] revisited this question, now using the existence of massive gaseous accumulations near the tip of the tidal tails, and showed that this requires that the dark matter haloes extend at least ten times further than the stellar discs. These gaseous accumulations could in fact be progenitors of tidal dwarf galaxies (see also [Barnes & Hernquist 1992b]).
A poster presented at this meeting ([Romero-Gomez & Athanassoula 2016]) discussed whether it is possible to use manifolds to understand the dynamics underlying the formation of bridges and tails. They considered the galaxies as point masses and also used the restricted three-body approach. They studied the positions and stability of the Lagrangian points in this system and found that, at least for such a simplified model, manifold shapes allow for bridges and tails with realistic shapes and properties.
4 Surface density radial profiles: Breaks and outer discs
Radial luminosity profiles are available for a large number of disc galaxies, both spirals and S0s, and in many wavelengths. The inner parts of these profiles are dominated by the light from the classical bulge and/or from the discy pseudobulge333See [Kormendy & Kennicutt (2004)] and [Athanassoula (2005)] for a discussion of the different types of bulges.. Beyond that, at radii where the disc is the main contributor to the luminosity, the radial profile shows single, double, or even multiple segments of exponential profiles. Single exponential profiles are called type I, while the double ones are known either as type II (downbending), or type III (upbending, or anti-truncating), depending on whether the decrease of the luminosity with radius in the outer parts is more, or less, steep than that of the inner parts (e.g. [Freeman 1970], [Pohlen et al. 2002], [Pohlen & Trujillo 2006], [Erwin et al. 2008], [Gutierrez et al. 2011], [Muñoz-Mateos et al. 2013], [Laine et al. 2014], [Kim et al. 2014]). The radius at which the inner and outer exponential profiles intersect is known as the break radius.
Here I will discuss the formation and evolution of such profiles in the context of models in which a disc galaxy forms from a major merger. Such models are described in some detail in [Athanassoula et al. (2016a)], which I will hereafter refer to as A16a, while their salient features are summarised in the Appendix. Peschken, Athanassoula & Rodionov (2016, hereafter P16) and Athanassoula, Peschken & Rodionov (2016b, hereafter A16b) analysed about 100 such simulations. The results of Sect. 4.1 and 4.2 come from these works and should be considered as preliminary. They are also restricted to type II profiles. No type I model was found in these models and for types III, the reader is referred to A16b, and to the references therein.
4.1 Profiles of type II: General considerations and trends with age and time
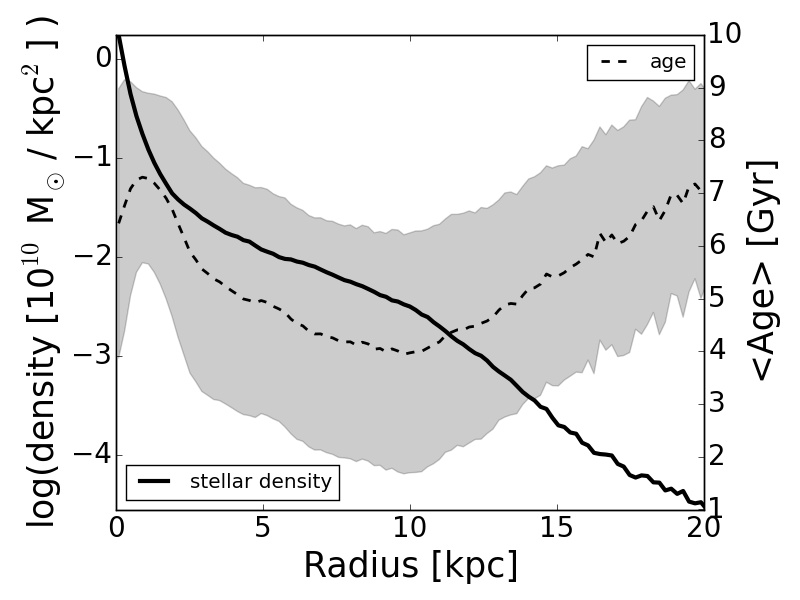
Profiles of type II are the most common ones both in observations of field galaxies (e.g. [Pohlen & Trujillo 2006], [Erwin et al. 2008], [Laine et al. 2014]) and in simulations, and thus have been more extensively studied. Fig. 1 shows a clear example of such a profile (solid line) from one of the models described in A16a. It also shows the mean age of the stars as a function of radius (dashed line). This has a U shape with a clear minimum at a location roughly coinciding with that of the break. These characteristic profile shapes for the density/luminosity and the age, as well as the coincidence of the break radius with the location of the minimum of the age profile have been often observed in disc galaxies (e.g. [Bakos, Trujillo & Pohlen 2008], and [Azzolini, Trujillo & Beckman 2008a], but see also e.g. [Roediger et al. 2012], and [Ruiz-Lara et al. 2016] for a different point of view), as well as in simulations with isolated disc galaxy initial conditions ([Roskar et al. 2008]).
The simulations of A16b show also that the radial surface density profile of the disc component evolves secularly, and in particular that the break radius increases considerably with time in good agreement with the observations of [Perez (2004)], of [Azzolini, Trujillo & Beckman (2008b)] and [Muñoz-Mateos et al. (2011)], as well as with a general inside-out growth of the disc component.
It is also possible to get information on the evolution using fossil records, i.e. examining separately populations of different ages. A16b define their mono-age populations in two different ways. In the first, they follow [Martig, Minchev & Flynn (2014)] and divide the simulation time (from 0 to 10 Gyr) in age brackets of equal duration. Since the evolution is not very rapid A16b use only five age brackets, calculate the radial profiles and measure the breaks and the inner and outer disc scale lengths for each age bracket separately. In the second way, A16b divide the time into brackets of unequal lengths whose limits are set by landmark times, i.e. times that strongly mark the evolution, like the merging time and the time after which the thin disc starts forming (see A16a). In both cases they find that the break radii are, to within the measuring errors, independent of the age bracket chosen, while inner (outer) disc scale length decreases (increases) as the age of the population increases. This is in good agreement with observations as shown e.g. for NGC 4244 by [de Jong et al. (2007)], for NGC 7793 by [Radburn-Smith et al. (2012)] and for our Galaxy e.g. by [Sale et al. (2010)], and by references therein.
To test an extreme population difference, A16b also compared the break radius of the star forming gas to that of the total stellar component at t=10 Gyr for their sample of simulations. They find them to be equal to within the measuring errors, again in good agreement with observations. Indeed, this is what was found by [Muñoz-Mateos (2014)], who compared the radial projected density profile of the molecular gas to that of the old stellar population of NGC 5985, as obtained by the Spitzer Survey of Stellar Structure in Galaxies (S4G, [Sheth et al. 2010]).
4.2 Profiles of type II: Trends with angular momentum
An interesting question in this context is the relation between the final stellar density distribution in the galaxy and the total angular momentum of the system. A number of works (e.g. [Dalcanton, Spergel & Summers 1997], [Kim & Lee 2013], [Herpich et al. 2015]) examined this question in the framework of isolated disc galaxy formation. P16 extended this to the scenario proposed in A16a. In this case, except for the internal angular momentum of the two protogalaxies, one should take into account also the orbital angular momentum and it is not clear how this will influence the final stellar density distribution and what the global effect of the merging on this distribution will be. The simulation galaxies used in P16 have a few properties in common, namely they have the same baryonic to total mass ratio and the same initial mass distributions in the dark matter as well as in the gaseous haloes. Furthermore, in order to be able to make comparisons between galaxies in the same evolutionary stage, P16 considered all remnants roughly 8 Gyr after the merging started. They include, however, different protogalaxy mass ratios (varying between 1:1 and 1:3), a number of different orbits of the protogalaxies, different halo spin parameters, different orientations of the discs before the merging, and even different numerical modellings, e.g. with or without AGN feedback.
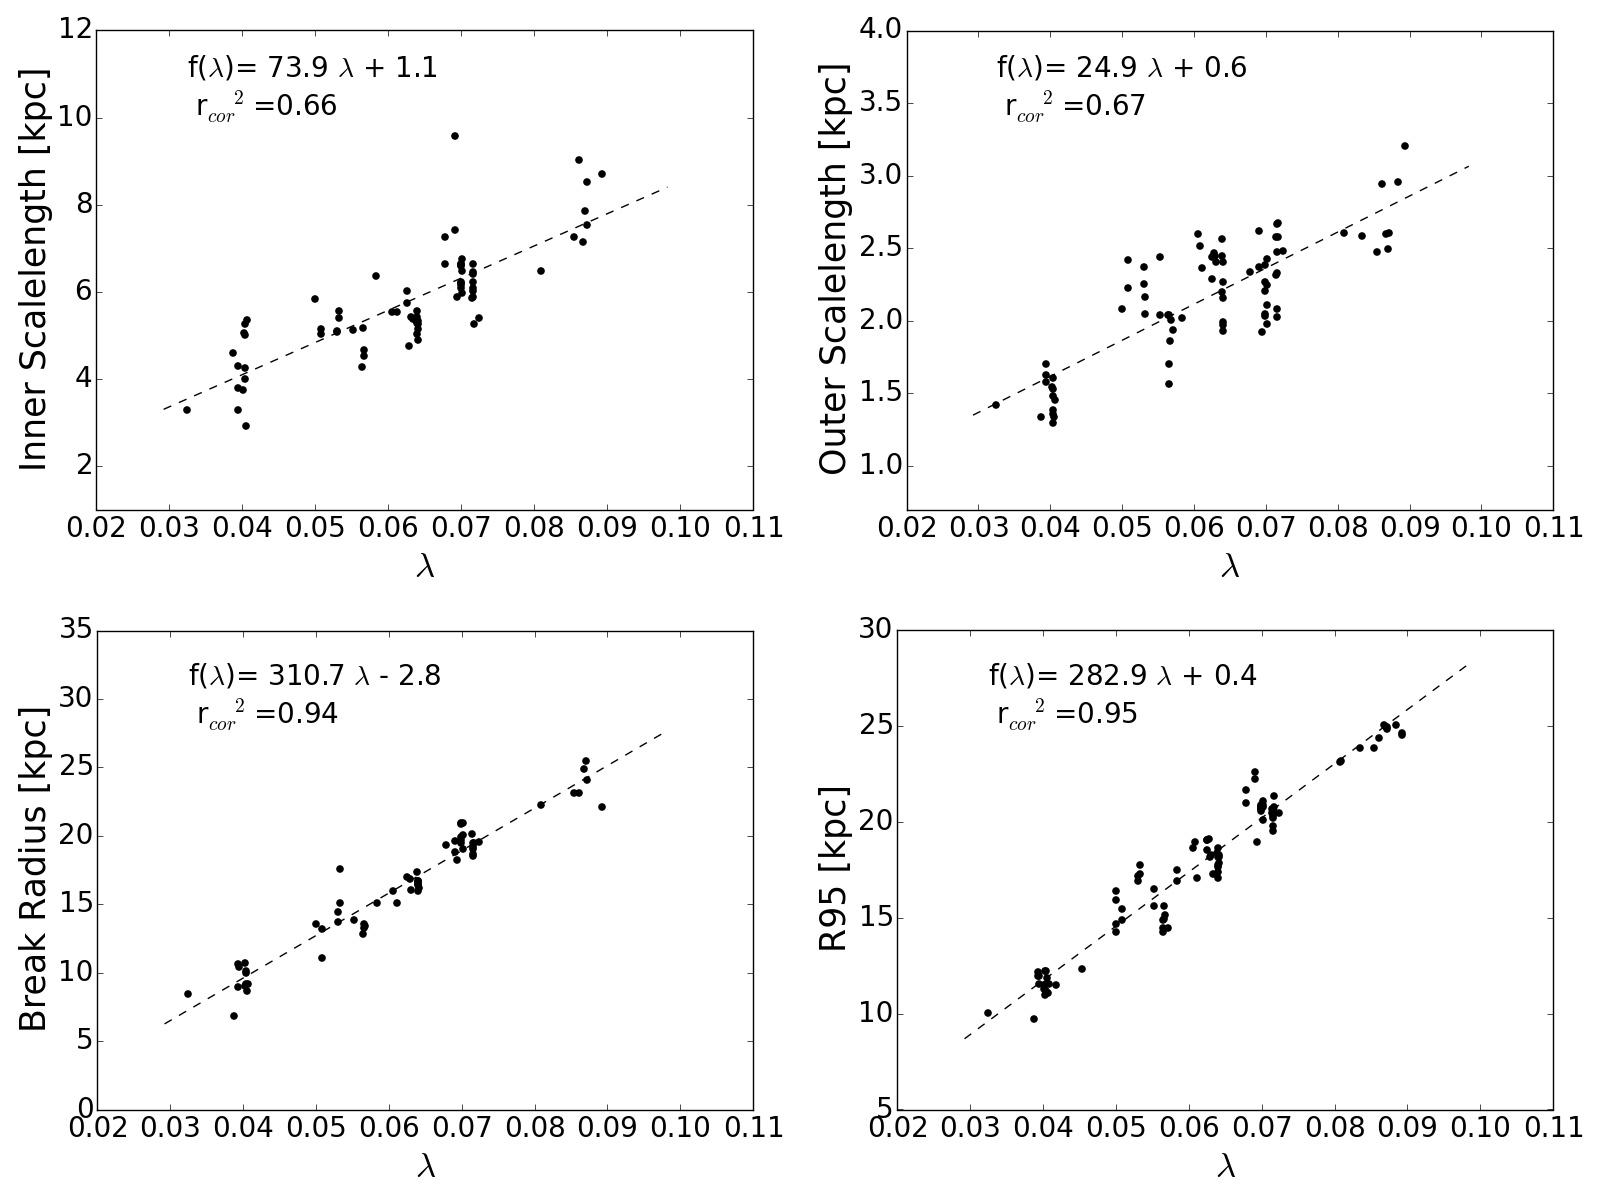
P16 also calculated for these remnants the normalised values of the angular momentum defined as . Here , and are the total energy, angular momentum and mass of the system, respectively, and is the gravitational constant. Fig. 2 shows four characteristic radii of the density distribution as a function of . These are the inner and the outer disc scalelengths, the break radius, and , the spherical radius containing 95% of the total stellar mass. This figure includes all simulations for which the corresponding fit to the disc radial density profile was considered satisfactory. As found in P16, there is a clear correlation in all panels, showing that a simulation with larger angular momentum will result in more extended discs (inner and outer). Qualitatively, this means that, for a given initial baryonic mass, the extent of the disc galaxy formed from the remnant will be larger when the angular momentum is larger, as expected.
Note that the quantity most affected by the angular momentum is the break radius, while the least affected is the outer disc scale length. Indeed, as can be seen from the slopes of the four regression lines in Fig. 2, for a given change in , the change of the break radius is roughly 12 times more than the corresponding change for the outer disc scale length. Note also that the correlations with the break radius and with are considerably tighter than the ones with the disc scalelengths.
Acknowledgements.
I thank the organisers for inviting me to review dynamical models of the outskirts of disc galaxies in this interesting and inspiring meeting. This work was supported by the DAGAL network from the People Programme (Marie Curie Actions) of the European Union’s Seventh Framework Programme FP7/2007-2013/ under REA grant agreement PITN-GA-2011-289313, and by the CNES (Centre National dude’s Spatiales - France). I also thank my collaborators A. Bosma, S. Rodionov, N. Peschken and J.-C. Lambert for many useful discussions, help with technical aspects and encouragement. This work was granted access to the HPC resources of [TGCC/CINES/IDRIS] under the allocation 2016047665 made by GENCI. It was also granted access to the HPC resources of Aix-Marseille Université financed by the project Equip@Meso (ANR-10-EQPX-29-01) of the program “Investissements d Avenir” supervised by the Agence Nationale de la Recherche. AppendixThe simulations discussed in Sect. 4 start off with two protogalaxies composed each of a slowly rotating sphere of dark matter and hot gas (A16). The orbits of these protogalaxies are such as to lead to a merging. The gas in each protogalaxy starts cooling from the beginning of the simulation (i.e. well before the merging) and falls towards the equatorial plane of its protogalaxy, starting to form a disc component there. The properties of these protogalaxies before the merging occurs are nearer to those of galaxies at intermediate redshifts than those of nearby spirals, as they should (A16). Indeed they are smaller, more gas rich, more lumpy and less dynamically relaxed than the latter. During the collision the two protogalaxy haloes merge into a single one, while the stars born in the protogalaxies undergo violent relaxation and form a classical bulge. Stars born during the collision or very shortly after it undergo more like a strong shuffling and a large fraction of them start forming the thick disc component. After the merging is completed, the thin disc starts forming from the gas accreting from the now common halo (A16). Thus the classical bulge is made of the oldest stars and has kinematics as those of the observed classical bulges, the thin disc consists of the youngest stars and shows strong rotation while the thick disc has an intermediate age population and rotates slower than the thin disc. A16 find that this simple model does surprisingly well when compared to observations. Comparisons include the stellar and gaseous projected surface density profiles, the rotation curve, the properties of the thick disc, the differences between the kinematics of the classical bulge and those of the thin disc etc. It is possible in this model to form even late type disc galaxies, with a ratio of classical bulge to total stellar mass of around 10%. A bar forms and has a very realistic morphology, including a boxy/peanut bulge, ansae and a barlens. A discy pseudobulge forms from the gas in the central region. In fact the youngest stars are found in this component, as well as in the extended spirals in the disc.
References
- [Athanassoula (2005)] Athanassoula E., 2005, MNRAS, 358, 1477
- [Athanassoula & Bosma 1985] Athanassoula, E., & Bosma, A. 1985, ARA&A, 23, 147
- [Athanassoula et al. (2016a)] Athanassoula, E., Rodionov, S., Peschken, N., & Lambert, J.C. 2016a, ApJ, 821, 90 (A16a)
- [Athanassoula et al. (2016b)] Athanassoula, E., Rodionov, S., & Peschken, N. 2016b, MNRAS, in prep. (A16b)
- [Azzolini, Trujillo & Beckman 2008a] Azzolini, R., Trujillo, I., & Beckman, J.E. 2008a, ApJ, 679L, 69
- [Azzolini, Trujillo & Beckman (2008b)] Azzolini, R., Trujillo, I., & Beckman, J.E. 2008b, ApJ, 684, 1026
- [Bakos, Trujillo & Pohlen 2008] Bakos, J., Trujillo, I., & Pohlen, M. 2008, ApJ, 683, L103
- [Barnes 1996] Barnes, J. E. 1996, Galaxies: Interactions and Induced Star Formation Saas-Fee Advanced Course 26 Lecture Notes, 275
- [Barnes & Hernquist 1992a] Barnes, J. E., & Hernquist, L. 1992a, ARA&A, 30, 705
- [Barnes & Hernquist 1992b] Barnes, J. E., & Hernquist, L. 1992b, Nature, 360, 715
- [Barnes & Hernquist 1996] Barnes, J. E., & Hernquist, L. 1996, ApJ, 471, 115
- [Bekki 1997] Bekki, K. 1997, ApJ, 490, L37
- [Bournaud & Combes 2003] Bournaud F., & Combes, F. 2003, A&A, 401, 817
- [Bournaud, Duc & Masset (2003)] Bournaud, F., Duc, P.A., & Masset, F. 2003, A&A, 411, L469
- [Brook et al. (2008)] Brook, C. B., Governato, F., Quinn, T., Wadsley, J., Brooks, A., Willman, B., Stilp, A., & Jonsson, P. 2008, ApJ, 689, 678
- [Combes & Arnaboldi 1996] Combes, F., & Arnaboldi, M. 1996, A&A, 305, 763
- [Comerón et al. 2012] Comerón, S., Elmegreen, B.G., Salo, H., et al. 2012, ApJ, 759, 98
- [Dalcanton, Spergel & Summers 1997] Dalcanton, J.J., Spergel, D.N., & Summers, F.J. 1997, ApJ, 482, 659
- [de Jong et al. (2007)] de Jong, R.S., Seth, A.C., Bell, E.F. et al. 2007, ApJ, 667, L49
- [Dubinski, Mihos & Hernquist (1996)] Dubinski, J., Mihos, J. C., & Hernquist, L. 1996, ApJ, 462, 576
- [Dubinski, Mihos & Hernquist (1999)] Dubinski, J., Mihos, J. C., & Hernquist, L. 1999, ApJ, 526, 607
- [Duc, Bournaud & Masset (2004)] Duc, P.A., Bournaud, F., & Masset, F. 2004, A&A, 427, 803
- [Erwin et al. 2005] Erwin, P., Beckman, J. E., & Pohlen, M. 2005, ApJ, 626, L81
- [Erwin et al. 2008] Erwin, P., Pohlen, M., & Beckman, J. E. 2008, AJ, 135, 20
- [Freeman 1970] Freeman, K.C. 1970, ApJ, 160, 811
- [Gutierrez et al. 2011] Gutierrez L., Erwin, P., Aladro, R., & Beckman, J.E. 2011, ApJ, 142, 145
- [Herpich et al. 2015] Herpich, J., Stinson, G.S., Dutton, A.A. et al. 2015, MNRAS, 448, 99
- [Iodice et al. 2003] Iodice, E., Arnaboldi, M., Bournaud, F., Combes, F., Sparke, L. S., van Driel, W., & Capaccioli, M. 2003, ApJ, 585, 730
- [Kim & Lee 2013] Kim, J., & Lee, J. 2013, MNRAS, 432, 1701
- [Kim et al. 2014] Kim, T. et al. 2014, ApJ, 782, 64
- [Khoperskov et al. 2014] Khoperskov, S. A., Moiseev, A. V., Khoperskov, A. V., & Saburova, A. S. 2014, MNRAS, 441, 2650
- [Kormendy & Kennicutt (2004)] Kormendy J., & Kennicutt R. C., Jr. 2004, ARA&A, 42, 603
- [Laine et al. 2014] Laine, J., Laurikainen, E., Salo, H., et al. 2014, MNRAS, 441, 1992
- [Macció, Moore & Stadel (2006)] Macció, A. V., Moore, B., & Stadel, J. 2006, ApJ, 636, L25
- [Martig, Minchev & Flynn (2014)] Martig, M., Minchev, I., & Flynn, C. 2014, MNRAS, 442, 2474
- [Mo, Mao & White (1998)] Mo, H.J., Mao, S., & White, S.D.M. 1998, MNRAS, 295, 319
- [Muñoz-Mateos et al. (2011)] Muñoz-Mateos, J.C., Boissier, S., Gil de Paz, A., et al. 2011, ApJ, 731, 10
- [Muñoz-Mateos et al. 2013] Muñoz-Mateos, J.C., Sheth, K., Gil de Paz, A. et al. 2013, ApJ, 771, 59
-
[Muñoz-Mateos (2014)]
Muñoz-Mateos, J.C. 2014,
http://www2.lowell.edu/workshops/expdisks2014/presentations/munozmateos_talk.pdf - [Perez (2004)] Perez, I. 2004, A&A, 427, L17
- [Peschken et al. (2016)] Peschken, N., Athanassoula, E., & Rodionov, S. 2016, MNRAS, in prep. (P16)
- [Pohlen et al. 2002] Pohlen, M., Dettmar, R. J., Lütticke, R., & Aronica, G. 2002, A&A, 392, 807
- [Pohlen & Trujillo 2006] Pohlen, M., & Trujillo, I. 2006, A&A, 454, 759
- [Radburn-Smith et al. (2012)] Radburn-Smith, D. J., Roskar, R., Debattista, V. P., et al. 2012, ApJ, 753, 138
- [Reshetnikov, Faúndez-Abans & de Oliveira-Abans 2011] Reshetnikov, V. P., Faúndez-Abans, M., & de Oliveira-Abans, M. 2011, AstL, 37, 171
- [Reshetnikov & Sotnikova 1997] Reshetnikov, V. P., & Sotnikova, N. 1997, A&A, 325, 933
- [Roediger et al. 2012] Roediger, J.C., Courteau, S., Sãnchez-Blãzquez, P., & McDonald, M. 2012, ApJ, 758, 41
- [Roskar et al. 2008] Roskar, R., Debattista, V. P., Stinson, G. S., et al. 2008, ApJ, 675, L65
- [Romero-Gomez & Athanassoula 2016] Romero Gomez, M., & Athanassoula, E. 2016, this volume
- [Ruiz-Lara et al. 2016] Ruiz-Lara, T., Perez, I., Florido, E., et al. 2016, MNRAS, 456, L35
- [Sackett & Sparke 1990] Sackett, P. D., & Sparke, L. S. 1990, ApJ, 361, 408
- [Sackett et al. 1994] Sackett, P. D., Rix, H.-W., Jarvis, B. J., & Freeman, K.C. 1994, ApJ, 436, 629
- [Sale et al. (2010)] Sale, S.E., Drew, J.E., Knigge, C. et al. 2010, MNRAS, 402, 713
- [Schweizer 1996] Schweizer, F. 1996, Galaxies: Interactions and Induced Star Formation Saas-Fee Advanced Course 26 Lecture Notes, 105
- [Sheth et al. 2010] Sheth, K., Regan, M., Hinz, J. L., et al. 2010, PASP, 122, 1397
- [Snaith et al. (2012)] Snaith, O. N., Gibson, B. K., Brook, C. B., et al. 2012, MNRAS, 425, 1967
- [Sparke 2004] Sparke, L. 2004, ASSL, 312, 273
- [Springel & White (1999)] Springel, V., & White, S.D.M. 1999, MNRAS, 307, 162
- [Struck 1999] Struck, C. 1999, Physics Reports, 321, 1
- [Toomre & Toomre (1972)] Toomre, A., & Toomre, J. 1972, ApJ, 178, 623
- [Tremaine & Yu 2000] Tremaine, S., & Yu, Q. 2000, MNRAS, 319, 1
- [Whitmore, McElroy & Schweizer 1987] Whitmore, B.C., McElroy, D.B., & Schweizer, F. 1987, AJ, 123, 45
- [Whitmore et al. 1990] Whitmore, B. C., Lucas, R. A., McElroy, D. B., Steiman-Cameron, T. Y., Sackett, P. D., & Olling, R. P. 1990, AJ, 100, 1489