Nonlinear electron-phonon coupling in doped manganites
Abstract
We employ time-resolved resonant x-ray diffraction to study the melting of charge order and the associated insulator-metal transition in the doped manganite Pr0.5Ca0.5MnO3 after resonant excitation of a high-frequency infrared-active lattice mode. We find that the charge order reduces promptly and highly nonlinearly as function of excitation fluence. Density functional theory calculations suggest that direct anharmonic coupling between the excited lattice mode and the electronic structure drive these dynamics, highlighting a new avenue of nonlinear phonon control.
Some of the most fascinating phenomena in condensed matter physics arise from electron-phonon interactions. A striking example is the BCS theory for superconductivity, where phonons mediate an attractive interaction between two electrons with opposite spin and momentum to allow the carriers to condensate into the superconducting state Bardeen et al. (1957). In metals and semiconductors, transport properties are also shaped by linear electron-phonon (e-ph) coupling, in particular through the creation of polarons Mahan (2000). Furthermore, e-ph coupling plays an important role in the physics of perovskite oxides such as the mixed-valence manganites, where a variety of electronic and magnetic phases is stabilized via the Jahn-Teller effect Dagotto (2003). The precarious equilibrium between these possible ground states is easily perturbed by external stimuli such as static electric or magnetic fields, temperature, pressure or even by light, opening new ways of manipulating matter on ever faster timescales with short laser pulses Miyano et al. (1997); Schmitt et al. (2008); Kampfrath et al. (2011); Coslovich et al. (2013); Mankowsky et al. (2014); Kubacka et al. (2014); Beaud et al. (2014).
The recent progress in the generation of high-energy ultrashort pulses in the mid-infrared (mid-IR) range permits to resonantly excite vibrational modes of the lattice to large amplitudes, exceeding several percent of the interatomic distances — a value at which nonlinear coupling of phonons to other degrees of freedom becomes important Rini et al. (2007); Fausti et al. (2011); Först et al. (2011). This approach enabled mode-selective material control on sub-picosecond timescales, as exemplified in the possible enhancement of superconductivity Mankowsky et al. (2014); Fausti et al. (2011), the occurrence of insulator-metal transitions and the suppression of magnetic and orbital order in manganites Rini et al. (2007); Först et al. (2011). A proposed mechanism, referred to as ’nonlinear phononics’ and based on nonlinear phonon-phonon coupling, suggests that these phenomena result from the rectification of the excited mode and a net displacement of the crystal lattice along the coordinates of anharmonically coupled vibrational modes, which control the electronic properties Mankowsky et al. (2014); Först et al. (2011); Subedi et al. (2014); Fechner and Spaldin (2016). However, a possible direct coupling between the excited mode and the electronic system has only seldomly been considered Kim et al. (2016), although, for example, the vibrational excitation of a molecular solid was shown to coherently perturb the electronic interactions by directly affecting the orbital wave functions Singla et al. (2015).
In this Letter, we explore the nonlinear electron-phonon coupling in a manganite by investigating the lattice driven ultrafast insulator-metal transition. We use resonant x-ray diffraction at the Mn K edge to study the dynamics of the electronic and structural order in a Pr0.5Ca0.5MnO3 (PCMO) thin film induced by the large-amplitude excitation of a vibrational mode with 200 fs mid-IR pulses. We then compare our experimental findings with ab initio calculations of the relevant couplings.
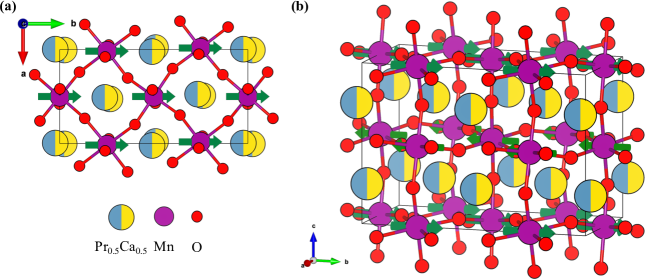
At room temperature, Pr0.5Ca0.5MnO3 is a paramagnetic semiconductor that undergoes a large distortion of the cubic perovskite structure. Charge and orbital order (COO) and antiferromagnetic (AFM) phases arise upon cooling below TCO = 240 K and TN = 150 K respectively Dagotto (2003). This so-called CE-type COO is characterized by a zig-zag arrangement of the 3d eg orbitals and a checkerboard pattern of Mn3+/Mn4+ions (Fig. 1 (a)). The long range ordering of the electrons goes in hand with a structural distortion due to the Jahn-Teller effect at the Mn3+ sites that lowers the crystal symmetry from orthorhombic Pbnm to monoclinic and a doubling of the unit cell along the b axis, leading to weak superlattice reflections of the type .
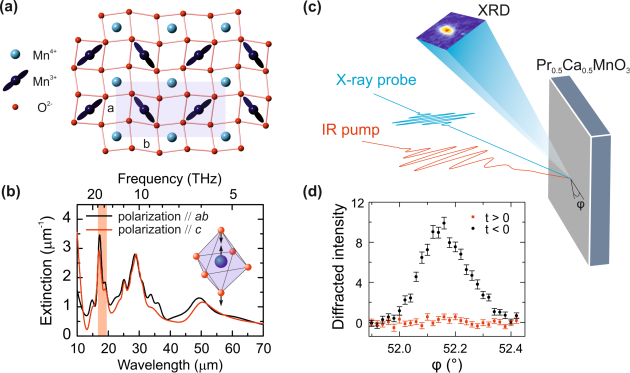
The 40 nm PCMO thin film was grown by pulsed laser deposition on a -oriented LSAT substrate, as described in Okuyama et al. (2009) and has an ordering temperature TCO of 220 K, only slightly below the reported bulk critical temperature. During the experiment, the sample was kept at 100 K, well below TCO by means of a nitrogen cryo-blower. The sample was excited with 200 fs mid-IR pulses produced by mixing the signal and idler from a high energy optical parametric amplifier (OPA) seeded by the 800nm output of an amplified Ti:S laser. The OPA output wavelength was tuned to the stretching mode of the apical Mn-O bond ( m, bandwidth ≈ 1.5 m) with a maximum energy per pulse of 33 J (Fig. 1 (b)). The subsequent dynamics were probed by resonant X-ray diffraction at the Mn K edge with monochromatized 50 fs pulses provided by the LCLS free electron laser at the SLAC National Accelerator Laboratory. To guarantee an optimum time resolution the arrival time difference between the pump and the probe was measured shot-to-shot by means of the spectral encoding technique Harmand et al. (2013). A sketch of the pump-probe experiment that was carried out at the XPP instrument Chollet et al. (2015) is shown in Fig. 1 (c). The probed area is homogenously excited due to the relatively large 280 x 750 m2 pump spot (versus 50 x 50 m2 for the X-ray beam). P-polarized light ensures maximum power transmitted into the sample. Because the penetration depth of the mid-IR (360 nm) is much larger than the film thickness (40 nm), the excitation density can be considered as uniform over the entire probed volume. Optimization of various geometrical constraints leads to the non-collinear geometry of the experiment (see Fig. 1 (c)), more details can be found in the Supplementary Informations.
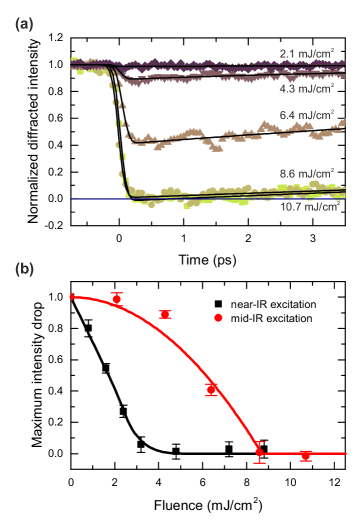
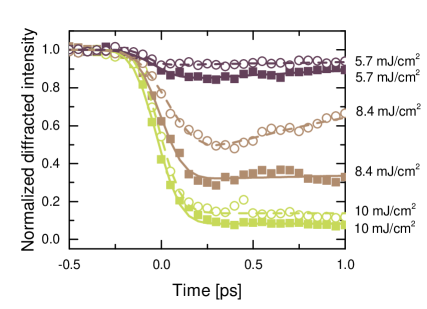
The charge order response is measured by the intensity of the reflection at the Mn K edge, which directly relates to the charge disproportionation at the Mn sites Zimmermann et al. (1999). Figure 1 (d) shows the disappearance of the Bragg peak 200 femtoseconds after excitation at a fluence of 10.7 mJ/cm2, demonstrating complete charge and orbital order melting. The dynamics of the charge order peak for different excitation fluence are shown in Figure 2 (a). Minor intensity changes are observed below 5 mJ/cm2. Above a critical fluence of f mJ/cm2, the reflection disappears within the experimental time resolution of 200 fs, clearly evidencing prompt CO melting. In a narrow range of intermediate fluences, the CO is only partially melted and recovers over several tens of picoseconds. The fluence dependence of the intensity drop, shown in Figure 2 (b), highlights this nonlinear, threshold-like behavior. In contrast, above-bandgap-excitation at near-IR 800 nm wavelengths, which directly perturbs the electronic system, results in prompt charge order melting with a linear fluence dependence Beaud et al. (2014), as shown in the overlaid data.
We performed DFT calculations to identify the lattice dynamics induced by the intense mid-infrared excitation and their effects on the electronic structure. The first principle calculations are performed in the framework of density functional theory using the generalized gradient approximation (GGA) Perdew et al. (1996) as implemented within the Vienna ab-initio simulation package (VASP) Kresse and Furthmüller (1996). All our calculations are done with the default projector augmented wave (PAW) pseudopotentials Blöchl (1994) which exhibit the following electronic configurations: Pr (6p1, 6s2, 5p6,5s2), Ca (3s2,3p6), Mn (3d5, 4s2, 3p6) and O (2s2, 2p4). To take into account strong correlation effects, we employ a DFT+U scheme Anisimov et al. (1997) with U=5.0 eV and J=0.0 eV applied to the Mn d-states. We select this value to reproduce the experimental band gap of 0.37 eV Okimoto et al. (1999). After testing the convergence of forces, phonon frequencies and anharmonic coupling constants, we chose a 3x5x7 k-point mesh in combination with a cutoff energy for the plane wave basis set of 550 eV. We further perform structural relaxations, to obtain force free reference structures, required for computations of the phonon spectra. The convergence thresholds for the electronic and ionic steps are set to 10-8 eV and 0.1 meV/Å respectively. More details on the phonon calculations are given in the Supplementary Informations. The analysis of the zone-center phonon modes reveals that only two infrared-active (IR) modes at 17.2 and 18.9 THz are significantly excited by the applied mid-IR pulse. First, we consider the anharmonic coupling of these modes to Raman modes within the framework of ‘nonlinear phononics’. As opposed to Ref. 17, however, we use the low temperature charge ordered structure (see Supplementary Informations for more details). Mapping the total energies of our DFT calculations onto the full phonon-phonon potential , we find that both excited IR modes couple only weakly (as ) to Raman modes, displacing the lattice along the coordinates of low frequency Ag modes by maximum 0.05 Å (see Supplementary Informations). This atomic motion is by more than one order of magnitudes smaller than observed in YBa2Cu3O6.5, where the enhancement of superconductivity was shown to be the consequence of such lattice anharmonicity Mankowsky et al. (2014); Fechner and Spaldin (2016). Furthermore, the PCMO bandgap reduction induced by the atomic motions of the nonlinearly coupled Ag Raman modes scales linearly with the excitation fluence (see Supplementary Informations), overall suggesting that the nonlinear phononics mechanism is likely not driving the insulator-metal transition.
Hence, we explore the changes of the electronic structure due to the atomic displacement along the coordinates of the directly excited IR mode. The CO state is stabilized by the creation of an electronic gap (Eg), whose lattice-induced alterations are computed within the frozen phonon approximation for both modes. We find a quartic reduction of the gap size as a function of both mode amplitudes, which at large values close the band gap as shown in Fig. 3 (a).
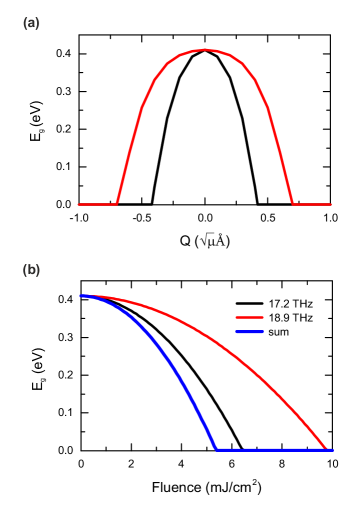
To confront this finding with the experimental observation, we calculate the fluence dependent amplitudes of the IR modes by numerically solving the equations of motion Juraschek et al. (2016). For simplicity, we assume that the electronic gap is determined by the maximum phonon amplitude of the directly driven phonon modes, which is reached at the end of the mid-IR excitation pulse. However, we cannot rule out that dynamically the gap size reduces with the time-average of these modes. Figure 3 (b) shows the calculated gap size for both individually excited modes and their summed contribution, revealing a critical pump fluence of mJ/cm2 for a full gap closure. This value is slightly lower than found experimentally. However, when taking into account the angle between the mid-IR pump electric field and the c-axis, the estimated experimental critical fluence reduces by 28% to f mJ/cm2, which is in excellent agreement with the calculation. As both the calculated gap energy and the measured (03 ̵̅0) Bragg intensity represent the square of the charge order parameter Ross et al. (2014), these quantities can be directly compared. A quadratic function fit, as expected from the square reduction of the gap energy with excitation fluence, reproduces the measured diffracted intensity drop reasonably well (see Fig. 2 (b)).
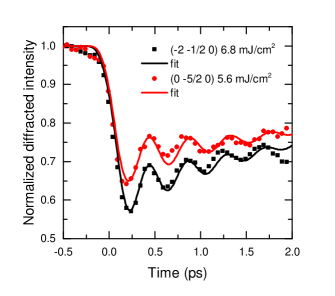
We further probed the dynamics of the crystal lattice by measuring two superlattice reflections (Fig. 4): the peak, sensitive to the Jahn-Teller distortion and orbital order at the Mn3+ sites, and the , a direct measure of the overall structural distortion that accompanies the charge and orbital ordering. The fast drop in diffracted intensity and the coherent 2.4 THz modulations for both reflections indicate a displacive excitation of atomic motions towards the high-symmetry phase triggered by the melting of the CO/OO Beaud et al. (2014); Caviezel et al. (2013). This structural relaxation closely resembles the dynamics following direct excitation of the electronic system, suggesting that in both cases the charge order melting precedes (and therefore initiates) the structural phase transition. Hence, one may conclude that mainly the Mott physics – as opposed to the Jahn-Teller effect – stabilize the ground state of this material.
The phenomenological model, describing charge order dynamics induced by exciting the electronic system in the near-IR, proposes the charge order parameter in the driven state to depend solely on the excess energy in the electronic system Beaud et al. (2014). A critical excitation density of 500 J/cm3 was required for the phase transition to occur. Assuming linear extinction, direct lattice excitation investigated here requires a significantly lower critical excitation density of 200 J/cm3 indicating, possibly, a more concerted way to reach the transient metallic state. However, once the gap becomes smaller than the photon energy, direct photo-doping into the electronic system will set in. The details of these dynamics could be experimentally investigated by monitoring the CO during the pump pulse, an experiment that requires carrier-envelope phase-stable mid-IR pulses and a high time resolution. Further insight on the energy balance between the lattice and the electrons will be gained once time-resolved dynamical calculations will become feasible for such large systems. In addition, a comprehensive characterization of the photo-induced transient state is still missing and other crucial aspects of the transition need to be explored. The spin dynamics and the magnetic ordering have been completely ignored here Li et al. (2013), yet in the manganites transport properties are tightly bound to the magnetic state.
In summary, we have shown that the melting of the charge and orbital order and the associated metal-insulator transition following coherent lattice excitation in PCMO are driven by the direct and highly nonlinear coupling between the excited IR modes and the electronic degrees of freedom. As the gap closes, the charge and orbital order is suppressed and the Jahn-Teller distortion released, triggering structural relaxation. When combined with DFT calculations, the observed nonlinear behavior is well explained by the quartic dependence of the electronic gap on the excited phonon coordinate. This is an example of a new and direct way of phonon control of materials, where the electron-phonon interaction is pushed to the nonlinear regime, allowing the coupling with odd-parity modes.
This work was supported by the NCCR Molecular Ultrafast Science and Technology (NCCR MUST), research instrument of the Swiss National Science Foundation (SNSF). Use of the Linac Coherent Light Source (LCLS), SLAC National Accelerator Laboratory, is supported by the U.S. Department of Energy, Office of Science, Office of Basic Energy Sciences under Contract No. DE-AC02-76SF00515. M.N. was supported by the Japan Science and Technology Agency (JST), PRESTO.
SUPPLEMENTARY INFORMATIONS
Pump polarization and crystal orientation
In order to excite a desired IR active phonon mode, the driving electric field has to point along a specific crystallographic direction. This is, however, not the only geometrical experimental constraint, as the crystal orientation in the laboratory frame is also defined by the diffraction condition for the reflection that is being probed. Because the pump polarization cannot be rotated (it is set horizontally in the laboratory frame) both criteria have to be fulfilled together. The only variable degrees of freedom left are then the incident angles of both beams. But other constraints are the time resolution which is optimized with collinear pump and probe beams and the diffracted intensity that is maximized at smaller grazing incidence angles. Although there is no general solution we can optimize the electric field of the pump light along a specific axis by carefully choosing the appropriate sample domain and incident angles. The pump polarization angle to the c axis is given in Table S1 for two possible domains with a mid-IR incident angle of 45∘, a grazing X-ray angle of 15∘ and at the diffraction condition. This choice of incident angles only slightly increases the time resolution from 200 to 220 fs, while keeping a decent diffracted signal and the electric pump field polarized mainly along the desired c- or to the a-axis when looking at different domains in the film.
| Domain | hkl | ||
|---|---|---|---|
Pump polarization dependence of the photo-induced phase transition
While most of the experiment has been performed on the peak of the domain, data were also taken on the domain, where the electric field of the pump is polarized in the ab-plane (Fig. 5). We observe a complete melting of the charge order for both directions of excitation. The excitation along the c-axis is, however, slightly more efficient than in the ab-plane, even more so when considering that the extinction coefficient (Fig. 1 (b)) along the a and b axes (3.2 µm-1) is larger than along the c-axis (2.9 m).The difference in efficiency could be explained by a small difference in the coupling strength to the electronic degrees of freedom. This is interesting, as the charge and orbital order develop within the ab-plane and one might intuitively expect that atomic motion within this plane would couple more strongly to the underlying electronic order.
Calculation of the phonon mode
We treat the chemical 50/50 mixing of Pr and Ca in PCMO with a supercell approach, where either a Pr or Ca atoms occupy half of the A-sites positions within the 40 atoms unit cell. In total, we generated four unit cells with different distributions of Ca and Pr. Next, we compute for these four different configurations the total energies for different antiferromagnetic arrangements of the Mn spin moments. An A-type ordering (Fig. 6) is found as the lowest energy magnetic ordering. The real magnetic unit cell is bigger than the supercell considered here and thus cannot be used. This however has only little influence to the result, a different magnetic ordering only slightly changing the size of the gap. For this magnetic structure we then relax the atomic positions within the unit cell. We list the structural data of one exemplary unit cell after the force minimization in Table S2. During the structural relaxation, the symmetry of the crystal was constrained to the space group, which corresponds to the symmetry of the charge ordered (CO) state Goff and Attfield (2004). Overall, our obtained structures exhibit a good agreement with the experimental data of Goff et al Goff and Attfield (2004), also given in Table 2.
| Lattice constants | a (DFT) | a (EXP) | b (DFT) | b (EXP) | c (DFT) | c (EXP) | |
| 10.91 Å | 10.87 Å | 7.52 Å | 7.49 Å | 5.44 Å | 5.43 Å | ||
| Atomic positions | |||||||
| Atom | Wykoff position | x (DFT) | x (EXP) | y (DFT) | y (EXP) | z (DFT) | z (EXP) |
| Pr/Ca | e | -0.012 | -0.014 | 0.250 | 0.250 | 0.002 | 0.008 |
| Pr/Ca | e | -0.268 | -0.266 | 0.250 | 0.250 | 0.485 | 0.490 |
| Pr/Ca | e | 0.477 | 0.485 | 0.250 | 0.250 | 0.011 | 0.009 |
| Pr/Ca | e | 0.232 | 0.238 | 0.250 | 0.250 | 0.499 | 0.491 |
| Mn1 | f | 0.255 | 0.246 | 0.498 | 0.492 | 0.008 | 0.008 |
| Mn2a | c | 0.000 | 0.000 | 0.000 | 0.000 | 0.500 | 0.500 |
| Mn2b | d | 0.500 | 0.500 | 0.000 | 0.000 | 0.500 | 0.500 |
| O1 | e | 0.001 | 0.008 | 0.250 | 0.250 | -0.434 | -0.436 |
| O2 | e | -0.239 | -0.249 | 0.250 | 0.250 | -0.078 | -0.075 |
| O3 | e | -0.487 | -0.492 | 0.250 | 0.250 | -0.415 | -0.422 |
| O4 | e | 0.256 | 0.259 | 0.250 | 0.250 | -0.074 | -0.066 |
| O5 | f | 0.355 | 0.360 | 0.460 | 0.461 | 0.299 | 0.293 |
| O6 | f | -0.110 | -0.106 | -0.464 | -0.452 | -0.224 | -0.224 |
| O7 | f | -0.139 | -0.144 | 0.464 | 0.469 | 0.263 | 0.262 |
| O8 | f | 0.392 | 0.386 | -0.455 | -0.468 | -0.212 | -0.208 |
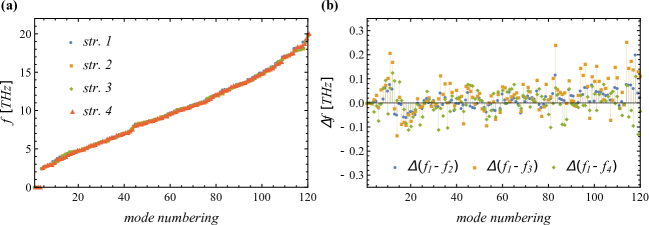
Next, we compute the phonon frequencies at the zone center (q=(0,0,0)) for all four structures by calculating the force constant matrix using a finite difference approach as implemented in the Phonopy software package Togo and Tanaka (2015). The 40 atoms unit cell exhibit 117 non-translational modes which are spanned by the irreducible representations of the 2/m point group. There are explicitly 31 Ag modes, 28 Au modes, 35 Bu modes and 23 Bg modes. We note that the Au and Bu modes exhibit a polarization along the c and a-b axis, respectively.
We show the computed phonon frequencies for the four distinct distributions of Pr and Ca atoms in Fig. 7 (a). All four structures exhibit very similar phonon frequencies. To quantify this observation, we computed further how the frequencies of the phonon modes changes between the four structures and show these differences in Fig. 7 (b). Each specific mode frequency does not vary more than 0.3 THz between the different structural configurations. Consequently, due to the insensitivity of the phononic system of PCMO on the Pr and Ca distribution, we concentrate in the following our discussion on one configuration with its structure given in Table 2.
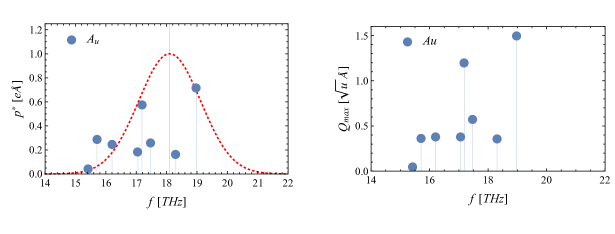
In the next step, we determine the mode displacement due to the excitation by a THz pulse. We thereby follow the approach of Jurascheck et al. Juraschek et al. (2016) and solve the dynamical equation for a harmonic oscillator driven by a pulsed excitation. The resulting displacement of the mode depends on both the mode specific dipole moment p* and the matching of pulse bandwidth and mode frequencies. We show in Fig. 7 (a),(b) the mode polarities and the resulting displacements of polar modes due to the excitation with the THz pump pulse provided during the experiment. The data shown are restricted to the Au modes with the polarization along the c-axis corresponding to the experiment. Two modes exhibit a significant dipole moment (Fig. 8 (a)) and are found to be significantly excited by the THz pulse (Fig. 8 (b)). The main anharmonic displacements and changes in the electronic structure will be driven by the largest polar modes displacements. Consequently, we focus in the following on these two modes with frequencies 17.2 THz and 18.9 THz.
Anharmonic phonon coupling
We also explore the anharmonic coupling of the two excited polar modes to other modes, comparable to the analysis by Subedi et al Subedi et al. (2014). We restrict our analysis to the cubic coupling of potential given in the main text. Similar to Refs. Fechner and Spaldin (2016); Juraschek et al. (2016), we compute by performing frozen phonon calculations and fitting the resulting energy landscape to the potential given in the main text. We note that the cubic coupling is only allowed between the polar mode and modes of Ag symmetry. Consequently, we performed 62 separate calculations for each pair of polar and Ag mode. Figure 9 (a) shows an overview of the obtained coupling constants over the entire frequency range. We note that the found cubic coupling constants are small compared to other materials as given in Refs Subedi et al. (2014); Fechner and Spaldin (2016); Juraschek et al. (2016). Cubic anharmonicities between polar and Ag modes cause transient structural modulations by the Ag mode which are driven by the polar mode displacement Fechner and Spaldin (2016). The size of these modulations is given by
| (1) |
Thus beside the coupling constants, the excitation strength of the polar mode and the mode frequency of the Ag mode also influence the displacement of the Ag mode. To quantify the distortion created by the cubic anharmonicities we evaluate Eqn. 1 for our computed coupling constants in combination with the amplitudes of the polar mode created by the largest fluences. Figure 9 (b) shows the resulting displacements of Ag modes created by both polar modes. Overall, we find that cubic anharmonicities only create negligible to small displacements of the Ag modes. Mode amplitudes of 0.05 /Å correspond to average atomic displacements of 0.02 pm, which are too small to exhibit a sizeable effect.
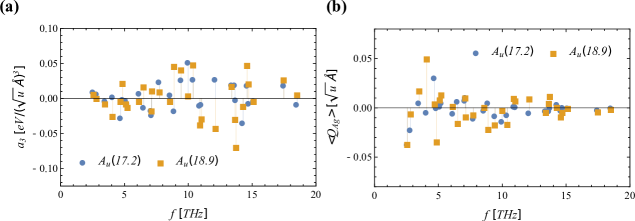
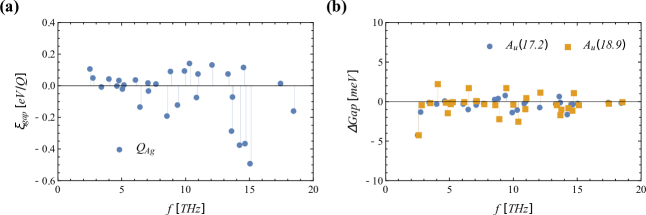
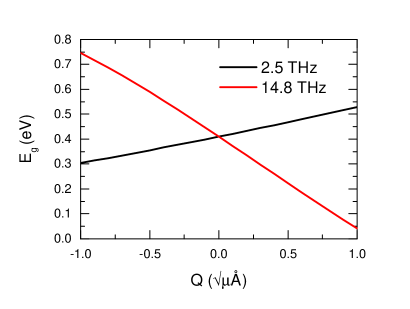
Although the induced distortions are very small, we checked the behavior of the gap as a function of the Raman modes amplitudes and their corresponding displacements. These results are summarized in Fig. 10. Some modes indeed couple strongly to the gap (Fig. 10 (a)); however these are high frequency modes whose displacements are tiny, resulting in a negligible change of the gap energy (Fig. 10 (b)). In Figure 11, we show the gap as a function of the mode amplitude for two Raman phonons: a mode at 2.4 THz, which is displaced the most and a mode at 14.8 THz, which has a large effect on the gap. The gap depends linearly on the mode amplitude and the direction of the displacement leads to a reduction of the gap, as predicted by Subedi et al. in Ref. Subedi et al. (2014). However, the overall contribution of the Raman modes is estimated to -15 meV, clearly too small to induce the transition to the metallic state.
References
- Bardeen et al. (1957) J. Bardeen, L. N. Cooper, and J. R. Schrieffer, Phys. Rev. 108, 1175 (1957).
- Mahan (2000) G. D. Mahan, Many-particle physics, 3rd ed. (Springer Science & Business Media, 2000).
- Dagotto (2003) E. Dagotto, Nanoscale phase separation and colossal magnetoresistance: the physics of manganites and related compounds (Springer, 2003).
- Miyano et al. (1997) K. Miyano, T. Tanaka, Y. Tomioka, and Y. Tokura, Phys. Rev. Lett. 78, 4257 (1997).
- Schmitt et al. (2008) F. Schmitt, P. S. Kirchmann, U. Bovensiepen, R. G. Moore, L. Rettig, M. Krenz, J.-H. Chu, N. Ru, L. Perfetti, D. Lu, et al., Science 321, 1649 (2008).
- Kampfrath et al. (2011) T. Kampfrath, A. Sell, G. Klatt, A. Pashkin, S. Mährlein, T. Dekorsy, M. Wolf, M. Fiebig, A. Leitenstorfer, and R. Huber, Nature Photonics 5, 31 (2011).
- Coslovich et al. (2013) G. Coslovich, B. Huber, W.-S. Lee, Y.-D. Chuang, Y. Zhu, T. Sasagawa, Z. Hussain, H. Bechtel, M. Martin, Z.-X. Shen, et al., Nat. Comm. 4 (2013).
- Mankowsky et al. (2014) R. Mankowsky, A. Subedi, M. Först, S. Mariager, M. Chollet, H. Lemke, J. Robinson, J. Glownia, M. Minitti, A. Frano, et al., Nature (London) 516, 71 (2014).
- Kubacka et al. (2014) T. Kubacka, J. A. Johnson, M. C. Hoffmann, C. Vicario, S. de Jong, P. Beaud, S. Grübel, S.-W. Huang, L. Huber, L. Patthey, Y.-D. Chuang, J. J. Turner, G. L. Dakovski, W.-S. Lee, M. P. Minitti, W. Schlotter, R. G. Moore, C. P. Hauri, S. M. Koohpayeh, V. Scagnoli, G. Ingold, S. L. Johnson, and U. Staub, Science 343, 1333 (2014).
- Beaud et al. (2014) P. Beaud, A. Caviezel, S. Mariager, L. Rettig, G. Ingold, C. Dornes, S. Huang, J. Johnson, M. Radovic, T. Huber, et al., Nat. Mater. 13, 923 (2014).
- Rini et al. (2007) M. Rini, N. Dean, J. Itatani, Y. Tomioka, Y. Tokura, R. W. Schoenlein, A. Cavalleri, et al., Nature (London) 449, 72 (2007).
- Fausti et al. (2011) D. Fausti, R. Tobey, N. Dean, S. Kaiser, A. Dienst, M. C. Hoffmann, S. Pyon, T. Takayama, H. Takagi, and A. Cavalleri, Science 331, 189 (2011).
- Först et al. (2011) M. Först, C. Manzoni, S. Kaiser, Y. Tomioka, Y. Tokura, R. Merlin, and A. Cavalleri, Nat. Phys. 7, 854 (2011).
- Först et al. (2011) M. Först, R. I. Tobey, S. Wall, H. Bromberger, V. Khanna, A. L. Cavalieri, Y.-D. Chuang, W. S. Lee, R. Moore, W. F. Schlotter, J. J. Turner, O. Krupin, M. Trigo, H. Zheng, J. F. Mitchell, S. S. Dhesi, J. P. Hill, and A. Cavalleri, Phys. Rev. B 84, 241104 (2011).
- Subedi et al. (2014) A. Subedi, A. Cavalleri, and A. Georges, Phys. Rev. B 89, 220301 (2014).
- Fechner and Spaldin (2016) M. Fechner and N. A. Spaldin, Phys. Rev. B 94, 134307 (2016).
- Kim et al. (2016) M. Kim, Y. Nomura, M. Ferrero, P. Seth, O. Parcollet, and A. Georges, Phys. Rev. B 94, 155152 (2016).
- Singla et al. (2015) R. Singla, G. Cotugno, S. Kaiser, M. Först, M. Mitrano, H. Y. Liu, A. Cartella, C. Manzoni, H. Okamoto, T. Hasegawa, S. R. Clark, D. Jaksch, and A. Cavalleri, Phys. Rev. Lett. 115, 187401 (2015).
- Tobe et al. (2004) K. Tobe, T. Kimura, and Y. Tokura, Phys. Rev. B 69, 014407 (2004).
- Okuyama et al. (2009) D. Okuyama, M. Nakamura, Y. Wakabayashi, H. Itoh, R. Kumai, H. Yamada, Y. Taguchi, T. Arima, M. Kawasaki, and Y. Tokura, Appl. Phys. Lett. 95, 152502 (2009).
- Harmand et al. (2013) M. Harmand, R. Coffee, M. Bionta, M. Chollet, D. French, D. Zhu, D. Fritz, H. Lemke, N. Medvedev, B. Ziaja, et al., Nat. Phot. 7, 215 (2013).
- Chollet et al. (2015) M. Chollet, R. Alonso-Mori, M. Cammarata, D. Damiani, J. Defever, J. T. Delor, Y. Feng, J. M. Glownia, J. B. Langton, S. Nelson, K. Ramsey, A. Robert, M. Sikorski, S. Song, D. Stefanescu, V. Srinivasan, D. Zhu, H. T. Lemke, and D. M. Fritz, Journal of Synchrotron Radiation 22, 503 (2015).
- Zimmermann et al. (1999) M. v. Zimmermann, J. P. Hill, D. Gibbs, M. Blume, D. Casa, B. Keimer, Y. Murakami, Y. Tomioka, and Y. Tokura, Phys. Rev. Lett. 83, 4872 (1999).
- Perdew et al. (1996) J. P. Perdew, K. Burke, and M. Ernzerhof, Physical review letters 77, 3865 (1996).
- Kresse and Furthmüller (1996) G. Kresse and J. Furthmüller, Physical review B 54, 11169 (1996).
- Blöchl (1994) P. E. Blöchl, Physical Review B 50, 17953 (1994).
- Anisimov et al. (1997) V. I. Anisimov, F. Aryasetiawan, and A. Lichtenstein, Journal of Physics: Condensed Matter 9, 767 (1997).
- Okimoto et al. (1999) Y. Okimoto, Y. Tomioka, Y. Onose, Y. Otsuka, and Y. Tokura, Phys. Rev. B 59, 7401 (1999).
- Juraschek et al. (2016) D. M. Juraschek, M. Fechner, and N. A. Spaldin, arXiv preprint arXiv:1607.01653 (2016).
- Ross et al. (2014) K. A. Ross, Y. Qiu, J. R. D. Copley, H. A. Dabkowska, and B. D. Gaulin, Phys. Rev. Lett. 112, 057201 (2014).
- Caviezel et al. (2013) A. Caviezel, S. O. Mariager, S. L. Johnson, E. Möhr-Vorobeva, S. W. Huang, G. Ingold, U. Staub, C. J. Milne, S.-W. Cheong, and P. Beaud, Phys. Rev. B 87, 205104 (2013).
- Li et al. (2013) T. Li, A. Patz, L. Mouchliadis, J. Yan, T. A. Lograsso, I. E. Perakis, and J. Wang, Nature 496, 69 (2013).
- Goff and Attfield (2004) R. J. Goff and J. P. Attfield, Phys. Rev. B 70, 140404 (2004).
- Togo and Tanaka (2015) A. Togo and I. Tanaka, Scripta Materialia 108, 1 (2015).