Cosmic evolution and metal aversion in super-luminous supernova host galaxies
Abstract
The SUperluminous Supernova Host galaxIES (SUSHIES) survey aims to provide strong new constraints on the progenitors of superluminous supernovae (SLSNe) by understanding the relationship to their host galaxies. We present the photometric properties of 53 H-poor and 16 H-rich SLSN host galaxies out to . We model their spectral energy distributions to derive physical properties, which we compare with other galaxy populations. At low redshift, H-poor SLSNe are preferentially found in very blue, low-mass galaxies with high average specific star-formation rates. As redshift increases, the host population follows the general evolution of star-forming galaxies towards more luminous galaxies. After accounting for secular evolution, we find evidence for differential evolution in galaxy mass, but not in the -band and the far UV luminosity ( confidence). Most remarkable is the scarcity of hosts with stellar masses above for both classes of SLSNe. In the case of H-poor SLSNe, we attribute this to a stifled production efficiency above solar metallicity. However, we argue that, in addition to low metallicity, a short-lived stellar population is also required to regulate the SLSN production. H-rich SLSNe are found in a very diverse population of star-forming galaxies. Still, the scarcity of massive hosts suggests a stifled production efficiency above solar metallicity. The large dispersion of the H-rich SLSNe host properties is in stark contrast to those of gamma-ray burst, regular core-collapse SN, and H-poor SLSNe host galaxies. We propose that multiple progenitor channels give rise to this sub-class.
keywords:
galaxies: evolution, mass function, starburst, star-formation, supernovae: general1 Introduction
In the past decade, untargeted supernova (SN) surveys, e.g., the Texas SN Search (Quimby et al. 2005), the ROTSE SN Verification Project (Yuan et al. 2007), the Palomar Transient Factory (PTF; Law et al. 2009), and Pan-STARRS (PS; Tonry et al. 2012), discovered a new class of SNe with peak magnitudes exceeding mag (Gal-Yam 2012). These so-called super-luminous supernovae have been a focus of SN science ever since, because of the opportunity they provide to study new explosion channels of very massive stars in the distant Universe (Howell et al. 2013; Cooke et al. 2012), the interstellar medium (ISM) in distant galaxies (Berger et al. 2012; Vreeswijk et al. 2014) and their potential use for cosmology (Inserra & Smartt 2014; Scovacricchi et al. 2016). In addition, SLSNe provide a new opportunity to pinpoint star-forming galaxies independently of galaxy properties, which can ultimately lead to a better understanding of galaxy evolution at the faint-end of luminosity and mass (Lunnan et al. 2014; Leloudas et al. 2015c; Angus et al. 2016; Chen et al. 2017; Perley et al. 2016b). Despite these prospects, SLSNe are very rare. At , one H-poor SLSN is expected to be produced for every 1000–20000 core-collapse SNe (hydrogen-rich SLSNe have a higher rate; Quimby et al. 2013a).
Phenomenologically, SLSNe can be classified by their hydrogen content into H-poor and H-rich SLSNe. The light curves of H-poor SLSNe (SLSNe-I), identified as a new class of transients by Quimby et al. (2011c), are mag brighter and three-times broader than regular stripped-envelope SNe, but the shapes of their light-curves are similar (e.g., Quimby et al. 2011c; Inserra et al. 2013; Nicholl et al. 2015a). Early spectra of H-poor SLSNe show a characteristic w-shaped absorption feature at Å due to oxygen in the ejecta (Quimby et al. 2011c) that is usually not seen in Type Ibc SNe (e.g., Modjaz et al. 2009). About a month after maximum light, the ejecta cool down to temperatures typical of regular Type Ibc SNe at maximum light. At that point, SLSN spectra also exhibit absorption features similar to Type Ibc SNe (e.g., Pastorello et al. 2010; Inserra et al. 2013; Nicholl et al. 2014).
A subgroup of H-poor SLSNe shows exceptionally slowly-rising and slowly-declining light curves ( days, days; Nicholl et al. 2015a), hereafter called slow-declining SLSN-I. In some cases the decay slope is comparable to that of the radioactive decay of 56Ni. Gal-Yam et al. (2009) argued that in the case of SN2007bi, the supernova was powered by the radioactive decay of several solar masses of 56Ni (Gal-Yam 2012), which were synthesised during a pair-instability SN (PISN) of a star with a zero-age-main-sequence (ZAMS) mass of (e.g., Fowler & Hoyle 1964; Barkat et al. 1967; Bisnovatyi-Kogan & Kazhdan 1967; Rakavy & Shaviv 1967; Fraley 1968; Heger et al. 2003; Woosley et al. 2007). However, the SN was discovered only shortly before it reached maximum light. Information about the rise time was not available, which is critical to distinguish between SN models. The well-sampled SLSNe PTF12dam and PS1-11ap, which were spectroscopically similar to SN2007bi at late times, had rise times that were incompatible with PISN models (Nicholl et al. 2013). This also cast doubt on the PISN interpretation of SN2007bi. However, recent findings by Kozyreva et al. (2017) showed that PISN models can predict short rise times similar to that of PTF12dam. Models of PISN spectra, on the other hand, are incompatible with the spectra of PTF12dam and SN2007bi (Dessart et al. 2013; Chatzopoulos et al. 2015; Jerkstrand et al. 2016).
The energy source powering H-poor SLSNe is highly debated. The most discussed models include magnetars formed during the collapse of massive stars (e.g., Kasen & Bildsten 2010; Inserra et al. 2013), the interaction of the SN ejecta with dense H-deficient circumstellar material (CSM) expelled by the progenitor prior to the explosion (Woosley et al. 2007; Blinnikov & Sorokina 2010; Chevalier & Irwin 2011; Chatzopoulos & Wheeler 2012; Quataert & Shiode 2012; Sorokina et al. 2016), PISNe, and pulsational PISNe (e.g., Woosley et al. 2007; Yan et al. 2015).
Hydrogen-rich SLSNe are characterised by an initial blue continuum and narrow Balmer lines, similar to classical Type IIn SNe (Schlegel 1990; Filippenko 1997; Kiewe et al. 2012) which are powered by the interaction of the supernova with its circumstellar material (e.g., Chevalier & Irwin 2011). Recent observations suggest a richer phenomenology. Spectra of the SNe 2008es and 2013hx showed broad H emission components and their light curves showed a linear decline after maximum, similar to normal IIL SNe (Gezari et al. 2009; Miller et al. 2009; Inserra et al. 2016). Another intriguing object is CSS121015:004244+132827 (hereafter called CSS121015). It firstly evolved as a H-poor SN but at 49 days after the maximum, its spectrum showed broad and narrow H emission lines (Benetti et al. 2014). These properties are different from superluminous type IIn SNe. Because of the similarities to Type II SNe, we label this subclass SLSN-II.
The possible diversity of SLSN progenitors suggests ZAMS masses up to a few hundred solar masses. Given the characteristic distance scale of SLSNe, a direct search for their progenitors is unfeasible. Alternatively, host observations have the potential to indirectly provide constraints on the progenitor population. The first systematic study of a sample of 17 H-poor and -rich SLSNe by Neill et al. (2011) suggested that the hosts are low-mass galaxies with high specific star-formation rates between and . However, these measurements are very uncertain because of the limited available wavelength coverage. This initial finding was supported by studies of the hosts of SN2010gx (Chen et al. 2013) and PS1-10bzj (Lunnan et al. 2013). Their spectroscopic observations also showed that both events occurred in low-metallicity galaxies with .
A survey of 31 H-poor SLSN host galaxies by Lunnan et al. (2014) consolidated the picture of H-poor SLSNe exploding in sub-luminous low-mass dwarf galaxies with median specific star-formation rates of . Furthermore, the preference for galaxies with a median metallicity of hinted at a stifled production efficiency at high metallicity (see also Leloudas et al. 2015c). Perley et al. (2016b) confirmed this trend by modelling the mass function of 18 SLSN-I hosts at from the PTF survey (see also Chen et al. 2017). Hubble Space Telescope observations of 16 hosts of H-poor SLSNe by Lunnan et al. (2015) revealed that the locations of H-poor SLSNe are correlated with the UV light distribution within their host galaxies. Yet, they are not as strongly clustered on the UV-brightest regions of their hosts than long-duration gamma-ray bursts (GRBs; see also Angus et al. 2016; Blanchard et al. 2016), which are also connected with the death of massive stars (e.g., Woosley 2012). Furthermore, on average, the interstellar medium of SLSN-I host galaxies is characterised by significantly weaker absorption lines than GRBs (Vreeswijk et al. 2014).
In 2012, we initiated the SUperluminous Supernova Host galaxIES (SUSHIES) survey (Leloudas et al. 2015c) to characterise a large set of host galaxies of H-poor and H-rich SLSNe over a large redshift range. The goals of this survey are to study SLSN host galaxies in context of other star-forming galaxies and to place constraints on the nature of their progenitors. To achieve this, our survey has spectroscopic and imaging components to characterise the integrated host properties, such as mass, metallicity, star-formation rate, age of the stellar populations and dust attenuation.
In the first SUSHIES sample paper, Leloudas et al. (2015c) discussed the spectroscopic properties of 17 H-poor and 8 H-rich SLSN host galaxies. We showed that the host galaxies of H-poor SLSNe are characterised by hard ionisation fields, low metallicity and very high specific star-formation rates. A high number () of H-poor SLSNe at occurred in extreme emission-line galaxies (e.g., Atek et al. 2011; Amorín et al. 2014, 2015), which represent a short-lived phase in galaxy evolution following an intense starburst. Moreover, in Thöne et al. (2015) we performed spatially resolved spectroscopy of the host of PTF12dam, the most extreme host galaxy in the sample with high signal to noise, and found strong evidence for a very young stellar population at the explosion site with an age of Myr. These findings let us conclude in Leloudas et al. (2015c) that the progenitors of SLSNs are possibly the very first stars to explode in a starburst, at an earlier evolutionary stage than GRB progenitors. Therefore, not only metallicity but also age is likely a critical condition for the production of SLSN progenitors. Chen et al. (2017) and Perley et al. (2016b) questioned the importance of the age and proposed that metallicity is the primary factor for SLSN-I progenitors.
While H-poor SLSNe are preferentially found in rather extreme environments, the findings by Leloudas et al. (2015c) and Perley et al. (2016b) point to a weaker dependence on environment properties for H-rich SLSNe, e.g., higher average metallicities and softer ionisation states.
In this second sample paper of the SUSHIES survey, we present photometric data of a sample of 53 H-poor and 16 H-rich SLSN host galaxies out to , including almost every SLSN reported in the literature and detected before 2015. The scope of this paper is to provide distribution functions of physical properties, such as luminosities, masses of the stellar populations and star-formation rates, to investigate their redshift evolution and to compare these results to other samples of starburst galaxies.
Throughout the paper, we adopt a flat CDM cosmology with , , (Planck Collaboration 2014). Uncertainties and dispersions are quoted at confidence. We refer to the solar abundance compiled in Asplund et al. (2009).
| Object | R. A. | Dec. | Redshift | Type | Decline time | Reference | |
|---|---|---|---|---|---|---|---|
| (J2000) | (J2000) | (mag) | scale (days) | ||||
| Spectroscopic sample (23) | |||||||
| PS1-10bzj | 03:31:39.83 | 27:47:42.2 | 0.649 | SLSN-I | 0.01 | 37.3(fast) | [1, 2] |
| PS1-11ap | 10:48:27.73 | 57:09:09.2 | 0.524 | SLSN-I | 0.01 | 87.9 (slow) | [2, 3] |
| PTF09cnd | 16:12:08.94 | 51:29:16.1 | 0.258 | SLSN-I | 0.02 | 75.3 (slow) | [2, 4] |
| PTF10heh | 12:48:52.04 | 13:26:24.5 | 0.338 | SLSN-IIn | 0.02 | [5] | |
| PTF10hgi | 16:37:47.04 | 06:12:32.3 | 0.099 | SLSN-I | 0.07 | 35.6 (fast) | [2, 6, 7] |
| PTF10qaf | 23:35:42.89 | 10:46:32.9 | 0.284 | SLSN-IIn | 0.07 | [8] | |
| PTF10vqv | 03:03:06.84 | 01:32:34.9 | 0.452 | SLSN-I | 0.06 | [9] | |
| PTF11dsf | 16:11:33.55 | 40:18:03.5 | 0.385 | SLSN-IIn | 0.01 | [10] | |
| PTF12dam | 14:24:46.20 | 46:13:48.3 | 0.107 | SLSN-I | 0.01 | 72.5 (slow) | [2, 11] |
| SN1999as | 09:16:30.86 | 13:39:02.2 | 0.127 | SLSN-I | 0.03 | [8, 12] | |
| SN1999bd | 09:30:29.17 | 16:26:07.8 | 0.151 | SLSN-IIn | 0.03 | [8, 13] | |
| SN2006oz | 22:08:53.56 | 00:53:50.4 | 0.396 | SLSN-I | 0.04 | [14] | |
| SN2006tf11footnotemark: | 12:46:15.82 | 11:25:56.3 | 0.074 | SLSN-IIn | 0.02 | [15] | |
| SN2007bi22footnotemark: | 13:19:20.00 | 08:55:44.0 | 0.128 | SLSN-I | 0.02 | 84.5 (slow) | [2, 16, 17] |
| SN2008am | 12:28:36.25 | 15:35:49.1 | 0.233 | SLSN-IIn | 0.02 | [18] | |
| SN2009jh33footnotemark: | 14:49:10.08 | 29:25:11.4 | 0.349 | SLSN-I | 0.01 | 60.6 (slow) | [2, 4] |
| SN2010gx44footnotemark: | 11:25:46.71 | 08:49:41.4 | 0.230 | SLSN-I | 0.03 | 29.1 (fast) | [2, 4, 19] |
| SN2010kd | 12:08:01.11 | 49:13:31.1 | 0.101 | SLSN-I | 0.03 | [20, 21] | |
| SN2011ke55footnotemark: | 13:50:57.77 | 26:16:42.8 | 0.143 | SLSN-I | 0.01 | 25.7 (fast) | [2, 6] |
| SN2011kf66footnotemark: | 14:36:57.53 | 16:30:56.6 | 0.245 | SLSN-I | 0.02 | 28.5 (fast) | [2, 6] |
| SN2012il77footnotemark: | 09:46:12.91 | 19:50:28.7 | 0.175 | SLSN-I | 0.02 | 23.2 (fast) | [2, 6] |
| SNLS06D4eu | 22:15:54.29 | 18:10:45.6 | 1.588 | SLSN-I | 0.02 | [22] | |
| SSS12081088footnotemark: | 23:18:01.82 | 56:09:25.7 | 0.156 | SLSN-I | 0.02 | 30.2 (fast) | [2, 23] |
| Non-spectroscopic sample (46) | |||||||
| CSS10021799footnotemark: | 10:29:12.56 | 40:42:20.0 | 0.147 | SLSN-IIn | 0.01 | [24] | |
| CSS1210151010footnotemark: | 00:42:44.34 | 13:28:26.5 | 0.286 | SLSN-II | 0.07 | 37.8 (fast) | [2, 25] |
| CSS1409251111footnotemark: | 00:58:54.11 | 18:13:22.2 | 0.460 | SLSN-I | 0.06 | [26] | |
| DES14S2qri | 02:43:32.14 | 01:07:34.2 | 1.500 | SLSN-I | 0.03 | [27] | |
| DES14X2byo | 02:23:46.93 | 06:08:12.3 | 0.869 | SLSN-I | 0.03 | [28] | |
| DES14X3taz | 02:28:04.46 | 04:05:12.7 | 0.608 | SLSN-I | 0.02 | [29] | |
| iPTF13ajg | 16:39:03.95 | 37:01:38.4 | 0.740 | SLSN-I | 0.01 | 62.0 (slow) | [2, 30] |
| LSQ12dlf1212footnotemark: | 01:50:29.80 | 21:48:45.4 | 0.255 | SLSN-I | 0.01 | 35.4 (fast) | [2, 23] |
| LSQ14an | 12:53:47.83 | 29:31:27.2 | 0.163 | SLSN-I | 0.07 | [31] | |
| LSQ14mo | 10:22:41.53 | 16:55:14.4 | 0.2561 | SLSN-I | 0.06 | 27.3 (fast) | [2, 32] |
| LSQ14bdq | 10:01:41.60 | 12:22:13.4 | 0.345 | SLSN-I | 0.06 | 71.2 (slow) | [2, 33] |
| LSQ14fxj | 02:39:12.61 | 03:19:29.6 | 0.360 | SLSN-I | 0.03 | [34] | |
| MLS1211041313footnotemark: | 02:16:42.51 | 20:40:08.5 | 0.303 | SLSN-I | 0.15 | [35, 36] | |
| PS1-10ky | 22:13:37.85 | 01:14:23.6 | 0.956 | SLSN-I | 0.03 | 32.5 (fast) | [2, 37] |
| PS1-10pm | 12:12:42.20 | 46:59:29.5 | 1.206 | SLSN-I | 0.02 | [38] | |
| PS1-10ahf | 23:32:28.30 | 00:21:43.6 | 1.100 | SLSN-I | 0.03 | [38] | |
| PS1-10awh | 22:14:29.83 | 00:04:03.6 | 0.909 | SLSN-I | 0.07 | [37] | |
| PS1-11tt | 16:12:45.78 | 54:04:17.0 | 1.283 | SLSN-I | 0.01 | [39] | |
| PS1-11afv | 12:15:37.77 | 48:10:48.6 | 1.407 | SLSN-I | 0.01 | [39] | |
| PS1-11aib | 22:18:12.22 | 01:33:32.0 | 0.997 | SLSN-I | 0.04 | [39] | |
| PS1-11bam | 08:41:14.19 | 44:01:57.0 | 1.565 | SLSN-I | 0.02 | [40] | |
| PS1-11bdn | 02:25:46.29 | 05:06:56.6 | 0.738 | SLSN-I | 0.02 | [39] | |
| PS1-12zn | 09:59:49.62 | 02:51:31.9 | 0.674 | SLSN-I | 0.02 | [39] | |
| PS1-12bmy | 03:34:13.12 | 26:31:17.2 | 1.566 | SLSN-I | 0.01 | [39] | |
| PS1-12bqf | 02:24:54.62 | 04:50:22.7 | 0.522 | SLSN-I | 0.02 | [39] | |
| PS1-13gt | 12:18:02.03 | 47:34:46.0 | 0.884 | SLSN-I | 0.02 | [39] | |
| PTF09atu | 16:30:24.55 | 23:38:25.0 | 0.501 | SLSN-I | 0.04 | [4] | |
| PTF11rks | 01:39:45.51 | 29:55:27.0 | 0.190 | SLSN-I | 0.04 | 22.3 (fast) | [2, 6, 41] |
| SCP06F6 | 14:32:27.40 | 33:32:24.8 | 1.189 | SLSN-I | 0.01 | 39.8 (fast) | [2, 42] |
| SN2003ma | 05:31:01.88 | 70:04:15.9 | 0.289 | SLSN-IIn | 0.31 | [43] | |
| SN2005ap | 13:01:14.83 | 27:43:32.3 | 0.283 | SLSN-I | 0.01 | 28.8 (fast) | [2, 44] |
| SN2006gy | 03:17:27.06 | 41:24:19.5 | 0.019 | SLSN-IIn | 0.14 | [45] | |
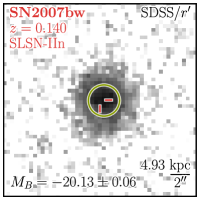
| SN2007bw1414footnotemark: | 17:11:01.99 | 24:30:36.4 | 0.140 | SLSN-IIn | 0.04 | [46] | |
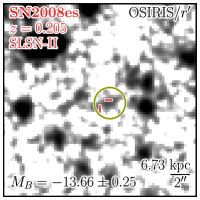
| SN2008es1515footnotemark: | 11:56:49.13 | 54:27:25.7 | 0.205 | SLSN-II | 0.01 | 38.0 (fast) | [2, 47, 48] |
| SN2008fz1616footnotemark: | 23:16:16.60 | 11:42:47.5 | 0.133 | SLSN-IIn | 0.04 | [49] | |
| SN2009de1717footnotemark: | 13:00:37.49 | 17:50:57.0 | 0.311 | SLSN-I | 0.04 | [50, 51, 52] | |
| SN2009nm1818footnotemark: | 10:05:24.54 | 51:16:38.7 | 0.210 | SLSN-IIn | 0.01 | [53, 54] | |
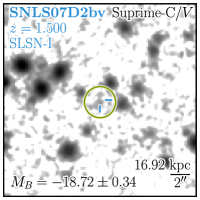
Properties of the super-luminous supernovae in our sample Object R. A. Dec. Redshift Type Decline time Reference (J2000) (J2000) (mag) (days) SN2011cp1919footnotemark: 07:52:32.61 21:53:29.7 0.380 SLSN-IIn 0.05 [55] SN2011ep2020footnotemark: 17:03:41.78 32:45:52.6 0.280 SLSN-I 0.02 [56] SN2013dg2121footnotemark: 13:18:41.38 07:04:43.1 0.265 SLSN-I 0.04 30.7 (fast) [2, 23] SN2013hx2222footnotemark: 01:35:32.83 57:57:50.6 0.130 SLSN-II 0.02 33.6 (fast) [2, 57] SN2013hy2323footnotemark: 02:42:32.82 01:21:30.1 0.663 SLSN-I 0.03 [58] SN2015bn2424footnotemark: 11:33:41.57 00:43:32.2 0.110 SLSN-I 0.02 [59] SN1000+0216† 10:00:05.87 02:16:23.6 3.899 SLSN-I 0.02 [60] SN2213-1745† 22:13.39.97 17:45:24.5 2.046 SLSN-I 0.02 [60] SNLS07D2bv 10:00:06.62 02:38:35.8 SLSN-I 0.02 [22]
2 Sample definition, observations and data reduction
2.1 Sample definition
Among all SLSNe reported in the literature (), we selected those that were discovered before the end of 2014 and announced before April 2015. Therefore, many of the SLSNe published recently by Perley et al. (2016b) are not included in this paper. In addition, we screened the Asiago Supernova catalogue (Barbon et al. 2010) for objects with an absolute magnitude of significantly brighter than mag and spectroscopic information. This revealed two additional H-poor SLSNe, SNe 2009de and 2011ep (Drake et al. 2009b; Moskvitin et al. 2010; Graham et al. 2011a), and two H-rich SLSNe, SNe 2009nm and SN2011cp (Drake et al. 2009c; Christensen et al. 2009; Drake et al. 2011c, d; Graham et al. 2011b). The SN properties are summarised in Table 1.
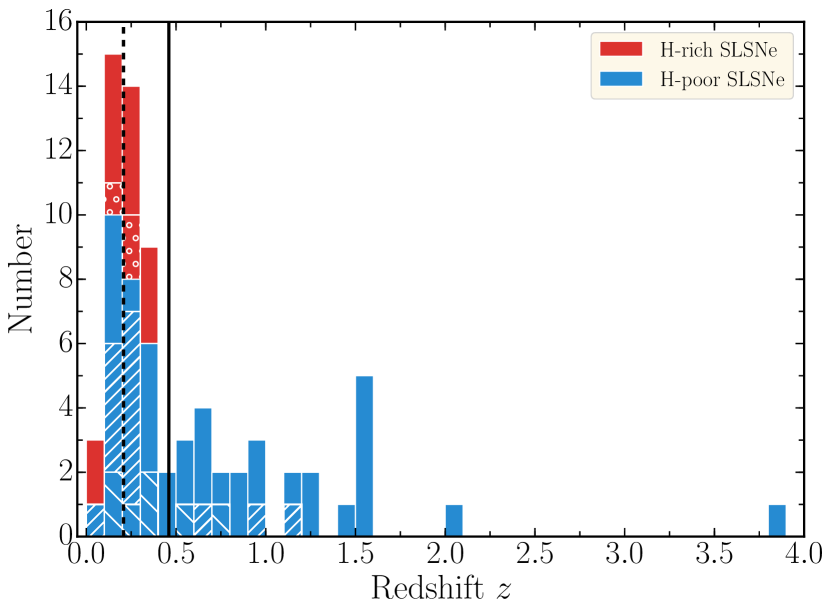
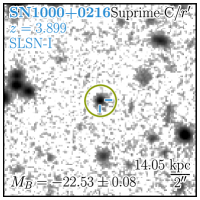
Our final sample comprises of 53 H-poor and 16 H-rich SLSNe. The H-poor sample includes 7 slow-declining H-poor SLSNe, while the H-rich sample includes the SLSNe-II CSS121015, SN2008es and SN2013hx. The size of the final sample is not only a factor of larger than the SLSN host sample presented in Perley et al. (2016b) but includes a large population of hosts at (which is the highest redshift in Perley et al. 2016b). Figure 1 displays the redshift distribution of our sample. It covers a redshift interval from to with a singular object at (SN1000+0216; Cooke et al. 2012). The redshift distribution of the H-poor sample covers the full range and has a median of . The H-rich sample only extends to and has a median of .
2.2 Observations
A fundamental goal of our survey is to secure multi-band data from the rest-frame UV to NIR, to model the spectral energy distributions of the host galaxies. To ensure a sufficient wavelength coverage and data quality, we aimed to have at least one observation of the rest-frame UV and of the NIR and two observations of the rest-frame optical, if a galaxy was brighter than mag.
To optimise the observing campaign, we queried the VizieR database (Ochsenbein et al. 2000) and public archives for available catalogues and data, such as the ESO, Gemini and Subaru archives. Our primary source catalogues are from the Canada-France-Hawaii Telescope Legacy Survey (CFHTLS; Hudelot et al. 2012), the Cosmological Evolution Survey (COSMOS; Scoville et al. 2007), the Galaxy Evolution Explorer (GALEX; Martin et al. 2005), the Sloan Digital sky survey (SDSS; York et al. 2000), the UKIRT Infrared Deep Sky Survey (UKIDSS; Lawrence et al. 2007) and the Wide-field Infrared Survey Explorer (WISE; Wright et al. 2010).111We included WISE data of only a few hosts. These catalogues were complemented by the Coma Cluster catalogue (Adami et al. 2006), the UltraVISTA catalogue (McCracken et al. 2012), the VISTA Deep Extragalactic Observations survey (VIDEO; Jarvis et al. 2013) and the VIRMOS deep imaging survey (VIRMOS; Le Fèvre et al. 2004). Furthermore, we incorporated measurements previously reported in Inserra et al. (2013), Lunnan et al. (2014), Nicholl et al. (2014), Vreeswijk et al. (2014) and Angus et al. (2016).
Between 2012 and 2016, we used observing proposals at the 6.5-m Magellan/Baade Telescope (PI: Schulze, Kim),222Programme IDs: CN2013A-195, CN2013B-70, CN2014A-114, CN2014B-127, CN2014B-102, CN-2015A-129, CN2015A-143, CN-2015B-87, CN2015B-99, CN2016A-108, and CN2016B-98 ESO’s 8.2-m Very Large Telescope (VLT; PI: Leloudas, Krühler),333Programme IDs: 089.D-0902, 091.A-0703, 091.D-0734, and 290.D-5139 the 10.4-m GTC and 3.5-m CAHA telescope (PI: Gorosabel) and the 0.3-m UV/Optical Telescope (UVOT; Roming et al. 2005) onboard the Swift satellite (Gehrels et al. 2004, PI: Leloudas) to obtain rest-frame UV, optical and NIR data. In the subsequent sections, we briefly summarise each campaign.
Our Magellan campaign was performed between 2012 and 2016 with the 6.5-m Baade telescope equipped with the optical wide-field Inamori-Magellan Areal Camera and Spectrograph (IMACS; Dressler et al. 2011), the Parallel Imager for Southern Cosmological Observations (PISCO; Stalder et al. 2014), and the near-infrared (NIR) camera FourStar (Persson et al. 2013). The optical data were secured in , primarily with the IMACS f/2 camera, but also with the IMACS f/4 camera and PISCO. The near infrared observations were performed in and .
The ESO VLT observations were taken in visitor and service mode. The visitor run took place between 29 May and 2 June 2013. We used the FOcal Reducer and Spectrograph 2 instrument (FORS2; Appenzeller et al. 1998), equipped with the red-sensitive CCD to secure data in . In addition, we obtained and band imaging with the High Acuity Wide field K-band Imager (HAWK-I; Pirard et al. 2004; Casali et al. 2006; Kissler-Patig et al. 2008). Additional optical and NIR data were obtained with FORS2, the Infrared Spectrometer And Array Camera (ISAAC; Moorwood et al. 1998) and HAWK-I in queue mode.
The CAHA and GTC campaigns primarily focused on targets on the northern hemisphere. The CAHA observing programme was carried out with the 4-channel Bonn University Simultaneous CAmera (BUSCA; Reif et al. 1999) in at the 3.5-m CAHA telescope in 2012. We also used the infrared wide-field camera Omega2000 (Kovács et al. 2004) to secure and band observations between 2013 and 2015 and also in and band for a few targets. The objective of the campaign at the 10.4-m GTC telescope was to secure deep imaging of SNe 2008es and 2009jh with the Optical System for Imaging and low-Intermediate-Resolution Integrated Spectroscopy (OSIRIS; Cepa et al. 2000) camera.
Rest-frame UV data are critical to break degeneracies in the SED modelling. For objects at , observations in or bluer filters are needed to probe the UV. GALEX provided critical rest-frame UV data for most objects. In addition, we secured UV photometry of five fields with the UV/optical telescope UVOT on board the Swift satellite in 2014 and incorporated archival UVOT data of a further SLSN.
These core observing campaigns were complemented by smaller observing programmes that targeted selected host galaxies. We observed the field of SN2005ap with the Andalucia Faint Object Spectrograph and Camera (ALFOSC) at the 2.54-m Nordic Optical Telescope and the field of SN2007bi with ALFOSC and the 7-channel imager Gamma-Ray Burst Optical/Near-Infrared Detector (GROND; Greiner et al. 2008) at the 2.2-m Max-Planck-Gesellschaft telescope.
To place limits on the total star-formation rate, we used 1.4 GHz data from the VLA Faint Images of the Radio Sky at Twenty-Centimeters survey (FIRST; Becker et al. 1995), the NRAO VLA Sky Survey (NVSS, GHz; Condon et al. 1998), and 843 MHz data from the Sydney University Molonglo Sky Survey (SUMSS; Bock et al. 1999). In addition, we secured continuum observations of MLS121104, SN2005ap and SN2008fz with the Karl Jansky Very Large Array (JVLA; PI: Ibar).444Programme ID: 15A-224 The continuum observations were performed in L band in the most extended A-configuration in July and September 2015. The frequency was centred at 1.5 GHz with a total synthesised bandwidth of 1 GHz. We used the standard flux and bandwidth calibrator 3C48 for all the sources except SN2005ap, for which we used 3C286 instead. For phase calibration purposes we used bright nearby point-like sources from the VLA calibrator list (MLS121104: J0238+1636; SN2005ap: J1310+3220; and SN2008fz: J2330+1100). The key properties of each observation is reported in Tables 9.
2.3 Data reduction
We reduced all data in a consistent way with standard routines in IRAF (Tody 1986). The typical steps are i) bias/overscan subtraction, ii) flat-fielding, iii) fringe correction, iv) stacking of individual images and v) astrometric calibration. For a few instruments we used instrument specific software packages: the GEMINI IRAF package, the GROND pipeline (Yoldaş et al. 2008; Krühler et al. 2008), PHOTPIPE for PISCO data (Bleem et al. 2015), SDFRED1 and SDFRED2 for Subaru Suprime-Cam data (Yagi et al. 2002; Ouchi et al. 2004), THELI version 2.10.0 (Erben et al. 2005; Schirmer 2013) for the FourStar data, VLT instrument pipelines for HAWK-I (version 1.8.18) and ISAAC (version 6.1.3) data,555http://www.eso.org/sci/software/cpl/esorex.html and a customised pipeline for the Magellan/IMACS data. The world-coordinate systems were calibrated with astrometry.net version 0.5 (Lang et al. 2010).
UVOT data were retrieved from the Swift Data Archive.666http://www.swift.ac.uk/swift_portal/ We used the standard UVOT data analysis software distributed with HEAsoft version 6.12, along with the standard calibration data.777http://heasarc.nasa.gov/lheasoft/
The JVLA data were reduced using the Common Astronomy Software Applications package (CASA; McMullin et al. 2007) and consisted of careful data flagging and standard flux, bandwidth and phase calibration. No self-calibration was performed to the data. The obtained flux density root mean squares (r.m.s.) of the images are summarised in Table 23.
3 Methods
3.1 Host identification
We aligned our host-only images with the original SN images that we retrieved from archives with Gaia version 4.4.6.888http://starlink.eao.hawaii.edu/starlink/2015ADownload The average alignment accuracy was . We neither found (suitable) public data for 13 SNe from PanSTARSS, nor for SNe 2006tf, 2009de, 2009nm and 2011cp (in total 17/69 objects). For those objects we relied on the reported SN positions. Although this added an uncertainty to the host identification, the SN positions always coincided with a galaxy, which we assume is the host galaxy.
3.2 Photometry
We developed a Python programme that is based on Source Extractor version 2.19.5 (Bertin & Arnouts 1996) to perform seeing matched aperture photometry. To measure the total flux of the given object, the source radius was typically 2–4 times the full-width at half maximum (FWHM) of the stellar PSF. In case another object was close to the SN position or if the host had a large angular diameter, we adjusted the extraction radius accordingly. If a host evaded detection in all bands, we measured the flux and its uncertainty at the SN position using an aperture with a radius of . Those measurements have very large uncertainties but they can be easily included in the SED modelling in contrast to upper limits.
Once an instrumental magnitude was established, it was photometrically calibrated against the brightness of several standard stars measured in a similar manner or tied to the SDSS DR8 (Aihara et al. 2011) and the AAVSO (American Association of Variable Star Observers) Photometric All-Sky Survey (APASS) DR9 (Henden et al. 2016) catalogues. For Bessell/Johnson/Cousins filters, we converted the photometry of stars in the SDSS catalogue from SDSS using the Lupton colour equations.999http://www.sdss.org/dr5/algorithms/sdssUBVRITransform.html In the NIR (), the photometry was tied to 2MASS. The UVOT photometry was performed with the programme uvotsource. UVOT zeropoints are defined for an aperture with a diameter of . We translated these zeropoints into those of our requested apertures by applying simple aperture correction methods for stars.
Finally, the measurements were corrected for Galactic extinction using the extinction maps by Schlafly & Finkbeiner (2011) and transformed into the AB system using Blanton & Roweis (2007) and Breeveld et al. (2011).
In total, we measured the brightness (and limits for the non-detections) of 53 of the 69 objects, which also includes the re-evaluation of 27 individual data sets from the Two Micron All Sky Survey (2MASS), CFHTLS and SDSS, as well as several archival data sets. In addition, we augmented the photometry of 31 objects by literature values, such as GALEX, Pan-STARRS and WISE data. Owing to GALEX’s and WISE’s large point-spread functions, we only included their photometry if a contamination by neighbouring objects could be excluded. Among the 16 objects whose photometry is entirely based on literature results, four galaxies are in the footprint of the COSMOS survey: PS1-12zn, PS1-12bqf, SN1000+0213 and SNLS07D2bv. Their photometry is discussed here for the first time. Table 9 summarises the photometry of each object.
3.3 Spectral-energy distribution fitting
We modelled the SEDs with Le Phare (Arnouts et al. 1999; Ilbert et al. 2006),101010http://www.cfht.hawaii.edu/~arnouts/LEPHARE using a grid of galaxy templates based on Bruzual & Charlot (2003) stellar population-synthesis models with a Chabrier IMF (Chabrier 2003). The star-formation history was approximated by a declining exponential function of the form , where is the age of the stellar population and the e-folding time-scale of the star-formation history (varied in eight steps between 0.1 and 15 Gyr). Furthermore, we assumed the Calzetti dust attenuation curve (Calzetti et al. 2000). For a description of the galaxy templates, physical parameters of the galaxy fitting, and their error estimation, we refer to Krühler et al. (2011).111111The templates used in this paper do not account for possible binary star evolution, which could substantially alter SEDs (more hard UV photons; e.g., Stanway et al. 2016).
As an extension to Krühler et al. (2011), we relaxed the analysis threshold of the galaxy mass to (which is pushing the definition of a galaxy), because previous studies showed that SLSNe can occur in very low-mass galaxies (Lunnan et al. 2014; Leloudas et al. 2015c; Angus et al. 2016). We modified the gas component in Le Phare by incorporating the observed relationship between line flux and SFR for [O ii] and [O iii] by Krühler et al. (2015). The attenuation of the ionised gas component was linked to the stellar attenuation via by Calzetti et al. (2000). All attenuation measurements are reported for . Finally, we used the high-resolution BC03 templates, which are defined over 6900 wavelength points instead of 1221 wavelength points from to 160 m. To account for zeropoint offsets in the cross-calibration and absolute flux scale, we added a systematic error of 0.05 mag in quadrature to the uncertainty introduced by photon noise. For GALEX, UVOT and -band data this systematic error was increased to 0.1 mag.
The absolute magnitudes were computed directly by convolving the filter response functions with the best-fit template. To compute the corresponding error in the rest-frame bandpass , we interpolated between the errors of the apparent magnitudes and of the observed band-pass and , respectively, via:
where is the central wavelength of the observer-frame bandpass and in the rest-frame of the SLSNe. In case a rest-frame bandpass lies blueward/redward of the observation in the bluest/reddest filter, we set the error to the error of the observation in the bluest/reddest filter.
Our observations were characterised by a large set of different filters, of which several have similar bandpasses. To simplify the fitting, we homogenised the filter set. Specifically, we set the filter response function of , , , to , , , , , to , , , to , , , , to ’, , , , , to , to , to , to , , to , to , to , to Spitzer/, and to Spitzer/. It can be seen from our fits (Figs. 2, 18 and 22), and quality of the derived host properties (Table 5), that the impact of these assumptions is negligible.
Studies of SLSN host galaxies and extreme emission-line galaxies (e.g., Amorín et al. 2015) showed that emission lines can significantly affect the SED fitting. To quantify this effect, we repeated the SED fitting for our spectroscopic sample (Leloudas et al. 2015c; Table 1). The contribution of the emission line on the photometry in filter is given by
where is the flux density of the emission line , is the flux density of the stellar continuum and is the transmission function of the filter . The strength of an emission line can be characterised by its equivalent width, EW, hence . Assuming that all emission lines are narrow compared to the width of the broad-band filter, the above expression simplifies to
where is the filter response function of filter at the wavelength of the emission line (in the air reference frame) and is the effective width of the filter. In contrast to the SED fitting, it was necessary to use the exact filter transmission function of each instrument.
We subtracted the contribution of H–H, [O ii], [O iii], [N ii], [Ne ii] and [S ii] from the measured brightness in the broadband filter. Afterwards, we explicitly switched off the contribution from the ionised gas of H ii regions in Le Phare and repeated the fits with the emission-line-subtracted SEDs. The result of this experiment is discussed in Sect. 4.1.2.
3.4 Ensemble statistics
To compare observed distributions with distributions of other galaxy samples (parent distributions), such as extreme emission-line galaxies (hereafter EELGs), GRBs and SNe, we performed an Monte-Carlo (MC) simulation as follows. Each SLSN host measurement was represented by a normal distribution centred at the observed value and with a width () determined from the asymmetric error or a uniform distribution between the upper limit and the smallest/faintest value in the sample for those objects with upper limits only. A two-sided Anderson-Darling (AD) test was performed between the resampled distributions and the parent distributions, using the R package kSamples. This process was repeated 10 000 times and a mean AD value obtained. We rejected the null hypothesis of two distributions being drawn from the same parent distribution if the corresponding chance probability was smaller than 0.01.
To complement the one-dimensional Anderson-Darling tests, we also performed two-dimensional tests in the mass-SFR plane. We first computed the mean mass and SFR of the SLSN-host sample. After that, we bootstrapped 10 000 samples of size from the other galaxy samples, where is the number of SLSNe in the given redshift interval, and computed the mean mass and SFR of each bootstrapped sample. Measurement errors were propagated through a MC simulation as described above. Finally, we computed the region that contained 99% of all realisations using the python package corner.py (Foreman-Mackey 2016). If the estimator of the SLSN sample did not fall in that region, the chance probability is less than 0.01 and we rejected the null hypothesis of both distributions being statistically similar.
For each statistical test, we also performed a two-sided AD test on the redshift distributions to minimise systematic errors introduced by cosmic evolution, similar to Japelj et al. (2016).
We extract robust estimates of the ensemble distribution functions with a Bayesian approach, which incorporates the varying and asymmetric measurement uncertainties of individual sources and the limited sample size. For this we fit to the sample measurements in a quantity (e.g., in or SFR) a normal distribution. We constrain its parameters, the mean and standard deviation , with a likelihood defined as the product of convolutions of that distribution and the measurement probability distributions. The fit uncertainties were obtained with the MultiNest package (Feroz et al. 2013) through the python package PyMultiNest (Buchner et al. 2014). Flat priors were assumed on and .
3.5 Comparison samples
We built several comparison samples to put SLSN host galaxies in context with the cosmic star-formation history and to better understand the peculiar conditions that gave rise to this class of stellar explosion.
Core-collapse supernova host galaxies:
Because of the connection between SLSNe and massive stars, we compiled core-collapse supernova (CCSN) host galaxy samples. As in Leloudas et al. (2015c), we used SNe from untargeted (with respect to galaxies) surveys. At , we use objects studied in Leloudas et al. (2011), Sanders et al. (2012) and Stoll et al. (2013). All SNe in these samples have robust spectroscopic classifications. The combined sample consists of 44 type Ib/c SNe and 46 type II SNe. These studies provide multi-band data, which are primarily based on SDSS photometry and also spectroscopy for a number of hosts. We adopt the SED modelling by Leloudas et al. (2015c) for the Leloudas et al. (2011) and Sanders et al. (2012) samples. Note, the spectral energy distributions in Stoll et al. (2013) were modelled with the FAST stellar population synthesis code (Kriek et al. 2009) with the Bruzual & Charlot (2003) templates and a Salpeter IMF. We reduced their SFRs and galaxy masses by a factor of 1.8, to convert from a Salpeter to a Chabrier IMF, used in this paper (Kennicutt 1998).
To expand the SN sample to redshifts larger than , where most of our SLSNe are found, we added the SN sample from the Great Observatories Origins Deep Survey (GOODS) and Probing Acceleration Now with Supernovae (PANS) surveys (Riess et al. 2004). GOODS/PANS were HST surveys to detect Type Ia SNe at high redshift. This survey also located 58 distant CCSNe between and (the median being ). In contrast to the low- samples, their classification relied on photometric data. The method allowed a distinction between Type Ia and CCSNe, but not a categorisation into sub-types. Thanks to the overlap with the GOODS field, each SN host has deep rest-frame UV to NIR data. We adopt the results of the SED modelling by Svensson et al. (2010). Note, these authors modelled the SEDs with their own software that uses observed SEDs of local galaxies and SEDs produced with various spectral synthesis codes as templates. Furthermore, they assumed a Salpeter IMF. Similar to Stoll et al. (2013), the SFRs and the masses were reduced by a factor of 1.8 to convert from a Salpeter to a Chabrier IMF.
GRB host galaxies:
A member of our team (T. Krühler) collected multi-band data of long GRBs. These GRBs are selected to be part of one of the following complete GRB samples: GROND 4-hour sample (Greiner et al. 2011), TOUGH survey (The Optically Unbiased GRB Host Galaxy survey; Hjorth et al. 2012), BAT-6 (Salvaterra et al. 2012) or SHOALS (Swift Gamma-Ray Burst Host Galaxy Legacy Survey; Perley et al. 2016b). The individual measurements are reported in Krühler & Schady (2017). Among all hosts, we selected those at (52 in total). At these redshifts, it is relatively easy to secure the GRB redshift, because of the sparsity of dust-obscured bursts at , and to build host samples with a high detection completeness. The SEDs of this sample were analysed in a similar way as our SLSN host galaxy sample.
| Sample | Selection criteria | Number of | Redshift | Which properties |
| objects | interval | used? | ||
| Core-collapse supernova host galaxies (total number 265) | ||||
| Leloudas et al. (2011) | Ib/c SNe, detected by untargeted surveys | 12 | , mass, SFR11footnotemark: | |
| (L11) | spectroscopic classification | |||
| Sanders et al. (2012) | Ib/c SNe, detected by untargeted surveys | 31 | , mass, SFR11footnotemark: | |
| (S12) | spectroscopic classification | |||
| Svensson et al. (2010) | GOODS SN sample | 165 | , mass, SFR | |
| photometric SN classification | ||||
| Stoll et al. (2013) | first-year PTF CCSN sample | 58 | , mass, SFR | |
| (S13) | primarily Type II SNe | |||
| Extreme emission-line galaxies (total number 227) | ||||
| Amorín et al. (2014) | VUDS survey (Le Fèvre et al. 2015), | 31 | colour, , , | |
| mag | mass, SFR | |||
| Amorín et al. (2015) | zCOSMOS survey, mag | 165 | colour, , , | |
| mass, SFR | ||||
| Atek et al. (2011) | WISPS survey (Atek et al. 2010), | 9 | mass, SFR | |
| Maseda et al. (2014) | 3D-HST survey (Brammer et al. 2012), colour selection | 22 | mass, SFR | |
| emission-lines do not fall in the NIR band-gaps | ||||
| Field galaxies (total number 150 900) | ||||
| Muzzin et al. (2013) | -band selected COSMOS/UltraVISTA survey | 150 900 | colour, , mass, | |
| , , | SFR | |||
| Long GRB host galaxies (total number 52) | ||||
| Krühler & Schady (2017) | , long-duration Swift GRBs detected before | 52 | colour, , , | |
| May 2014, part of the GROND 4-hour, TOUGH, SHOALS | mass, SFR | |||
| BAT-6 samples | ||||
COSMOS/UltraVISTA survey:
To compare SLSN host galaxies to field galaxies, we used the ultra-deep NIR survey UltraVISTA that observed an area of 1.8 deg2 down to mag ( confidence). We chose the -band, i.e., mass, selected catalogue by Muzzin et al. (2013) that overlaps with the COSMOS field. This catalogue provides observations in 30 bands from rest-frame UV to NIR. Among all galaxies, we selected those at with SFRs of at least , specific SFRs between and , and “USE” flags equal to one. This sample comprises galaxies with a median redshift of . Because of the small survey area, the number of hosts at is small. This does not affect our analysis because only two SLSNe in our sample are at lower redshifts.
EELGs:
Leloudas et al. (2015c) showed that H-poor SLSNe are preferentially found in EELGs. We built a master sample including results from Atek et al. (2011), Amorín et al. (2014, 2015) and Maseda et al. (2014). Those samples selected EELGs by applying different brightness cuts, colour selection criteria, spectroscopy and redshift constraints. The total sample consists of 227 galaxies with rest-frame [O iii]5007 equivalent widths of Å between and . All surveys reported stellar mass and SFR for each galaxy, but other properties, such as brightness, colour or , were only reported for certain subsamples.
A summary of the individual surveys and which properties are used in this study is presented in Table 3.
4 Results
4.1 Spectral-energy distribution modelling
4.1.1 Quality of the SED modelling
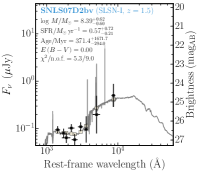
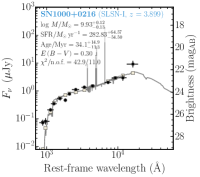
We made two assumptions to model all SEDs in an automatic and self-consistent way: i) the SEDs can be described by a stellar component with an exponentially declining star-formation history and a contribution from the ionised gas of the H ii regions and ii) the number of filters (n.o.f.) can be reduced to the homogenised filter set in Sect. 3.3. Over 90% of our hosts have good fits with an average of 0.5 and derived physical parameters that are comparable to other galaxy samples (Table 5, Figs. 2, 18, 22).
The fits of only six hosts had between 3.9 and 10.4. The fits of PS1-11bdn and SN1000+0216 are of poorer quality ( and 6.3, respectively) caused by a few data points. The host of PS1-10bzj has very strong emission lines that fall in the wings of the -band transmission function, which increased the normalised to 10.4. Apart from data points in a few individual filters, the fits are nonetheless very good and can be used without restriction.
The fits of CSS100217, PTF11dsf, SN1999bd and SN2006gy have to be used with more caution. Drake et al. (2011a) revealed a narrow-line Seyfert in the host galaxy of CSS100217. Furthermore, Leloudas et al. (2015c) reported on the discovery of broad H and [O iii] in the host spectrum of PTF11dsf, which could be due to an AGN as well. The hosts of SLSNe-IIn SN1999bd and SN2006gy are evolved galaxies that experienced a recent starburst. This is demonstrated by the detection of Balmer lines in both spectra (Smith et al. 2007; Leloudas et al. 2015c; Fox et al. 2015), while the SED cannot be modelled by an exponentially declining star-formation history. A reliable modelling of the SEDs of these three hosts requires a detailed modelling of their star-formation histories and the inclusion of an AGN component, which is beyond the scope of this paper. Leloudas et al. (2015c) mentioned that the host of PTF11dsf could also harbour an AGN. Similar to the three aforementioned hosts, we only use the mass and the -band luminosities of PTF11dsf’s host in our discussion, but not the SFR.
4.1.2 Contribution of emission lines
Our SED modelling includes the contribution of the H ii regions. This is of particular importance because previous studies showed that emission lines can significantly affect the SED fitting (e.g., Castellano et al. 2014; Lunnan et al. 2014; Chen et al. 2015; Santini et al. 2015). This motivated Lunnan et al. (2014) to omit filters that were affected by [O iii]5007, if [O iii] had a large equivalent width, and Chen et al. (2015) to subtract the emission line contribution from the broad-band photometry. Both approaches are strictly limited to objects with host spectroscopy.
Thanks to Le Phare capabilities, we quantify the impact of emission-lines on the SED fitting with a more sophisticated approach. First, we fit the SEDs of the spectroscopic subsample with templates that include a stellar and a gas component. Then, we subtract the contribution of the emission lines from the broad-band photometry and fit the new SEDs with a stellar component only, i.e., the gas component is explicitly switched off in Le Phare.
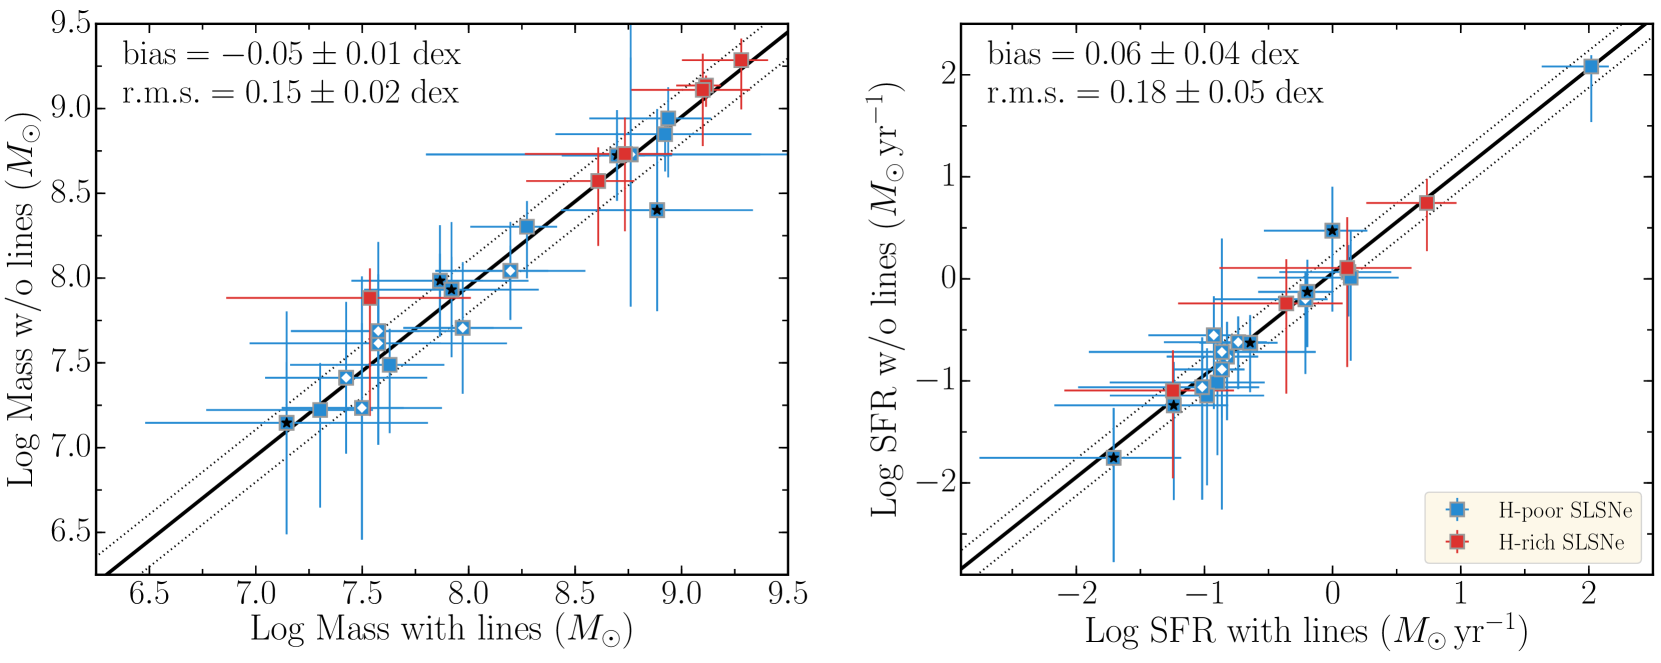
Figure 3 shows how the primary diagnostics mass and SFR change if emission lines are included in the SED fitting. The absolute value of the average mean bias deviation and the average root mean square error in the mass and SFR estimates are dex and dex, respectively, and smaller than the error bars of individual measurements. The most critical object in this analysis is PTF12dam, the most extreme SLSN host galaxy known to date. Its deviations between the mass and SFR estimates with and without lines are , . Apart from this object, the agreement between the two fits is excellent. This reflects the fact that we have good photometry spanning a large wavelength interval and a good handle on the gas emission in the SED fitting, so that the uncertainty in the emission-line contribution does not affect our results.
4.1.3 SED vs. emission-line diagnostics
By combining results from the spectroscopic observations in Leloudas et al. (2015c) with the results from our SED modelling, we have two independent estimates on the recent star-formation activity for our spectroscopic sub-sample. Both diagnostics assume a particular star-formation history and a particular initial mass function. In addition, different diagnostics average the star-formation activity over different time intervals, e.g., the H SFR-indicator is sensitive to the star-formation activity over the past 6 Myr, whereas the SFR derived from rest-frame UV continuum averages over a time period of 100 Myr (e.g., Kennicutt & Evans 2012; Calzetti 2013). Because of the extreme nature of SLSNe, we examine whether we can isolate the differences that occur due to the time-scales that the H and SED-inferred SFRs probe.
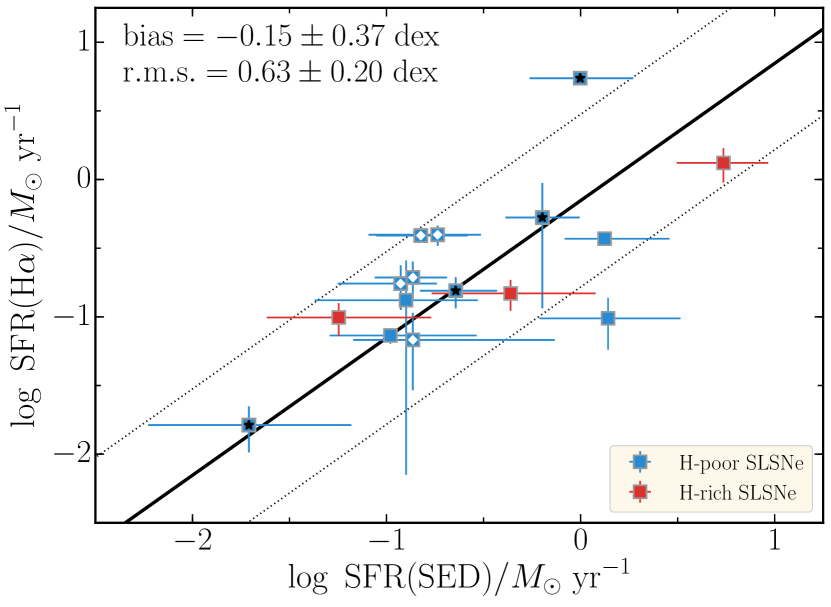
Assessing these differences requires that the systematic uncertainties in the data are well understood. Spectroscopic observations with slits are subject to flux losses, because a slit may only cover a part of a given galaxy. Most SLSN host galaxies are relatively compact (Lunnan et al. 2015) so that the expected losses are small. To correct these, Leloudas et al. (2015c) convolved the spectrum of a given object with the filter bandpasses of its imaging data to extract synthetic photometry. In most cases, a simple rescaling was sufficient to adjust the absolute flux scale, i.e., the extracted spectrum is representative for the entire galaxy. Only a few objects required low-order polynomials to correct the warping of the spectrum. In the following, we use the spectroscopic data of a sub-sample of 16 host galaxies with a reliable absolute flux scale.
Figure 4 compares the extinction-corrected SFR’s from SED modelling and H emission lines of these 16 hosts. Both diagnostics reassuringly show consistency. The mean bias deviation and the mean r.m.s. between the H and SED derived SFRs are dex and dex, respectively. Conroy (2013) pointed out that a systematic uncertainty in the SED-based SFRs of a factor of 0.3 dex is expected. Our observed value is larger than the expected value but consistent within .
The most interesting object in our sample to identify differences in the SFR indicators is again the host of PTF12dam. Thöne et al. (2015) reported that the head of the tadpole galaxy is characterised by a very young stellar population which is Myr old. Calzetti (2013) showed that in such cases, the UV SFR estimator will be underestimated by a factor of a few. We measure an excess of dex in the H inferred SFR. Even in that case, the deviation between the H- and SED-inferred SFRs only has a significance of , reassuring us that even in such an extreme case the SED modelling can provide robust results.
4.2 Host offsets
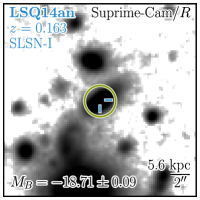
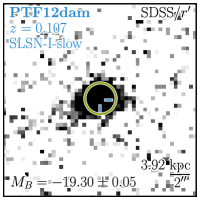
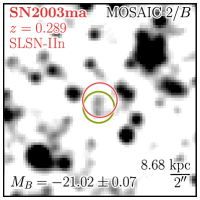
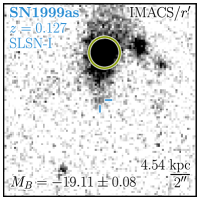
Figures 5, 23 and 25 show postage stamps of each field in our sample. The detected host galaxies (detection rate of ) are marked by green circles. The SN positions, after astrometrically aligning the SN and the host images, are indicated by crosshairs. The average uncertainty of 017 is dominated by the different pixel scales of the SN and host images. In a few examples, this uncertainty exceeds because of the coarse spatial resolution of the SN images, the small spatial overlap of SN and host images, or the low number of reference stars. We lack SN images for 17 hosts in our sample. Their SN positions are indicated by circles as reported in the literature.
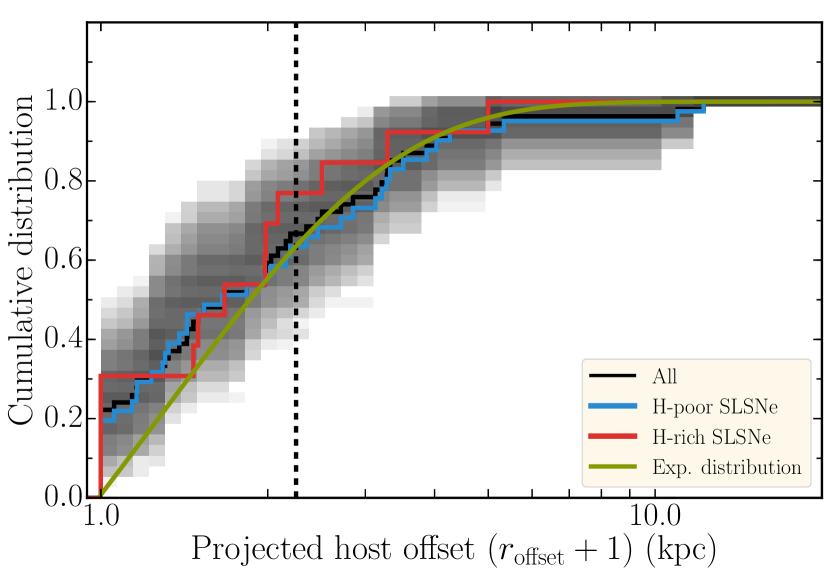
Thanks to the high host recovery rate (85% and 100% for H-poor and H-rich SLSNe, respectively), we present a relatively complete distribution of the distances between the SN positions and the barycentres of the host light (predominantly in band) of H-poor and H-rich SLSNe. In addition, we incorporate results on CSS100217 by Drake et al. (2011a), on SN2003ma by Rest et al. (2011) and on Pan-STARRS SLSNe by Lunnan et al. (2015). The observed distribution is skewed to small radii (the expectation value being 1.3 kpc) but has a long tail extending up to 12 kpc. For the smallest offsets, the measurements are comparable to the errors. In this regime, Gaussian noise superimposed on a vector with length results in a non-Gaussian probability distribution of the vector length, i.e., an overestimated host offset (Rice 1944). The expected probability distribution function of a host offset measurement is given by
where is the true offset, is the dispersion of the distribution, which can be assumed to be comparable to the measurement error, and is the modified Bessel function of the first kind. By differentiating with respect to , a closure relation can be derived between the observed offset, its error and the true offset (Wardle & Kronberg 1974):
We solved this equation numerically to build the intrinsic host offset distribution. The black curve in Fig. 6 shows the joint cumulative distribution of H-poor and -rich SLSNe. The grey-shaded regions display the expected parameter space of our distribution after bootstrapping the sample 30 000 times with darker regions, indicating a higher probability. The distribution is well described by the cumulative distribution function of a negative exponential distribution with a mean offset of kpc.
The fit underpredicts the fraction of hosts with offsets smaller than kpc and kpc. The discrepancy for small host offsets can be reconciled with the alignment errors between SN and host image, and intrinsically small host offsets. As the alignment error exceeds the offset measurement, the closure relation is only fulfilled if . Therefore, the fraction of SLSNe with negligible host offsets is a strict upper limit. In addition, any inclination will lead to an underestimation of the true host offset. The blue and red curves in Fig. 6 show the observed offset distribution after separating the sample in H-poor and -rich SLSNe, respectively. Both samples are statistically identical.
The offsets of PTF11rks and SN1999as are kpc and therefore they exceed the median of 0.7 kpc by a large factor. The host of SN1999as is an irregular galaxy interacting with its environment (Fig. 5). At the explosion site a faint object is detected in continuum. The explosion site of PTF11rks is connected by a linear feature with the nucleus (Perley et al. 2016b). This could point to a spiral galaxy morphology or galaxy interaction whereby the SN exploded in a faint satellite galaxy. Spectroscopic observation of SN1999as by Leloudas et al. (2015c) showed that the explosion site is characterised by strong emission lines. In this case, the true host is a fainter galaxy that is difficult to disentangle from the more massive galaxy.
4.3 Brightness, colour and luminosity
4.3.1 Brightness and luminosity
| Sample | Number | Mean | ||||||
|---|---|---|---|---|---|---|---|---|
| redshift | (mag) | (mag) | (mag) | |||||
| I-fast | 11 | 0.21 | (8) | |||||
| I-slow | 5 | 0.24 | (4) | |||||
| H-poor | 27 | 0.24 | (16) | |||||
| II | 3 | 0.21 | ||||||
| IIn(b) | 13 | 0.21 | (12) | (10) | (9) | |||
| H-rich(b) | 16 | 0.21 | (15) | (11) | (12) | |||
| H-poor | 14 | 0.73 | (13) | (4) | ||||
| H-poor | 12 | 1.67 | (11) | (5) | ||||
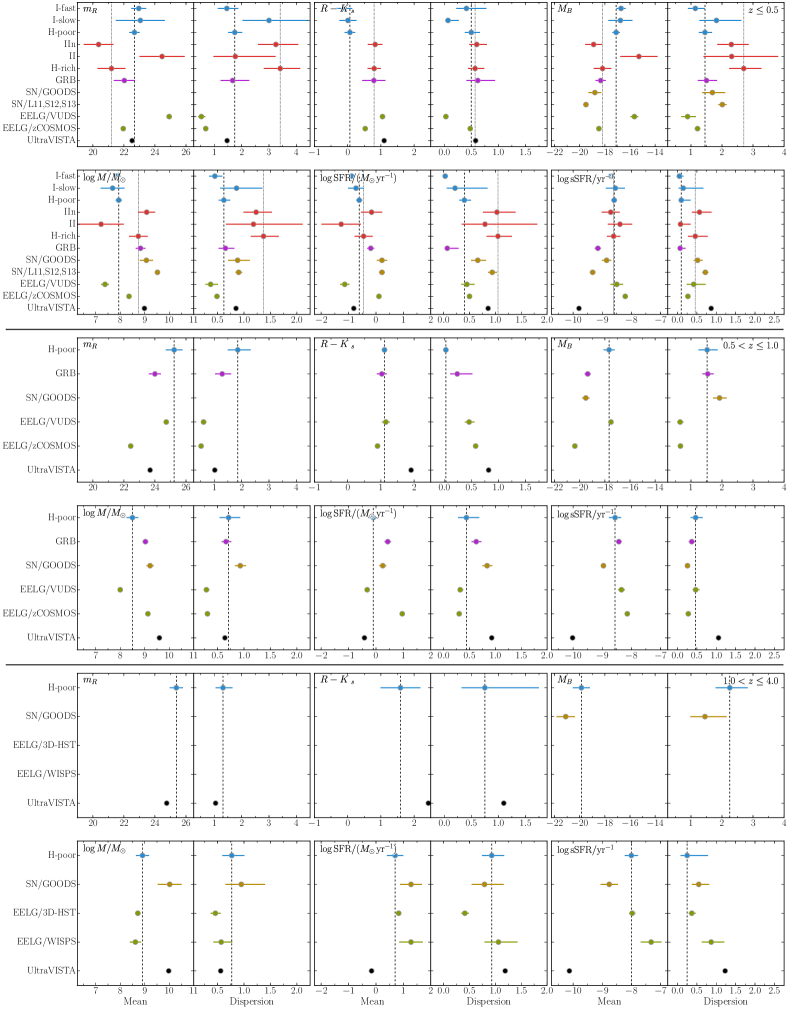
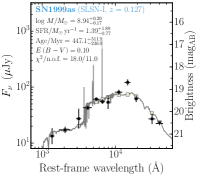
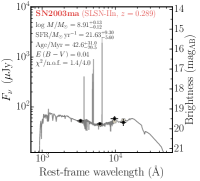
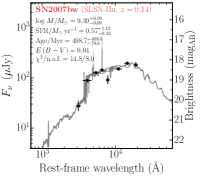
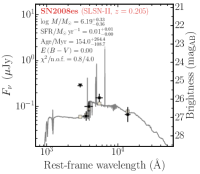
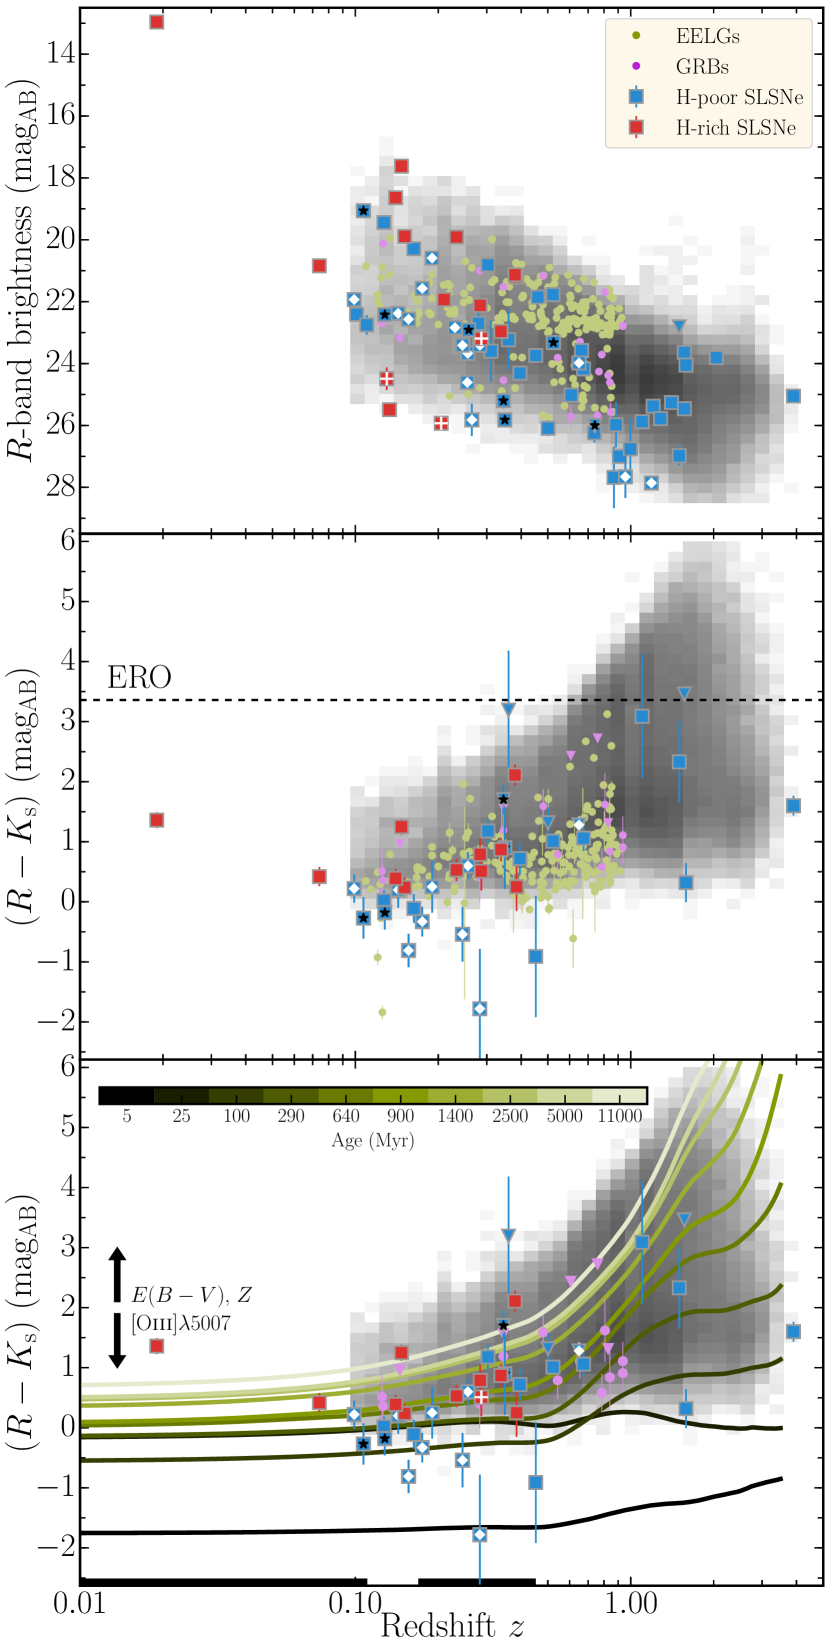
More than 87% of all hosts were detected at confidence in a -band filter. Their observed distribution, displayed in the upper panel of Fig. 7, extends from mag (SN2006gy) to mag (SCP06F6) and shows a clear trend to fainter galaxies as redshift increases (Table 4). The average brightness of SLSN-I host galaxies decreases from mag at to mag at , while the dispersion remains at mag at all redshifts. Compared to a sample of star-forming galaxies from the UltraVISTA survey (density plot in Fig. 7), they are on average fainter and their distributions become more incompatible as redshift increases.
The class of H-poor SLSNe is comprised of fast- and slow-declining SLSNe, which might have different progenitors and host environments. Using the gap in the decline time scale at days (Table 1), we define a sub-sample of 12 fast and seven slow declining H-poor SLSNe at (Table 1). The properties of the two samples appear to be indistinguishable (Table 4). However, the samples are too small to draw a conclusion yet.
Host galaxies of H-rich SLSNe are on average 1.5 mag brighter than hosts of H-poor SLSNe at (upper panel in Fig. 7; Table 4). Most striking about the SLSN-II/IIn host population is the exceptionally large dispersion of 3.4 mag that is even a factor of 2–3 larger than that of H-poor SLSNe and the UltraVISTA sample (Tables 4, 25; Fig. 25). The large dispersion remains after separating out the three SLSNe-II from the H-rich population (Table 1). The distribution is incompatible with the UltraVISTA sample (chance probability ) and with the fainter and narrower distribution of SLSN-I host galaxies (). Among the hosts of the three SLSNe-II are two of the faintest H-rich SLSN host galaxies in our sample (–26.4; Table 9). They are more than a hundred times fainter than an galaxy at (Faber et al. 2007), and about two magnitudes fainter than the SMC galaxy at .
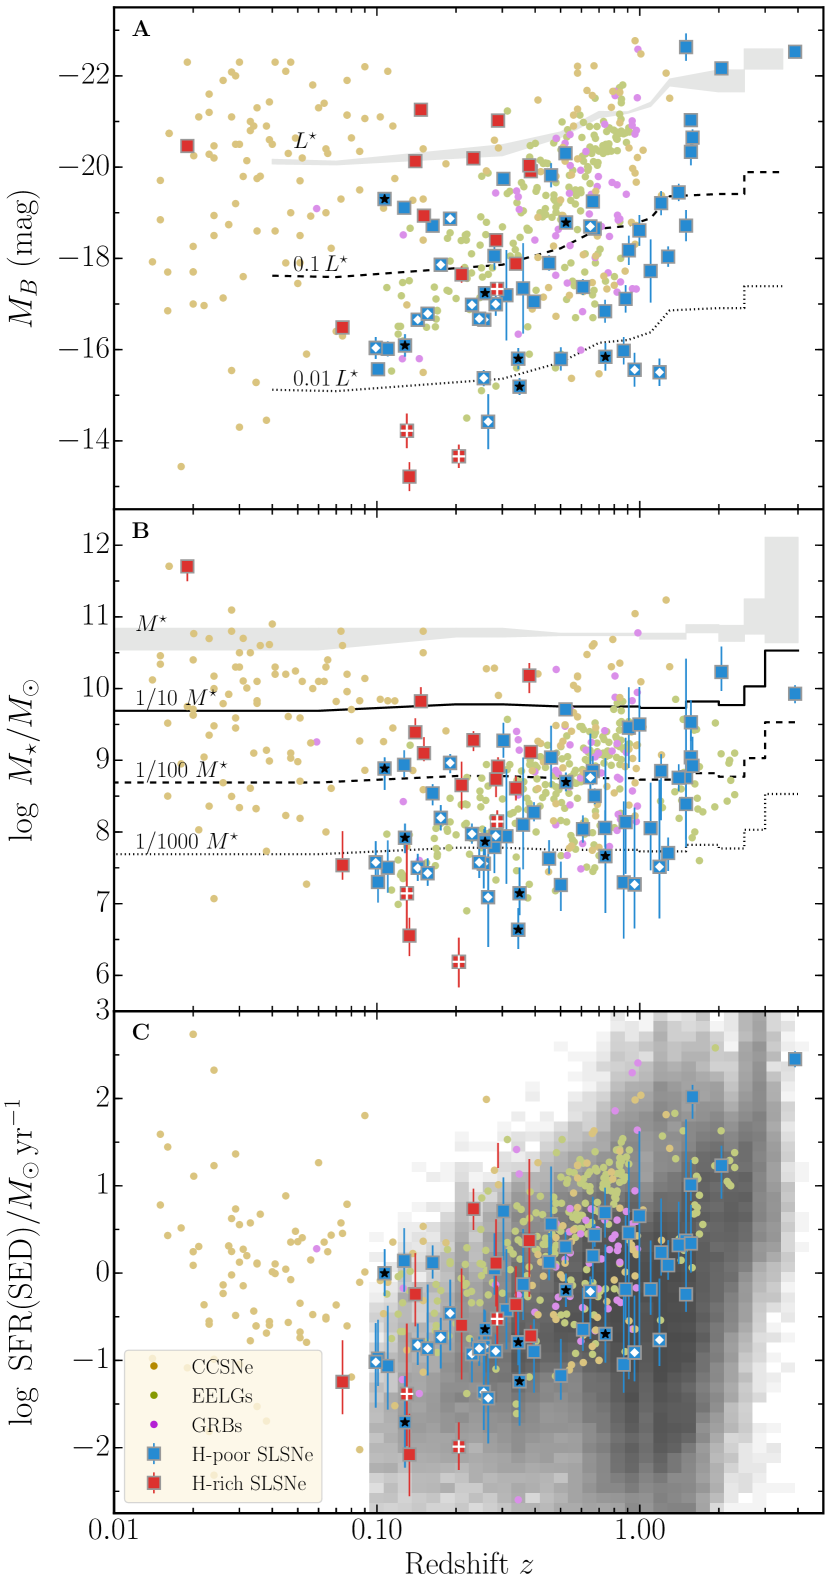
Panel A of Figure 8 shows the evolution of the absolute -band luminosity (not corrected for host reddening) with redshift. The distribution spans a wide range from to mag. Compared with appropriate luminosity functions (e.g., Faber et al. 2007; Ilbert et al. 2005; Marchesini et al. 2007, tracks in Fig. 8), the span corresponds to a range from a few thousandths of to a few . Clear differences are visible between hosts of H-poor and -rich SLSNe. In their common redshift interval (), the distribution of the H-poor SLSN hosts is narrower by mag and in addition shifted by mag towards lower luminosities (Table 4). Intriguingly, the luminosity distribution shows a rapid evolution from at to at . We discuss its origin in Sect. 5.1.
With the -band luminosity distribution in hand we put SLSN host galaxies into context with unbiased GRB and regular core-collapse SN host galaxy samples. Between and , Type I SLSNe reside in galaxies that are mag less luminous than GRBs. The AD test gives a chance probability of that both distributions are drawn from the same parent distribution (Fig. 14). This result contradicts Japelj et al. (2016), who argued that previously claimed differences between the two populations are an artefact of the comparison methodology. We discuss this finding in Sec. 5.4.1 in detail. The population of SLSN-I host galaxies is also incompatible with those of regular core-collapse SNe from untargeted surveys at all redshifts (; Figs. 14). In contrast, the SLSN-IIn host population is closer to the GRB host population (; Figs. 16).
4.3.2 colour
The middle panel of Fig. 7 shows the redshift evolution of the colour of the 25 H-poor and 11 H-rich SLSN hosts with and -band observations. The colour varies between and 3 mag, though with large errors. No SLSNe are found in extremely red objects (EROs, ). At , SLSN-I hosts are characterised by significantly bluer average colours ( mag; Table 4) than star-forming galaxies from the UltraVISTA survey (grey shaded region; mag; Table 25). The chance of randomly drawing a distribution from the UltraVISTA sample that is at least as extreme as the SLSN-I is . The average colour is mag bluer and statistically incompatible with those extreme emission galaxies in the VUDS and zCOSMOS surveys (). At , the average colour increases to mag, but still remains below the average colour of UltraVISTA galaxies (2.43 mag; Tables 4, 25).
The mean colour of hydrogen-rich SLSNe ( mag) is modestly bluer compared to the general population of star-forming galaxies in the UltraVISTA survey and of GRB host galaxies (Tables 4, 25). While the dispersions of the brightness and luminosity distributions are broader than of other galaxy samples, the colour distribution has a dispersion comparable to all other samples [ mag; Tables 4, 25]. Hosts of type II SLSNe tend to be too faint to obtain meaningful -band constraints, which prevents contrasting their properties to the ensemble of type IIn SLSNe.
In the bottom panel of Fig. 7, we overlay expected colour-tracks for the stellar population synthesis templates from Bruzual & Charlot (2003) for a metallicity of 0.2 solar and a wide range of ages. The colour of SLSN-I hosts of mag at points to stellar population ages of several up to a few hundred million years, whereas H-rich SLSNe are found in galaxies with a redder colour because of more evolved stellar populations. However, the exact relation between colour and age is a complicated function of metallicity, extinction, the equivalent width of emission lines and star-formation histories (for a detailed discussion see Conroy 2013). The vectors in Fig. 7 indicate how they can alter the intrinsic colour.
A critical aspect of this analysis is the and -band observing completeness. Almost all hosts were observed in band, but only were observed in band. The colour incompleteness is a direct consequence of the difficulty to obtain meaningful -band constraints for hosts fainter than –24 mag. This is supported by the SED modelling, which always suggests -band magnitudes below this detection limit and colours that are comparable to the observed colour distribution. In the unlikely case that the hosts without -band observations had –24 mag, the colour distribution would span a range from 0.3 to 4.7 mag. Such red colours are in stark contrast to the observed distribution, the SED modelling, and SN observations (e.g., Quimby et al. 2011c; Inserra et al. 2013; Lunnan et al. 2013; Nicholl et al. 2014).
4.4 Physical properties and distribution functions
| SLSN | Redshift | |||||||||
| (mag; host) | (mag) | (mag) | (mag) | (yr) | ||||||
| SLSN-I host galaxies | ||||||||||
| CSS140925 | 0.460 | |||||||||
| DES14S2qri | 1.500 | |||||||||
| DES14X2byo | 0.869 | |||||||||
| DES14X3taz | 0.608 | |||||||||
| iPTF13ajg† | 0.740 | |||||||||
| LSQ12dlf‡ | 0.255 | |||||||||
| LSQ14an | 0.163 | |||||||||
| LSQ14mo‡ | 0.256 | |||||||||
| LSQ14bdq† | 0.345 | |||||||||
| LSQ14fxj | 0.360 | |||||||||
| MLS121104 | 0.303 | |||||||||
| PS1-10ky | 0.956 | |||||||||
| PS1-10pm | 1.206 | |||||||||
| PS1-10ahf | 1.158 | |||||||||
| PS1-10awh | 0.909 | |||||||||
| PS1-10bzj‡ | 0.649 | |||||||||
| PS1-11ap† | 0.524 | |||||||||
| PS1-11tt | 1.283 | |||||||||
| PS1-11afv | 1.407 | |||||||||
| PS1-11aib | 0.997 | |||||||||
| PS1-11bam | 1.565 | |||||||||
| PS1-11bdn | 0.738 | |||||||||
| PS1-12zn | 0.674 | |||||||||
| PS1-12bmy | 1.566 | |||||||||
| PS1-12bqf | 0.522 | |||||||||
| PS1-13gt | 0.884 | |||||||||
| PTF09atu | 0.501 | |||||||||
| PTF09cnd† | 0.258 | |||||||||
| PTF10hgi‡ | 0.099 | |||||||||
| PTF10vqv | 0.452 | |||||||||
| PTF11rks‡ | 0.190 | |||||||||
| PTF12dam† | 0.107 | |||||||||
| SCP06F6‡ | 1.189 | |||||||||
| SN1999as | 0.127 | |||||||||
| SN2005ap‡ | 0.283 | |||||||||
| SN2006oz | 0.396 | |||||||||
| SN2007bi† | 0.128 | |||||||||
| SN2009de | 0.311 | |||||||||
| SN2009jh† | 0.349 | |||||||||
| SN2010gx‡ | 0.230 | |||||||||
| SN2010kd | 0.101 | |||||||||
| SN2011ep | 0.280 | |||||||||
| SN2011ke‡ | 0.143 | |||||||||
| SN2011kf‡ | 0.245 | |||||||||
| SN2012il‡ | 0.175 | |||||||||
| SN2013dg‡ | 0.265 | |||||||||
| SN2013hy | 0.663 | |||||||||
| SN2015bn | 0.110 | |||||||||
| SN1000+0216 | 3.899 | |||||||||
| SN2213-1745 | 2.046 | |||||||||
| SNLS06D4eu | 1.588 | |||||||||
| SNLS07D2bv | 1.500 | |||||||||
| SSS120810‡ | 0.156 | |||||||||
| SLSN-IIn host galaxies | ||||||||||
| CSS100217 | 0.147 | |||||||||
| PTF10heh | 0.338 | |||||||||
| PTF10qaf | 0.284 | |||||||||
| PTF11dsf | 0.385 | |||||||||
| SN1999bd | 0.151 | |||||||||
| SN2003ma | 0.289 | |||||||||
| SN2006gy | 0.019 | |||||||||
| SN2006tf | 0.074 | |||||||||
| SN2007bw | 0.140 | |||||||||
| SN2008am | 0.233 | |||||||||
Results from the spectral energy distribution modelling SLSN Redshift (mag; host) (mag) (mag) (mag) (yr) SLSN-IIn host galaxies (continued) SN2008fz 0.133 SN2009nm 0.210 SN2011cp 0.380 SLSN-II host galaxies CSS121015‡ 0.287 SN2008es‡ 0.205 SN2013hx‡ 0.130
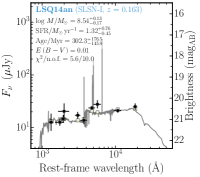
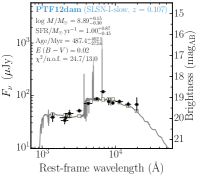
In the following, we take advantage of the full SUSHIES sample and present distribution functions of the primary diagnostics mass and SFR of H-poor and -rich SLSNe host galaxies.121212We omit discussing the age of the stellar populations and their attenuation. In particular, the age is notoriously difficult to measure accurately and precisely. Figures 2, 18 and 22 show the best fit of each host galaxy and the evolution of the galaxy properties are shown in Fig. 8. Table 5 lists the model parameters. The ensemble properties in different redshift bins are summarised in Table 4.
4.4.1 Stellar mass
The host masses (panel B in Fig. 8) span a range between and for both classes of SLSNe. This dearth of hosts above is remarkable. Assuming that SLSNe populate galaxies according to their star-formation rate, we would in fact expect of hosts galaxies to have masses above . However, only one of the 53 SLSNe-I and two of the 16 H-rich SLSNe have such a high stellar mass. The probability of randomly drawing a sample that is at least as extreme as the SLSN-I sample from UltraVISTA, weighted by the SFR, is at all redshifts (Fig. 14). For H-rich SLSNe, this scenario cannot be excluded, however, as we will show below, the H-rich SLSN host sample has also some peculiar properties compared to the general population of star-forming galaxies. The lack of massive galaxies for both classes strongly argues for a stifled production efficiency in massive galaxies (see also Perley et al. 2016b). We investigate its origin in detail in Sect. 5.2.
Apart from the dearth of massive hosts, we observe clear differences between the host populations of both SLSN classes. H-poor SLSNe are preferentially found in galaxies with average masses of at . As redshift increases, the average masses gradually increase to at , while the dispersion remains constant at dex (Figs. 8, 26; Table 4). Using the parametrisation of the mass function in Muzzin et al. (2013), the average masses correspond to and at and , respectively. Differences between the hosts of fast and slow-declining SLSNe are not present in our sample. A two-sided Anderson-Darling test gives value of 0.72.
Hydrogen-rich SLSNe, in contrast to SLSNe-I, probe a significantly larger portion of the parameter space of the general population of star-forming galaxies. Their distribution is not only shifted by 0.8 dex to higher masses, but the distribution also includes three hosts that are even less massive than the least massive SLSN-I host. The dispersion is dex broader compared to the H-poor sample and even dex broader compared to the UltraVISTA survey (Tables 4, 25). Despite a larger dispersion, the probability of randomly drawing a distribution that is at least as extreme as the H-rich population from the UltraVISTA sample is 25% and hence does not point to a significant difference to the general population of star-forming galaxies Even after separating out the three SLSNe-II, of which two occurred in galaxies with masses between and , the dispersion remains unchanged. While this result is noteworthy, the chance probability to randomly draw the SLSN-IIn sample from the UltraVISTA sample is 21% (Fig. 16).
4.4.2 Star-formation rate
Panel C in Fig. 8 displays the evolution of the dust-corrected star-formation rate (SFR). Hosts of H-poor SLSNe have similar SFRs to the general population of star-forming galaxies (Tables 4, 25), but smaller SFRs than host galaxies of GRBs and regular core-collapse SNe. The mean SFR rapidly grows with increasing look-back time from at to at (Table 4). In singular cases, the SFR reaches (SN1000+0216 and SNLS06D4eu; Table 8). While the mean value evolves with redshift, the dispersion remains constant at dex. The SFR increases somewhat faster compared to UltraVISTA, out to , but statistically both distributions remain similar (Fig. 14).
Host galaxies of H-rich SLSNe exhibit different characteristics. The three H-rich SLSNe with broad Balmer emission lines exploded in galaxies with low SFRs. Two of the hosts (SNe 2008es and 2013hx) have very low SFRs between 0.01 and . In contrast, SLSNe-IIn are found in a more diverse population of star-forming galaxies. Their defining property is again the large dispersion of dex (Table 4). Their average SFR is only modestly larger compared to the galaxy samples discussed in this paper (Fig. 26).
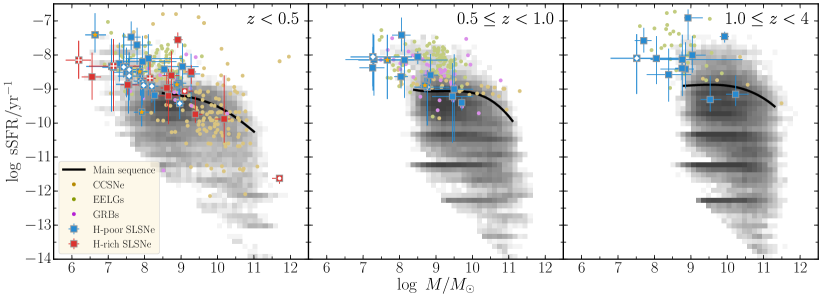
Although the SFRs of SLSN-I hosts are similar to the general population of star-forming galaxies, they are on average less vigorously star-forming than GRB and regular CCSN host galaxies. However, in the previous section, we revealed that especially the H-poor SLSNe are found in very low mass galaxies. Likewise, hosts of H-rich SLSNe have higher average SFRs but their mass distribution is skewed to higher masses and is substantially broader. To better understand how SLSN host galaxies fit in the context of other galaxy samples, we normalise the SFR by the stellar mass (so-called specific star-formation rate, sSFR).
Figure 9 displays the two classes of SLSNe in the sSFR-mass plane in three different redshift intervals. Both classes are characterised by high sSFR between and at all redshifts. They reside in a part of the parameter space well above the galaxy main-sequence (black curves in Fig. 9) that is occupied by starburst galaxies. The most extreme hosts have sSFR that are two orders of magnitude in excess to the galaxy main sequence, indicating that some hosts experience very extreme starbursts. In general, SLSN-I hosts are found in the region of the parameter space that is occupied by extreme emission-line galaxies and more extreme than of GRBs and of regular CCSNe, which trace the bulk of the population of star-forming galaxies. Host galaxies of H-rich SLSNe have high sSFR as well but because of their high stellar masses, their parameter space is more extended.
4.5 A radio perspective on SLSN host galaxies
Radio emission from star-forming galaxies is an excellent tracer of the total SFR (Condon 1992; Schmitt et al. 2006; Murphy et al. 2011; Calzetti 2013). In contrast to SED modelling and emission-line diagnostics, e.g., Balmer lines, it is independent of any extinction correction, although radio SFRs do suffer from time-delay for SNe to explode and create sufficient cosmic rays.
Almost all SLSN hosts lie in the footprints of wide-field radio surveys, such as FIRST, NVSS and SUMSS. All hosts evaded detection in individual images down to the nominal r.m.s. levels of the surveys: FIRST mJy/beam, NVSS mJy/beam and SUMSS mJy/beam (see Table 23 for individual measurements). To place tighter constraints on the average radio brightness of the host populations, we stack the data of the 51 fields with VLA FIRST data. We first divide the sample into three redshift bins (, and ) and according to the SN type. Afterwards, we centre the images on the supernova positions and median-combine them. Also, in the stacks no host population is detected down to an r.m.s. of 32–60 Jy/beam at all redshifts (Table 7).
Following the method in Michałowski et al. (2009), we translate the flux density into SFR limits.131313 This method is based on Bell (2003) and assumes a power-law shaped radio continuum with a spectral index of (; Condon 1992; Ibar et al. 2009). The non-detections correspond to SFR limits between at to at , and exceed the SED-derived SFRs by factors 21 to 120 (Table 7). This allows ruling out truly extreme obscured star formation, in agreement with the observed colours and the absence of reddened SLSNe in our sample.
In addition to the survey data, the hosts of MLS121104, SN2005ap and SN2008fz were targets of our JVLA campaign. All three hosts evaded detection down to nominal r.m.s. values of 15, 25 and 15 Jy/beam for MLS121104, SN2005ap and SN2008fz, respectively. Those limits correspond to SFR limits of 6.2, 9.0 and , respectively. The limit on MLS121104 is of particular interest. It is the only known host with a super-solar metal abundance. The SED modelling revealed a dust-corrected SFR of (Table 5), which is comparable to the radio limit within errors, implying that the optical diagnostics probed the total star formation activity in the galaxy. The high upper limits on the hosts of SNe 2005ap and 2008fz exceed the SED-SFRs by at least a factor of 50 and, hence, do not have much meaning (Table 5).
| Redshift | Number | r.m.s. | (tot.) | (SED) |
| interval | (Jy/beam) | |||
| H-poor SLSN host galaxies | ||||
| 17 | 42.5 | |||
| () | ||||
| 12 | 44.2 | |||
| () | ||||
| 9 | 56.3 | |||
| () | ||||
| H-rich SLSN host galaxies | ||||
| 13 | 49.4 | |||
| () | ||||
| H-poor and H-rich SLSN host galaxies | ||||
| 30 | 32.2 | |||
| () | ||||
Note. — The r.m.s. level is calculated from the stacked FIRST image and converted into a limit on the total unobscured star-formation rate at the median redshift of each sample. The weighted means of the SED-derived SFR is reported for comparison. For details, see Sect. 4.5. The second value in the redshift column reports the mean redshift of each redshift interval.
5 Discussion
5.1 Evolution of SLSN-I host galaxies
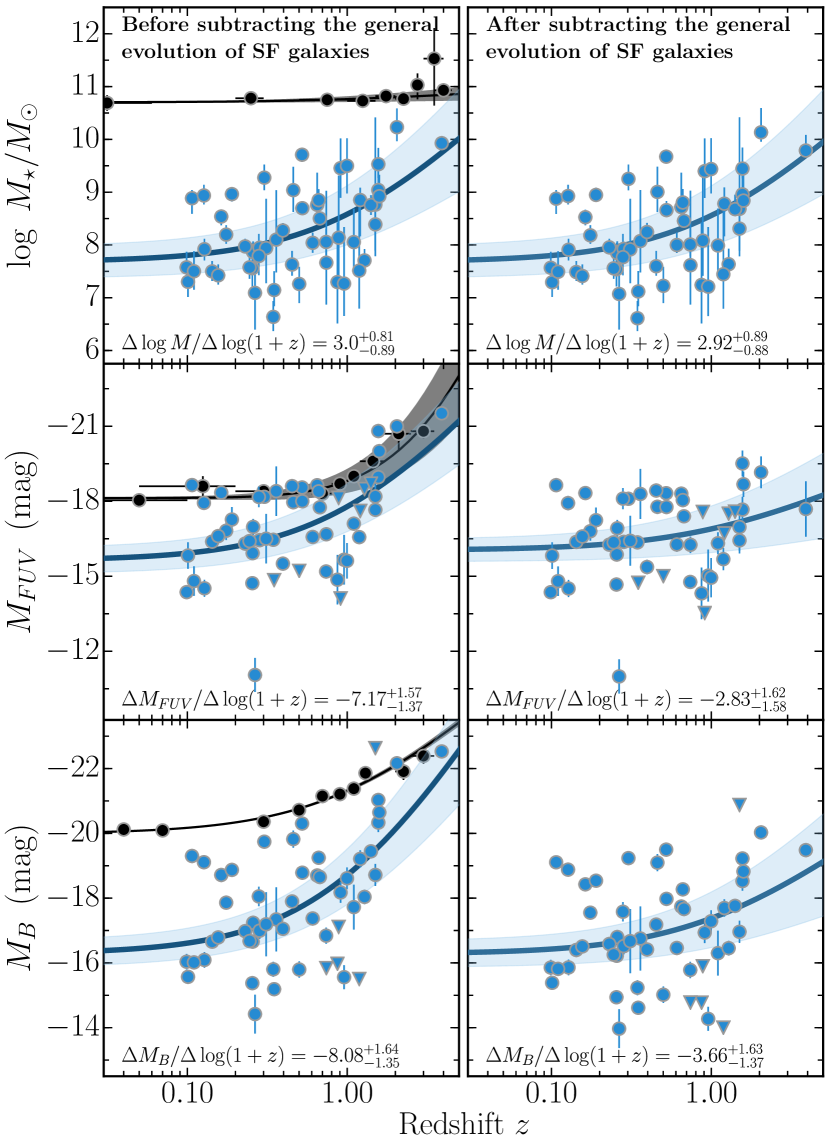
In the previous sections, we revealed a rapid evolution of -band luminosity and the SFR of SLSN-I host galaxies. In the following, we quantify how mass, FUV luminosity (as a tracer of the SFR) and the -band luminosity of the SLSN-I host population evolve throughout cosmic time. The redshift evolution of these diagnostics is displayed in Fig. 10 (left panels). We fit these data with the linear model and propagate errors through an MC simulation and bootstrapping, as described in Sect. 3.4.
The left panels in Fig. 10 show the best fits and their error contours. The mass, FUV and the -band luminosity of SLSN-I hosts show a moderate to strong redshift dependence with a linear correlation coefficient between and (Table 8). The probability of generating each of these linear correlations by chance is between and , respectively (–; Table 8).
To isolate the differential evolution of SLSN host galaxies from known global trends, we repeat the analysis after subtracting the evolution of the mass function, and the FUV and -band luminosity functions of star-forming galaxies. As tracers for the secular evolution, we use the characteristic luminosities and masses of the luminosity and mass functions: FUV: Wyder et al. (2005) and Cucciati et al. (2012); band: Madgwick et al. (2002), Faber et al. (2007) and Marchesini et al. (2007); and mass: Baldry et al. (2012), Muzzin et al. (2013) and Grazian et al. (2015).
The right panels in Fig. 10 show the redshift evolution of the host properties after detrending. The strong redshift evolution in the band and the FUV is consistent with the general cosmic evolution of star-forming galaxies. After detrending the data, the differential evolution in the FUV and band is consistent with no evolution. The chance probability increases from to (i.e., ; Table 8). The galaxy mass, on the other hand, still shows a moderate redshift dependence [], though with a significantly higher chance probability of (equivalent to ; Table 8).
Intriguingly, the rate with which the stellar mass of SLSN-I host galaxies increases with redshift before and after detrending is close to the redshift dependence of the characteristic mass in the mass-metallicity relation [; Zahid et al. 2014]. This suggests that metallicity could be a regulating factor in the SLSN production (as argued by Chen et al. 2017 and Perley et al. 2016b). In the following section, we investigate this relationship in detail.
Due to the small redshift range probed by our H-rich SLSN sample, the redshift dependence of their physical properties is inconclusive.
| Property | Linear correlation | Linear model | ||
|---|---|---|---|---|
| slope | intercept | |||
| Before removing the cosmic evolution of SF galaxies | ||||
| Mass | ||||
| After removing the cosmic evolution of SF galaxies | ||||
| Mass | ||||
Note. — The two sets of fits show the redshift evolution before and after correction for global trends of star-forming (SF) galaxies. The columns of the linear correlation analysis display the linear correlation coefficient , and the corresponding chance probability . The redshift evolution is parametrised with the linear model .
5.2 Metallicity bias
5.2.1 Dependence of SLSN formation on host galaxy mass
To quantify the effect of the physical parameters of SLSN host galaxies on SLSN formation, we contrast the galactic environments of SLSN explosions to those of star-forming galaxies in general. In addition to our SLSN host data, we hence require a census of cosmic star-formation in the respective redshift range as complete as possible. Fortunately, numerous deep-field photometric galaxy surveys compiled in recent years provide a good match to our SLSN imaging data.
The deepest surveys that probe a sufficient cosmic volume are COSMOS (Scoville et al. 2007) and CANDELS (Grogin et al. 2011; Koekemoer et al. 2011); both have high completeness levels for galaxies above stellar masses of at (e.g., Tomczak et al. 2014). However, this is still two orders of magnitude higher than our least massive SLSN hosts (Table 5). Nonetheless, we extrapolate the mass functions to the lowest observed galaxy masses (). This extrapolation will add some uncertainty, but mass and luminosity functions of star-forming galaxies are rather well constrained and show no hints for plunging at the faint-end.
The primary parameter that we are interested in is galaxy stellar mass , because it is known to correlate well with the average galaxy metallicity. Metallicity, in turn, has a strong effect on the evolution of massive stars through line-driven stellar winds. Similar considerations have previously been applied to GRB hosts, where after a long debate, the impact of metallicity on long GRB-selected galaxies is now relatively robustly established (e.g., Krühler et al. 2015; Schulze et al. 2015; Vergani et al. 2015; Perley et al. 2016c).
In addition to galaxies from wide-field surveys, we also compare the mass distribution of our SLSN hosts to those of star-forming galaxies selected through GRBs (Hjorth et al. 2012; Perley et al. 2016a) and low-redshift core-collapse supernovae from untargeted surveys (Stoll et al. 2013). The latter is a particularly suitable control sample, as normal CCSNe are thought to trace all star-forming environments in a relatively direct and unbiased way (Stoll et al. 2013). For simplicity and the sake of clarity, we do not differentiate between CCSNe sub-types.
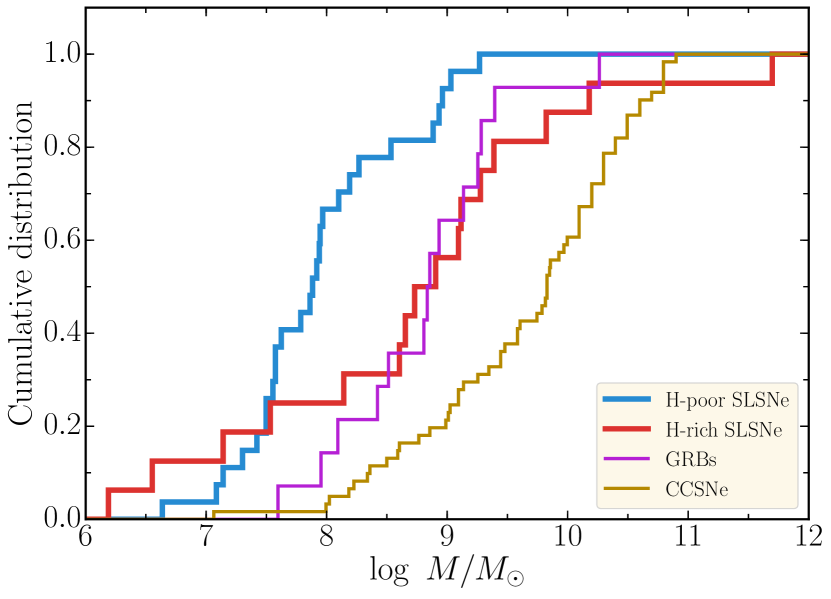
Figure 11 shows the cumulative histograms of stellar masses for the four kinds of transients at . Clearly, SLSNe-I trace the least massive systems. The median stellar mass increases towards GRB hosts and galaxies selected by more frequent regular CCSNe (Fig. 11). An Anderson-Darling test between GRB and SLSN-I host galaxies at rejects the notion that long GRBs and SLSN-I have similar host mass distributions (). Moreover, at , none of the SLSN-I hosts in our sample of 41 events has a stellar mass above , whereas of CCSNe form in such massive galaxies. Thus, it is immediately obvious that a strong effect prevents SLSN-I from forming in galaxies of high stellar mass.
SLSN-IIn hosts are 0.8 dex more massive than SLSN-I hosts, as noted previously in Leloudas et al. (2015c) and Perley et al. (2016b). Their mass distribution is comparable to the GRB hosts (within the limited number statistics). Here, we also find a lack of massive hosts above , though the metallicity dependence is weaker.
5.2.2 SLSNe are biased tracers of SFR
Under the working hypothesis that massive stars are the progenitors of SLSNe, they should also trace star formation in a particular way. However, previous experience with GRB hosts has illustrated that environmental factors, most commonly attributed to a low progenitor metallicity, can have a significant effect (e.g., Graham & Fruchter 2013; Schulze et al. 2015; Perley et al. 2016b). This effect is presumably even stronger in SLSN-selected galaxies, considering their mass distributions (Fig. 11).
To better illustrate the efficiency of SLSN production with host stellar mass (or metallicity), we need to normalise the number of SLSN-selected galaxies by the contribution of similar massive systems to the cosmic star-formation at the given redshifts. We derive this by starting with the stellar mass function of star-forming galaxies from CANDELS. This yields the number density of galaxies per stellar mass bin. We use the parametrisation of for star-forming galaxies from Table 2 of Tomczak et al. (2014) and note that the stellar-mass functions from Ilbert et al. (2013) or Muzzin et al. (2013) are similar and do not alter our conclusions significantly.
Then, we sum the star-formation rate of all contributing galaxies by integrating over the scatter of all galaxies in the galaxy main sequence at a given stellar mass (e.g., Whitaker et al. 2012; Sobral et al. 2014; Speagle et al. 2014; Tasca et al. 2015). The SFR-weighted mass histogram, shown in Fig. 12 in yellow, peaks at around , and provides a good match to the sample of host galaxies of CCSN selected from untargeted surveys. In contrast, the mass histogram of SLSN-hosting galaxies peaks two orders of magnitudes lower, which is clearly inconsistent with the typical environments where the bulk of the stars are produced at .
5.2.3 SLSNe production efficiency
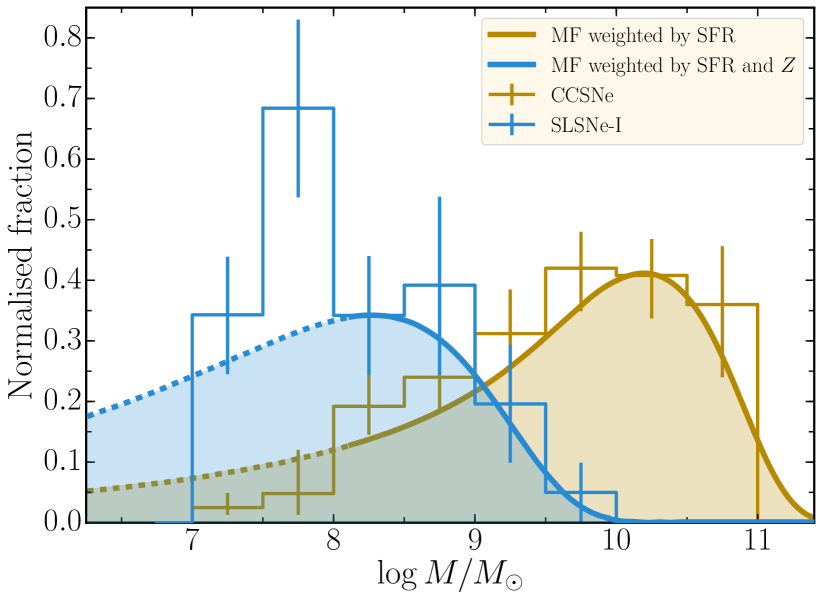
We modelled the SLSN-I host stellar mass histogram by applying a function that describes an efficiency of producing SLSNe from star-formation. We chose as an exponential function in the form of , where is a characteristic cut-off mass, where the production efficiency dropped to , and a cut-off strength. This essentially shuts off SLSN production in galaxies of high stellar mass. Physically, this can be interpreted as a decrease in the probability of creating SLSNe-I from massive stars above a characteristic cut-off metallicity, where we assume that stellar mass at a given star-formation rate relates to host metallicity at stellar masses below (e.g., Maiolino et al. 2008; Yates et al. 2012).
We minimise the deviation between model and data by varying and using an MC method on bootstrapped distributions of SLSN-I host masses derived from our parent sample. Statistical errors on host masses are included in the procedure by varying them according to the uncertainties in Table 5 within each trial. The best-fit model is obtained at corresponding to and . While our procedure can constrain relatively accurately, the cut-off shape is not yet well measured. Acceptable fits are obtained in a range between and , where the latter illustrates an infinitively sharp cutoff at . Of course, the parameters and are not fully independent. The higher the cut-off mass, the sharper the cutoff. Figure 13 shows the best-fit and a region which contains 68% of all MC trials.
For comparison, we modelled the mass distribution of our GRB host galaxy sample with the same model (purple curve in Fig. 13). Its mass distribution points to a higher metallicity cut-off at (i.e., a 0.3 dex larger oxygen abundance than SLSN-I host galaxies), in agreement with Krühler et al. (2015) and marginally lower than Perley et al. (2016b).
For SLSNe-II, number statistics are still too low to derive robust constraints, but the host mass distribution indicates a behaviour similar to that observed for GRB hosts.
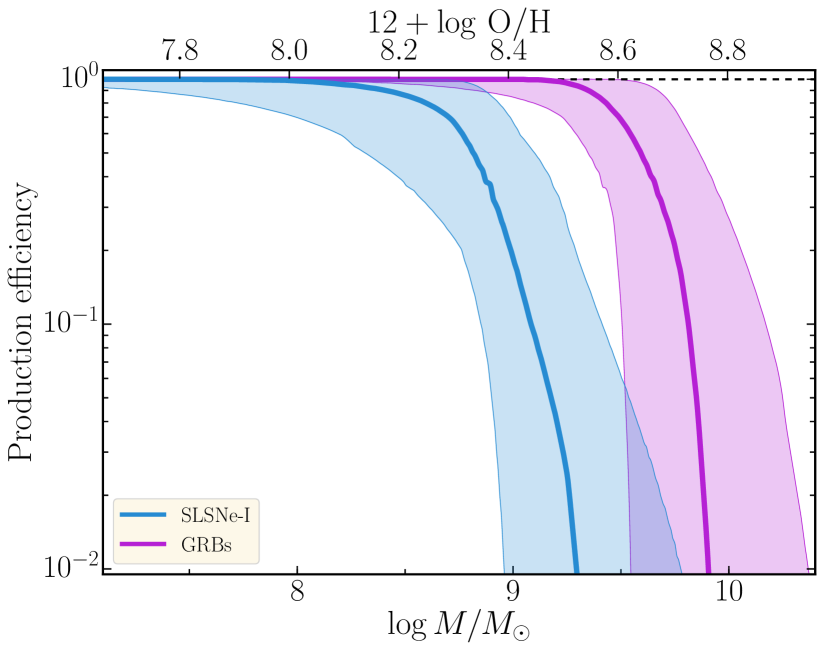
5.3 On the factors behind forming H-poor SLSNe
In the first paper of our series (Leloudas et al. 2015c), we showed that the metallicities (directly measured from spectra) of SLSN-I hosts were low (median value being 0.27 solar metallicity). They were modestly lower than those of GRB hosts, although the difference was statistically insignificant. What is even more striking in the case of SLSNe-I is that their host spectra exhibit emission lines with very large rest-frame equivalent widths. In of the cases, we observed rest-frame equivalent widths exceeding 100 Å and in some extreme cases reaching up to 500–800 Å.
The presence of EELGs in our sample is extremely unusual (only 1% of galaxies in the zCOSMOS survey have rest-frame EW Å; Amorín et al. 2015), and we determined that their frequency could not be a chance coincidence (; Leloudas et al. 2015c). On average, even GRB hosts do not show such strong emission lines. The difference to the distribution of a complete sample of GRBs at (Hjorth et al. 2012) was found to be statistically significant, although the strongest emitters in our sample were mostly found at . The difference was even more pronounced in [O iii]5007 than in H, pointing to a higher ionisation fraction in the gas around SLSNe.
These extreme properties were also seen by directly measuring the ionisation parameter and the ratio between [N ii]/H and [O iii]5007/H (BPT diagram; Baldwin et al. 1981), where the overwhelming majority of H-poor SLSNe were found to be in regions with . As the equivalent widths of the lines decrease with time after a starburst (e.g., Leitherer et al. 1999), this evidence strongly points towards very young environments for SLSN-I hosts.141414The relation between the H equivalent width and the age of the starburst also has a dependence on metallicity (Inoue 2011) and the shape of the star-formation histories (e.g., Terlevich et al. 2004; Lee et al. 2009). This led us to propose that the progenitors of H-poor SLSNe are very young, and are on average more short-lived than those of GRBs (Leloudas et al. 2015c). Although absolute ages are notoriously difficult to determine, we identified a very young stellar population with an age of only at the explosion site of PTF12dam, which is the most extreme example in our sample (in terms of emission-line strength; Thöne et al. 2015).
Recently, Chen et al. (2017) questioned the importance of young age for H-poor SLSN progenitors, proposing that metallicity is the only key factor leading to the production of SLSNe. These authors approximated the effect of age through the sSFR and by comparing the parameter spaces of their SLSN host samples in the metallicity-sSFR plane to complete samples of star-forming galaxies in the local volume (11HUGS and LVL; Kennicutt et al. 2008; Lee et al. 2011). However, the two properties are intimately connected through the mass-metallicity-SFR fundamental relation (Mannucci et al. 2011) and can therefore not be easily disentangled. Thus, we expect to see metallicity and age to drive the SLSN production. Attributing the dependence of H-poor SLSNe simply on metallicity has led many authors (e.g., Lunnan et al. 2014; Chen et al. 2017) to support a magnetar origin for these explosions, although this explanation is not unique. Acknowledging that young age plays an important role as well allows models based on more massive progenitors to remain equally competitive (Leloudas et al. 2015c; Thöne et al. 2015).
In contrast to Leloudas et al. (2015c), Perley et al. (2016b) argued that the fraction of starbursts (defined as sSFR in their papers) among SLSN-I hosts is not exceptionally large and that the starburst fraction among H-poor SLSN hosts may be explained by the fact that dwarf galaxies tend to have bursty star-formation histories (e.g., Guo et al. 2016). By using the study of Lee et al. (2009), we show that the fraction of SLSNe-I occurring in EELGs in the Leloudas et al. (2015c) sample is significantly increased, even with respect to dwarf galaxies. Lee et al. (2009) determined the fraction of starbursts among local dwarfs in the 11HUGS survey, which is the same survey that Perley et al. (2016b) and Chen et al. (2017) used as their main comparison galaxy sample. Furthermore, Lee et al. (2009) used the same operational definition of starburst that we use for EELGs (), making a direct comparison straightforward. They determined that only 6% of dwarf galaxies in the absolute magnitude range of interest () have (and only 8% have ). This means that the probability of attaining the same fraction of EELGs among H-poor SLSN hosts as in Leloudas et al. (2015c) by chance is . This might be larger than what is obtained by comparing with zCOSMOS (), but a chance coincidence is still extremely unlikely. This can also be understood in the following way: if the duty cycles in the bursty SFH of dwarf galaxies are 1–2 Gyr, it is very unlikely that we would happen to catch them by chance so close to an initial starburst, when selecting them through H-poor SLSNe.
We therefore argue that both low metallicity and young age play important roles in the formation of H-poor SLSNe, and that stellar evolution in metal-poor, starburst environments needs to be better understood to fully appreciate the context. In particular, mass loss in these extreme regimes is poorly understood and more effort needs to be put into understanding why these explosions are H-poor and whether this can be attributed to eruptive mass loss (Woosley et al. 2007; Quataert & Shiode 2012), homogeneous evolution (Yoon & Langer 2005), binarity (Eldridge et al. 2008) or another, yet unknown, factor.
5.4 SLSN host galaxies in the context of other galaxy populations
In the previous sections, we discussed particular aspects of the host populations. In the following, we compare the host properties to those of other galaxy samples.
5.4.1 SLSN-I host population
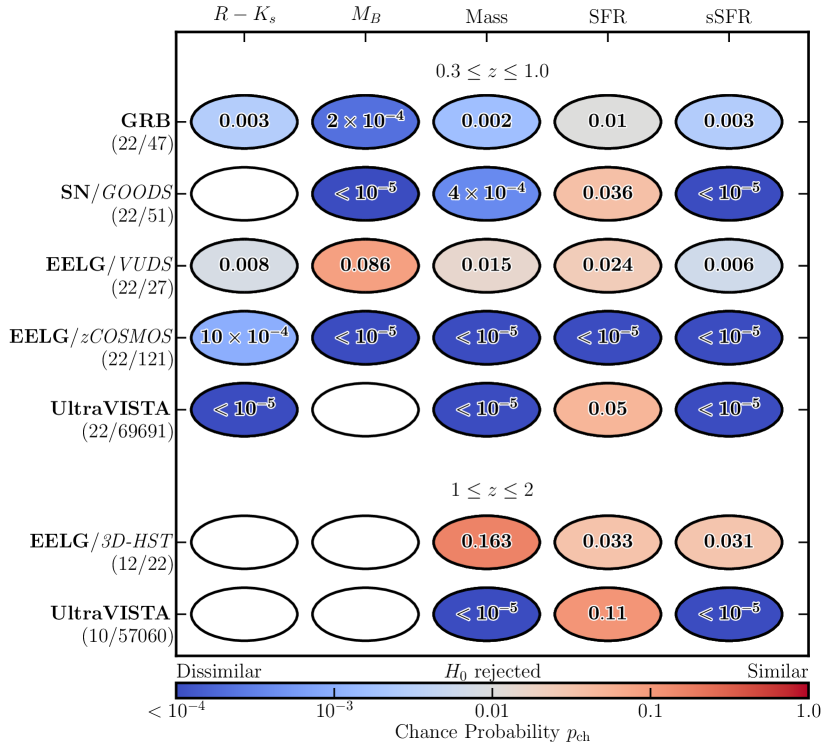
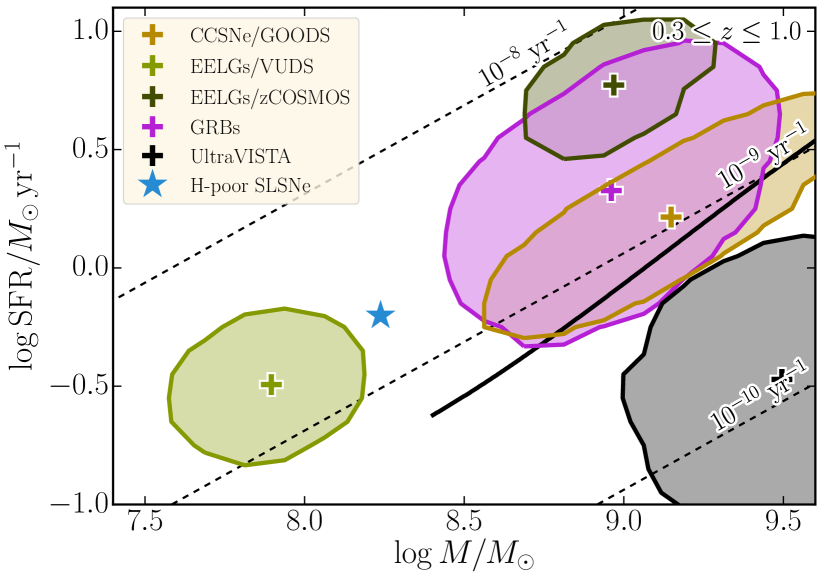
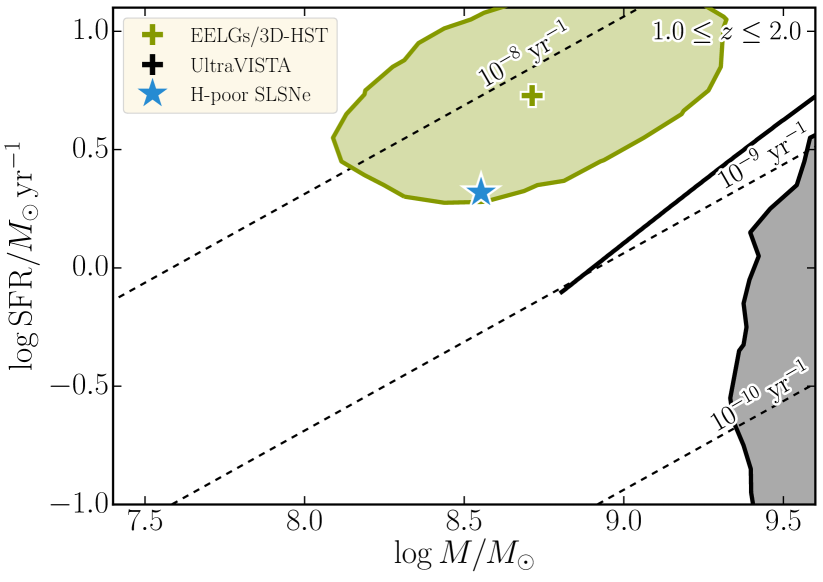
Hydrogen-poor SLSNe are preferentially found in blue low-mass dwarf galaxies with high sSFR and metallicities of . These properties are similar to those of extreme emission-line galaxies and GRB host galaxies. This sparked a long-standing debate on how strong the similarities actually are (e.g., Lunnan et al. 2014; Chen et al. 2015; Leloudas et al. 2015c; Angus et al. 2016; Japelj et al. 2016). The answer to this question was not only of interest to compare the galaxy populations, but also to draw conclusions on the progenitors of GRBs and SLSNe (see previous section) and even to propose similarities in the energy source powering these two stellar explosions.
Previous studies were limited to small samples ( objects) or even to the comparison with galaxy samples at different redshifts. In some cases, selection criteria were introduced that led to non-random sampling of distribution functions, such as excluding GRB and SLSN host galaxies without -band observations (Japelj et al. 2016).151515For example, of our SLSN hosts at are too faint to obtain meaningful -band constraints, even with the most efficient instruments. Given the size of our GRB and SLSN samples ( objects each; Table 3), we attempt to provide a new perspective on this conundrum and to how SLSN hosts compare to other galaxy samples. We divide our samples into two redshift intervals: and . Each of these intervals covers a lookback-time interval of 2.6–4.4 Gyr, which is a compromise between minimising the impact of the general cosmic evolution of star-forming galaxies and maximising number statistics. For the GRB sample, we also modelled the SEDs with the same assumptions and the same software as for the SLSN host galaxies, to minimise systematic errors.
To assess the differences, we apply two distinct tests. We use two-sided Anderson-Darling tests to ascertain differences in the distribution functions, and we quantify the frequency of how often the estimator of the mean mass and SFR of SLSN-I host galaxies can be obtained from the comparison samples by chance (2D test; for details see Sect. 3.4). While an AD test compares distribution functions, the 2D test compares multiple parameters at the same time, namely SFR, mass and indirectly the sSFR. Therefore, its outcome is less sensitive to the selected properties. The 2D tests are, however, limited to mean values. We reject the null hypothesis that two distributions are statistically similar, if the chance probability is for a given test.
Figure 14 summarises the values of the AD tests for five different properties (-band luminosity, colour, mass, SFR and sSFR). The AD tests between distributions of SLSN-I and GRB hosts reveal low values between (-band luminosity) and 0.01 (SFR). The statistical tests in the mass-SFR plane, displayed in Fig. 15, corroborate these results. The chance probability to extract an estimator from the GRB sample with a mean mass and SFR similar to SLSN-I hosts is (equivalent to ). Therefore, we reject the null hypothesis that GRB and SLSN host galaxies are statistically similar. We stress that revealing these differences requires large and homogenous samples, like the one presented in this paper, which were not available in previous studies.
Leloudas et al. (2015c) ignited the SLSN-EELG connection by unravelling a high incidence rate of hosts with intense [O iii] emission and ionisation conditions comparable to EELGs for our spectroscopy sample. The comparison between properties of the stellar component is less straightforward. The statistical tests point to similarities with 3D-HST EELGs at (–0.16), but to weaker similarities with VUDS EELGs (–0.09) and even stark differences to zCOSMOS EELGs () at lower redshift (Figs. 14, 15).
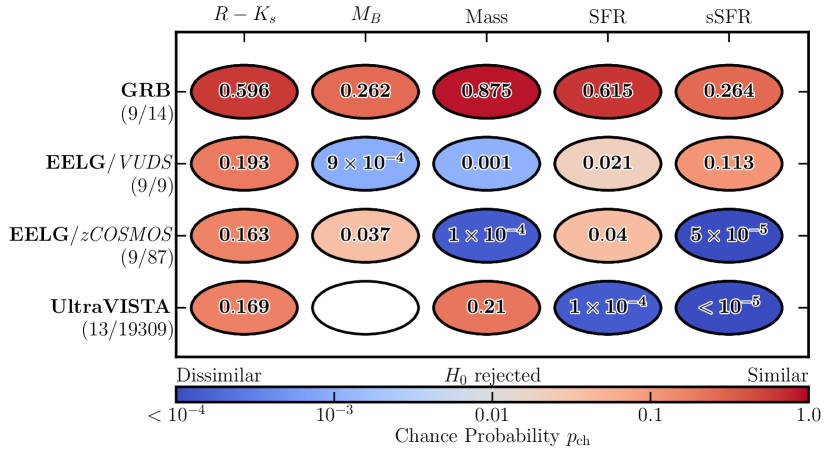
These findings can be reconciled with the definition of EELGs and how they are identified in galaxy surveys. EELGs are defined spectroscopically by Å (a measure of the recent star-formation activity normalised to the light from all stars). Furthermore, the VUDS EELGs were originally pooled from a galaxy sample with a brightness of , whereas the zCOSMOS sample was limited to bright and therefore more massive EELG candidates [ mag; Tables 3, 25]. In contrast, the average -band brightness of SLSN-I hosts at is mag, similar to VUDS EELGs but mag fainter than the -band magnitude limit of the zCOSMOS sample. This immediately explains why the properties of the stellar-component of SLSN-I host galaxies and zCOSMOS EELGs are so distinct. The stellar component in SLSN-I host galaxies is more similar to VUDS EELGs, though the statistical tests are inconclusive as to whether they are indeed statistically similar or distinct. Differences between the stellar components of SLSN-I host galaxies and EELG samples are expected because the properties of the ionised gas for a larger number of SLSN-I hosts is not as extreme as that of EELGs. Furthermore, the different EELG samples show that this ephemeral and transformative phase in galaxy evolution is observed in galaxies over a wide range of masses.
5.4.2 SLSN-IIn host population
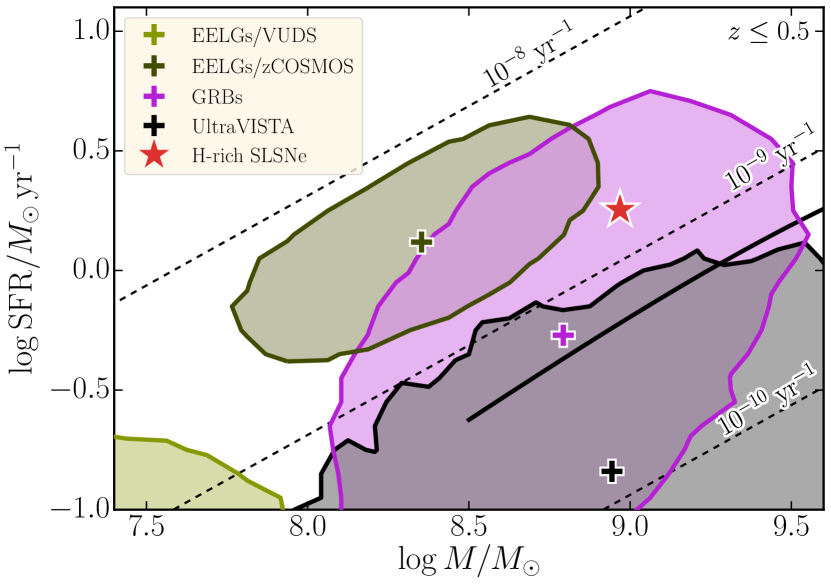
The host population of SLSNe-IIn is characterised by a rich diversity: i) the mass and luminosity distributions have dispersions that are a factor of 1.5–2 larger compared to any other class of star-forming galaxies discussed in this paper; ii) hosts with stellar masses of more than are scarce, despite the large dispersion in galaxy mass; iii) the colour has a mean and a dispersion that is similar to star-forming galaxies; and iv) the sSFRs are shifted by 0.6 dex towards higher sSFR with respect to the main sequence of star-forming galaxies in the mass-sSFR plane (Fig. 9).
The large dispersion measurements are difficult to map to a single progenitor system of SLSNe-IIn. Type IIn SNe are primarily powered by the interaction of the SN ejecta with the circumstellar material expelled prior to explosion. If the interaction is strong, the signature of the original SN gets washed out. In the most extreme cases of CSM interaction, even different types of CCSNe as well as thermonuclear Type Ia SNe could give rise to Type IIn SNe (e.g., Leloudas et al. 2015a). The fact that all hosts show evidence for recent star-formation and have very high sSFRs suggests that the contamination by Type Ia SNe is low. This implies that the diversity is primarily due to different progenitor channels (see also Angus et al. 2016).
Similar to the SLSN-I host population, we perform AD tests (Fig. 16) and the tests in the mass-SFR plane (Fig. 17) to put the SLSN-IIn host population in context with other galaxy samples. Despite the limited number statistics, the SLSN-IIn host population is clearly distinct from the general population of star-forming galaxies in the UltraVISTA survey. While the distribution functions are broader than those of other galaxy samples, the lack of massive hosts suggests some dependence on environment properties. The similarities of the distribution functions to GRBs as well as the locus in the mass-SFR plane suggests that their hosts are similar. The lack of massive host galaxies would suggests a stifled production efficiency at metallicities higher than , the metallicity above which the GRB production efficiency is significantly reduced (Sect. 5.2.3). However, the small number of SLSN-IIn in conjunction with their rich diversity precludes drawing a firm conclusion, yet.
5.4.3 SLSN-II host population
The family of type II SLSNe is the rarest class among SLSNe. In constrast to SLSN-IIn, the emission of SLSNe-II is not powered by strong interaction of the SN ejecta with the circum-stellar material. Only 3 events among the 29 H-rich SLSNe known today belong to this class.161616This number was compiled from the sample presented here and in Perley et al. (2016b), and also includes two H-rich SLSNe that were reported in the literature but not discussed in these papers. Their host properties seem to be distinct from the average properties of the SLSN-IIn family. Type II SLSNe occupy the lower to bottom half of the distribution functions. Two of three hosts are even among the least massive galaxies in our sample (–). Those masses are comparable to the least massive dwarf galaxies in the local Universe. According to the parameterisation of the mass-metallicity relation in Andrews & Martini (2013), their masses point to galaxies with metallicity of .
Intriguingly, Yan et al. (2015, 2017) revealed that an increasing number of SLSNe-I showed episodic hydrogen emission at late phases. The properties of these hydrogen emission lines are similar to those of CSS121015, SN2008es and SN2013hx. Yan et al. (2015, 2017) attributed this feature to pulsational instabilities, where the outer H-rich envelope is expelled during a violent mass-loss episode. As the SN ejecta traverses the circumstellar material, shocks between the ejecta and the circumstellar material produce episodic hydrogen emission. Alternatively, these authors proposed that the progenitor retained a thin layer of hydrogen where recombination lines emerge only after the SN ejecta cooled down. Hence, it is possible that SLSNe-II are more closely connected to SLSNe-I.
Inserra et al. (2016) noted that the spectroscopic and photometric properties of SN2013hx showed similarities to brighter regular Type II SNe. However, even these brighter regular Type II SNe are still significantly less luminous than SLSNe. It is not clear how stars with an extended hydrogen envelope could produce such high luminosities. Larger samples are needed to better understand how the SLSN II population compares to different classes of SNe and SLSNe.
5.5 Selection biases
Our conclusions could be affected by various selection biases, such as publication bias, target selection bias and classification bias. Moreover, the SUSHIES sample is compiled from different SN surveys, which makes it even more difficult to quantify the effective bias.
To examine whether our sample has the same level of bias as the PS1 and PTF samples, we perform two-sided AD tests between the distributions of the host properties. If the probability of randomly drawing a distribution from the PS1/PTF samples, which is at least as extreme as the SUSHIES sample, is larger than 1%, we reject the hypothesis that the level of bias in SUSHIES is different from the PS1 and PTF samples. For a fair comparison, we remove common objects and split our sample into two redshift intervals to take the redshift domains of the PS1 and the PTF samples into account: for the PTF sample and for the PS1 sample.
The AD tests between the -band luminosity, mass and SFR distributions of 20 SLSN-I hosts from our sample and 16 SLSN-I hosts from the PTF sample give a high chance probability of agreement of . For SLSN-II/IIn hosts, the chance probability of is even substantially higher (SUSHIES: 13 objects, PTF: 14 objects). A similar result can be obtained from the comparison with the PS1 sample (; SUSHIES: 11 objects, PS1: 15 objects).
6 Summary
We present the photometric properties of 53 H-poor and 16 H-rich SLSNe, detected before 2015 and publicly announced before mid 2015. Among those are four new SLSNe (two of each type), found in the ASIAGO SN catalogue, with a peak luminosity significantly brighter than mag. Each host is a target of deep imaging campaigns that probe the rest-frame UV to NIR. In addition, we incorporate radio data from wide-field surveys and JVLA observations to put limits on the total star-formation activity. By modelling the spectral energy distributions, we derive physical properties, such as mass, SFR and luminosity, and build distribution functions to ascertain the influence of these properties on the SLSN population. Our main conclusions are:
-
1.
H-poor SLSNe are preferentially found in very blue low-mass dwarf galaxies. Their sSFRs are on average 0.5 dex larger compared to the main sequence of star-forming galaxies and they populate a part of the sSFR-mass parameter space that is typically occupied by EELGs.
-
2.
The host population of SLSNe-IIn shows very complex properties: 1) the mass and luminosity distributions have dispersions that are a factor of 1.5–2 larger compared to all comparison samples; 2) the colour has a mean and a dispersion which is similar to star-forming galaxies; and 3) the sSFRs are on average a factor of 10 larger than of regular star-forming galaxies discussed in this paper. These properties argue for a massive star origin of all SLSNe-IIn in our sample but to a low dependency on integrated host properties. Because the luminosity of SLSNe-IIn is determined by the strength of the interaction and not by a particular type of stellar explosion, this diversity suggests multiple progenitor channels.
-
3.
The hosts of the three Type II SLSNe are at the bottom of any distribution function. Two out of three Type II SLSNe exploded in the least massive host galaxies in our sample (–). Their hosts are similar to those of H-poor SLSNe. Their preference for low-mass and hence low-metallicity galaxies hints to different progenitors from Type IIn SLSNe. Larger samples are needed to draw a conclusion on this question.
-
4.
The scarcity of hosts above for SLSNe-I and SLSNe-IIn can be attributed to a metallicity bias above which the production efficiency is stifled. Assuming an exponential cut-off, the best-fit cut-off metallicity of H-poor SLSNe at is (), which is 0.4 dex lower than for GRBs. The similarities between the mass distributions of SLSN-IIn and GRB host galaxies suggest a metallicity cut-off at solar metallicity.
-
5.
A growing population of SLSN hosts have masses between and . Those objects are among the least massive star-forming galaxies known to date and could represent environments similar to those of starburst galaxies in the early Universe.
-
6.
The redshift evolution of the SLSN-I host population is consistent with the general cosmic evolution of star-forming galaxies. After detrending the data, the galaxy mass shows evidence for differential evolution at confidence, while differential evolution in the -band and FUV luminosity can be excluded at confidence. The evolution of the mass distribution of SLSN-I hosts is similar to the evolution of the mass-metallicity relation, supporting connecting the dearth of massive hosts to a metallicity bias.
-
7.
Multiple statistical tests between the host properties of SLSN-I and GRB host galaxies reveal differences at confidence. H-poor SLSNe are found in less massive (and therefore more metal-poor) hosts than GRBs. To conclusively show that SLSN-I and GRB host galaxies are different on average, large samples with well sampled SEDs are needed.
-
8.
SLSN-I hosts and EELGs show similarities, even in broad-band properties. This suggests that environmental conditions in EELGs play a very important role in the formation of SLSNe-I. We conclude that metallicity is not the sole ingredient regulating the SLSN-I production and suggest that a young age plays an important role in the formation of H-poor SLSNe as well.
-
9.
The class of H-poor SLSNe comprises of fast- and slow-declining SLSNe. A sub-sample of 21 SLSNe-I have measured decline time scales: 14 fast and 7 slow declining SLSNe-I. We find no differences between both host populations. However, larger samples of SLSNe with measured decay time scales are needed to draw a firm conclusion.
-
10.
No host is detected in wide-field radio surveys. At , the limits on the total SFR are a factor of 20 larger than the SFRs derived from SED modelling, ruling out truly obscured star-formation missed by optical diagnostics. This result is consistent with the lack of high-obscured hosts and SLSNe. The deep radio observation of the solar-metallicity host of the H-poor SLSN MLS121104 reveals no difference to the SED-derived SFR.
Acknowledgments
We acknowledge with sadness the unexpected passing of our esteemed colleague, co-author and friend Javier Gorosabel. His support of and contributions to this work and astronomy in general are greatly appreciated.
We thank the referee Sandra Savaglio for a careful reading of the manuscript and for lots of helpful comments that improved this paper.
We thank R. Quimby for sharing an explosion image of SN2005ap, P. Vresswijk and D. A. Perley for the host image of PTF13ajg, T.-W. Chen for an SN image of MLS121104, and A. Uldaski for an SN image of SN2003ma. SSchulze thanks P. Pietrukowicz, D. Whalen and A. Gal-Yam for fruitful discussions.
SSchulze acknowledges support from the CONICYT-Chile FONDECYT Postdoctorado fellowship 3140534 and the Feinberg Graduate School. SSchulze and FEB acknowledge support from Basal-CATA PFB-06/2007, and Project IC120009 “Millennium Institute of Astrophysics (MAS)” of Iniciativa Científica Milenio del Ministerio de Economía, Fomento y Turismo. TK acknowledges support through the Sofja Kovalevskaja Award to P. Schady from the Alexander von Humboldt Foundation of Germany. AdUP and CT acknowledge support from the Ramón y Cajal fellowships and the Spanish Ministry of Economy and Competitiveness through project AyA2014-58381-P. RA acknowledges support from the European Research Council (ERC) Advanced Grant 695671 ‘QUENCH’.
This paper is based partly on observations made with: ESO Telescopes at the La Silla Paranal Observatory; the 6.5-m Magellan Telescopes located at the Las Campanas Observatory, Chile; the Gran Telescopio Canarias (GTC), installed in the Spanish Observatorio del Roque de los Muchachos of the Instituto de Astrofísica de Canarias, in the island of La Palma; the Centro Astronómico Hispano Alemán (CAHA) at Calar Alto, Spain, operated jointly by the Max-Planck Institut für Astronomie and the Instituto de Astrofísica de Andalucía (CSIC); the Nordic Optical Telescope, operated by the Nordic Optical Telescope Scientific Association at the Observatorio del Roque de los Muchachos, La Palma, Spain, of the Instituto de Astrofísica de Canarias; and Karl G. Jansky Very Large Array, New Mexico, United States of America. This research draws upon data provided by Cypriano as distributed by the NOAO Science Archive. NOAO is operated by the Association of Universities for Research in Astronomy (AURA) under a cooperative agreement with the National Science Foundation. This publication makes use of data products from the Wide-field Infrared Survey Explorer (WISE), which is a joint project of the University of California, Los Angeles, and the Jet Propulsion Laboratory/California Institute of Technology, funded by the National Aeronautics and Space Administration. GALEX (Galaxy Evolution Explorer) is a NASA Small Explorer, launched in April 2003. We gratefully acknowledge NASA’s support for construction, operation, and science analysis for the GALEX mission, developed in cooperation with the Centre National d’Etudes Spatiales of France and the Korean Ministry of Science and Technology. Based in part on data collected at the Subaru Telescope, Hawaii, United States of America, which is operated by the National Astronomical Observatory of Japan. The National Radio Astronomy Observatory (NRAO) is a facility of the National Science Foundation operated under cooperative agreement by Associated Universities, Inc. Part of the funding for GROND was generously granted from the Leibniz-Prize to Prof. G. Hasinger (DFG grant HA 1850/28-1).
Funding for SDSS-III has been provided by the Alfred P. Sloan Foundation, the Participating Institutions, the National Science Foundation, and the U.S. Department of Energy Office of Science. The SDSS-III web site is http://www.sdss3.org/. SDSS-III is managed by the Astrophysical Research Consortium for the Participating Institutions of the SDSS-III Collaboration, including the University of Arizona, the Brazilian Participation Group, Brookhaven National Laboratory, University of Cambridge, Carnegie Mellon University, University of Florida, the French Participation Group, the German Participation Group, Harvard University, the Instituto de Astrofísica de Canarias, the Michigan State/Notre Dame/JINA Participation Group, Johns Hopkins University, Lawrence Berkeley National Laboratory, Max Planck Institute for Astrophysics, Max Planck Institute for Extraterrestrial Physics, New Mexico State University, New York University, Ohio State University, Pennsylvania State University, University of Portsmouth, Princeton University, the Spanish Participation Group, University of Tokyo, University of Utah, Vanderbilt University, University of Virginia, University of Washington, and Yale University. Based on observations obtained with MegaPrime/MegaCam, a joint project of CFHT and CEA/IRFU, at the Canada-France-Hawaii Telescope (CFHT), which is operated by the National Research Council (NRC) of Canada, the Institut National des Science de l’Univers of the Centre National de la Recherche Scientifique (CNRS) of France and the University of Hawaii. This work is partly based on data products produced at Terapix available at the Canadian Astronomy Data Centre as part of the Canada-France-Hawaii Telescope Legacy Survey, a collaborative project of NRC and CNRS.
This project used public archival data obtained with the the Dark Energy Camera (DECam) by the Dark Energy Survey (DES). Funding for the DES Projects has been provided by the DOE and NSF (USA), MISE (Spain), STFC (UK), HEFCE (UK), NCSA (UIUC), KICP (U. Chicago), CCAPP (Ohio State), MIFPA (Texas A&M), CNPQ, FAPERJ, FINEP (Brazil), MINECO (Spain), DFG (Germany) and the collaborating institutions in the Dark Energy Survey, which are Argonne Lab, UC Santa Cruz, University of Cambridge, CIEMAT-Madrid, University of Chicago, University College London, DES-Brazil Consortium, University of Edinburgh, ETH Zürich, Fermilab, University of Illinois, ICE (IEEC-CSIC), IFAE Barcelona, Lawrence Berkeley Lab, LMU München and the associated Excellence Cluster Universe, University of Michigan, NOAO, University of Nottingham, Ohio State University, University of Pennsylvania, University of Portsmouth, SLAC National Lab, Stanford University, University of Sussex, and Texas A&M University.
This research has made use of the NASA/ IPAC Infrared Science Archive, which is operated by the Jet Propulsion Laboratory and the California Institute of Technology, under contract with the National Aeronautics and Space Administration.
This research made use of Astropy (Robitaille et al. 2013), matplotlib (Hunter 2007), NumPy (van der Walt et al. 2011) and SciPy (Jones et al. 2001). The results in this paper were obtained using R version 3.3.2 with the packages kSamples version 1.2.4. R itself and all packages used are available from the Comprehensive R Archive Network (CRAN) at http://CRAN.R-project.org/.
References
- Adami et al. (2006) Adami, C., Picat, J. P., Savine, C., et al. 2006, A&A, 451, 1159
- Agnoletto (2010) Agnoletto, I. 2010, PhD thesis, Universitá degli Studi di Padova
- Aihara et al. (2011) Aihara, H., Allende Prieto, C., An, D., et al. 2011, ApJS, 193, 29
- Amorín et al. (2015) Amorín, R., Pérez-Montero, E., Contini, T., et al. 2015, A&A, 578, A105
- Amorín et al. (2014) Amorín, R., Sommariva, V., Castellano, M., et al. 2014, A&A, 568, L8
- Andrews & Martini (2013) Andrews, B. H. & Martini, P. 2013, ApJ, 765, 140
- Angus et al. (2016) Angus, C. R., Levan, A. J., Perley, D. A., et al. 2016, MNRAS, 458, 84
- Appenzeller et al. (1998) Appenzeller, I., Fricke, K., Fürtig, W., et al. 1998, The Messenger, 94, 1
- Arnouts et al. (1999) Arnouts, S., Cristiani, S., Moscardini, L., et al. 1999, MNRAS, 310, 540
- Asplund et al. (2009) Asplund, M., Grevesse, N., Sauval, A. J., & Scott, P. 2009, ARA&A, 47, 481
- Atek et al. (2010) Atek, H., Malkan, M., McCarthy, P., et al. 2010, ApJ, 723, 104
- Atek et al. (2011) Atek, H., Siana, B., Scarlata, C., et al. 2011, ApJ, 743, 121
- Baldry et al. (2012) Baldry, I. K., Driver, S. P., Loveday, J., et al. 2012, MNRAS, 421, 621
- Baldwin et al. (1981) Baldwin, J. A., Phillips, M. M., & Terlevich, R. 1981, PASP, 93, 5
- Barbary et al. (2009) Barbary, K., Dawson, K. S., Tokita, K., et al. 2009, ApJ, 690, 1358
- Barbon et al. (2010) Barbon, R., Buondi, V., Cappellaro, E., & Turatto, M. 2010, VizieR Online Data Catalog, 1
- Barkat et al. (1967) Barkat, Z., Rakavy, G., & Sack, N. 1967, Physical Review Letters, 18, 379
- Becker et al. (1995) Becker, R. H., White, R. L., & Helfand, D. J. 1995, ApJ, 450, 559
- Bell (2003) Bell, E. F. 2003, ApJ, 586, 794
- Benetti et al. (2014) Benetti, S., Nicholl, M., Cappellaro, E., et al. 2014, MNRAS, 441, 289
- Berger et al. (2012) Berger, E., Chornock, R., Lunnan, R., et al. 2012, ApJ, 755, L29
- Bertin & Arnouts (1996) Bertin, E. & Arnouts, S. 1996, A&AS, 117, 393
- Bianchi et al. (2011) Bianchi, L., Herald, J., Efremova, B., et al. 2011, Ap&SS, 335, 161
- Bisnovatyi-Kogan & Kazhdan (1967) Bisnovatyi-Kogan, G. S. & Kazhdan, Y. M. 1967, Soviet Ast., 10, 604
- Blanchard et al. (2016) Blanchard, P. K., Berger, E., & Fong, W.-F. 2016, ApJ, 817, 144
- Blanton & Roweis (2007) Blanton, M. R. & Roweis, S. 2007, AJ, 133, 734
- Bleem et al. (2015) Bleem, L. E., Stalder, B., Brodwin, M., et al. 2015, ApJS, 216, 20
- Blinnikov & Sorokina (2010) Blinnikov, S. I. & Sorokina, E. I. 2010, arXiv:1009.4353
- Bock et al. (1999) Bock, D. C.-J., Large, M. I., & Sadler, E. M. 1999, AJ, 117, 1578
- Brammer et al. (2012) Brammer, G. B., van Dokkum, P. G., Franx, M., et al. 2012, ApJS, 200, 13
- Breeveld et al. (2011) Breeveld, A. A., Landsman, W., Holland, S. T., et al. 2011, in American Institute of Physics Conference Series, Vol. 1358, American Institute of Physics Conference Series, ed. J. E. McEnery, J. L. Racusin, & N. Gehrels, 373
- Bruzual & Charlot (2003) Bruzual, G. & Charlot, S. 2003, MNRAS, 344, 1000
- Buchner et al. (2014) Buchner, J., Georgakakis, A., Nandra, K., et al. 2014, A&A, 564, A125
- Calzetti (2013) Calzetti, D. 2013, Star Formation Rate Indicators, ed. J. Falcón-Barroso & J. H. Knapen (Cambridge University Press), 419
- Calzetti et al. (2000) Calzetti, D., Armus, L., Bohlin, R. C., et al. 2000, ApJ, 533, 682
- Campbell et al. (2014) Campbell, H., Walton, N., Blagorodnova, N., et al. 2014, The Astronomer’s Telegram, 6524
- Casali et al. (2006) Casali, M., Pirard, J.-F., Kissler-Patig, M., et al. 2006, in Proc. SPIE, Vol. 6269, Society of Photo-Optical Instrumentation Engineers (SPIE) Conference Series, 62690W
- Castander et al. (2015) Castander, F. J., Casas, R., Garcia-Alvarez, D., et al. 2015, The Astronomer’s Telegram, 7199
- Castellano et al. (2014) Castellano, M., Sommariva, V., Fontana, A., et al. 2014, A&A, 566, A19
- Cepa et al. (2000) Cepa, J., Aguiar, M., Escalera, V. G., et al. 2000, in Proc. SPIE, Vol. 4008, Optical and IR Telescope Instrumentation and Detectors, ed. M. Iye & A. F. Moorwood, 623
- Chabrier (2003) Chabrier, G. 2003, PASP, 115, 763
- Chatzopoulos et al. (2015) Chatzopoulos, E., van Rossum, D. R., Craig, W. J., et al. 2015, ApJ, 799, 18
- Chatzopoulos & Wheeler (2012) Chatzopoulos, E. & Wheeler, J. C. 2012, ApJ, 760, 154
- Chatzopoulos et al. (2011) Chatzopoulos, E., Wheeler, J. C., Vinko, J., et al. 2011, ApJ, 729, 143
- Chen et al. (2013) Chen, T.-W., Smartt, S. J., Bresolin, F., et al. 2013, ApJ, 763, L28
- Chen et al. (2015) Chen, T.-W., Smartt, S. J., Jerkstrand, A., et al. 2015, MNRAS, 452, 1567
- Chen et al. (2017) Chen, T.-W., Smartt, S. J., Yates, R. M., et al. 2017, MNRAS, 470, 3566
- Chevalier & Irwin (2011) Chevalier, R. A. & Irwin, C. M. 2011, ApJ, 729, L6
- Chomiuk et al. (2011) Chomiuk, L., Chornock, R., Soderberg, A. M., et al. 2011, ApJ, 743, 114
- Christensen et al. (2009) Christensen, E., Drake, A. J., Djorgovski, S. G., et al. 2009, Central Bureau Electronic Telegrams, 2106
- Condon (1992) Condon, J. J. 1992, ARA&A, 30, 575
- Condon et al. (1998) Condon, J. J., Cotton, W. D., Greisen, E. W., et al. 1998, AJ, 115, 1693
- Conroy (2013) Conroy, C. 2013, ARA&A, 51, 393
- Cooke et al. (2012) Cooke, J., Sullivan, M., Gal-Yam, A., et al. 2012, Nature, 491, 228
- Cucciati et al. (2012) Cucciati, O., Tresse, L., Ilbert, O., et al. 2012, A&A, 539, A31
- Dessart et al. (2013) Dessart, L., Waldman, R., Livne, E., Hillier, D. J., & Blondin, S. 2013, MNRAS, 428, 3227
- Drake et al. (2011a) Drake, A. J., Djorgovski, S. G., Mahabal, A., et al. 2011a, ApJ, 735, 106
- Drake et al. (2011b) Drake, A. J., Djorgovski, S. G., Mahabal, A., et al. 2011b, Central Bureau Electronic Telegrams, 2733
- Drake et al. (2009a) Drake, A. J., Djorgovski, S. G., Mahabal, A., et al. 2009a, Central Bureau Electronic Telegrams, 1766
- Drake et al. (2011c) Drake, A. J., Djorgovski, S. G., Mahabal, A. A., et al. 2011c, The Astronomer’s Telegram, 3324
- Drake et al. (2011d) Drake, A. J., Djorgovski, S. G., Mahabal, A. A., et al. 2011d, The Astronomer’s Telegram, 3340
- Drake et al. (2012) Drake, A. J., Djorgovski, S. G., Mahabal, A. A., et al. 2012, The Astronomer’s Telegram, 4595
- Drake et al. (2010) Drake, A. J., Djorgovski, S. G., Prieto, J. L., et al. 2010, ApJ, 718, L127
- Drake et al. (2009b) Drake, A. J., Mahabal, A. A., Djorgovski, S. G., et al. 2009b, The Astronomer’s Telegram, 1911
- Drake et al. (2009c) Drake, A. J., Mahabal, A. A., Djorgovski, S. G., et al. 2009c, The Astronomer’s Telegram, 2359
- Dressler et al. (2011) Dressler, A., Bigelow, B., Hare, T., et al. 2011, PASP, 123, 288
- Eldridge et al. (2008) Eldridge, J. J., Izzard, R. G., & Tout, C. A. 2008, MNRAS, 384, 1109
- Erben et al. (2005) Erben, T., Schirmer, M., Dietrich, J. P., et al. 2005, Astronomische Nachrichten, 326, 432
- Faber et al. (2007) Faber, S. M., Willmer, C. N. A., Wolf, C., et al. 2007, ApJ, 665, 265
- Fatkhullin & Gabdeev (2012) Fatkhullin, T. & Gabdeev, M. 2012, ATel, 4599
- Feroz et al. (2013) Feroz, F., Hobson, M. P., Cameron, E., & Pettitt, A. N. 2013, arXiv:1306.2144
- Filippenko (1997) Filippenko, A. V. 1997, ARA&A, 35, 309
- Foreman-Mackey (2016) Foreman-Mackey, D. 2016, The Journal of Open Source Software, 24
- Fowler & Hoyle (1964) Fowler, W. A. & Hoyle, F. 1964, ApJS, 9, 201
- Fox et al. (2015) Fox, O. D., Smith, N., Ammons, S. M., et al. 2015, MNRAS, 454, 4366
- Fraley (1968) Fraley, G. S. 1968, Ap&SS, 2, 96
- Gal-Yam (2012) Gal-Yam, A. 2012, Science, 337, 927
- Gal-Yam et al. (2009) Gal-Yam, A., Mazzali, P., Ofek, E. O., et al. 2009, Nature, 462, 624
- Gehrels et al. (2004) Gehrels, N., Chincarini, G., Giommi, P., et al. 2004, ApJ, 611, 1005
- Gezari et al. (2009) Gezari, S., Halpern, J. P., Grupe, D., et al. 2009, ApJ, 690, 1313
- Graham & Fruchter (2013) Graham, J. F. & Fruchter, A. S. 2013, ApJ, 774, 119
- Graham et al. (2011a) Graham, M. J., Drake, A. J., Djorgovski, S. G., et al. 2011a, Central Bureau Electronic Telegrams, 2787
- Graham et al. (2011b) Graham, M. J., Drake, A. J., Djorgovski, S. G., et al. 2011b, The Astronomer’s Telegram, 3477
- Graham et al. (2014) Graham, M. L., Zheng, W., Filippenko, A. V., et al. 2014, The Astronomer’s Telegram, 6635
- Grazian et al. (2015) Grazian, A., Fontana, A., Santini, P., et al. 2015, A&A, 575, A96
- Greiner et al. (2008) Greiner, J., Bornemann, W., Clemens, C., et al. 2008, PASP, 120, 405
- Greiner et al. (2011) Greiner, J., Krühler, T., Klose, S., et al. 2011, A&A, 526, A30
- Grogin et al. (2011) Grogin, N. A., Kocevski, D. D., Faber, S. M., et al. 2011, ApJS, 197, 35
- Guo et al. (2016) Guo, Y., Rafelski, M., Faber, S. M., et al. 2016, ApJ, 833, 37
- Heger et al. (2003) Heger, A., Fryer, C. L., Woosley, S. E., Langer, N., & Hartmann, D. H. 2003, ApJ, 591, 288
- Henden et al. (2016) Henden, A. A., Templeton, M., Terrell, D., et al. 2016, VizieR Online Data Catalog, 2336
- Hjorth et al. (2012) Hjorth, J., Malesani, D., Jakobsson, P., et al. 2012, ApJ, 756, 187
- Howell et al. (2013) Howell, D. A., Kasen, D., Lidman, C., et al. 2013, ApJ, 779, 98
- Hudelot et al. (2012) Hudelot, P., Cuillandre, J.-C., Withington, K., et al. 2012, VizieR Online Data Catalog, 2317
- Hunter (2007) Hunter, J. D. 2007, Computing In Science & Engineering, 9, 90
- Ibar et al. (2009) Ibar, E., Ivison, R. J., Biggs, A. D., et al. 2009, MNRAS, 397, 281
- Ilbert et al. (2006) Ilbert, O., Arnouts, S., McCracken, H. J., et al. 2006, A&A, 457, 841
- Ilbert et al. (2009) Ilbert, O., Capak, P., Salvato, M., et al. 2009, ApJ, 690, 1236
- Ilbert et al. (2013) Ilbert, O., McCracken, H. J., Le Fèvre, O., et al. 2013, A&A, 556, A55
- Ilbert et al. (2005) Ilbert, O., Tresse, L., Zucca, E., et al. 2005, A&A, 439, 863
- Inoue (2011) Inoue, A. K. 2011, MNRAS, 415, 2920
- Inserra & Smartt (2014) Inserra, C. & Smartt, S. J. 2014, ApJ, 796, 87
- Inserra et al. (2016) Inserra, C., Smartt, S. J., Gall, E. E. E., et al. 2016, MNRAS, submitted, arXiv:1604.01226
- Inserra et al. (2013) Inserra, C., Smartt, S. J., Jerkstrand, A., et al. 2013, ApJ, 770, 128
- Japelj et al. (2016) Japelj, J., Vergani, S. D., Salvaterra, R., Hunt, L. K., & Mannucci, F. 2016, A&A, 593, A115
- Jarvis et al. (2013) Jarvis, M. J., Bonfield, D. G., Bruce, V. A., et al. 2013, MNRAS, 428, 1281
- Jerkstrand et al. (2016) Jerkstrand, A., Smartt, S. J., & Heger, A. 2016, MNRAS, 455, 3207
- Jones et al. (2001) Jones, E., Oliphant, T., Peterson, P., & et al. 2001, SciPy: Open source scientific tools for Python
- Kasen & Bildsten (2010) Kasen, D. & Bildsten, L. 2010, ApJ, 717, 245
- Kato et al. (2007) Kato, D., Nagashima, C., Nagayama, T., et al. 2007, PASJ, 59, 615
- Kennicutt & Evans (2012) Kennicutt, R. C. & Evans, N. J. 2012, ARA&A, 50, 531
- Kennicutt (1998) Kennicutt, Jr., R. C. 1998, ARA&A, 36, 189
- Kennicutt et al. (2008) Kennicutt, Jr., R. C., Lee, J. C., Funes, J. G., et al. 2008, ApJS, 178, 247
- Kiewe et al. (2012) Kiewe, M., Gal-Yam, A., Arcavi, I., et al. 2012, ApJ, 744, 10
- Kissler-Patig et al. (2008) Kissler-Patig, M., Pirard, J.-F., Casali, M., et al. 2008, A&A, 491, 941
- Knop et al. (1999) Knop, R., Aldering, G., Deustua, S., et al. 1999, IAU Circ., 7128, 1
- Koekemoer et al. (2011) Koekemoer, A. M., Faber, S. M., Ferguson, H. C., et al. 2011, ApJS, 197, 36
- Kovács et al. (2004) Kovács, Z., Mall, U., Bizenberger, P., Baumeister, H., & Röser, H.-J. 2004, in Proc. SPIE, Vol. 5499, Optical and Infrared Detectors for Astronomy, ed. J. D. Garnett & J. W. Beletic, 432
- Kozyreva et al. (2017) Kozyreva, A., Gilmer, M., Hirschi, R., et al. 2017, MNRAS, 464, 2854
- Kriek et al. (2009) Kriek, M., van Dokkum, P. G., Labbé, I., et al. 2009, ApJ, 700, 221
- Krühler et al. (2011) Krühler, T., Greiner, J., Schady, P., et al. 2011, A&A, 534, A108
- Krühler et al. (2008) Krühler, T., Küpcü Yoldaş, A., Greiner, J., et al. 2008, ApJ, 685, 376
- Krühler et al. (2015) Krühler, T., Malesani, D., Fynbo, J. P. U., et al. 2015, A&A, 581, A125
- Krühler & Schady (2017) Krühler, T. & Schady, S. 2017, Photometry and Stellar Masses for GRB Host Galaxies with Emission-line Spectra, doi:10.6084/m9.figshare.4776886.v3
- Lang et al. (2010) Lang, D., Hogg, D. W., Mierle, K., Blanton, M., & Roweis, S. 2010, AJ, 139, 1782
- Law et al. (2009) Law, N. M., Kulkarni, S. R., Dekany, R. G., et al. 2009, PASP, 121, 1395
- Lawrence et al. (2007) Lawrence, A., Warren, S. J., Almaini, O., et al. 2007, MNRAS, 379, 1599
- Le Fèvre et al. (2004) Le Fèvre, O., Mellier, Y., McCracken, H. J., et al. 2004, A&A, 417, 839
- Le Fèvre et al. (2015) Le Fèvre, O., Tasca, L. A. M., Cassata, P., et al. 2015, A&A, 576, A79
- Lee et al. (2011) Lee, J. C., Gil de Paz, A., Kennicutt, Jr., R. C., et al. 2011, ApJS, 192, 6
- Lee et al. (2009) Lee, J. C., Kennicutt, Jr., R. C., Funes, S. J. J. G., Sakai, S., & Akiyama, S. 2009, ApJ, 692, 1305
- Lee et al. (2015) Lee, N., Sanders, D. B., Casey, C. M., et al. 2015, ApJ, 801, 80
- Leget et al. (2014) Leget, P.-F., Guillou, L. L., Fleury, M., et al. 2014, The Astronomer’s Telegram, 5718
- Leitherer et al. (1999) Leitherer, C., Schaerer, D., Goldader, J. D., et al. 1999, ApJS, 123, 3
- Leloudas et al. (2012) Leloudas, G., Chatzopoulos, E., Dilday, B., et al. 2012, A&A, 541, A129
- Leloudas et al. (2011) Leloudas, G., Gallazzi, A., Sollerman, J., et al. 2011, A&A, 530, A95
- Leloudas et al. (2015a) Leloudas, G., Hsiao, E. Y., Johansson, J., et al. 2015a, A&A, 574, A61
- Leloudas et al. (2015b) Leloudas, G., Patat, F., Maund, J. R., et al. 2015b, ApJ, 815, L10
- Leloudas et al. (2015c) Leloudas, G., Schulze, S., Krühler, T., et al. 2015c, MNRAS, 449, 917
- Lunnan et al. (2014) Lunnan, R., Chornock, R., Berger, E., et al. 2014, ApJ, 787, 138
- Lunnan et al. (2013) Lunnan, R., Chornock, R., Berger, E., et al. 2013, ApJ, 771, 97
- Lunnan et al. (2015) Lunnan, R., Chornock, R., Berger, E., et al. 2015, ApJ, 804, 90
- Madgwick et al. (2002) Madgwick, D. S., Lahav, O., Baldry, I. K., et al. 2002, MNRAS, 333, 133
- Maiolino et al. (2008) Maiolino, R., Nagao, T., Grazian, A., et al. 2008, A&A, 488, 463
- Mannucci et al. (2011) Mannucci, F., Salvaterra, R., & Campisi, M. A. 2011, MNRAS, 414, 1263
- Marchesini et al. (2007) Marchesini, D., van Dokkum, P., Quadri, R., et al. 2007, ApJ, 656, 42
- Martin et al. (2005) Martin, D. C., Fanson, J., Schiminovich, D., et al. 2005, ApJ, 619, L1
- Maseda et al. (2014) Maseda, M. V., van der Wel, A., Rix, H.-W., et al. 2014, ApJ, 791, 17
- Mauch et al. (2003) Mauch, T., Murphy, T., Buttery, H. J., et al. 2003, MNRAS, 342, 1117
- McCracken et al. (2012) McCracken, H. J., Milvang-Jensen, B., Dunlop, J., et al. 2012, A&A, 544, A156
- McCrum et al. (2014) McCrum, M., Smartt, S. J., Kotak, R., et al. 2014, MNRAS, 437, 656
- McCrum et al. (2015) McCrum, M., Smartt, S. J., Rest, A., et al. 2015, MNRAS, 448, 1206
- McMullin et al. (2007) McMullin, J. P., Waters, B., Schiebel, D., Young, W., & Golap, K. 2007, in Astronomical Society of the Pacific Conference Series, Vol. 376, Astronomical Data Analysis Software and Systems XVI, ed. R. A. Shaw, F. Hill, & D. J. Bell, 127
- Michałowski et al. (2009) Michałowski, M. J., Hjorth, J., Malesani, D., et al. 2009, ApJ, 693, 347
- Miller et al. (2009) Miller, A. A., Chornock, R., Perley, D. A., et al. 2009, ApJ, 690, 1303
- Modjaz et al. (2009) Modjaz, M., Li, W., Butler, N., et al. 2009, ApJ, 702, 226
- Moorwood et al. (1998) Moorwood, A., Cuby, J.-G., Biereichel, P., et al. 1998, The Messenger, 94, 7
- Moskvitin et al. (2010) Moskvitin, A. S., Fatkhullin, T. A., Sokolov, V. V., et al. 2010, Astrophysical Bulletin, 65, 230
- Murphy et al. (2011) Murphy, E. J., Condon, J. J., Schinnerer, E., et al. 2011, ApJ, 737, 67
- Muzzin et al. (2013) Muzzin, A., Marchesini, D., Stefanon, M., et al. 2013, ApJ, 777, 18
- Neill et al. (2011) Neill, J. D., Sullivan, M., Gal-Yam, A., et al. 2011, ApJ, 727, 15
- Nicholl et al. (2016) Nicholl, M., Berger, E., Smartt, S. J., et al. 2016, ApJ, 826, 39
- Nicholl et al. (2014) Nicholl, M., Smartt, S. J., Jerkstrand, A., et al. 2014, MNRAS, 444, 2096
- Nicholl et al. (2013) Nicholl, M., Smartt, S. J., Jerkstrand, A., et al. 2013, Nature, 502, 346
- Nicholl et al. (2015a) Nicholl, M., Smartt, S. J., Jerkstrand, A., et al. 2015a, MNRAS, 452, 3869
- Nicholl et al. (2015b) Nicholl, M., Smartt, S. J., Jerkstrand, A., et al. 2015b, ApJ, 807, L18
- Nugent et al. (1999) Nugent, P., Aldering, G., Phillips, M. M., et al. 1999, IAU Circ., 7133, 1
- Ochsenbein et al. (2000) Ochsenbein, F., Bauer, P., & Marcout, J. 2000, A&AS, 143, 23
- Ouchi et al. (2004) Ouchi, M., Shimasaku, K., Okamura, S., et al. 2004, ApJ, 611, 660
- Papadopoulos et al. (2015) Papadopoulos, A., D’Andrea, C. B., Sullivan, M., et al. 2015, MNRAS, 449, 1215
- Pastorello et al. (2010) Pastorello, A., Smartt, S. J., Botticella, M. T., et al. 2010, ApJ, 724, L16
- Perley et al. (2016a) Perley, D. A., Krühler, T., Schulze, S., et al. 2016a, ApJ, 817, 7
- Perley et al. (2016b) Perley, D. A., Quimby, R. M., Yan, L., et al. 2016b, ApJ, 830, 13
- Perley et al. (2016c) Perley, D. A., Tanvir, N. R., Hjorth, J., et al. 2016c, ApJ, 817, 8
- Persson et al. (2013) Persson, S. E., Murphy, D. C., Smee, S., et al. 2013, PASP, 125, 654
- Pirard et al. (2004) Pirard, J.-F., Kissler-Patig, M., Moorwood, A., et al. 2004, in Society of Photo-Optical Instrumentation Engineers (SPIE) Conference Series, Vol. 5492, Ground-based Instrumentation for Astronomy, ed. A. F. M. Moorwood & M. Iye, 1763
- Planck Collaboration (2014) Planck Collaboration. 2014, A&A, 571, A16
- Quataert & Shiode (2012) Quataert, E. & Shiode, J. 2012, MNRAS, 423, L92
- Quimby et al. (2010a) Quimby, R., Gal-Yam, A., Arcavi, I., et al. 2010a, ATel, 2634
- Quimby et al. (2007) Quimby, R. M., Aldering, G., Wheeler, J. C., et al. 2007, ApJ, 668, L99
- Quimby et al. (2005) Quimby, R. M., Castro, F., Gerardy, C. L., et al. 2005, in Bulletin of the American Astronomical Society, Vol. 37, American Astronomical Society Meeting Abstracts, 171.02
- Quimby et al. (2011a) Quimby, R. M., Cenko, S. B., Yaron, O., et al. 2011a, ATel, 3465
- Quimby et al. (2011b) Quimby, R. M., Gal-Yam, A., Arcavi, I., et al. 2011b, ATel, 3841
- Quimby et al. (2013a) Quimby, R. M., Kulkarni, S., Ofek, E., et al. 2013a, CBET, 3461
- Quimby et al. (2010b) Quimby, R. M., Kulkarni, S., Ofek, E., et al. 2010b, ATel, 2979
- Quimby et al. (2011c) Quimby, R. M., Kulkarni, S. R., Kasliwal, M. M., et al. 2011c, Nature, 474, 487
- Quimby et al. (2013b) Quimby, R. M., Yuan, F., Akerlof, C., & Wheeler, J. C. 2013b, MNRAS, 431, 912
- Rakavy & Shaviv (1967) Rakavy, G. & Shaviv, G. 1967, ApJ, 148, 803
- Reif et al. (1999) Reif, K., Bagschik, K., de Boer, K. S., et al. 1999, in Proc. SPIE, Vol. 3649, Sensors, Cameras, and Systems for Scientific/Industrial Applications, ed. M. M. Blouke & G. M. Williams, 109
- Rest et al. (2011) Rest, A., Foley, R. J., Gezari, S., et al. 2011, ApJ, 729, 88
- Rice (1944) Rice, S. O. 1944, Bell System Technical Journal, 23, 282
- Riess et al. (2004) Riess, A. G., Strolger, L.-G., Tonry, J., et al. 2004, ApJ, 607, 665
- Robitaille et al. (2013) Robitaille, T. P., Tollerud, E. J., Greenfield, P., et al. 2013, A&A, 558, A33
- Roming et al. (2005) Roming, P. W. A., Kennedy, T. E., Mason, K. O., et al. 2005, SSR, 120, 95
- Salvaterra et al. (2012) Salvaterra, R., Campana, S., Vergani, S. D., et al. 2012, ApJ, 749, 68
- Sanders et al. (2012) Sanders, N. E., Soderberg, A. M., Levesque, E. M., et al. 2012, ApJ, 758, 132
- Santini et al. (2015) Santini, P., Ferguson, H. C., Fontana, A., et al. 2015, ApJ, 801, 97
- Schirmer (2013) Schirmer, M. 2013, ApJS, 209, 21
- Schlafly & Finkbeiner (2011) Schlafly, E. F. & Finkbeiner, D. P. 2011, ApJ, 737, 103
- Schlegel (1990) Schlegel, E. M. 1990, MNRAS, 244, 269
- Schmitt et al. (2006) Schmitt, H. R., Calzetti, D., Armus, L., et al. 2006, ApJS, 164, 52
- Schulze et al. (2015) Schulze, S., Chapman, R., Hjorth, J., et al. 2015, ApJ, 808, 73
- Scovacricchi et al. (2016) Scovacricchi, D., Nichol, R. C., Bacon, D., Sullivan, M., & Prajs, S. 2016, MNRAS, 456, 1700
- Scoville et al. (2007) Scoville, N., Aussel, H., Brusa, M., et al. 2007, ApJS, 172, 1
- Smith et al. (2014) Smith, M., Firth, R., Dimitriadis, G., et al. 2014, The Astronomer’s Telegram, 6739
- Smith et al. (2016) Smith, M., Sullivan, M., D’Andrea, C. B., et al. 2016, ApJ, 818, L8
- Smith et al. (2008) Smith, N., Chornock, R., Li, W., et al. 2008, ApJ, 686, 467
- Smith et al. (2007) Smith, N., Li, W., Foley, R. J., et al. 2007, ApJ, 666, 1116
- Sobral et al. (2014) Sobral, D., Best, P. N., Smail, I., et al. 2014, MNRAS, 437, 3516
- Sorokina et al. (2016) Sorokina, E., Blinnikov, S., Nomoto, K., Quimby, R., & Tolstov, A. 2016, ApJ, 829, 17
- Speagle et al. (2014) Speagle, J. S., Steinhardt, C. L., Capak, P. L., & Silverman, J. D. 2014, ApJS, 214, 15
- Stalder et al. (2014) Stalder, B., Stark, A. A., Amato, S. M., et al. 2014, in Proc. SPIE, Vol. 9147, Ground-based and Airborne Instrumentation for Astronomy V, 91473Y
- Stanway et al. (2016) Stanway, E. R., Eldridge, J. J., & Becker, G. D. 2016, MNRAS, 456, 485
- Stoll et al. (2013) Stoll, R., Prieto, J. L., Stanek, K. Z., & Pogge, R. W. 2013, ApJ, 773, 12
- Svensson et al. (2010) Svensson, K. M., Levan, A. J., Tanvir, N. R., Fruchter, A. S., & Strolger, L.-G. 2010, MNRAS, 405, 57
- Tasca et al. (2015) Tasca, L. A. M., Le Fèvre, O., Hathi, N. P., et al. 2015, A&A, 581, A54
- Terlevich et al. (2004) Terlevich, R., Silich, S., Rosa-González, D., & Terlevich, E. 2004, MNRAS, 348, 1191
- Thöne et al. (2015) Thöne, C. C., de Ugarte Postigo, A., García-Benito, R., et al. 2015, MNRAS, 451, L65
- Tody (1986) Tody, D. 1986, in Society of Photo-Optical Instrumentation Engineers (SPIE) Conference Series, Vol. 627, Instrumentation in astronomy VI, ed. D. L. Crawford, 733
- Tomczak et al. (2014) Tomczak, A. R., Quadri, R. F., Tran, K.-V. H., et al. 2014, ApJ, 783, 85
- Tonry et al. (2012) Tonry, J. L., Stubbs, C. W., Lykke, K. R., et al. 2012, ApJ, 750, 99
- van der Walt et al. (2011) van der Walt, S., Colbert, S. C., & Varoquaux, G. 2011, Computing in Science Engineering, 13, 22
- Vergani et al. (2015) Vergani, S. D., Salvaterra, R., Japelj, J., et al. 2015, A&A, 581, A102
- Vinko et al. (2012) Vinko, J., Zheng, W., Pandey, S. B., et al. 2012, in American Astronomical Society Meeting Abstracts, Vol. 219, American Astronomical Society Meeting Abstracts #219, 436.04
- Vreeswijk et al. (2014) Vreeswijk, P. M., Savaglio, S., Gal-Yam, A., et al. 2014, ApJ, 797, 24
- Wardle & Kronberg (1974) Wardle, J. F. C. & Kronberg, P. P. 1974, ApJ, 194, 249
- Whitaker et al. (2014) Whitaker, K. E., Franx, M., Leja, J., et al. 2014, ApJ, 795, 104
- Whitaker et al. (2012) Whitaker, K. E., van Dokkum, P. G., Brammer, G., & Franx, M. 2012, ApJ, 754, L29
- Woosley (2012) Woosley, S. E. 2012, in Gamma-Ray Bursts, ed. C. Kouveliotou, R. A. M. J. Wijers, & S. Woosley (Cambridge University Press), 191–214
- Woosley et al. (2007) Woosley, S. E., Blinnikov, S., & Heger, A. 2007, Nature, 450, 390
- Wright et al. (2010) Wright, E. L., Eisenhardt, P. R. M., Mainzer, A. K., et al. 2010, AJ, 140, 1868
- Wyder et al. (2005) Wyder, T. K., Treyer, M. A., Milliard, B., et al. 2005, ApJ, 619, L15
- Yagi et al. (2002) Yagi, M., Kashikawa, N., Sekiguchi, M., et al. 2002, AJ, 123, 66
- Yan et al. (2017) Yan, L., Lunnan, R., Perley, D. A., et al. 2017, ApJ, 848, 6
- Yan et al. (2015) Yan, L., Quimby, R., Ofek, E., et al. 2015, ApJ, 814, 108
- Yates et al. (2012) Yates, R. M., Kauffmann, G., & Guo, Q. 2012, MNRAS, 422, 215
- Yoldaş et al. (2008) Yoldaş, A. K., Krühler, T., Greiner, J., et al. 2008, in American Institute of Physics Conference Series, Vol. 1000, American Institute of Physics Conference Series, ed. M. Galassi, D. Palmer, & E. Fenimore, 227
- Yoon & Langer (2005) Yoon, S.-C. & Langer, N. 2005, A&A, 443, 643
- York et al. (2000) York, D. G., Adelman, J., Anderson, Jr., J. E., et al. 2000, AJ, 120, 1579
- Young et al. (2010) Young, D. R., Smartt, S. J., Valenti, S., et al. 2010, A&A, 512, A70
- Yuan et al. (2007) Yuan, F., Akerlof, C., Quimby, R., et al. 2007, in Bulletin of the American Astronomical Society, Vol. 39, American Astronomical Society Meeting Abstracts, 105.05
- Zahid et al. (2014) Zahid, H. J., Dima, G. I., Kudritzki, R.-P., et al. 2014, ApJ, 791, 130
1 Department of Particle Physics and Astrophysics, Weizmann Institute of Science, Rehovot 7610001, Israel.
2 Instituto de Astrofísica, Facultad de Física, Pontificia Universidad Católica de Chile, Vicuña Mackenna 4860, 7820436 Macul, Santiago, Chile.
3 Millennium Institute of Astrophysics, Vicuña Mackenna 4860, 7820436 Macul, Santiago, Chile.
4 Max-Planck-Institut für extraterrestrische Physik, Gießenbachstraße, 85748 Garching, Germany.
5 Dark Cosmology Centre, Niels Bohr Institute, University of Copenhagen, Juliane Maries Vej 30, 2100 Copenhagen, Denmark.
6Unidad Asociada Grupo Ciencia Planetarias UPV/EHU-IAA/CSIC, Departamento de Física Aplicada I, E.T.S. Ingeniería,
Universidad del País-Vasco UPV/EHU, Alameda de Urquijo s/n, E-48013 Bilbao, Spain.
7Ikerbasque, Basque Foundation for Science, Alameda de Urquijo 36-5, E-48008 Bilbao, Spain.
8Instituto de Astrofísica de Andalucía (IAA-CSIC), Glorieta de la Astronomía s/n, E-18008, Granada, Spain.
9ESO, Alonso de Cordova 3107, Vitacura, Santiago de Chile, Chile.
10Instituto de Física y Astronomía, Universidad de Valparaíso, Avda. Gran Bretaña 1111, Valparaíso, Chile.
11Cavendish Laboratory, University of Cambridge, 19 JJ Thomson Avenue, Cambridge, CB3 0HE, UK.
12Kavli Institute for Cosmology, University of Cambridge, Madingley Road, Cambridge CB3 0HA, UK.
13Space Science Institute, 4750 Walnut Street, Suite 205, Boulder, Colorado 80301, USA.
14Mullard Space Science Laboratory - University College London, Holmbury Rd, Dorking RH5 6NT, United Kingdom.
15INAF INAF Osservatorio Astrofisico di Arcetri, Largo Enrico Fermi 5, 50125 Firenze, Italy.
16Las Campanas Observatory, Carnegie Observatories, Casilla 601, La Serena, Chile.
17Heidelberger Institut fur Theoretische Studien, Schloss-Wolfsbrunnenweg 35, 69118 Heidelberg, Germany.
18Institute for Astronomy, University of Hawaii, 2680 Woodlawn Drive, Honolulu, HI 96822, USA.
19Smithsonian Astrophysical Observatory, 60 Garden Street, Cambridge, MA 02138, USA.
20Department of Astronomy, University of Texas at Austin, Austin, TX 78712, USA.
Appendix A Data table
| Survey/ | Instrument | Filter | Brightness | Date | Exposure | Reference |
| Telescope | (magAB) | time (s) | ||||
| CSS100217 [SLSN-IIn, , ] | ||||||
| 2MASS | This work | |||||
| CAHA | Omega2000 | 2014-01-10 | This work | |||
| CAHA | Omega2000 | 2014-01-11 | This work | |||
| SDSS | 2003-03-26 | This work | ||||
| SDSS | 2003-03-26 | This work | ||||
| SDSS | 2003-03-26 | This work | ||||
| SDSS | 2003-03-26 | This work | ||||
| SDSS | 2003-03-26 | This work | ||||
| Swift | UVOT | 2015-03-26/04-11 | 1506 | This work | ||
| Swift | UVOT | 2015-03-26/04-11 | 1507 | This work | ||
| Swift | UVOT | 2015-03-26/04-11 | 1448 | This work | ||
| CSS121015 [SLSN-II, fast declining, , ] | ||||||
| Magellan | IMACS | 2013-08-14 | This work | |||
| Magellan | IMACS | 2013-08-14 | This work | |||
| Magellan | IMACS | 2013-08-14 | This work | |||
| Magellan | FourStar | 2014-11-05 | This work | |||
| VLT | FORS2 | 2013-05-30 | This work | |||
| VLT | FORS2 | 2013-05-30 | This work | |||
| VLT | HAWK-I | 2013-06-02 | This work | |||
| CSS140925 [SLSN-I, , ] | ||||||
| SDSS | 2008-12-04 | This work | ||||
| This work | ||||||
| SDSS | 2008-12-04 | This work | ||||
| SDSS | 2008-12-04 | This work | ||||
| SDSS | 2008-12-04 | This work | ||||
| SDSS | 2008-12-04 | This work | ||||
| DES14S2qri [SLSN-I, , ] | ||||||
| DES/Blanco | DECam | 2002-11-10 | This work | |||
| SDSS | 2002-11-10 | This work | ||||
| This work | ||||||
| SDSS | 2002-11-10 | This work | ||||
| This work | ||||||
| SDSS | 2002-11-10 | This work | ||||
| SDSS | 2002-11-10 | This work | ||||
| This work | ||||||
| SDSS | 2002-11-10 | This work | ||||
| This work | ||||||
| UKIDSS/UKIRT | WFCAM | [1] | ||||
| UKIDSS/UKIRT | WFCAM | [1] | ||||
| UKIDSS/UKIRT | WFCAM | [1] | ||||
| UKIDSS/UKIRT | WFCAM | [1] | ||||
| DES14X2byo [SLSN-I, , ] | ||||||
| CFHTLS/CFHT | MegaPrime | This work | ||||
| This work | ||||||
| CFHTLS/CFHT | MegaPrime | This work | ||||
| This work | ||||||
| CFHTLS/CFHT | MegaPrime | This work | ||||
| This work | ||||||
| CFHTLS/CFHT | MegaPrime | This work | ||||
| CFHTLS/CFHT | MegaPrime | This work | ||||
List of host observations and their photometries. Survey/ Instrument Filter Brightness Date Exposure Reference Telescope (magAB) time (s) DES14X3taz [SLSN-I, , ] DES/Blanco DeCam [2] DES/Blanco DeCam [2] DES/Blanco DeCam [2] DES/Blanco DeCam [2] VIRMOS/VLT VIMOS [3] VIRMOS/VLT VIMOS [3] VIRMOS/VLT VIMOS [3] VIRMOS/VLT VIMOS [3] iPTF13ajg [SLSN-I, slow declining, , ] Keck LRIS 2014-07/09 [11] Keck LRIS 2014-07/09 [11] Keck MOSFIRE 2014-06-07 [11] Keck MOSFIRE 2014-06-08 [11] LSQ12dlf [SLSN-I, fast declining, , ] Magellan IMACS 2013-08-14 This work Magellan IMACS 2013-08-14 This work Magellan FourStar 2014-11-05 This work NTT EFOSC2 2014 [4] VLT FORS2 2013-08-02 This work LSQ14ana [SLSN-I, , ] CTIO-4m MOSAIC-2 2009-04-01 This work CTIO-4m MOSAIC-2 2009-04-02 This work CTIO-4m MOSAIC-2 2009-04-02 This work GALEX [5] GALEX [5] Magellan FourStar 2016-03-27 This work Magellan FourStar 2016-03-27 This work Swift UVOT 2014-07-03 5286 This work Swift UVOT 2014-12-07 5262 This work Swift UVOT 2016-08-16 8137 This work Subaru Suprime-Cam 2005-05-07 This work LSQ14mob [SLSN-I, fast declining, , ] Magellan IMACS 2015-05-13 This work Magellan IMACS 2015-11-08 This work Magellan IMACS 2015-05-14 This work Magellan FourStar 2016-03-27 This work Magellan FourStar 2016-03-27 This work LSQ14bdq [SLSN-I, slow declining, , ] Magellan PISCO 2016-11-02 2700 This work Magellan PISCO 2016-11-02 2700 This work Magellan PISCO 2016-11-02 2700 This work Magellan PISCO 2016-11-02 2700 This work Magellan FourStar 2016-03-27 This work Magellan FourStar 2016-03-27 This work LSQ14fxj [SLSN-I, , ] SDSS This work SDSS This work SDSS This work SDSS This work SDSS This work UKIDSS/UKIRT WFCAM [1] UKIDSS/UKIRT WFCAM [1]
List of host observations and their photometries. Survey/ Instrument Filter Brightness Date Exposure Reference Telescope (magAB) time (s) MLS121104 [SLSN-I, , ] CAHA Omega2000 2014-08-10 This work Magellan† FourStar 2013-12-18 [6] Magellan† FourStar 2013-12-18 [6] SDSS 2005-06-12 This work SDSS 2005-06-12 This work SDSS 2005-06-12 This work SDSS 2005-06-12 This work SDSS 2005-06-12 This work PS1-10ky [SLSN-I, fast declining, , ] CFHTLS/CFHT MegaPrime This work CFHTLS/CFHT MegaPrime This work CFHTLS/CFHT MegaPrime This work CFHTLS/CFHT MegaPrime This work CFHTLS/CFHT MegaPrime This work PS1-10pm [SLSN-I, , ] Pan-STARRS† [6] Pan-STARRS† [6] Pan-STARRS† [6] Pan-STARRS† [6] Pan-STARRS† [6] Gemini-N GMOS 2011-01-30 [6] Gemini-N GMOS 2011-01-30 [6] HST† WFC3 2012-12-10 [6] HST† WFC3 2013-01-15 [6] PS1-10ahf [SLSN-I, , ] Magellan PISCO 2016-11-02 2700 This work Magellan PISCO 2016-11-02 2700 This work Magellan PISCO 2016-11-02 2700 This work Magellan PISCO 2016-11-02 2700 This work CAHA Omega2000 2014-08-10 This work CAHA Omega2000 2014-08-09 This work PS1-10awh [SLSN-I, , ] CFHTLS/CFHT MegaPrime This work CFHTLS/CFHT MegaPrime This work CFHTLS/CFHT MegaPrime This work CFHTLS/CFHT MegaPrime This work CFHTLS/CFHT MegaPrime This work HST WFC3 2013-09-04 [6] PS1-10bzj [SLSN-I, fast declining, , ] Pan-STARRS† [7] Pan-STARRS† [7] Pan-STARRS† [7] Pan-STARRS† [7] Pan-STARRS† [7] Magellan† FourStar [7] Magellan† FourStar [7] MUSYC/Spitzer† IRAC [7] MUSYC/Spitzer† IRAC [7]
List of host observations and their photometries. Survey/ Instrument Filter Brightness Date Exposure Reference Telescope (magAB) time (s) PS1-11ap [SLSN-I, slow declining, , ] HST† 2013-10-09 [6] Pan-STARRS† [6] Pan-STARRS† [6] Pan-STARRS† [6] Pan-STARRS† [6] Pan-STARRS† [6] Spitzer† IRAC [6] Spitzer† IRAC [6] PS1-11tt [SLSN-I, , ] HST† WFC3 2012-10-02 [6] HST† WFC3 2013-04-21 [6] Pan-STARRS† [6] Pan-STARRS† [6] Pan-STARRS† [6] Pan-STARRS† [6] Pan-STARRS† [6] PS1-11afv [SLSN-I, , ] HST† WFC3 2013-04-09 [6] HST† WFC3 2012-11-24 [6] Pan-STARRS† [6] Pan-STARRS† [6] Pan-STARRS† [6] Pan-STARRS† [6] Pan-STARRS† [6] PS1-11aib [SLSN-I, , ] CFHTLS/CFHT MegaPrime This work CFHTLS/CFHT MegaPrime This work CFHTLS/CFHT MegaPrime This work CFHTLS/CFHT MegaPrime This work CFHTLS/CFHT MegaPrime Pan-STARRS† [6] Pan-STARRS† [6] Pan-STARRS† [6] Pan-STARRS† [6] Pan-STARRS† [6] PS1-11bam [SLSN-I, , ] HST WFC3 2013-10-11 [6] Pan-STARRS† [6] Pan-STARRS† [6] Pan-STARRS† [6] Pan-STARRS† [6] Pan-STARRS† [6]
List of host observations and their photometries. Survey/ Instrument Filter Brightness Date Exposure Reference Telescope (magAB) time (s) PS1-11bdn [SLSN-I, , ] CFHTLS/CFHT MegaPrime This work This work CFHTLS/CFHT MegaPrime This work CFHTLS/CFHT MegaPrime This work CFHTLS/CFHT MegaPrime This work This work CFHTLS/CFHT MegaPrime This work This work HST† WFC3 2013-11-13 [6] Magellan† 2012-07-19 [6] Magellan† 2013-10-05 [6] Magellan† 2013-01-12 [6] Magellan† FourStar 2012-12-04 [6] PS1-12zn [SLSN-I, , ] COSMOS/GALEX [8] COSMOS/GALEX [8] COSMOS/CFHT MegaPrime [8] COSMOS/Subaru Suprime-Cam [8] COSMOS/Subaru Suprime-Cam [8] COSMOS/Subaru Suprime-Cam [8] COSMOS/Subaru Suprime-Cam [8] COSMOS/Subaru Suprime-Cam [8] COSMOS/Subaru Suprime-Cam [8] COSMOS/UKIRT PS1-12zn [8] COSMOS/CFHT WIRCAM [8] COSMOS/Spitzer IRAC [8] COSMOS/Spitzer IRAC [8] COSMOS/Spitzer IRAC [8] PS1-12bmy [SLSN-I, , ] HST† WFC3 2013-09-17 [6] Magellan† LDSS3 2013-10-05 [6] Magellan† LDSS3 2013-10-04 [6] Magellan† LDSS3 2013-10-05 [6] Magellan† LDSS3 2013-10-05 [6] Magellan† FourStar 2013-12-18 [6] Magellan† FourStar 2013-12-18 [6] PS1-12bqf [SLSN-I, , ] CFHTLS/CFHT MegaPrime [9] CFHTLS/CFHT MegaPrime [9] CFHTLS/CFHT MegaPrime [9] CFHTLS/CFHT MegaPrime [9] CFHTLS/CFHT MegaPrime [9] GALEX [5] GALEX [5] Spitzer IRAC [6] Spitzer IRAC [6] VIDEO/VLT VISTA [10] VIDEO/VLT VISTA [10] VIDEO/VLT VISTA [10] VIDEO/VLT VISTA [10] VIDEO/VLT VISTA [10] VIRMOS/CFHT CFH-12K [3] VIRMOS/CFHT CFH-12K [3] VIRMOS/CFHT CFH-12K [3] VIRMOS/CFHT CFH-12K [3]
List of host observations and their photometries. Survey/ Instrument Filter Brightness Date Exposure Reference Telescope (magAB) time (s) PS1-13gt [SLSN-I, , ] NOT ALFOSC 2015-03-13 This work Pan-STARRS† [6] Pan-STARRS† [6] Pan-STARRS† [6] Pan-STARRS† [6] Pan-STARRS† [6] PTF09atu [SLSN-I, , ] HST WFC3 [12] VLT FORS2 2012-06-25 This work VLT FORS2 2012-06-25 This work VLT FORS2 2012-06-25 This work VLT FORS2 2012-06-25 This work VLT HAWK-I 2012-07-16 This work This work VLT HAWK-I 2012-06-05 This work PTF09cnd [SLSN-I, slow declining, , ] GALEX [5] CAHA BUSCA 2012-10-07 This work CAHA BUSCA 2012-10-07 This work CAHA BUSCA 2012-10-07 This work CAHA BUSCA 2012-10-07 This work CAHA Omega2000 2014-08-09 This work GTC OSIRIS 2013-05-05 This work PTF10heh [SLSN-IIn, , ] VLT FORS2 2013-05-30 This work VLT FORS2 2013-05-30 This work VLT FORS2 2013-05-30 This work VLT FORS2 2013-05-30 This work VLT FORS2 2013-05-30 This work VLT HAWK-I 2013-06-02 This work Magellan FourStar 2014-03-24 This work Magellan FourStar 2014-03-24 This work PTF10hgi [SLSN-I, fast declining, , ] CAHA Omega2000 2015-05-09 This work TNG 2012-05-28 [13] TNG 2012-05-28 [13] VLT ISAAC 2013-03-28 This work VLT ISAAC 2013-03-28 This work WHT ACAM 2012-05-26 [13] WHT ACAM 2012-05-26 [13] PTF10qaf [SLSN-IIn, , ] Magellan FourStar 2014-11-05 This work Magellan FourStar 2014-11-05 This work SDSS 2006-09-16 This work SDSS 2006-09-16 This work SDSS 2006-09-16 This work SDSS 2006-09-16 This work SDSS 2006-09-16 This work
List of host observations and their photometries. Survey/ Instrument Filter Brightness Date Exposure Reference Telescope (magAB) time (s) PTF10vqv [SLSN-I, , ] CAHA BUSCA 2012-10-06 This work CAHA BUSCA 2012-10-06 This work CAHA BUSCA 2012-10-06 This work CAHA BUSCA 2012-10-06 This work This work Magellan IMACS 2013-08-14 This work Magellan IMACS 2013-02-08 This work Magellan IMACS 2013-08-14 This work Magellan FourStar 2013-09-25 This work VLT ISAAC 2013-09-25 This work This work PTF11dsf [SLSN-IIn, , ] GALEX [5] CAHA BUSCA 2012-10-06 This work CAHA BUSCA 2012-10-06 This work CAHA BUSCA 2012-10-06 This work CAHA BUSCA 2012-10-06 This work CAHA Omega2000 2013-07-23 This work CAHA Omega2000 2015-05-07 This work CAHA Omega2000 2013-07-23 This work PTF11rks [SLSN-I, fast declining, , ] GALEX [5] CAHA BUSCA 2012-10-06 This work CAHA BUSCA 2012-10-06 This work CAHA BUSCA 2012-10-06 This work CAHA BUSCA 2012-10-06 This work GTC OSIRIS 2014-08-30 This work SDSS 2009-10-17 This work This work Magellan FourStar 2013-08-14 This work CAHA Omega2000 2013-07-25 This work CAHA Omega2000 2013-07-25 This work CAHA Omega2000 2013-07-24 This work PTF12dam [SLSN-I, slow declining, , ] CAHA Omega2000 2014-08-10 This work CAHA Omega2000 2014-05-14 This work CAHA Omega2000 2014-05-15 This work CAHA Omega2000 2014-05-14 This work GALEX [5] GALEX [5] SDSS 2003-02-11 This work SDSS 2003-02-11 This work SDSS 2003-02-11 This work SDSS 2003-02-11 This work SDSS 2003-02-11 This work Swift UVOT 2014-12-15/17 1166 This work Swift UVOT 2014-12-15/17 1177 This work SCP06F6 [SLSN-I, fast declining, , ] HST [14] HST [14] HST WFC3 [12]
List of host observations and their photometries. Survey/ Instrument Filter Brightness Date Exposure Reference Telescope (magAB) time (s) SN1999as [SLSN-I, , ] CAHA Omega2000 2014-01-10 This work CAHA Omega2000 2015-05-08 This work CAHA Omega2000 2014-01-10 This work GALEX [5] GALEX [5] Magellan Fourstar 2014-06-26 This work SDSS 2005-05-10 This work SDSS 2005-05-10 This work SDSS 2005-05-10 This work SDSS 2005-05-10 This work SDSS 2005-05-10 This work WISE WISE [15] WISE [15] WISE [15] SN1999bd [SLSN-IIn, , ] CAHA Omega2000 2014-05-14 This work GALEX [5] Magellan IMACS 2013-02-08 This work Magellan FourStar 2014-11-05 This work Swift UVOT 2014-12-16–2016-01-03 7287 This work SDSS 2005-03-10 This work SDSS 2005-03-10 This work SDSS 2005-03-10 This work SDSS 2005-03-10 This work SDSS 2005-03-10 This work Subaru Suprime-Cam 2007-02-18–21 This work WISE [15] WISE [15] SN2003ma [SLSN-IIn, , ] IRSF SIRIUS [16] IRSF SIRIUS [16] SuperMACHO/Blanco MOSAIC Imager [17] SuperMACHO/Blanco MOSAIC Imager [17] SN2005ap [SLSN-I, fast declining, , ] Coma Cluster/CFHT CFH12K [18] Coma Cluster/CFHT CFH12K [18] Coma Cluster/CFHT CFH12K [18] Coma Cluster/CFHT CFH12K [18] HST WFC3 [12] HST WFC3 [12] Magellan† FourStar [6] NOT ALFOSC 2013-05-05 This work NOT ALFOSC 2013-04-14 This work Subaru Suprime-Cam 2011-04-01 This work VLT ISAAC 2013-03-27 This work VLT ISAAC 2013-03-27 This work
List of host observations and their photometries. Survey/ Instrument Filter Brightness Date Exposure Reference Telescope (magAB) time (s) SN2006gy [SLSN-IIn, , ] 2MASS This work 2MASS This work 2MASS This work CAHA BUSCA 2012-10-08 This work CAHA BUSCA 2012-10-08 This work CAHA BUSCA 2012-10-08 This work CAHA BUSCA 2012-10-08 This work GALEX [5] GALEX [5] SDSS 2003-01-29 This work SDSS 2003-01-29 This work SDSS 2003-01-29 This work SDSS 2003-01-29 This work SDSS 2003-01-29 This work SN2006oz [SLSN-I, , ] CFHTLS/CFHT MegaPrime This work CFHTLS/CFHT MegaPrime This work CFHTLS/CFHT MegaPrime This work CFHTLS/CFHT MegaPrime This work CFHTLS/CFHT MegaPrime This work GTC OSIRIS 2011-08-26 This work GTC OSIRIS 2011-08-26 This work GTC OSIRIS 2011-08-26 This work VLT HAWK-I 2012-06-05 This work VLT HAWK-I 2012-07-03 This work SN2006tf [SLSN-IIn, , ] GALEX [5] GALEX [5] Magellan IMACS 2013-02-08 This work Magellan IMACS 2013-02-08 This work Magellan IMACS 2013-02-08 This work VLT FORS2 2013-05-29 This work VLT FORS2 2013-05-29 This work VLT FORS2 2013-05-29 This work VLT FORS2 2013-05-29 This work VLT FORS2 2013-05-29 This work VLT HAWK-I 2013-06-02 This work VLT HAWK-I 2013-06-02 This work SN2007bi [SLSN-I, slow declining, , ] 2.2-m MPG GROND 2015-02-13 This work 2.2-m MPG GROND 2015-02-13 This work 2.2-m MPG GROND 2015-02-13 This work 2.2-m MPG GROND 2015-02-13 This work CAHA Omega2000 2015-05-08 This work GALEX [5] HST WFC3 [12] Magellan IMACS 2013-08-13 This work Magellan FourStar 2014-03-24 This work Magellan FourStar 2014-03-24 This work NOT ALFOSC 2013-04-14 This work NOT ALFOSC 2013-04-14 This work
List of host observations and their photometries. Survey/ Instrument Filter Brightness Date Exposure Reference Telescope (magAB) time (s) SN2007bw [SLSN-IIn, , ] CAHA Omega2000 2013-07-24 This work CAHA Omega2000 2013-07-24 This work CAHA Omega2000 2013-07-24 This work SDSS 2002-05-08 This work SDSS 2002-05-08 This work SDSS 2002-05-08 This work SDSS 2002-05-08 This work SDSS 2002-05-08 This work SN2008am [SLSN-IIn, , ] GALEX [5] GALEX [5] SDSS 2003-01-28 This work SDSS 2003-01-28 This work SDSS 2003-01-28 This work SDSS 2003-01-28 This work SDSS 2003-01-28 This work VLT ISAAC 2013-03-23 This work CAHA Omega2000 2015-05-07 This work VLT ISAAC 2013-03-23 This work UKIDSS/UKIRT WFCAM [1] UKIDSS/UKIRT WFCAM [1] UKIDSS/UKIRT WFCAM [1] WISE [15] SN2008es [SLSN-II, fast declining, , ] HST WFC3 [12] HST WFC3 [12] GTC OSIRIS 2013-03-15 1920 This work Keck LRIS [12] Keck LRIS [12] SN2008fz [SLSN-IIn, , ] CAHA BUSCA 2012-10-04 This work This work CAHA BUSCA 2012-10-04 This work CAHA BUSCA 2012-10-04 This work This work CAHA BUSCA 2012-10-04 This work This work HST WFC3 [12] HST WFC3 [12] Keck LRIS [12] Keck LRIS [12] VLTc FORS2 2013-05-30 This work SN2009de [SLSN-I, , ] SDSS 2005-06-05 This work SDSS 2005-06-05 This work SDSS 2005-06-05 This work SDSS 2005-06-05 This work SDSS 2005-06-05 This work
List of host observations and their photometries. Survey/ Instrument Filter Brightness Date Exposure Reference Telescope (magAB) time (s) SN2009jh [SLSN-I, slow declining, , ] HST WFC3 [12] HST WFC3 [12] VLT FORS2 2013-02-20 This work VLT FORS2 2013-03-17 This work VLT FORS2 2013-02-20 This work VLT HAWK-I 2012-05-20 This work VLT HAWK-I 2012-06-03 This work SN2009nm [SLSN-IIn, , ] SDSS 2012-12-20 This work SDSS 2012-12-20 This work SDSS 2012-12-20 This work SDSS 2012-12-20 This work SDSS 2012-12-20 This work SN2010gx [SLSN-I, fast declining, , ] GALEX [5] Gemini-S GMOS 2012-01-21 This work Gemini-S GMOS 2011-05-25 This work Gemini-S GMOS 2011-05-25 This work Gemini-S GMOS 2011-02-28 This work Magellan† FourStar 2012-12-04 [6] SN2010kd [SLSN-I, , ] GALEX [5] GTC Osiris 2013-04-02 This work NOT ALFOSC 2015-03-13 This work NOT ALFOSC 2015-03-13 This work Swift UVOT 2014-11-19–2016-01-26 9529 This work SN2011cp [SLSN-IIn, , ] SDSS 2003-01-25 This work SDSS 2003-01-25 This work SDSS 2003-01-25 This work SDSS 2003-01-25 This work SDSS 2003-01-25 This work UKIDSS/UKIRT WFCAM [1] UKIDSS/UKIRT WFCAM [1] UKIDSS/UKIRT WFCAM [1] UKIDSS/UKIRT WFCAM [1] WISE [15] WISE [15] WISE [15] WISE [15] SN2011ep [SLSN-I, , ] GALEX [5] SDSS 2001-05-18 This work SDSS 2001-05-18 This work SDSS 2001-05-18 This work SDSS 2001-05-18 This work SDSS 2001-05-18 This work
List of host observations and their photometries. Survey/ Instrument Filter Brightness Date Exposure Reference Telescope (magAB) time (s) SN2011ked [SLSN-I, fast declining, , ] VLT FORS2 2013-05-30 This work VLT FORS2 2013-05-30 This work VLT FORS2 2013-05-30 This work VLT FORS2 2013-05-30 This work VLT FORS2 2013-05-30 This work VLT HAWK-I 2013-06-02 This work SN2011kf [SLSN-I, fast declining, , ] VLT FORS2 2013-05-30 This work VLT FORS2 2013-05-30 This work VLT FORS2 2013-05-30 This work VLT FORS2 2013-05-30 This work VLT HAWK-I 2013-06-02 This work VLT HAWK-I 2013-06-02 This work SN2012il [SLSN-I, fast declining, , ] GALEX [5] GALEX [5] HST WFC3 [12] Magellan IMACS 20013-11-18 This work Magellan† FourStar [6] Magellan† FourStar [6] SDSS 2005-02-04 This work SDSS 2005-02-04 This work SDSS 2005-02-04 This work SDSS 2005-02-04 This work SDSS 2013-02-08 This work Swift/UVOT 2016-01-09 140 This work This work SN2013dg [SLSN-I, fast declining, , ] Magellan IMACS 2014-06-27 This work Magellan IMACS 2014-06-27 This work Magellan IMACS 2014-06-27 This work Magellan FourStar 2014-03-23 This work SN2013hx [SLSN-IIn, fast declining, , ] Magellan IMACS 2016-02-01 This work Magellan IMACS 2016-02-01 This work Magellan IMACS 2016-02-01 This work SN2013hy [SLSN-I, , ] DES/Blanco DECam [19] DES/Blanco DECam [19] DES/Blanco DECam [19] DES/Blanco DECam [19] SN2015bn [SLSN-I, , ] GALEX [5] SDSS 1999-03-22 This work SDSS 1999-03-22 This work SDSS 1999-03-22 This work SDSS 1999-03-22 This work SDSS 1999-03-22 This work
List of host observations and their photometries. Survey/ Instrument Filter Brightness Date Exposure Reference Telescope (magAB) time (s) SN1000+0216 [SLSN-I, , ] COSMOS/Subaru Suprime-Cam [8] COSMOS/Subaru Suprime-Cam [8] COSMOS/Subaru Suprime-Cam [8] COSMOS/Subaru Suprime-Cam [8] COSMOS/Subaru Suprime-Cam [8] COSMOS/Subaru Suprime-Cam [8] COSMOS/UKIRT WFCAM [8] COSMOS/CFHT WIRCAM [8] COSMOS/Spitzer IRAC [8] COSMOS/Spitzer IRAC [8] COSMOS/Spitzer IRAC [8] COSMOS/Spitzer IRAC [8] UltraVISTA/VISTA VIRCAM [20] UltraVISTA/VISTA VIRCAM [20] UltraVISTA/VISTA VIRCAM [20] UltraVISTA/VISTA VIRCAM [20] SN2213-1745 [SLSN-I, , ] CFHTLS/CFHT MegaPrime This work CFHTLS/CFHT MegaPrime This work CFHTLS/CFHT MegaPrime This work CFHTLS/CFHT MegaPrime This work CFHTLS/CFHT MegaPrime This work Magellan FourStar 2014-11-05 This work SNLS06D4eu [SLSN-I, , ] CFHTLS/CFHT MegaPrime This work CFHTLS/CFHT MegaPrime This work CFHTLS/CFHT MegaPrime This work CFHTLS/CFHT MegaPrime This work CFHTLS/CFHT MegaPrime This work VLT HAWK-I 2013-10-13 This work VLT HAWK-I 2013-10-13 This work SNLS07D2bv [SLSN-I, , ] COSMOS/CFHT MegaPrime [8] COSMOS/Subaru Suprime-Cam [8] COSMOS/Subaru Suprime-Cam [8] COSMOS/Subaru Suprime-Cam [8] COSMOS/Subaru Suprime-Cam [8] COSMOS/Subaru Suprime-Cam [8] COSMOS/Subaru Suprime-Cam [8] COSMOS/UKIRT PS1-12zn [8] COSMOS/CFHT WIRCAM [8]
List of host observations and their photometries. Survey/ Instrument Filter Brightness Date Exposure Reference Telescope (magAB) time (s) SSS120810 [SLSN-I, fast declining, , ] Swift UVOT 2014-11-09–2016-01-28 8922 This work VLT FORS2 2013-05-30 This work VLT FORS2 2013-05-30 This work VLT FORS2 2013-05-30 This work VLT FORS2 2013-05-30 This work VLT HAWK-I 2013-06-02 This work VLT HAWK-I 2013-06-02 This work
| Object | Redshift | Survey/ | Observed | r.m.s | Date | Reference |
|---|---|---|---|---|---|---|
| Telescope | frequency | (mJy/beam) | ||||
| SLSN-I host galaxies | ||||||
| CSS140925 | 0.460 | NVSS/VLA | 1.4 GHz | 0.45 | [1] | |
| DES14S2qri | 1.500 | FIRST/VLA | 1.4 GHz | 0.155 | [2] | |
| DES14X2byo | 0.869 | FIRST/VLA | 1.4 GHz | 0.108 | [2] | |
| DES14X3taz | 0.608 | FIRST/VLA | 1.4 GHz | 0.106 | [2] | |
| iPTF13ajg† | 0.740 | FIRST/VLA | 1.4 GHz | 0.102 | [2] | |
| LSQ12dlf‡ | 0.255 | NVSS/VLA | 1.4 GHz | 0.45 | [1] | |
| LSQ14an | 0.163 | NVSS/VLA | 1.4 GHz | 0.45 | [1] | |
| LSQ14mo‡ | 0.256 | NVSS/VLA | 1.4 GHz | 0.45 | [1] | |
| LSQ14bdq† | 0.345 | NVSS/VLA | 1.4 GHz | 0.45 | [1] | |
| LSQ14fxj | 0.360 | FIRST/VLA | 1.4 GHz | 0.114 | [2] | |
| MLS121104 | 0.303 | JVLA | 1.4 GHz | 0.015 | 2015-07-28 & | This work |
| 2015-08-05 | This work | |||||
| PS1-10ky | 0.956 | FIRST/VLA | 1.4 GHz | 0.162 | [2] | |
| PS1-10pm | 1.206 | FIRST/VLA | 1.4 GHz | 0.141 | [2] | |
| PS1-10ahf | 1.158 | FIRST/VLA | 1.4 GHz | 0.11 | [2] | |
| PS1-10awh | 0.909 | FIRST/VLA | 1.4 GHz | 0.105 | [2] | |
| PS1-10bzj‡ | 0.649 | NVSS/VLA | 1.4 GHz | 0.45 | [1] | |
| PS1-11ap† | 0.524 | FIRST/VLA | 1.4 GHz | 0.144 | [2] | |
| PS1-11tt | 1.283 | FIRST/VLA | 1.4 GHz | 0.151 | [2] | |
| PS1-11afv | 1.407 | FIRST/VLA | 1.4 GHz | 0.162 | [2] | |
| PS1-11aib | 0.997 | FIRST/VLA | 1.4 GHz | 0.139 | [2] | |
| PS1-11bam | 1.565 | FIRST/VLA | 1.4 GHz | 0.139 | [2] | |
| PS1-11bdn | 0.738 | FIRST/VLA | 1.4 GHz | 0.117 | [2] | |
| PS1-12zn | 0.674 | FIRST/VLA | 1.4 GHz | 0.153 | [2] | |
| PS1-12bmy | 1.566 | NVSS/VLA | 1.4 GHz | 0.45 | [1] | |
| PS1-12bqf | 0.522 | FIRST/VLA | 1.4 GHz | 0.123 | [2] | |
| PS1-13gt | 0.884 | FIRST/VLA | 1.4 GHz | 0.16 | [2] | |
| PTF09atu | 0.501 | FIRST/VLA | 1.4 GHz | 0.172 | [2] | |
| PTF09cnd† | 0.258 | FIRST/VLA | 1.4 GHz | 0.141 | [2] | |
| PTF10hgi‡ | 0.099 | NVSS/VLA | 1.4 GHz | 0.45 | [1] | |
| PTF10vqv | 0.452 | FIRST/VLA | 1.4 GHz | 0.17 | [2] | |
| PTF11rks‡ | 0.190 | NVSS/VLA | 1.4 GHz | 0.45 | [1] | |
| PTF12dam† | 0.107 | FIRST/VLA | 1.4 GHz | 0.14 | [2] | |
| SCP06F6‡ | 1.189 | FIRST/VLA | 1.4 GHz | 0.143 | [2] | |
| SN1999as | 0.127 | FIRST/VLA | 1.4 GHz | 0.142 | [2] | |
| SN2005ap‡ | 0.283 | FIRST/VLA | 1.4 GHz | 0.13 | [2] | |
| JVLA | 1.4 GHz | 0.025 | 2015-09-20 | This work | ||
| SN2006oz | 0.396 | FIRST/VLA | 1.4 GHz | 0.099 | [2] | |
| SN2007bi† | 0.128 | FIRST/VLA | 1.4 GHz | 0.136 | [2] | |
| SN2009de | 0.311 | FIRST/VLA | 1.4 GHz | 0.149 | [2] | |
| SN2009jh† | 0.349 | FIRST/VLA | 1.4 GHz | 0.145 | [2] | |
| SN2010gx‡ | 0.230 | NVSS/VLA | 1.4 GHz | 0.45 | [1] | |
| SN2010kd | 0.101 | FIRST/VLA | 1.4 GHz | 0.159 | [2] | |
| SN2011ep | 0.280 | FIRST/VLA | 1.4 GHz | 0.158 | [2] | |
| SN2011ke‡ | 0.143 | FIRST/VLA | 1.4 GHz | 0.158 | [2] | |
| SN2011kf‡ | 0.245 | FIRST/VLA | 1.4 GHz | 0.154 | [2] | |
| SN2012il‡ | 0.175 | FIRST/VLA | 1.4 GHz | 0.145 | [2] | |
| SN2013dg‡ | 0.265 | FIRST/VLA | 1.4 GHz | 0.199 | [2] | |
| SN2013hy | 0.663 | NVSS/VLA | 1.4 GHz | 0.45 | [1] | |
| SN2015bn | 0.110 | FIRST/VLA | 1.4 GHz | 0.147 | [2] | |
| SN1000+0216 | 3.899 | FIRST/VLA | 1.4 GHz | 0.135 | [2] | |
| SN2213-1745 | 2.046 | NVSS/VLA | 1.4 GHz | 0.45 | [1] | |
| SNLS06D4eu | 1.588 | NVSS/VLA | 1.4 GHz | 0.45 | [1] | |
| SNLS07D2bv | 1.500 | FIRST/VLA | 1.4 GHz | 0.143 | [2] | |
| SSS120810‡ | 0.156 | SUMSS | 843 MHz | 1.3 | [3] | |
Radio observations of SLSN host galaxies. Object Redshift Survey/ Observed r.m.s Date Reference Telescope frequency (mJy/beam) SLSN-IIn host galaxies CSS100217 0.147 FIRST/VLA 1.4 GHz 0.15 [2] PTF10heh 0.338 FIRST/VLA 1.4 GHz 0.12 [2] PTF10qaf 0.284 FIRST/VLA 1.4 GHz 0.135 [2] PTF11dsf 0.385 FIRST/VLA 1.4 GHz 0.15 [2] SN1999bd 0.151 FIRST/VLA 1.4 GHz 0.164 [2] SN2003ma 0.289 SN2006gy 0.019 NVSS/VLA 1.4 GHz 0.45 [1] SN2006tf 0.074 FIRST/VLA 1.4 GHz 0.132 [2] SN2007bw 0.14 FIRST/VLA 1.4 GHz 0.162 [2] SN2008am 0.233 FIRST/VLA 1.4 GHz 0.144 [2] SN2008fz 0.133 FIRST/VLA 1.4 GHz 0.14 [2] JVLA 1.4 GHz 0.015 2015-07-21 This work SN2009nm 0.21 FIRST/VLA 1.4 GHz 0.141 [2] SN2011cp 0.38 FIRST/VLA 1.4 GHz 0.137 [2] SLSN-II host galaxies CSS121015‡ 0.287 FIRST/VLA 1.4 GHz 0.172 [2] SN2008es‡ 0.205 FIRST/VLA 1.4 GHz 0.147 [2] SN2013hx‡ 0.13 SUMSS 843 MHz 1.3 [3]
Appendix B Spectral energy distribution fits
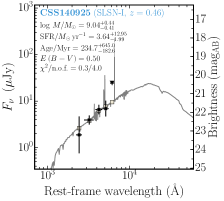
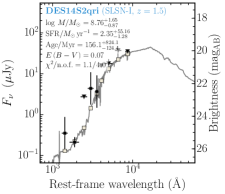
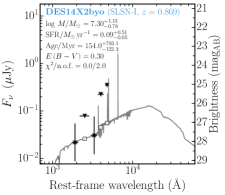
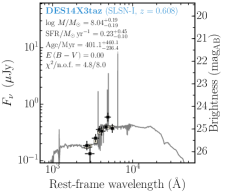

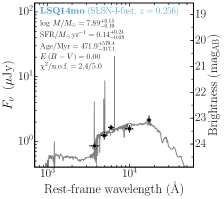
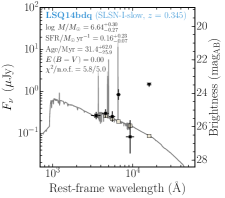
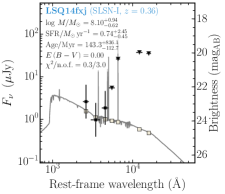
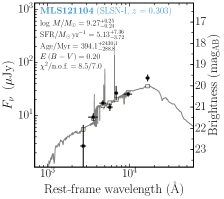
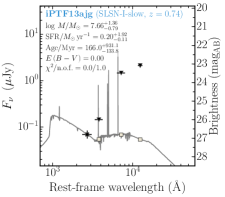
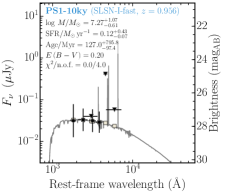
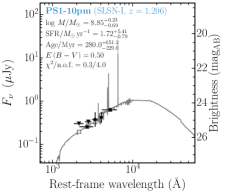
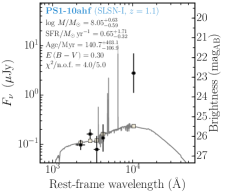
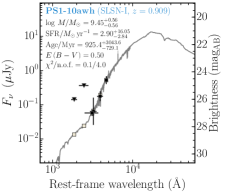
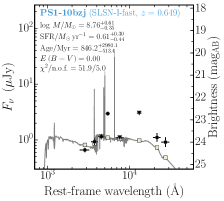
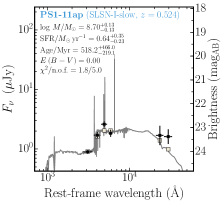
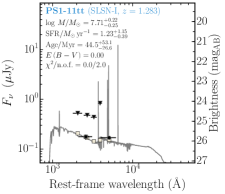
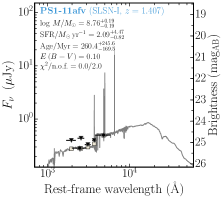
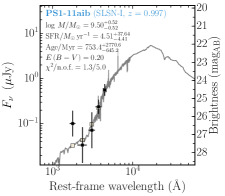
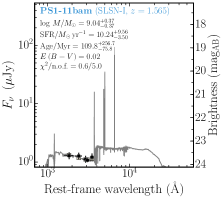
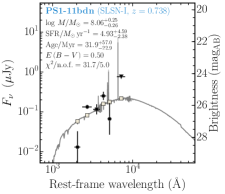
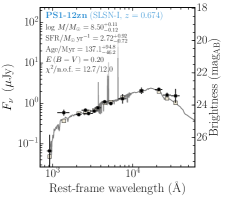
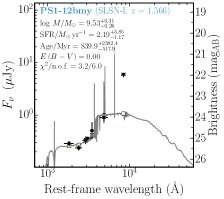
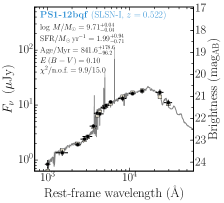
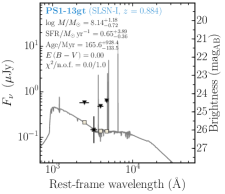
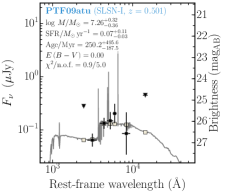

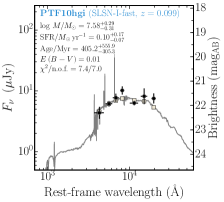
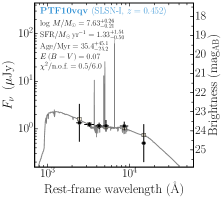
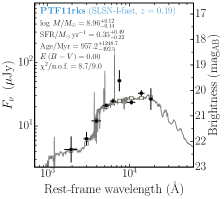
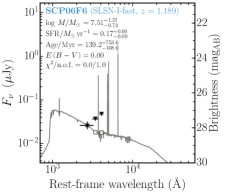
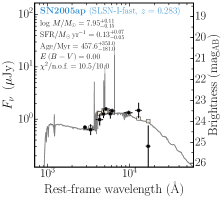
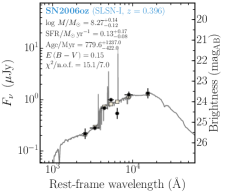
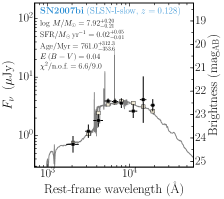
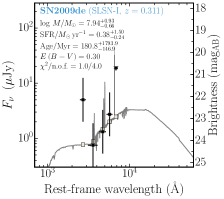
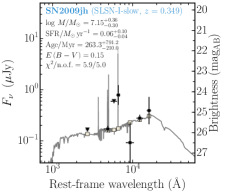
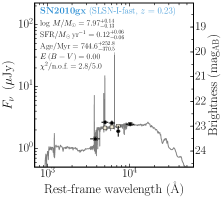
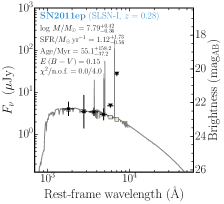
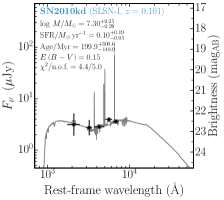
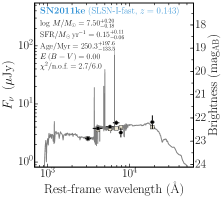
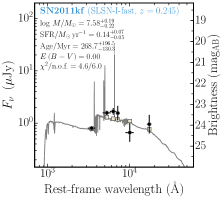
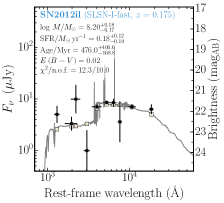
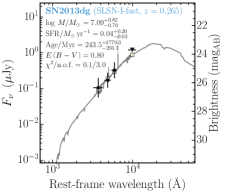
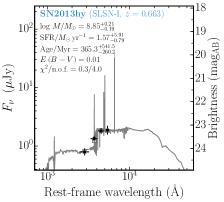
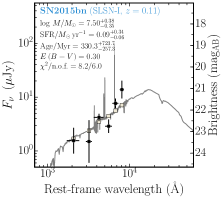
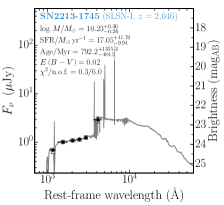
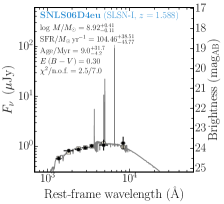
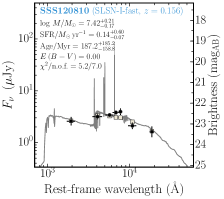
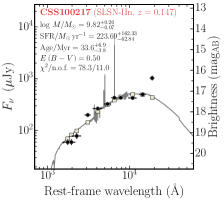
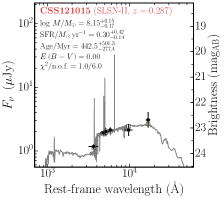
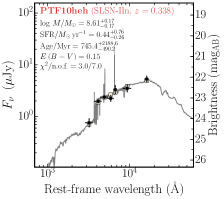
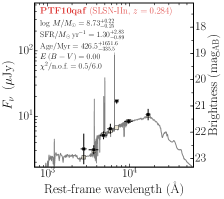
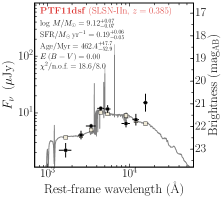
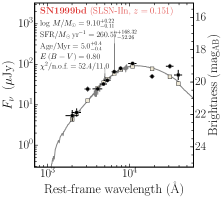
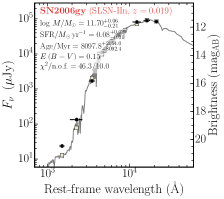
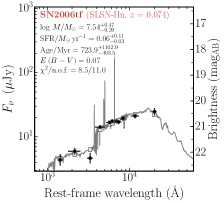
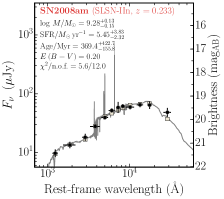
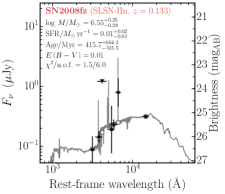
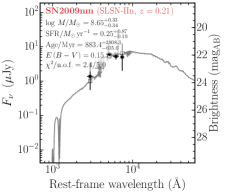
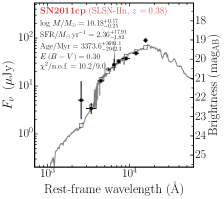
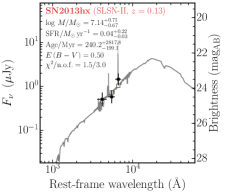
Appendix C Postage stamps
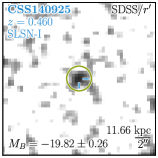
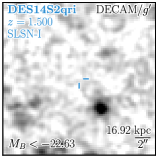
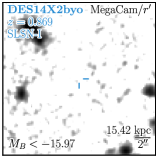
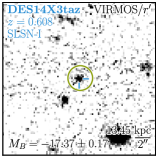
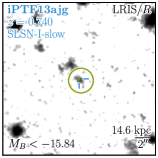
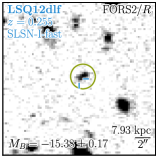
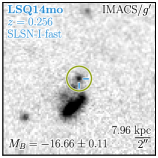
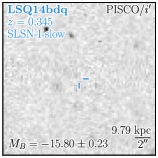
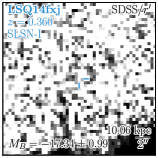
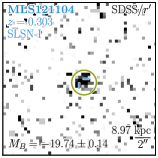
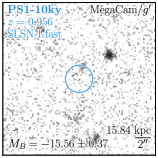
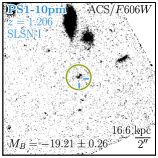
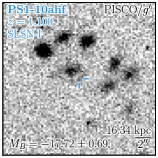
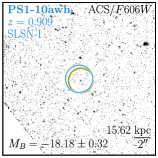
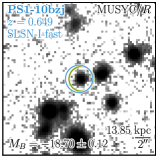
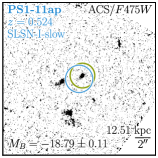
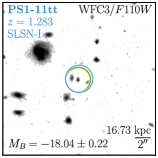
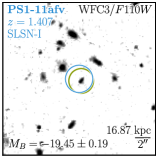
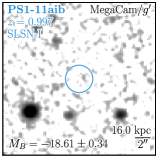
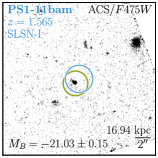
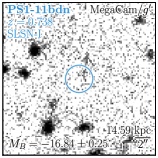
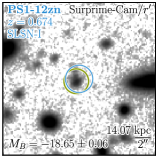

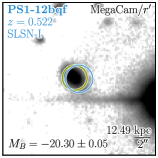
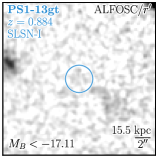
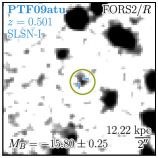
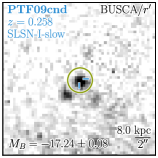
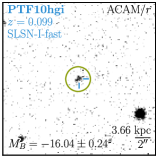

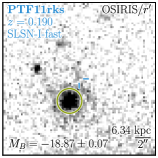
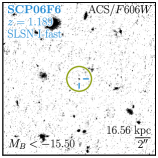
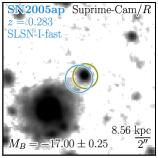
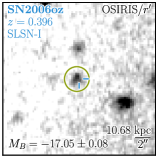
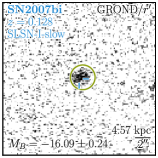
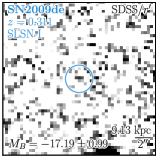
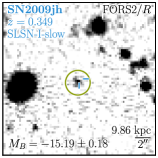
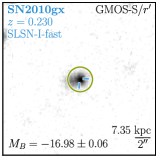
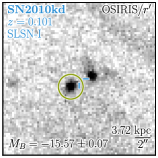
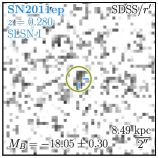
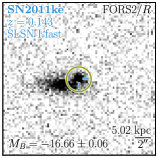
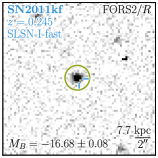
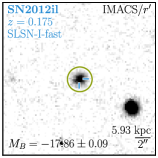
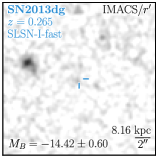
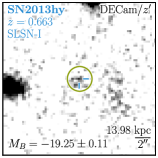
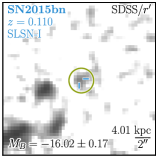
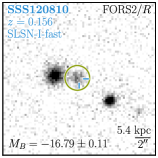
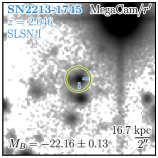
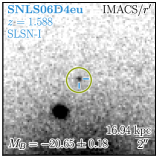
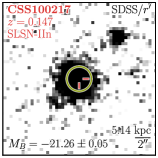
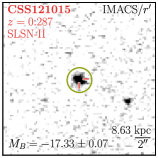
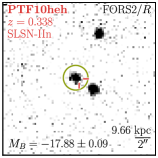
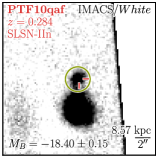
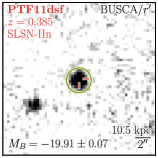
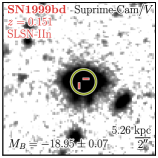
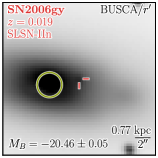
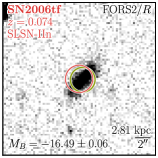
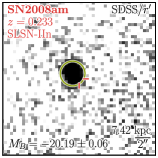
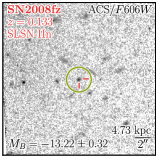
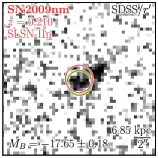
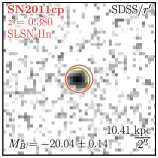
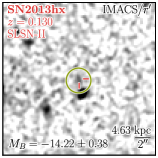
Appendix D Statistical properties of the comparison samples
| Sample | Number | Mean | ||||||
|---|---|---|---|---|---|---|---|---|
| Redshift | (mag) | (mag) | (mag) | |||||
| GRB | 14 | 0.32 | (7) | (5) | ||||
| SN | ||||||||
| GOODS | 12 | 0.41 | ||||||
| L11, S12, S13 | 105 | 0.05 | ||||||
| EELG | ||||||||
| VUDS | 9 | 0.34 | (11) | (11) | ||||
| zCOSMOS | 86 | 0.30 | (89) | (89) | ||||
| UltraVISTA | 26706 | 0.33 | ||||||
| GRB | 38 | 0.76 | (12) | (7) | ||||
| SN | ||||||||
| GOODS | 41 | 0.72 | ||||||
| EELG | ||||||||
| VUDS | 21 | 0.65 | (19) | (19) | ||||
| zCOSMOS | 78 | 0.70 | (91) | (91) | ||||
| UltraVISTA | 52689 | 0.77 | ||||||
| SN | ||||||||
| GOODS | 5 | 1.16 | ||||||
| EELG | ||||||||
| 3D-HST | 22 | 1.75 | ||||||
| WISPS | 7 | 1.62 | ||||||
| UltraVISTA | 70413 | 1.60 | ||||||