factor enhancement in SnSe: predictions from first principles calculations
Abstract
The electronic structure and thermoelectric properties of SnSe are studied by first-principles methods. The inclusion of van der Waals dispersive corrections improves the agreement of structural parameters with experiments. The bands structure and projected density of states justify the macroscopic anisotropy exhibited by this system. An original methodology is used to estimate the chemical potential and the relaxation time for the electrical and thermal conductivities. Following this methodology, the Seebeck coefficient and thermal conductivity for single crystals and polycrystals are described in good agreement with experimental data. As for the electrical conductivity, values calculated with a temperature-dependent relaxation time compare well with available measurements, especially for single crystals; polycrystals are better described by a constant relaxation time. Finally, the figure of merit of SnSe single crystals and polycrystals is calculated. It is found to exhibit a maximum for some “ideal” carrier concentration, and might be noticeably enhanced by using carrier concentrations higher than the experimental ones. From these findings, possible strategies to increase the figure of merit in practise are suggested.
pacs:
71.15.Mb, 71.20.Nr, 72.20.Pa, 72.80.Jc, 73.22.PrI Introduction
Thermoelectric materials have the capability to convert directly the residual heat resulting from industrial processes into electric energy. They are nowadays matter of great interest due to their applications in waste heat harvesting, radioisotope thermoelectric power generation, solid-state Peltier refrigeration, etc. Harman-02 ; Snyder-08 ; Qurashi-14 ; Poehler-16 From the point of view of potential applications, the main challenge for the scientific community consists on improving the thermoelectric properties of these materials to increase the efficiency of the heat conversion process.
An ideal thermoelectric must have a high figure of merit , defined at a temperature as:
| (1) |
where , and are the Seebeck coefficient, the electrical and the thermal conductivities, respectively. The term is called power factor of the material. The thermal conductivity may be written as , where denotes the lattice conductivity and the contribution due to the charge carriers. The latter, on its own, is related to the electrical conductivity and the temperature through the Wiedemann-Franz law, , where is a constant called Lorenz number.
The search of materials with high is an essential issue for possible technological applications. Vineis-10 According to Eq. (1), a high requires a high power factor as well as a low thermal conductivity. Unfortunately, both conditions are difficult to achieve simultaneously because and are strongly correlated in materials. Indeed, low carrier concentrations yield high Seebeck coefficients, but also low electric conductivities. On the other hand, a high electrical conductivity uses to be accompanied by a high thermal conductivity. Different optimization strategies have tried to reach an optimal equilibrium between these trends. Heremans-08 ; Biswas-12 ; Pei-11 Thus, since the 90’s, a myriad of thermoelectric materials with increasingly higher factors, such as clathrates,Shi-10 skutterudites,Shi-11 germanium-silicon alloys, Joshi-08 ; Wang-08 systems with diamond-like structureLiu-12a or the family of chalcogenides Heremans-08 ; Liu-12b ; Tan-14 ; Zhao-14 ; Chen-14 ; Zhang-15 ; Sassi-14 have arisen as promising candidates for technological applications. Incidentally, we mention that an additional problem in this respect is the difficulty to reproduce the experimental research at the industrial scale. Heremans-08 ; Pei-11 ; Tan-14 ; Hinsche-12 ; Levi-14 .
The recent work by Zhao et al. Zhao-14 about lead-free tin chalcogenides, more specifically those based on tin selenide (SnSe),Sassi-14 ; Heremans-14 ; Carrete-14 ; Yang-15 ; Wang-15 ; Guo-15 ; Ding-15 ; Gomes-15 ; Gharsallah-16 ; Zhang-16 has raised a great interest amongst the scientific community because SnSe is a simple compound that can be produced in a relatively easy way. The authors found an astonishingly low thermal conductivity in SnSe, giving rise to a very high and promising along the axis at 923 K (typical values are for skutterudites or for clathrates Yang-16 ). Independently, Chen et al.,Chen-14 Zhang et al. Zhang-15 and Sassi et al. Sassi-14 have reported high values in SnSe polycrystals that, however, are lower than those reported by Zhao et al. in single crystals. The main difference is the low thermal conductivity in single crystals, which has been ascribed to a strong anharmonicity in the bonds of SnSe.Zhao-14 On the other hand, Carrete et al. Carrete-14 and Guo et al.Guo-15 have carried out first-principles calculations to evaluate the lattice thermal conductivity of SnSe, and their results agree with experimental data by Chen et al.Chen-14 , Zhang et al.Zhang-15 and Sassi et al.Sassi-14 A more recent work by Gharsallah et al.Gharsallah-16 studies Ge-doped SnSe nanocrystals. Their experiments yield very high values of the Seebeck coefficient and the electrical resistivity, together with a very low thermal conductivity. The authors conclude that the grain boundaries decrease the thermal conductivity to values even below those reported for pure SnSe, but they are also likely to yield high electrical resistivities.
In any case, these studies suggest that it is possible to develop thermoelectric materials with simple structures containing no lead but cheap and plentiful elements, in contrast with the currently available systems. To this end, understanding the physical origin of the discrepancies between the behavior of single crystals and polycrystals is a mandatory step towards the synthesis, and later commercialization, of more efficient thermoelectric materials based upon SnSe. This is the context of our work. We present an ab initio study of the electronic structure and thermoelectric properties of SnSe. The calculated band structure sheds light on the thermal and transport coefficients of this system. As for the lattice thermal conductivity, we have used new computational tools that yield an excellent agreement with experimental data for . From this set of calculations, we have estimated optimal values of charge carrier concentrations that could maximize . We show then that the charge carrier concentration measured in experiments is far to be the ideal for an optimal at moderate temperatures, and suggest possible ways to increase the figure of merit.
II Methodology
II.1 Computational setup
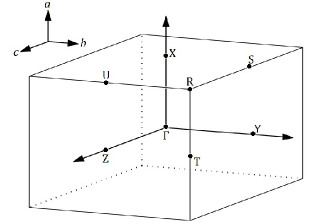
First-principles calculations based on the density functional theory (DFT) Hohenberg-64 ; Kohn-65 have been performed using the projector augmented wave (PAW) method Blochl-94 ; Kresse-99 as implemented in the Vienna ab initio simulation package (VASP). Kresse-96 The Perdew-Burke-Ernzerhof functional for the generalized-gradient-approximation (GGA) was used to describe the electronic exchange–correlation interaction. Perdew-96 The kinetic energy cutoff of wave functions was set to 700 eV, and a Monkhorst-PackMonkhorst-76 mesh of was used to sample the first Brillouin zone (BZ) for integrations in the reciprocal space. A force less than 10eV/Å and a total change in energy less than 10eV were selected as convergence criteria for the structural optimization. The optimization procedure explicitly included van der Waals interactions modeled by the DFT-D method by Grimme et al. Grimme-10 The band structure and electronic density of states (DOS) were calculated at the optimized structure along high symmetry directions (namely , , , and ) of BZ, shown in Figure 1.
The thermoelectric properties of SnSe were studied by solving the Boltzmann transport equation (BTE) within the relaxation time approximation (RTA). Under this approximation, the Cartesian components of the electrical conductivity, Seebeck coefficient and electronic thermal conductivity are written as
| (2a) | |||
| (2b) | |||
| (2c) | |||
In Eqs. (2a) to (2c), holds for the Fermi-Dirac distribution function, and are, respectively, the electron charge and the temperature and is the transport distribution function, defined as
| (3) |
where is the volume of the solid, is the energy of an electron in the th band at wave vector , is the th component of its velocity and the summation is over all bands and over the entire BZ. is the relaxation time for electrons, which depends on the electron state for each dispersing mechanism as well as on temperature. In what follows, we will accept that is a constant parameter within BZ, that is, independent on the electron wave vector. This has been shown to be a good approximation, even for anisotropic systems.Scheidemantel-03 ; Madsen-06 The chemical potential is a function of temperature as well, and it is related to the charge carrier concentrations in the solid. The transport coefficients were calculated with the BoltzWann post-processing codePizzi-14 included in the Wannier90 package.Mostofi-08 For comparison with experiments, average values of the , and tensors were calculated as one third of the traces of the corresponding matrices.
The lattice thermal conductivity was calculated by solving BTE for phonons. The dispersion relations for phonons and the second-order harmonic interatomic force constants were calculated using the Phonopy package.Togo-08 ; Togo-15 In order to get reliable phonon spectra, a supercell was employed for force constants calculations. To obtain the third-order anharmonic force constants and to solve the BTE, the ShengBTE code was used. Li-14 A supercell was built to calculate the anharmonic forces, and the first-principles based real-space finite displacement difference approach was employed;Li-14 as for DFT, van der Waals corrections were used for these calculations. We chose a cutoff radius of 6.5 Å, according to a previous work. Carrete-14 More details about this method can be found in Refs. Carrete-14 ; Li-14
II.2 Evaluation of the relaxation times
The transport coefficients are defined in terms of the electronic chemical potential and the relaxation time for the BTE, . The main difficulty to estimate lies on the number and complexity of the scattering mechanisms active at a given temperature (phonons, impurities, grain boundaries and other structural defects, etc). Each of these is ruled by a particular temperature-dependent relaxation time; the overall value is then an average of the relaxation times for each active scattering mechanism. The usual procedure to estimate the relaxation time is to combine first-principles calculations with experimental results, as in Refs. Wang-15 ; Guo-15 ; Shi-15 This semi-empirical methodology evaluates the relaxation time at room temperature from comparison with experimental data, and subsequently uses it in calculations at different temperatures.
As will be evident below, assessing thermoelectric behavior of SnSe requires a detailed evaluation of as a function of temperature for each type of material, namely single crystals or polycrystals. In this work, the relaxation times were estimated following a two-step procedure. First, we set the chemical potential which optimally fitted the Seebeck coefficient from a comparison between calculated and experimental data at each temperature. For this step one does not need any relaxation time, assumed to be constant within BZ, since the dependence is cancelled out by that of in Eq. (2b). The second step consisted on comparing the experimental values for with those calculated using the previous values of . In this second step, is chosen so as to yield the best fit between experimental and calculated at each temperature as well. Thus, after this second step one has the and functions yielding the best fits to experimental data. For single crystals and polycrystals, all the experimental data available to us were used to calculate the respective relaxation times.
III Results and discussion
III.1 Crystal structure
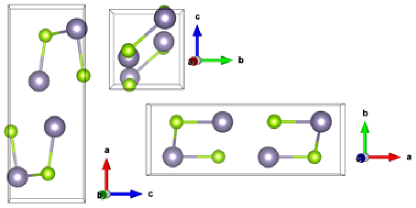
SnSe is orthorhombic at room temperature (space group , nr. 62), with the unit cell containing eight atoms arranged in two double adjacent layers, as shown in Figure 2. The Sn atoms are surrounded by Se atoms in distorted octahedral coordination, forming a zig-zag arrangement.Zhao-14 ; Ding-15 ; Chattopadhyay-86 ; Li-15 As a preliminary step, we relaxed the unit cell of SnSe, since correct values of the lattice parameters are crucial to describe thermal and electrical properties. Previous studies show that DFT under the GGA overestimates the lattice parameter, and therefore also the separation between the layers, as shown in Table 1. In addition, experimental evidence exists that the Sn-Se bonds are strong within the planes but weak along the axis,Peters-90 suggesting that the latter could be due to van der Waals interactions. This is why we explicitly included van der Waals dispersive corrections during the cell relaxation stage. Table 1 shows the lattice parameters of the system after relaxation, showing an accurate agreement with experimental data, especially for the parameter. This is indicative that dispersive corrections are needed to get an appropriate description of the cell geometry in SnSe and of its physical behavior. The main disagreement is for the lattice parameter, for which DFT yields higher values than experiments. This result is not surprising, since the van der Waals interaction is expected to be negligible within the plane; the difference between the calculated and the experimental values for is therefore that inherent to DFT under the GGA.
| Reference | (Å) | (Å) | (Å) | (eV) |
|---|---|---|---|---|
| This work | 11.56 | 4.17 | 4.54 | 0.63 |
| Zhao et al.Zhao-14 | 11.79 | 4.21 | 4.55 | 0.61 |
| 11.58∗ | 4.22∗ | 4.40∗ | 0.86∗ | |
| Zhang et al.Zhang-15 | 11.48 | 4.15 | 4.43 | 0.94 |
| Sassi et al.∗Sassi-14 | 11.50 | 4.15 | 4.43 | — |
| Carrete et al.Carrete-14 | 11.72 | 4.20 | 4.55 | — |
| Ding et al.Ding-15 | 11.75 | 4.20 | 4.44 | 0.69 |
| Gomes et al.Gomes-15 | 11.81 | 4.22 | 4.47 | 1.00 |
| Gharsallah et al.Gharsallah-16 | 11.54∗ | 4.16∗ | 4.45∗ | 0.58 |
| Chattopadhyay et al.∗Chattopadhyay-86 | 11.50 | 4.15 | 4.45 | — |
| Peng et al.Peng-16 | 11.493∗ | 4.152∗ | 4.438∗ | |
| Singh et al.∗Singh-91 | — | — | — | 1.00 |
| Yu et al.∗Yu-81 | — | — | — | 0.923 |
| Albers et al.∗Albers-62 | 11.51 | 4.13 | 4.5 | 0.9-0.95 |
III.2 Band structure and density of states
The physical properties of SnSe, which is a -type semiconductor, are highly anisotropic.Zhao-14 ; Chen-14 ; Carrete-14 ; Yang-15 ; Guo-15 ; Ding-15 ; Shi-15 Such an anisotropy is particularly observed in measurements of , and , and may be understood in terms of the band structure of this material, shown in Figure 3. Our calculations indicate that SnSe has an indirect gap of 0.63 eV (see Table 1), in good agreement with DFT values reported by other authors, but lower than the experimental gap (around 1.0 eV) due to the incapability of DFT to accurately describe the electronic exchange and correlation. The valence band maximum (VBM) lies on the direction of BZ, parallel to the axis in the real space. There are several secondary maxima, with energies close to the main maximum, along the , and directions, the later being parallel to the axis in the real space. The conduction band minimum (CBM) lies on the direction, and there is a secondary minimum at . The band structure of Fig. 3 exhibits some “pudding mold” characteristics, as proposed by Kuroki and Arita.Kuroki-07 The systems with this type of bands use to have high electrical conductivities and Seebeck coefficients.
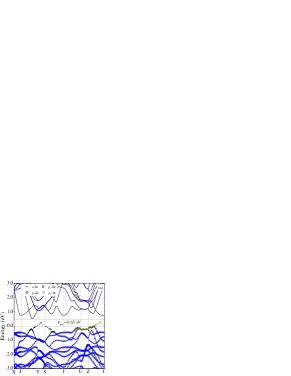
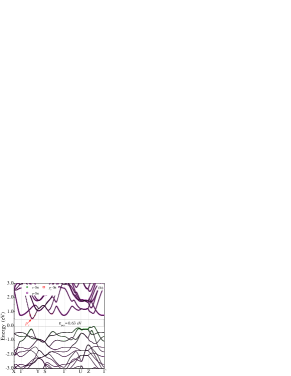
Figure 3 plots the bands of SnSe projected onto and orbitals of Se (Fig. 3) and Sn (Fig. 3) as well. These projections appear as circles, whose diameters are proportional to the partial density of electronic states for the corresponding energy. The bands arisen from Se states locate below -10.0 eV, and they do not appear in Fig. 3. The valence bands have mainly Se character, with the VBM associated to the states with a small contribution of Sn ones (shown in Fig. 3). The secondary maxima have Se character too, except the one along the crystal axis ( direction), which arises from Se states. On the contrary, the conduction bands are formed mostly by Sn states. The CBM corresponds to Sn states. Some valence bands have also Sn character, although most of the bands arisen from Sn levels have low energies (below -4.0 eV). It is also noticeable that both CBM and VBM lie on planes perpendicular to the axis, which justifies why the transport coefficients are so different along that direction.
III.3 Seebeck coefficient and electrical conductivity
The dependence of and of SnSe with the charge carrier concentration and the temperature is still under study. Yang-15 ; Wang-15 ; Guo-15 ; Ding-15 ; Zhang-16 ; Shi-15 ; Guan-15 Most researchers agree that the experimental curve exhibits a maximum beyond which it is decreasing; this behavior has been ascribed to bipolar conduction or to the excitation of positive and negative charge carriers. Zhao-14 ; Wang-15 ; Shi-15 Within the RTA for BTE, both the Seebeck coefficient and the electrical conductivity depend on the chemical potential (i.e., on the carrier concentration). On the other hand, does not depend on the relaxation time, as long as this is constant throughout ZB, whereas increases linearly with . These theoretical trends are not always directly comparable with experiments.Yang-15 ; Wang-15 ; Guo-15 ; Ding-15 ; Zhang-16 ; Shi-15 ; Guan-15 As we will show below, the disagreement, especially in single-crystal samples, could be due to the use of a temperature-independent . Instead, a temperature-dependent fits reasonably well the experimental results and allows predict the behavior of SnSe at different conditions.
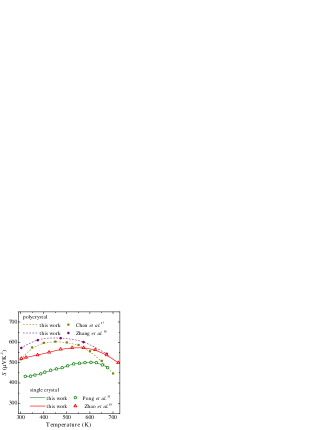
In this respect, Figure 4 shows the theoretical curve calculated following the aforementioned methodology using a temperature-dependent chemical potential. To get these results, the entire conduction band was rigidly shifted upwards for the gap to equal the experimental value of 1.0 eV. The symbols in Fig. 4 correspond to experimental measurements carried out on two polycrystallineChen-14 ; Zhang-15 and two single-crystal Zhao-14 ; Peng-16 samples. In all cases, increases monotonically with temperature to reach a maximum, beyond which it decreases. The temperature at maximum is around 600 K for single crystals, and below around 500 K for polycrystals.
Fig. 4 exhibits a very good agreement between our calculations and experimental data for polycrystals as well as for single crystals. Besides, it shows that a careful choice of the chemical potential is required in order to calculate Seebeck coefficients in reasonable agreement with experimental data. In our case, the chemical potential was found to vary with temperature as the Seebeck coefficient does (see Supplement, Fig. S1), although the temperature at maximum are slightly different.
This inflection is caused by bipolar conduction effects. Indeed, the temperature-dependent chemical potential shown as Supplement, Fig. S1 yields an approximately constant electron concentration at temperatures up to around 550 - 600 K (see Supplement, Figure S2); at higher temperatures, the concentration of electrons begins to increase. Thus, one expects transport to be associated to holes below 550 K, the contribution from electrons becoming comparable above that temperature. At K, the scattering mechanism become then more complex, and one should take into account the differences between the effective masses of electrons and holes, the interactions of both species with phonons and the possible electron-hole interactions. Similar bipolar effects have been reported elsewhere.Zhao-14 ; Wang-15 ; Shi-15
Once the curve was properly calibrated, we tested our methodology as a predicting tool in SnSe. As an example, Figure 5 plots the calculated electrical conductivity as a function of temperature. The conductivity data for polycrystals have been calculated for a constant relaxation time s, which gives the best fit to the experimental data. As for the Seebeck coefficient, the agreement between experimental and calculated data is worst for single crystals when a constant relaxation time s (which gives the best fit to experiments in this case) is used, however. Note that the relaxation time is higher for single crystals because at least one relaxation mechanism (by grain boundaries) must be absent from them.
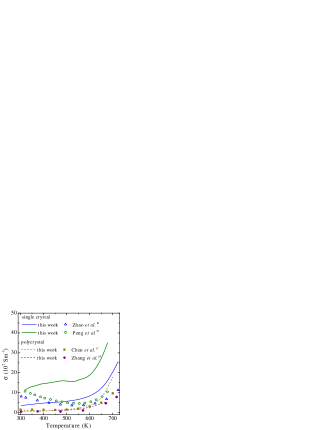
To improve the correspondence between calculated and experimental data, we moved to the second step of our methodology and considered a temperature-dependent relaxation time. The variation of with temperature is shown in Figure 6. For polycrystals, the calculated relaxation times decrease slowly with temperature. Thus, one may take an average relaxation time over the 300-700 K temperature range, and use this temperature-independent to compute the electrical conductivity in polycrystals. The good agreement of calculated data in Fig. 5 with experiments validates this strategy, and shows that a constant relaxation time may be safely used for polycrystals. This approach differs from that used by other researchers. Wang-15 ; Ding-15 ; Guan-15
For single crystals, on the contrary, decreases significantly with temperature at low temperatures, and it reaches values comparable to those for polycrystals above about 550 K; a similar behavior has been reported by other authors. Biswas-11 ; Guo-15 ; Chen-14 This is not surprising, since conductivity at high temperature is mostly affected by scattering of the charge carriers by phonons, and this does not depend much on the structural details. The electrical conductivity of SnSe single crystals, computed from the relaxation times of Fig. 6, is shown in Figure 6 as a function of temperature. In this case, contrarily to polycrystals, a temperature-dependent relaxation time yields a much better fit of the calculations to experimental data.
III.4 Dependence on temperature of the relaxation time
The dependence of the relaxation time on temperature for single crystals deserves a more detailed study. Data from Fig. 6 indicate that at temperatures between 300 K and 550 K, above which the bipolar effects become relevant, the relaxation time for single crystals is roughly proportional to , as shown in Figure 7. A temperature-dependent relaxation time is not surprising. Indeed, our DFT calculations were performed within the rigid-band approximation, where electron scattering, by either structural defects or phonons, is not considered. Consequently, all energy-dependent terms in Eqs. (2a) to (2c) are independent on temperature. Within the RTA, the possible electron scattering mechanisms are included as perturbations yielding a relaxation time depending on temperature.
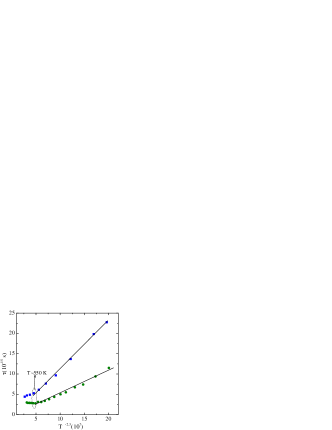
In a defect free system, electrons are expected to be scattered by acoustic phonons at low temperatures. The corresponding relaxation time is given by Jacoboni-10
| (4) |
where is the density of the solid, is the longitudinal speed of sound, , called strain potential, quantifies the strength of the electron-phonon interaction, is the effective mass of the electron and is the reduced chemical potential. is the Fermi integral, defined as:
| (5) |
Thus, one would expect a relaxation time varying with temperature as ; on the contrary, the observed trend is , which has been widely reported in the literature. Biswas-11 ; Wei-14 ; Wang-12 ; Wang-14 ; Jaworski-09 ; Li-16 ; Ravich-13 A plausible explanation for this deviation could be to consider a temperature-dependent effective mass. Ravich-13 Such a could be theoretically justified within a rigid-band approximation taking into account that Eq. (4) is calculated from the cross section for electron-phonon scattering. In other words, Eq. (4) arises from the fact that the features of the electron-phonon scattering, for whichever electronic state, vary with temperature. But the electronic states (i.e., the bands) themselves vary with temperature due to the electron-phonon interaction, thus yielding a temperature-dependent effective mass. The best fit to experimental data is achieved for within the 300 K - 550 K temperature range, and this results agrees well with data reported for other chalcogenides. Wang-12 ; Ravich-13 ; Androulakis-11 ; Zhou-14 ; Pei-12 Recently, Kutorasinski et al. have argued about a possible temperature-dependent effective mass in SnSe, although the authors do not give any estimation for such a function. Kutorasinski-15
III.5 Thermal conductivity
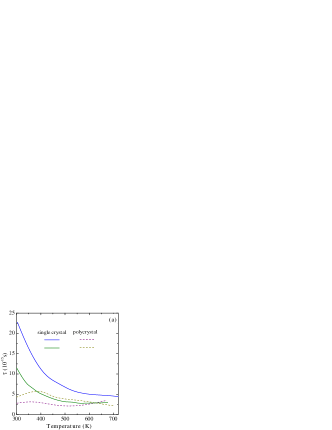
The electronic thermal conductivity varies with temperature likewise the electrical conductivity does. It remains roughly constant up to 550 K, approximately; at higher temperatures, it increases in average from roughly (at around 550 K) to Wm-1K-1 (at 700 K). These trends are the same for single crystals and for polycrystals (see Supplement, Fig. S3), but is significantly smaller for the latter at low temperatures.
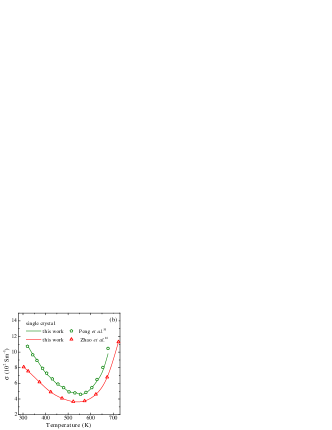
At low temperature, the main contribution to the thermal conductivity is that from the lattice, . Figure 8 plots our results for the lattice thermal conductivity as a function of temperature, averaged over the three crystal axes, together with some experimental and simulation results. Zhao-14 ; Chen-14 ; Sassi-14 ; Carrete-14 The agreement between our results and those those calculated by Carrete et al.,Carrete-14 is excellent, even though these authors do not include van der Waals corrections in their calculations. The thermal conductivity data by Chen et al. Chen-14 and Sassi et al. Sassi-14 are consistent with our results as well, especially at temperatures up to around 550 K; at higher temperatures, our values are systematically lower. It is remarkable the low thermal conductivity measured by Zhao et al.,Zhao-14 especially considering that they used single-crystal samples. For these, one would expect the values to be higher than in polycrystals, since the lack of grain boundaries should increase the thermal conductivity. Poudel-08 ; Dong-14
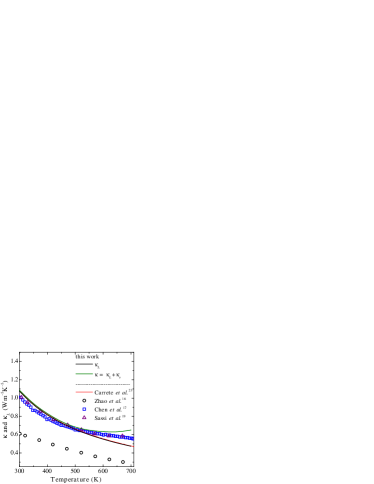
Fig. 8 plots the total (i.e., lattice plus electronic) thermal conductivity of SnSe as well. The difference between the total and lattice thermal conductivities is negligible at temperatures below 550 K, as one could expect. At higher temperatures, the electronic contribution to the total thermal conductivity becomes more and more important. At these temperatures, the inclusion of the electronic thermal conductivity improves the agreement between experimental and calculated data up to about 630 K.
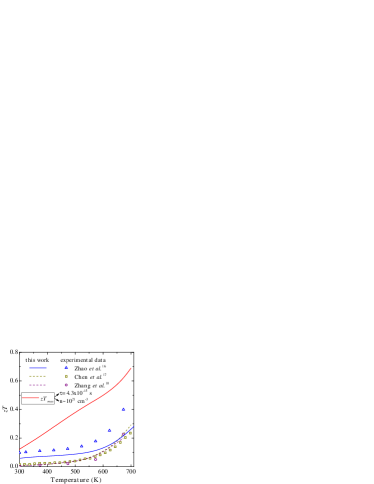
III.6 Figure of merit
The previous results indicate that the different parameters involved in the calculations of transport coefficients, namely relaxation time and chemical potential, must be chosen very carefully if one wants to make predictions from first principles. This is particularly true for the figure of merit , since it describes the thermoelectric performance of materials. Figure 9 shows the figure of merit for SnSe calculated from Eq. (1) and the and values reported in previous paragraphs. The reported values for SnSe are usually low, ranging between less than 0.1 and 0.4 for 700 K, approximately; this is the range of our results as well. For polycrystals, there is an excellent agreement between our results and those reported by Chen et al. Chen-14 and Zhang et al. Zhang-15 For single crystals, on the contrary, the agreement between our results and those by Zhao et al. Zhao-14 is far to be satisfactory. In our opinion, this may be caused by the abnormally low lattice thermal conductivity found by the latter authors, which is about 50 % lower than those calculated by us and other researchers (cf. Fig. 8).
In the context of thermoelectric performance, the question arises as to how to maximize the figure of merit . This is a difficult task in principle, since a correct balance between and , for which the carrier concentration plays a crucial role, is required. To evaluate the “ideal” carrier concentration (that is, the carrier concentration yielding the maximum ) is complex as well. Fortunately, the versatility of the first principles calculations allows us to estimate the carrier concentration for which is maximum. Figure 10 plots as a function of the chemical potential (or, alternatively, the carrier concentration) at 300 K. To point out the strong effect of on three different relaxation times, those estimated at 300 K for each sample used as reference (cf. Fig. 6), have been used to plot the data; for comparison, we include three experimental values at 300 K. Zhao-14 ; Chen-14 ; Zhang-15 According to this plot, reaches a maximum at the “ideal” carrier concentration, which depends strongly on the relaxation time. For instance, for s we get , and for s it is , approximately.
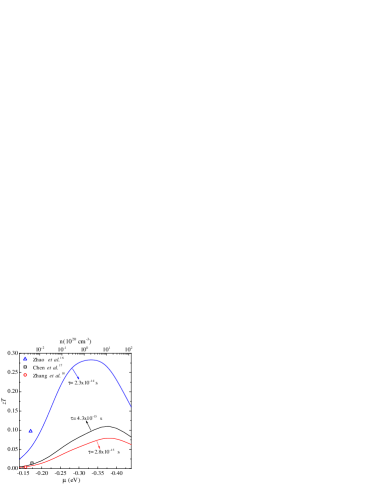
The optimal values in Fig. 10 indicate that the carrier concentrations experimentally measured are much lower than the “ideal” ones predicted by calculations. Indeed, experimental carrier concentrations range between 1017 and 1018 cm-3 at 300 K (see Supplement, Fig. S2), whereas calculations predict it to be around 1021 cm-3 for polycrystals ( s) and around 1020 cm-3 for single crystals ( s). In other words, our results suggest that significantly higher could be achieved at carrier concentrations higher than those commonly found in experiments, at least within the 350-650 K temperature range. An estimation of the maximum appears in Fig. 9 (solid red line) as a function of temperature. For this plot, we chose a variable set to yield cm-3 at each temperature, and s, values estimated from data at 300 K by Chen et al. Chen-14 This finding may serve as a starting point for experimentalists seeking more efficient thermoelectric materials and opens two different ways for future research. One of them points to increase the relaxation times by handling the scattering mechanisms for charge carriers, whereas the second points to doping schemes able to increase the carrier concentrations towards values closer to the “ideal” ones.
IV Conclusions
The main conclusions of this work may be summarized as follows:
-
1.
The use of van der Waals dispersive corrections at DFT level leads to structural parameters that compare better with experimental data than those for uncorrected DFT. This is particularly important for the layer separation, which affects the physical behaviour.
-
2.
The band structure allows to understand the anisotropic behavior of SnSe, since marked differences are found in the bands curvatures along the cell axis with respect to axes and .
-
3.
As for the thermoelectric properties, we show that the choice of the chemical potential and of the relaxation time affects critically the results. In polycrystals, the electrical conductivity may be properly described within the RTA with a constant relaxation time. On the contrary, an explicit temperature dependence of the relaxation time must be taken into account for single crystals. Incidentally, the grain boundaries are likely to greatly disperse the charge carriers, which would justify the little dependence of the relaxation time with the temperature in polycrystals.
-
4.
The thermal conductivity seems to be ruled by the lattice conductivity, at least at temperatures below about 550 K. At higher temperatures, the agreement between experiments and calculations improves if the carrier thermal conductivity is explicitly included. This change of trend at 550 K is related to bipolar conduction effects, which become relevant above that temperature.
-
5.
A temperature-dependent relaxation time allows describe accurately the figure of merit of SnSe as well. For each relaxation time, it is found to exhibit a maximum that depends on the carrier concentration. In any case, carrier concentrations in the range 10 cm-3 are likely to yield higher figures of merit than those currently achieved. This suggests that the relaxation time could be tailored by handling the proper dispersion mechanism for charge carriers, as well as using doping schemes yielding higher carrier concentrations
Acknowledgements.
We gratefully acknowledge support from the Brazilian agencies CNPq, CAPES, the Center for Computational Engineering and Science-Fapesp/Cepid #2013/08293-7 and FAPESP under Grant #2013/14065-7. Support from the Junta of Extremadura, Spain, through Grant No. GR15105 is acknowledged as well. The calculations were performed at CCJDR-IFGWUNICAMP and at CENAPAD-SP in Brazil and at the University of Extremadura (Badajoz) in Spain.References
- (1) T. C. Harman, P. J. Taylor, M. P. Walsh, B. E. LaForge, Science, 297, 2229-2232 (2003).
- (2) G. J. Snyder, E. S. Toberer, Nat. Mater., 7, 105-114 (2008).
- (3) A. Qurashi, Metal chalcogenide nanostructures for renewable energy applications. John Wiley & Sons, 2014.
- (4) T. O. Poehler, Innovative Thermoelectric Materials: Polymer, Nanostructure and Composite Thermoelectrics. World Scientific, 2016.
- (5) C. J. Vineis, A. Shakouri, A. Majumdar, M. G. Kanatzidis, Adv. Mater., 22, 3970-3980 (2010).
- (6) J. P. Heremans, V. Jovovic, E. S. Toberer, A. Saramat, K. Kurosaki, A. Charoenphakdee, S. Yamanaka, G. J. Snyder, Science, 321, 554-557 (2008).
- (7) K. Biswas, J. He, I. D. Blum, C.-I. Wu, T. P. Hogan, D. N. Seidman, V. P. Dravid, M. G. Kanatzidis, Nature, 489, 414-418 (2012).
- (8) Y. Pei, X. Shi, A. LaLonde, H. Wang, L. Chen, G. J. Snyder, Nature, 473, 66-69 (2011).
- (9) X. Shi, J. Yang, S. Bai, J. Yang, H. Wang, M. Chi, J. R. Salvador, W. Zhang, L. Chen, W. Wong-Ng, Adv. Funct. Mater., 20, 755-763 (2010).
- (10) X. Shi, J. Yang, J. R. Salvador, M. Chi, J. Y. Cho, H. Wang, S. Bai, J. Yang, W. Zhang, L. Chen, J. Am. Chem. Soc., 133, 7837-7846 (2011).
- (11) G. Joshi, H. Lee, Y. Lan, X. Wang, G. Zhu, D. Wang, R. W. Gould, D. C. Cuff, M. Y. Tang, M. S. Dresselhaus, G. Chen, Z. Ren, Nano Lett., 8, 4670-4675 (2008).
- (12) X. W. Wang, H. Lee, Y. C. Lan, G. H. Zhu, G. Joshi, D. Z. Wang, J. Yang, A. J. Muto, M. Y. Tang, J. Klatsky, S. Song, M. S. Dresselhaus, G. Chen, Z. F. Ren, App. Phys. Lett., 93, 193121 (2008).
- (13) R. Liu, L. Xi, H. Liu, X. Shi, W. Zhang, L. Chen, Chem. Commun., 48, 3818-3820 (2012).
- (14) H. Liu, X. Shi, F. Xu, L. Zhang, W. Zhang, L. Chen, Q. Li, C. Uher, T. Day, G. J. Snyder, Nat. Mater., 11, 422-425 (2012)
- (15) G. Tan, L.-D. Zhao, F. Shi, J. W. Doak, S.-H. Lo, H. Sun, C. Wolverton, V. P. Dravid, C. Uher, M. G. Kanatzidis, J. Am. Chem. Soc., 136, 7006-7017 (2014)
- (16) L.-D. Zhao, V. P. Dravid, M. G. Kanatzidis, Nature, 508, 373-377 (2014).
- (17) C.-L. Chen, H. Wang, Y.-Y. Chen, T. Day, G. J. Snyder, J. Mater. Chem. A, 2, 11171-11176 (2014)
- (18) Q. Zhang, E. K. Chere, J. Sun, F. Cao, K. Dahal, S. Chen, G. Chen, Z. Ren, Adv. Energy Mater., 5, 1500360 (2015)
- (19) S. Sassi, C. Candolfi, J.-B. Vaney, V. Ohorodniichuk, P. Masschelein, A. Dausher, B. Lenoir, Appl. Phys. Lett., 104, 212105 (2014)
- (20) N. F. Hinsche, B. Y. Yavorsky, M. Gradhand, M. Czerner, M. Winkler, J. König, H. Böttner, I. Martig, P. Zahn, Phys. Rev. B, 86, 085323 (2012)
- (21) B. G. Levi, Phys. Today, 67, 14 (2014)
- (22) J. P. Heremans, Nature, 508, 327-328 (2014)
- (23) J. Carrete, N. Mingo, S. Curtarolo, Appl. Phys. Lett., 105, 101907 (2014)
- (24) J. Yang, G. Zhang, G. Yang, C. Wang, Y. X. Wang, J. Alloys Compd., 644, 615-620 (2015)
- (25) F. Q. Wang, S. Zhang, J. Yu, Q. Wang, Nanoscale, 7, 15962-15970 (2015)
- (26) R. Guo, X. Wang, Y. Kuang, B. Huang, Phys. Rev. B, 92, 115202, (2015)
- (27) G. Din, G. Gao, K. Yao, Sci. Rep. 5, 9567 (2015)
- (28) L. C. Gomes, A. Carvalho, Phys. Rev. B, 92, 085406 (2015)
- (29) M. Gharsallah, F. Serrano-Sánchez, N. M. Nemes, F. J. Mompeán, M. T. Fernández-Díaz, F. Elhalouani, J. A. Alonso, Sci. Rep., 6, 26774 (2016)
- (30) L.-C. Zhang, G. Qin, W.-Z. Fang, H.-J. Cui, Q.-R. Zheng, Q.-B. Yan, G. Su, Sci. Rep., 6, 19830 (2016)
- (31) J. Yang, L. Xi, W. Qiu, L. Wu, X. Shi, L. Chen, J. Yang, W. Zhang, C. Uher, D. J. Singh, Npj Comput. Mater., 2, 15015 (2016)
- (32) P. Hohenberg, W. Kohn, Phys. Rev., 136, B864-B871 (1964)
- (33) W. Kohn, L. J. Sham, Phys. Rev., 140, A1133-A1138 (1965)
- (34) P. E. Blöchl, Phys. Rev. B: Condensed Matter, 50, 17953-17979 (1994)
- (35) G. Kresse, D. Joubert, Phys. Rev. B: Condensed Matter, 59, 1758-1775 (1999)
- (36) G. Kresse, J. Furthmüller, Phys. Rev. B: Condensed Matter, 54, 11169-11186 (1996)
- (37) J. P. Perdew, K. Burke, M. Ernzerhof, Phys. Rev. Lett., 77, 3865-3868 (1996)
- (38) H. J. Monkhorst, J. D. Pack, Physical Review B: Condensed Matter, 1976. 13(12): p. 5188-5192. Phys. Rev. B: Condensed Matter, 13, 5188-5192 (1976)
- (39) S. Grimme, J. Antony, S. Ehrlich, J. Krieg, J. Chem. Phys., 132, 154104 (2010)
- (40) T. J. Scheidemantel, C. Ambrosch-Draxl, T. Tronhauser, J. V Badding, J. O. Sofo, Phys. Rev. B, 68, 125210 (200)
- (41) G. K. H. Madsen, J. Am. Chem. Soc., 128, 12140-12146 (2006)
- (42) G. Pizzi, D. Volja, B. Kozinsky, M. Fornari, N. Marzari, Comput. Phys. Commun., 185 422-429 (2014)
- (43) A. A. Mostofi, J. R. Yates, Y.-S. Lee, I. Souza, D. Vanderbilt, N. Marzari, Comput. Phys. Commun., 178, 685-699 (2008)
- (44) A. Togo, F. Oba, I. Tanaka, Phys. Rev. B: Condensed Matter, 78, 134106 (2008)
- (45) A. Togo, I. Tanaka, Scripta Mater., 108, 1-5 (2015)
- (46) W. Li, J. Carrete, N. A. Katcho, N. Mingo, Comput. Phys. Commun., 185, 1747-1758 (2014)
- (47) G. Shi, E. Kioupakis, J. Appl. Phys., 117, 065103 (2015)
- (48) T. Chattopadhyay, J. Pannetier, H. G. von Schnering, J. Phys. Chem. Solids, 49, 879-885 (1986)
- (49) Y. Li, X. Shi, D. Ren, J. Chen, L. Chen, Energies, 8, 6275-6285 (2015)
- (50) M. J. Peters, L. E. McNeil, Phys. Rev. B, 41, 5893-5897 (1990)
- (51) K. Peng, X. Lu, H. Zhan, S. Hui, X. Tang, G. Wang, J. Dai, C. Uher, G. Wang, X. Zhou, Energy Environ. Sci., 9, 454-460 (2016).
- (52) J. P. Singh, J. Mater. Sci.: Materials in Electronics, 2, 105-108 (1991)
- (53) J. G. Yu, A. S. Yue, O. M. Stafsudd Jr., J. Cryst. Growth, 52, 248-252 (1981)
- (54) W. Albers, C. Haas, H. Ober, G. R. Schodder, J. D. Wasscher, J. Phys. Chem. Solids, 23, 215-220 (1962).
- (55) K. Kuroki, R. Arita, J. Phys. Soc. Jpn., 76, 083707 (2007)
- (56) X. Guan, P. Lu, L. Wu, L. Han, G. Liu, Y. Song, S. Wang, J. Alloys Compd., 643, 116-120 (2015).
- (57) K. Biswas, J. He, Q. Zhang, G. Wang, C. Uher, V. P. Dravid, M. G. Kanatzidis, Nat. Chem., 3, 160-166 (2011).
- (58) C. Jacoboni, Theory of Electron Transport in Semiconductors: A Pathway from Elementary Physics to Nonequilibrium Green Functions. Springer Science & Business Media, 2010.
- (59) T.-R. Wei, H. Wang, Z. M. Gibbs, C.-F. Wu, G. J. Snyder, J.-F. Li, J. Mater. Chem. A, 2, 13527-13533 (2014).
- (60) H. Wang, Y. Pei, A. D. LaLonde, G. J. Snyder, P. Natl. Acad. Sci. USA, 109, 9705-9709 (2012).
- (61) H. Wang, Z. M. Gibbs, Y. Takagiwa, G. J. Snyder, Energy Environ. Sci., 7, 804-811 (2014).
- (62) C. M. Jaworski, V. Kulbachinskii, J. P. Heremans, Phys. Rev. B, 80, 233201 (2009).
- (63) S.-L. Li, K. Tsukagoshi, E. Orgiu, P. Samori, Chem. Soc. Rev., 45, 118-151 (2016).
- (64) I. I. Ravich, Semiconducting lead chalcogenides. Springer Science & Business Media, 2013.
- (65) J. Androulakis, D.-Y. Chung, X. Su, L. Zhang, C. Uher, T. C. Hasapis, E. Hatzikraniotis, K. M. Paraskevopoulos, M. G. Kanatzidis, Phys. Rev. B, 84, 155207 (2011).
- (66) M. Zhou, Z. M. Gibbs, H. Wang, Y. Han, C. Xin, L. Li, G. J. Snyder, Phys. Chem. Chem. Phys., 16, 20741-20748 (2014).
- (67) Y. Pei, A. D. LaLonde, H. Wang, G. J. Snyder, Energy Environ. Sci., 5, 7963-7969 (2012).
- (68) K. Kutorasinski, B. Wiendlocha, S. Kaprzyk, J. Tobola, Phys. Rev. B, 91, 205201 (2015).
- (69) B. Poudel, Q. Hao, Y. Ma, Y. Lan, A. Minnich, B. Yu, X. Yan, D. Wang, A. Muto, D. Vashaee, Science, 320, 634-638 (2008)
- (70) H. Dong, B. Wen, R. Melnik, Sci. Rep., 4, 7037 (2014)