ABSTRACT
After the discovery of a Higgs boson, the measurements of its properties are at the forefront of research. The determination of the associated production of a Higgs boson and a pair of top quarks is of particular importance as the ttH Yukawa coupling is large and thus an excellent probe for physics beyond the Standard Model (SM). For the complete LHC Run-1 dataset, the combined ATLAS and CMS signal strength (defined as the ratio of measured cross-section to the SM prediction) was , which indicated a mild excess with respect to the SM expectation. The results of the ttH search with multilepton and diphoton signatures are presented for the first LHC Run-2 data (13 fb-1 at 13 TeV) recorded by the ATLAS experiment: for the multilepton analyses and for the diphoton analyses. Both measurements are in agreement with the SM expectation.
Contribution to the Annual Workshop: Higgs Coupling 2016,
Menlo Park, CA, USA, 9-12 November 2016
Searches for ttH (Multilepton+Diphoton) Production in ATLAS
1 Introduction
An important motivation of the top Yukawa coupling (ttH) research is the fact that at present it is the only quantity which can help us to get an idea about the scale of New Physics [1]. A fundamental prediction of the Brout-Englert-Higgs model is that the Yukawa coupling is proportional to the fermion mass . As , the ttH coupling is much stronger than the other couplings to lighter fermions.
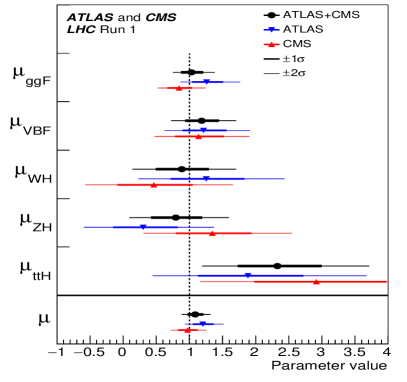
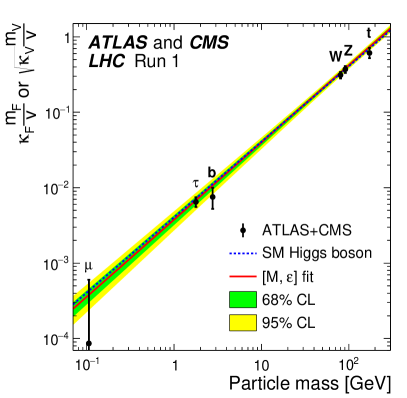
The ATLAS and CMS collaborations [2, 3] have extensive programmes to search for the ttH signal and measure the ttH coupling strength. The results of both collaborations using the data of LHC Run-1 were combined and gave as ratio of signal strengths . The measurement is above the SM expectation. The combined ttH signal strength is shown in Fig. 1 (from [4]) compared to other Higgs boson signal strength measurements. Figure 1 also shows the impressive confirmation within the uncertainties of the linearity between the Yukawa coupling and the fermion mass. As the top Yukawa coupling appears not only in the direct measurements, but also for example in the gluon-gluon-fusion process, the best fit of the top Yukawa coupling lies slightly below the diagonal line, indicating an overall smaller value than expected in the SM. Thus, there is some tension between the indirect (loop) ttH measurements and the direct (tree-level) ttH measurements.
Regarding the ATLAS ttH multilepton searches in LHC Run-1, there were five channels: one lepton with two hadronic taus, two same-charge leptons with no tau, two same-charge leptons plus one tau, three leptons and four leptons which are tau inclusive. In the initial Run-2 data analysis, there are only the later four channels.
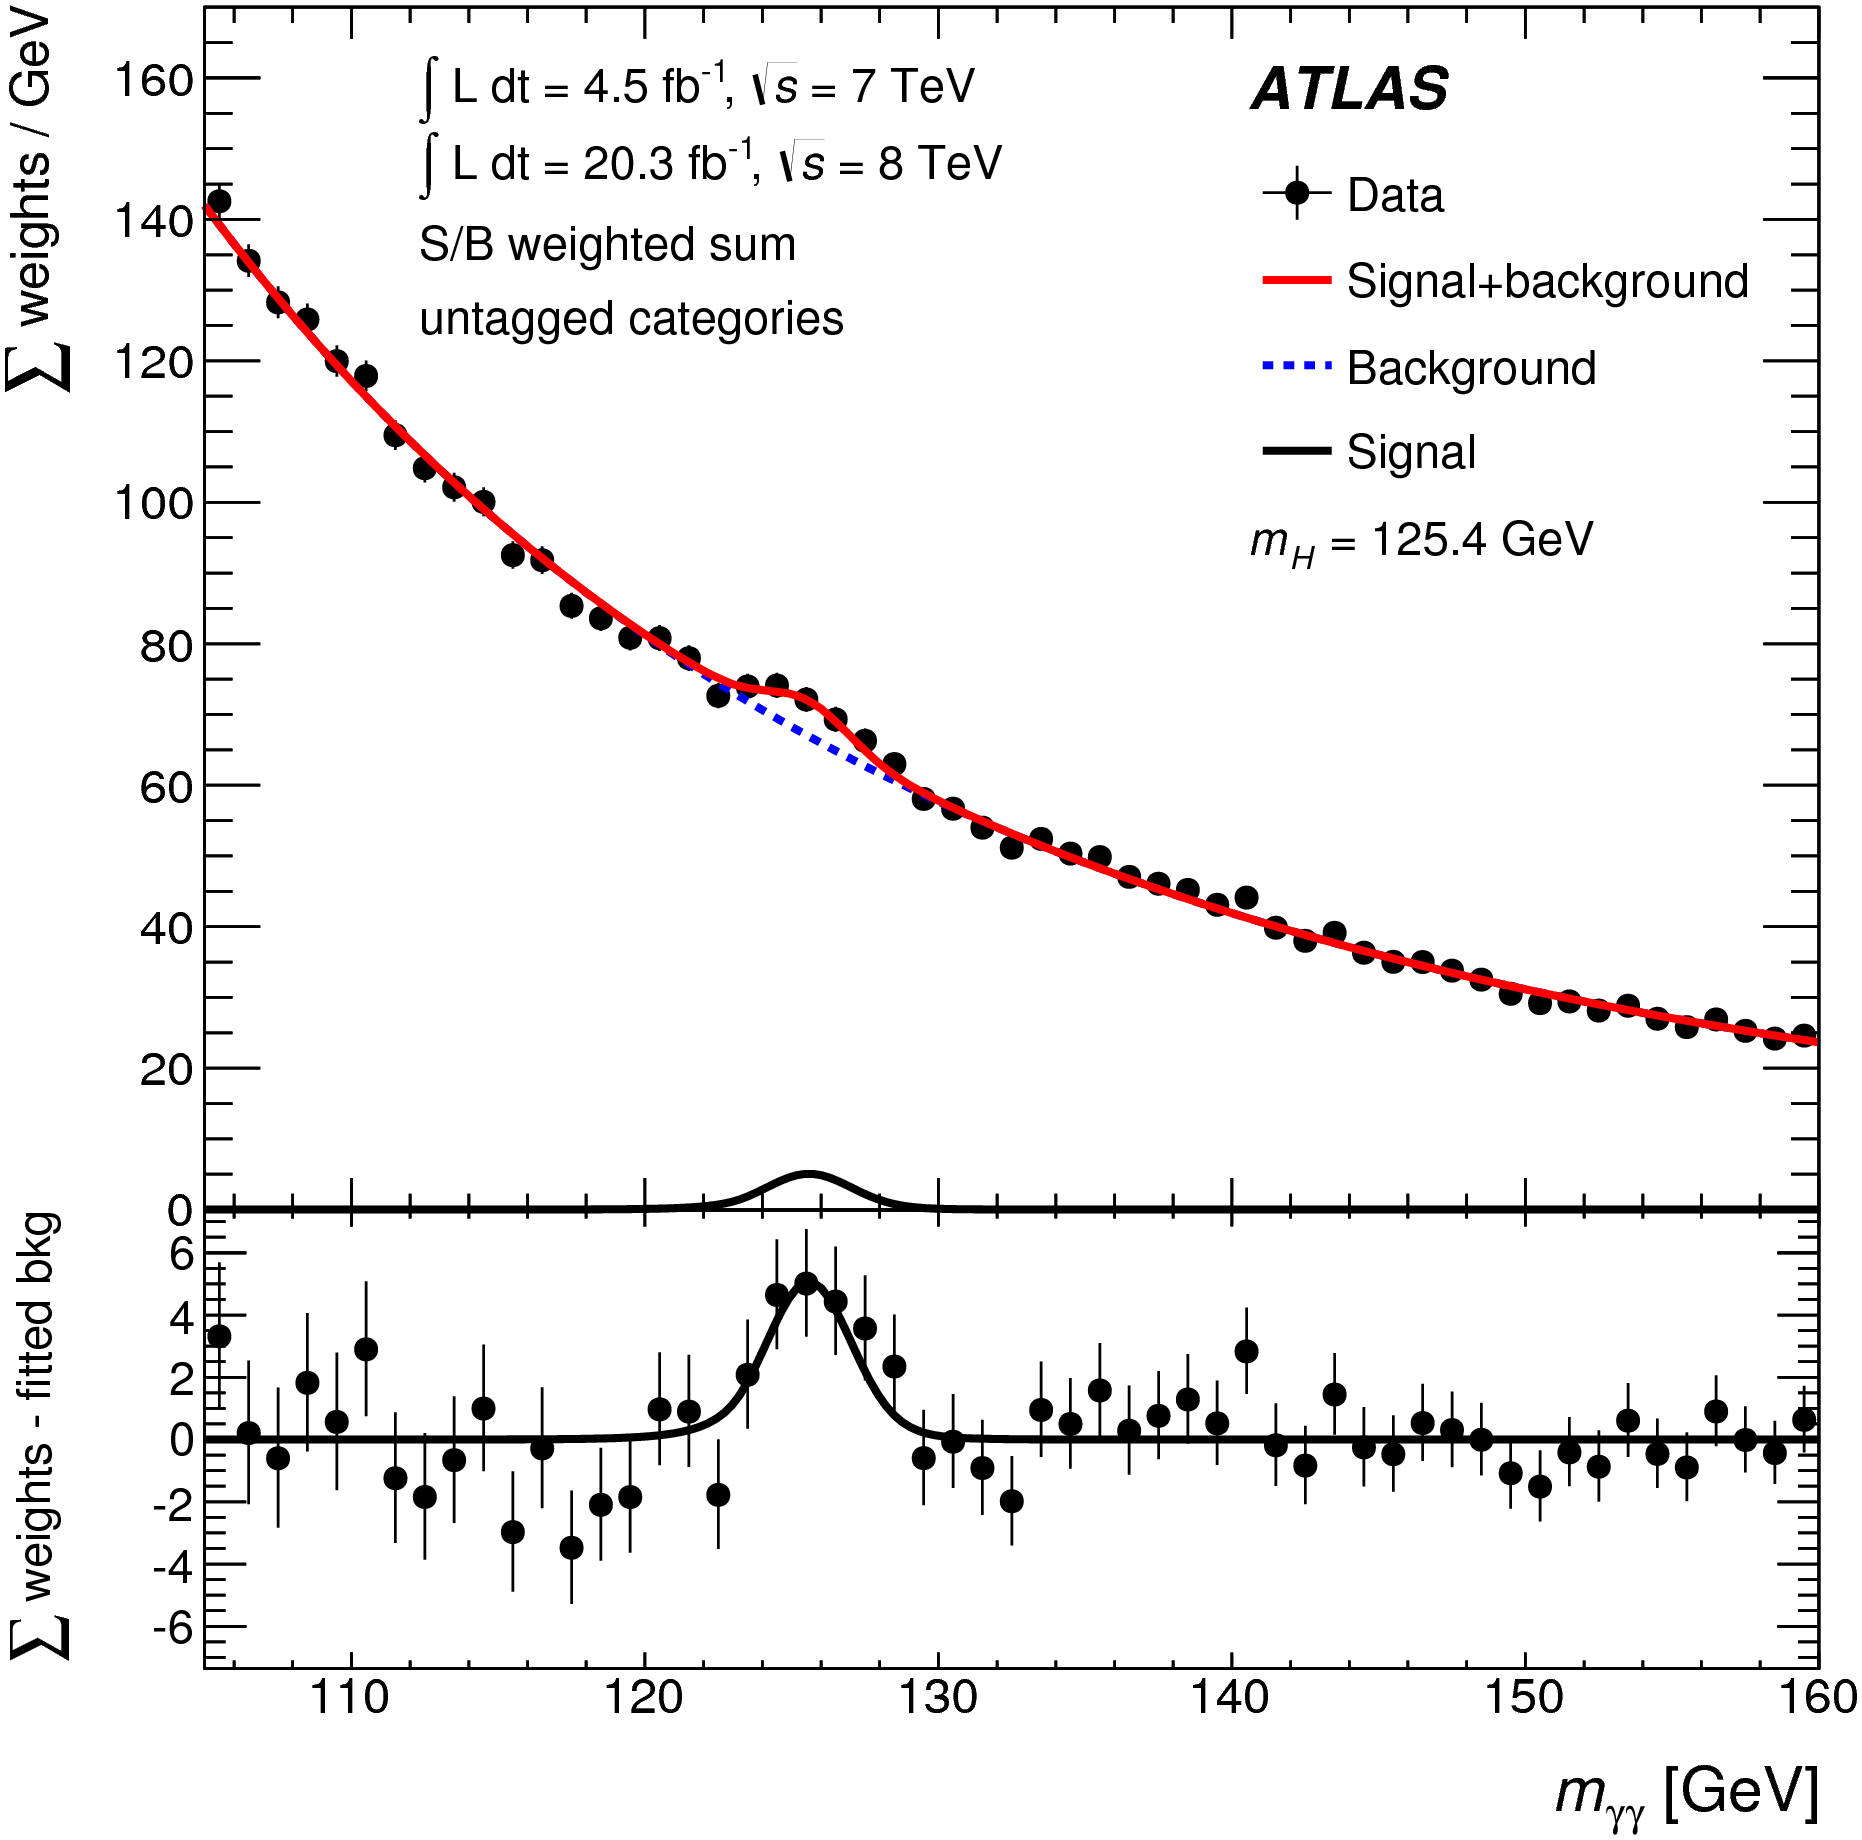
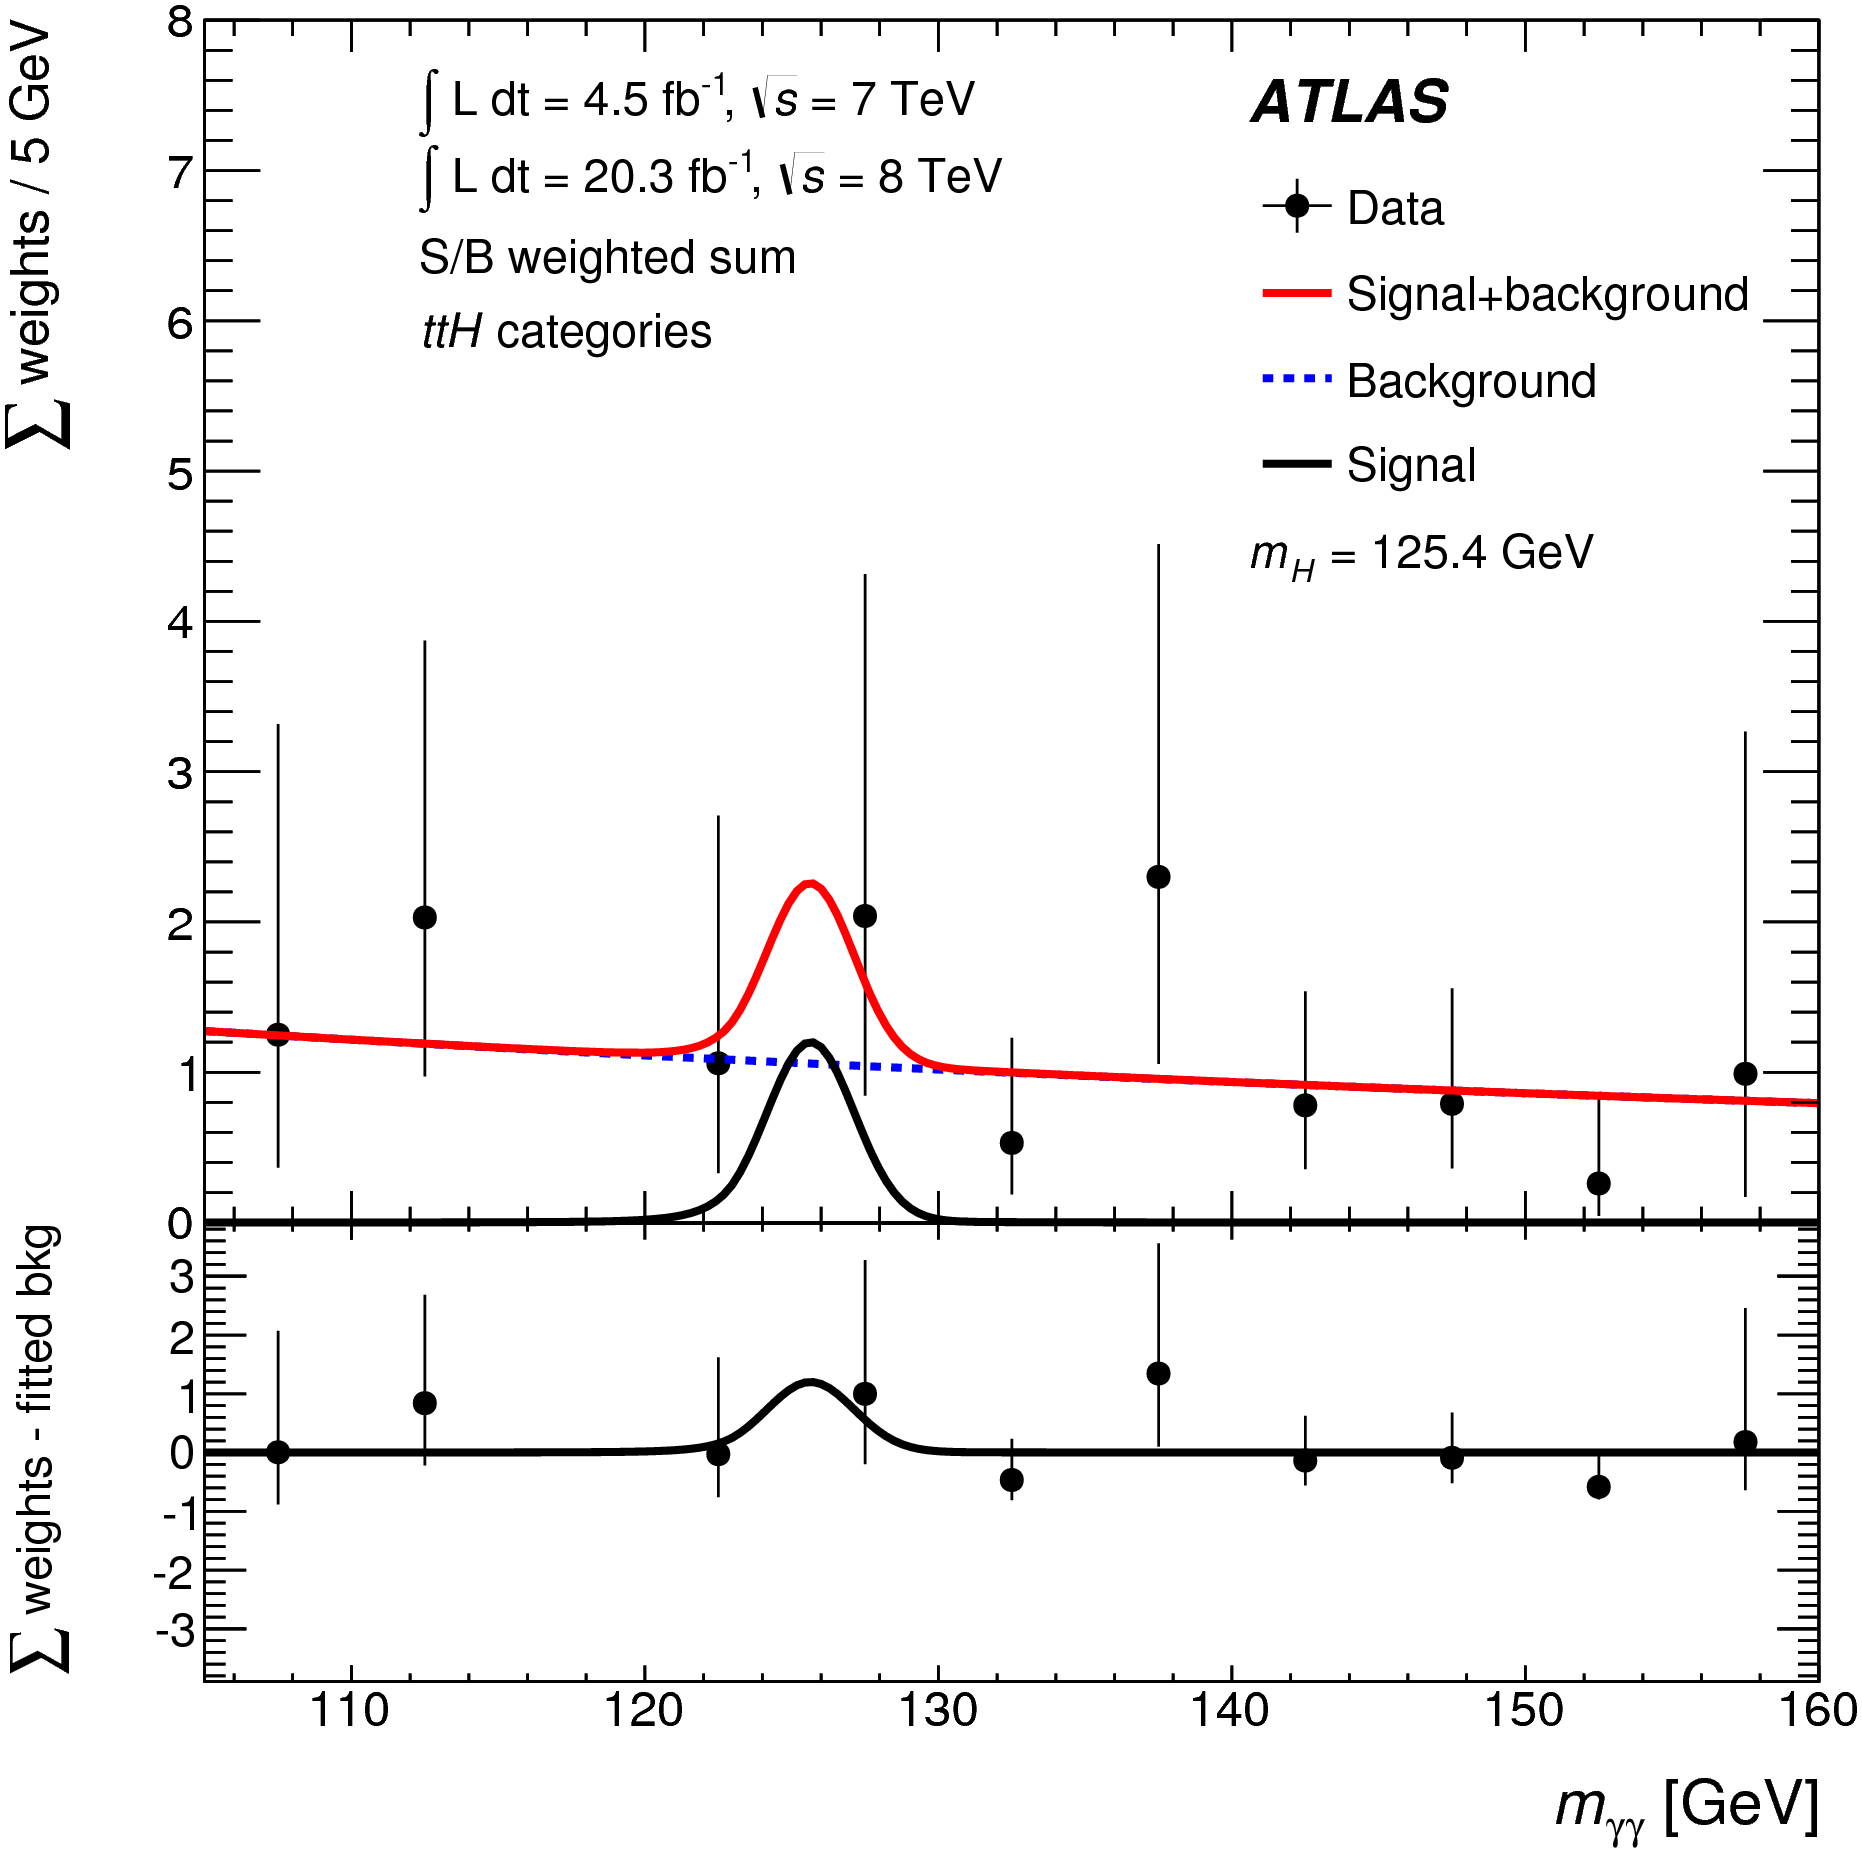
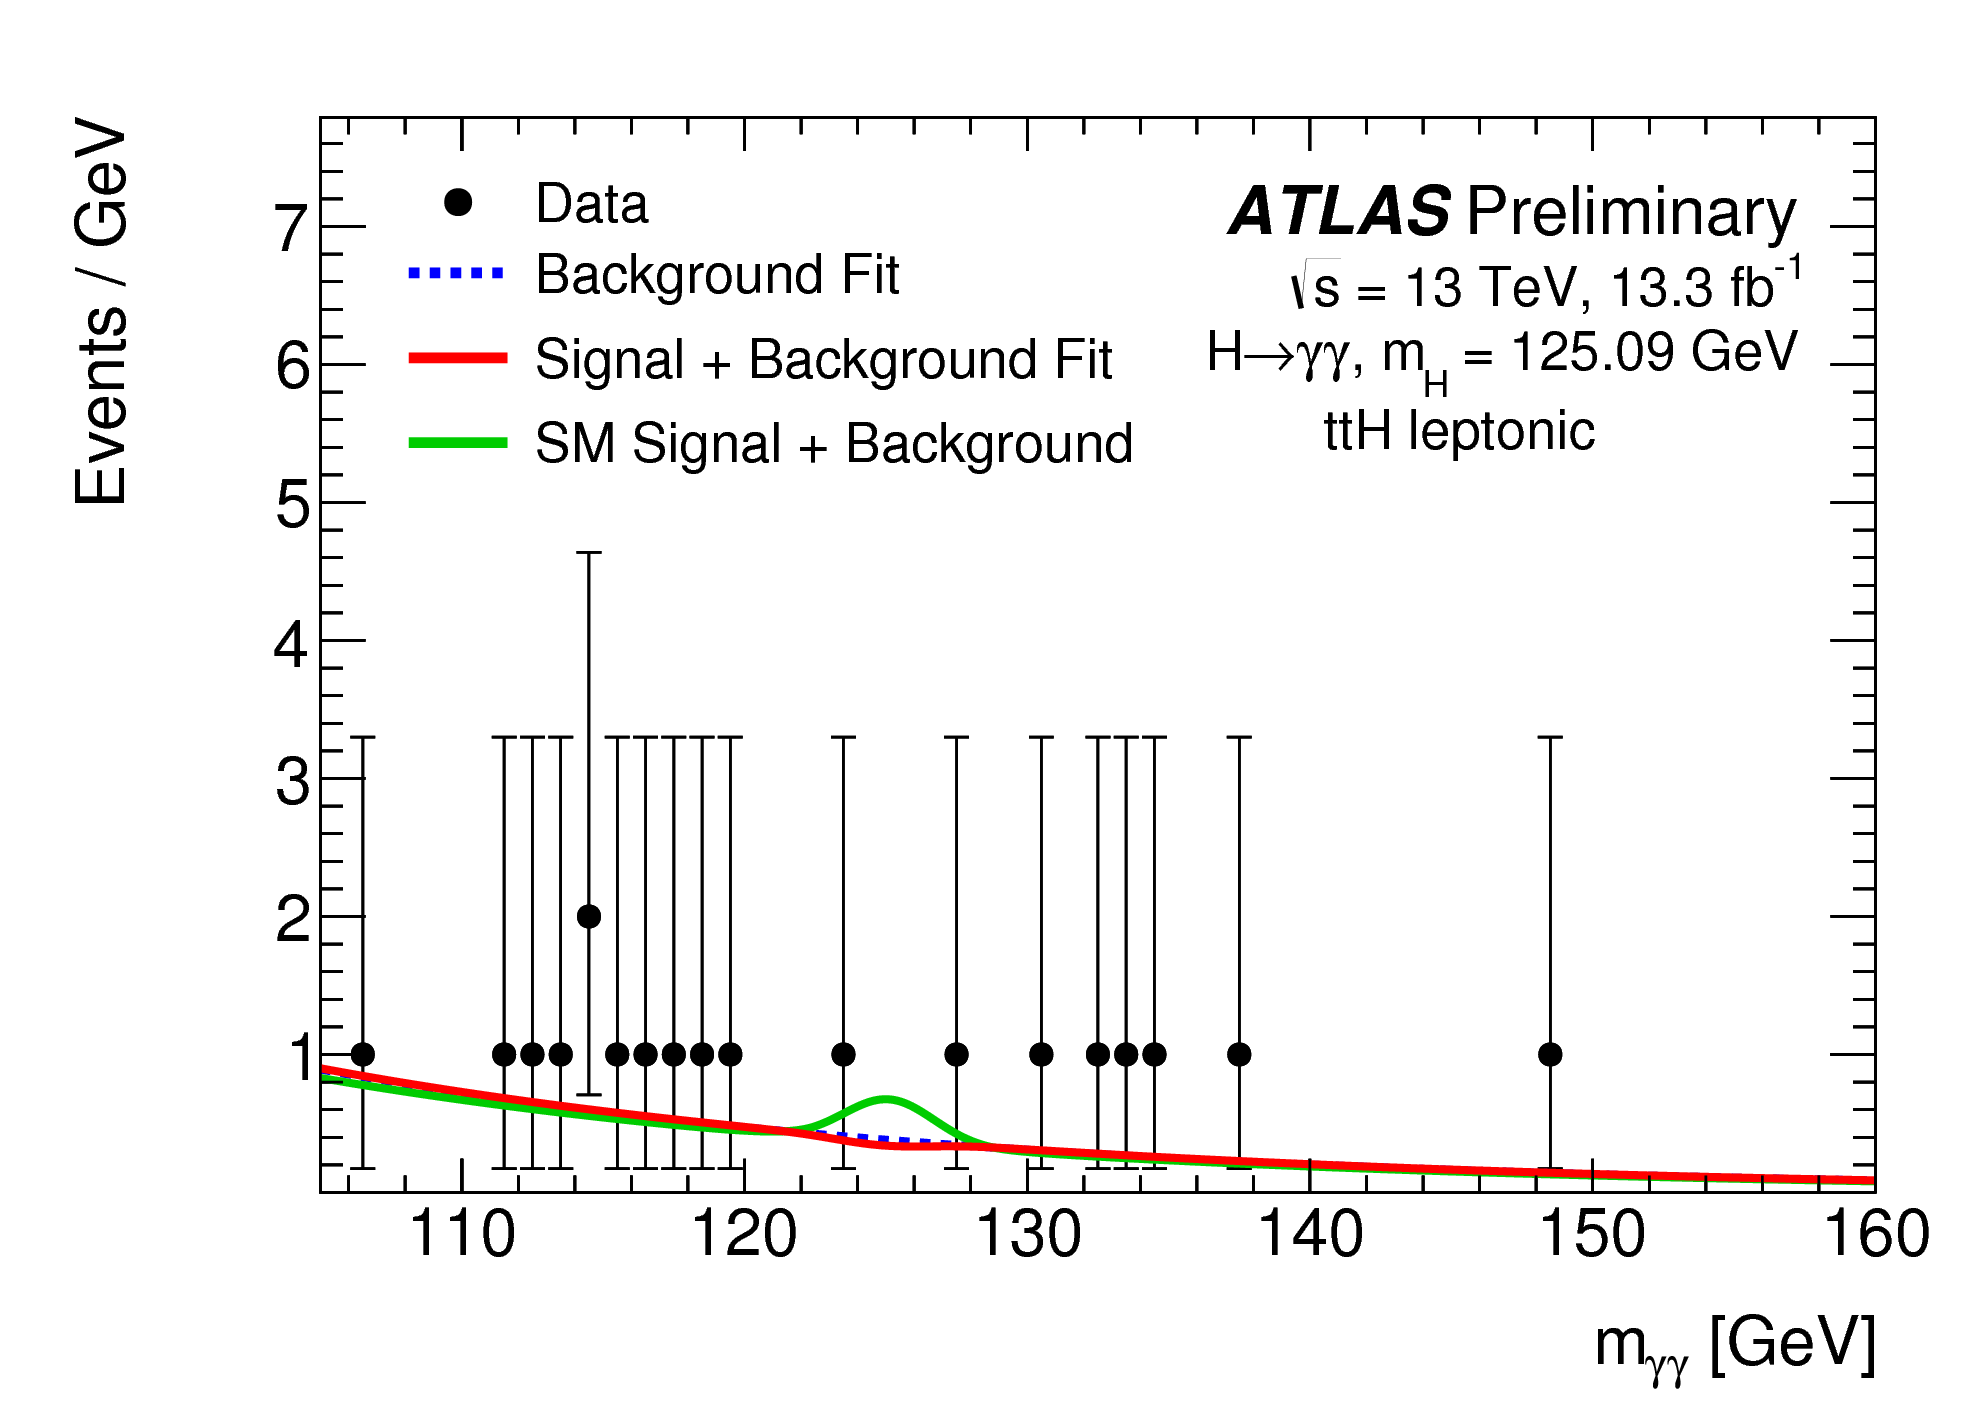
Regarding the ATLAS Higgs diphoton searches, the Run-1 results show a clear peak in the invariant mass spectrum for all Higgs boson production modes, while the ttH production mode sensitivity is limited by the small statistics, as shown in Fig. 2 (from [6]).
2 The SM ttH Production and Higgs Boson Decays
The ttH production cross-section, Higgs boson decay branching fractions and the top-antitop decay branching fractions are given in Fig. 3 (from [7]). The ttH production cross-section increased by about a factor four from LHC Run-1 (8 TeV) to Run-2 (13 TeV). A 125 GeV Higgs boson can decay into various pairs of particles. This defines the signatures in the detector, together with the top-antitop decays into alljets, lepton+jets and dileptons final states.
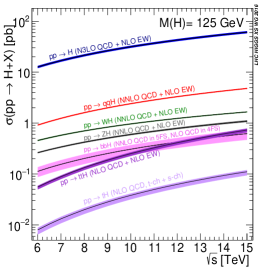
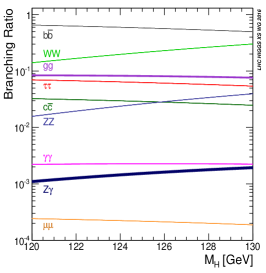
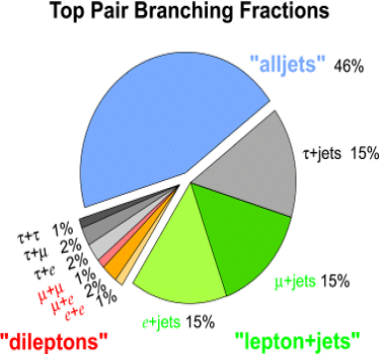
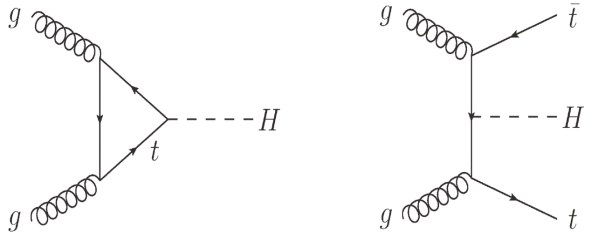
Figure 4 illustrates the Higgs boson production via a loop process involving the top Yukawa coupling, as well as the direct ttH production. Although the highest Higgs boson production rate is via a loop (), the tree-level direct measurements of are more sensitive to physics beyond the SM.
Some characteristics of the ttH analyses are given, ordered according to the Higgs boson decay modes:
-
•
produce multilepton events,
-
•
has a narrow bump in the diphoton invariant mass spectrum, and
-
•
has a large background rate.
3 LHC Luminosity
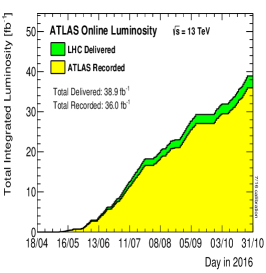
The measurements of the Higgs boson properties require high statistics datasets. The LHC performance was excellent during the first phase of Run-2 in delivering proton-proton collisions, and ATLAS recorded them with high efficiency. In 2015, 3.2 fb-1, and in 2016, 36.0 fb-1 data were recorded. The results presented here are based on the analysed data up to July 2016 corresponding to fb-1. Figure 4 (from [8]) shows the increase of integrated luminosity delivered to and recorded by the ATLAS experiment.
For a luminosity of 13.2 fb-1 and a ttH production cross-section of 507.1 fb [7]111computed at NLO in QCD and electroweak couplings. It has uncertainties of from QCD renormalization/factorization scale choice and from parton distribution function uncertainties (including uncertainties)., about 6700 ttH events were expected to be produced. The experimental challenge was to detect these events in the about background events with a production cross-section of mb [9], thus, finding one ttH event in about 154 billion background events.
4 ttH (Multilepton) Agreement in Validation Regions, and Signal and Background Compositions
In order to search for a small number of signal events, it is essential to understand the background reactions with precision. The background reactions were studied in dedicated validation regions which are orthogonal to the signal regions. The validation regions are close to the signal regions and demonstrate the good agreement between the observed and simulated ttZ, WZ+1bjet, and ttW events, as shown in Fig. 5 (from [10]), and listed in Table 1 (from [10]).
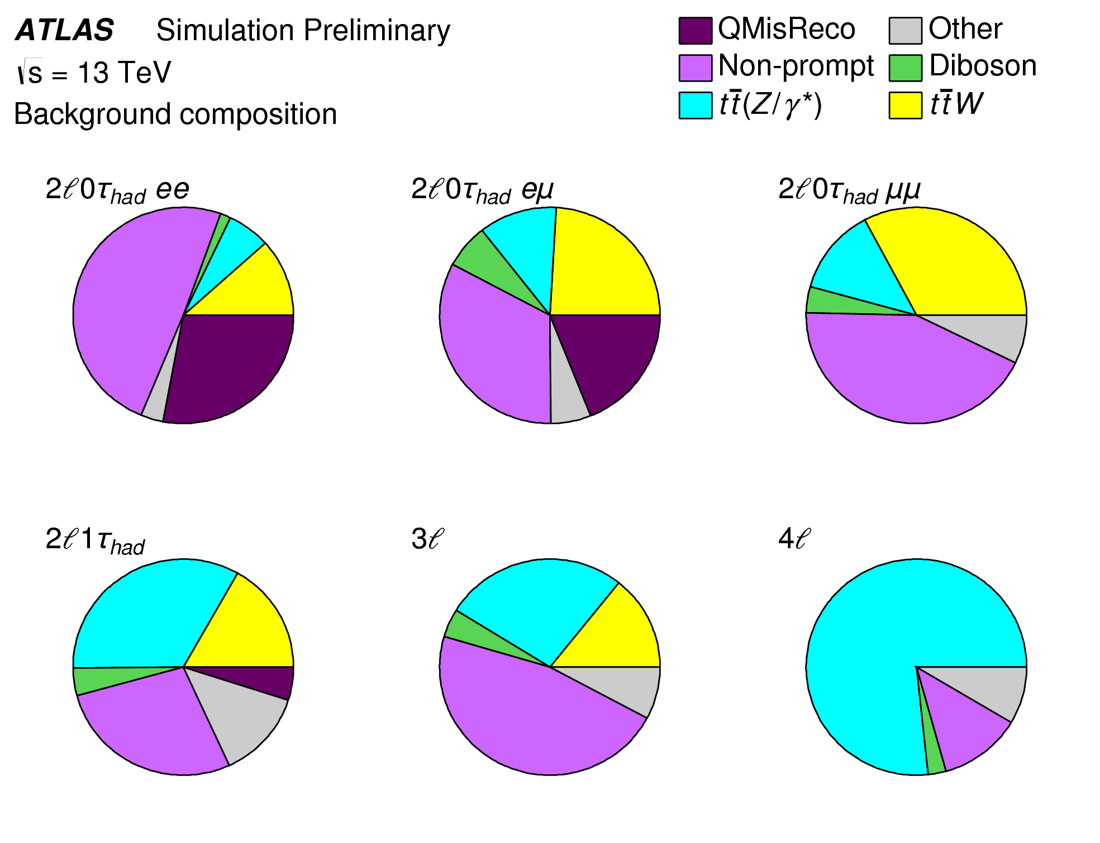
The signal compositions (Higgs boson decay modes) in the four multilepton channels are given in Table 2 (from [10]). For example, the simulations show that in the category, the decay is enriched with 51% contribution. The background compositions in six categories of the four cut-and-counting analyses are illustrated in Fig. 6 (from [10]).
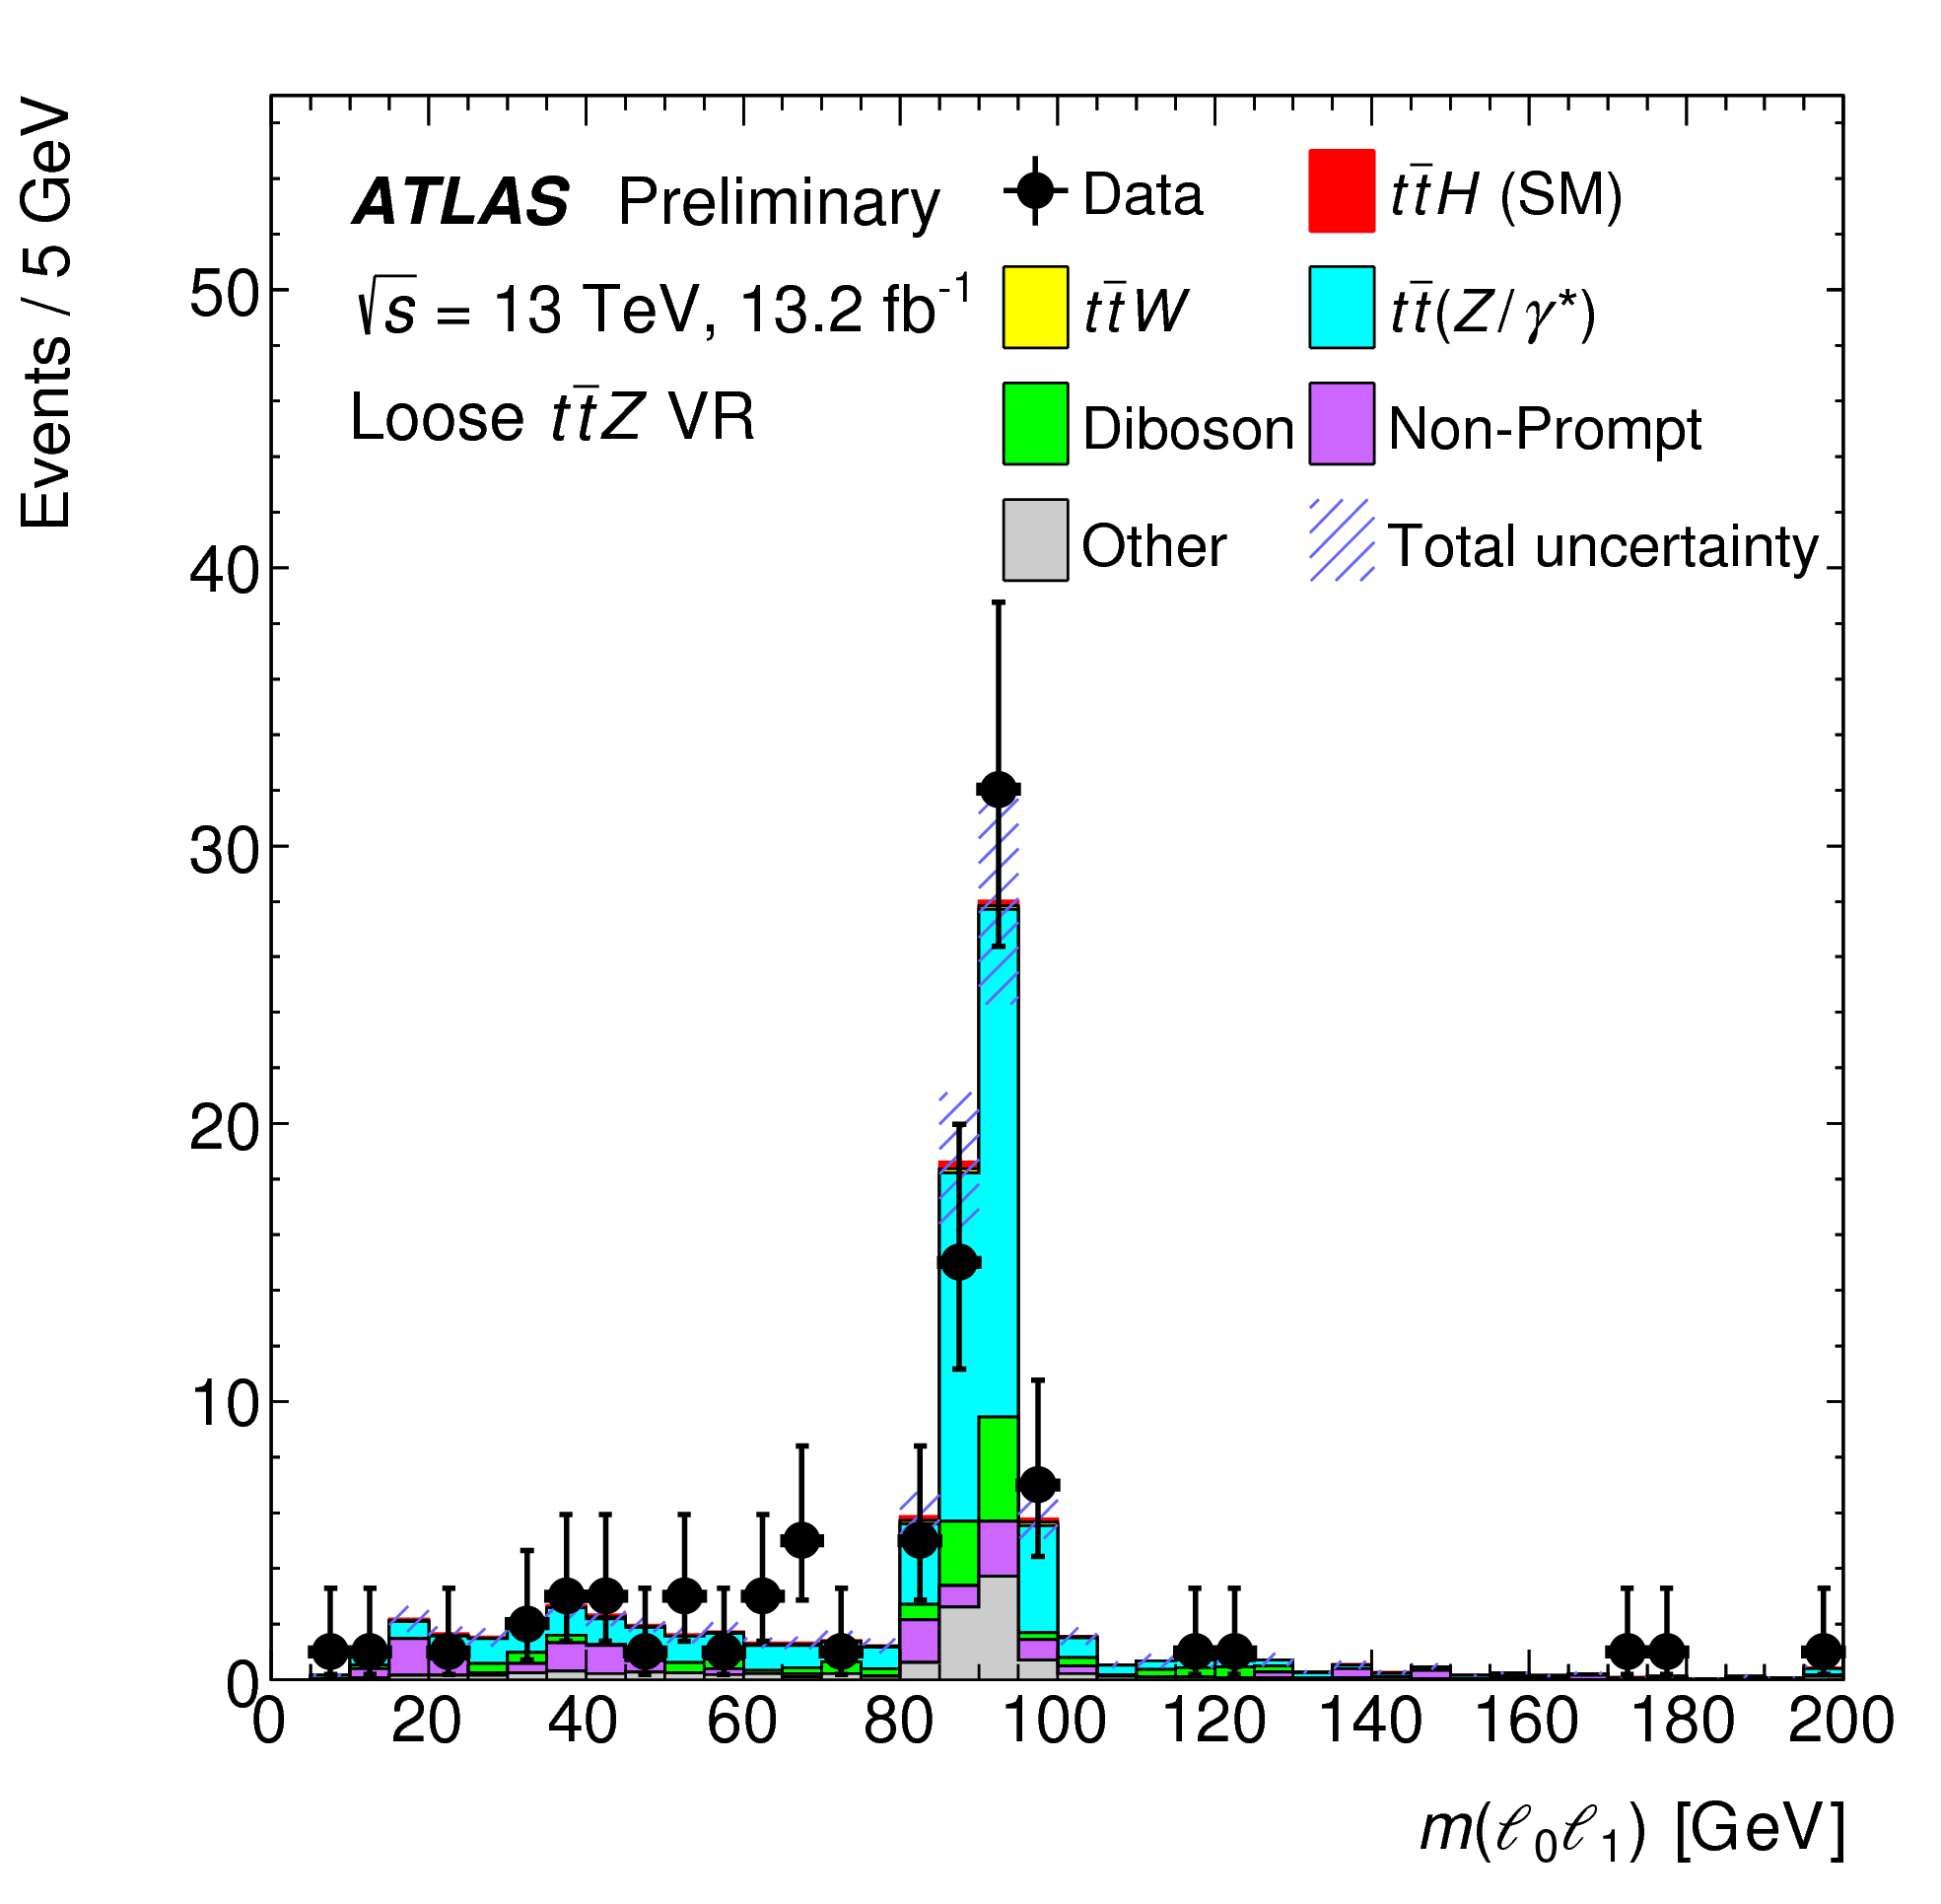
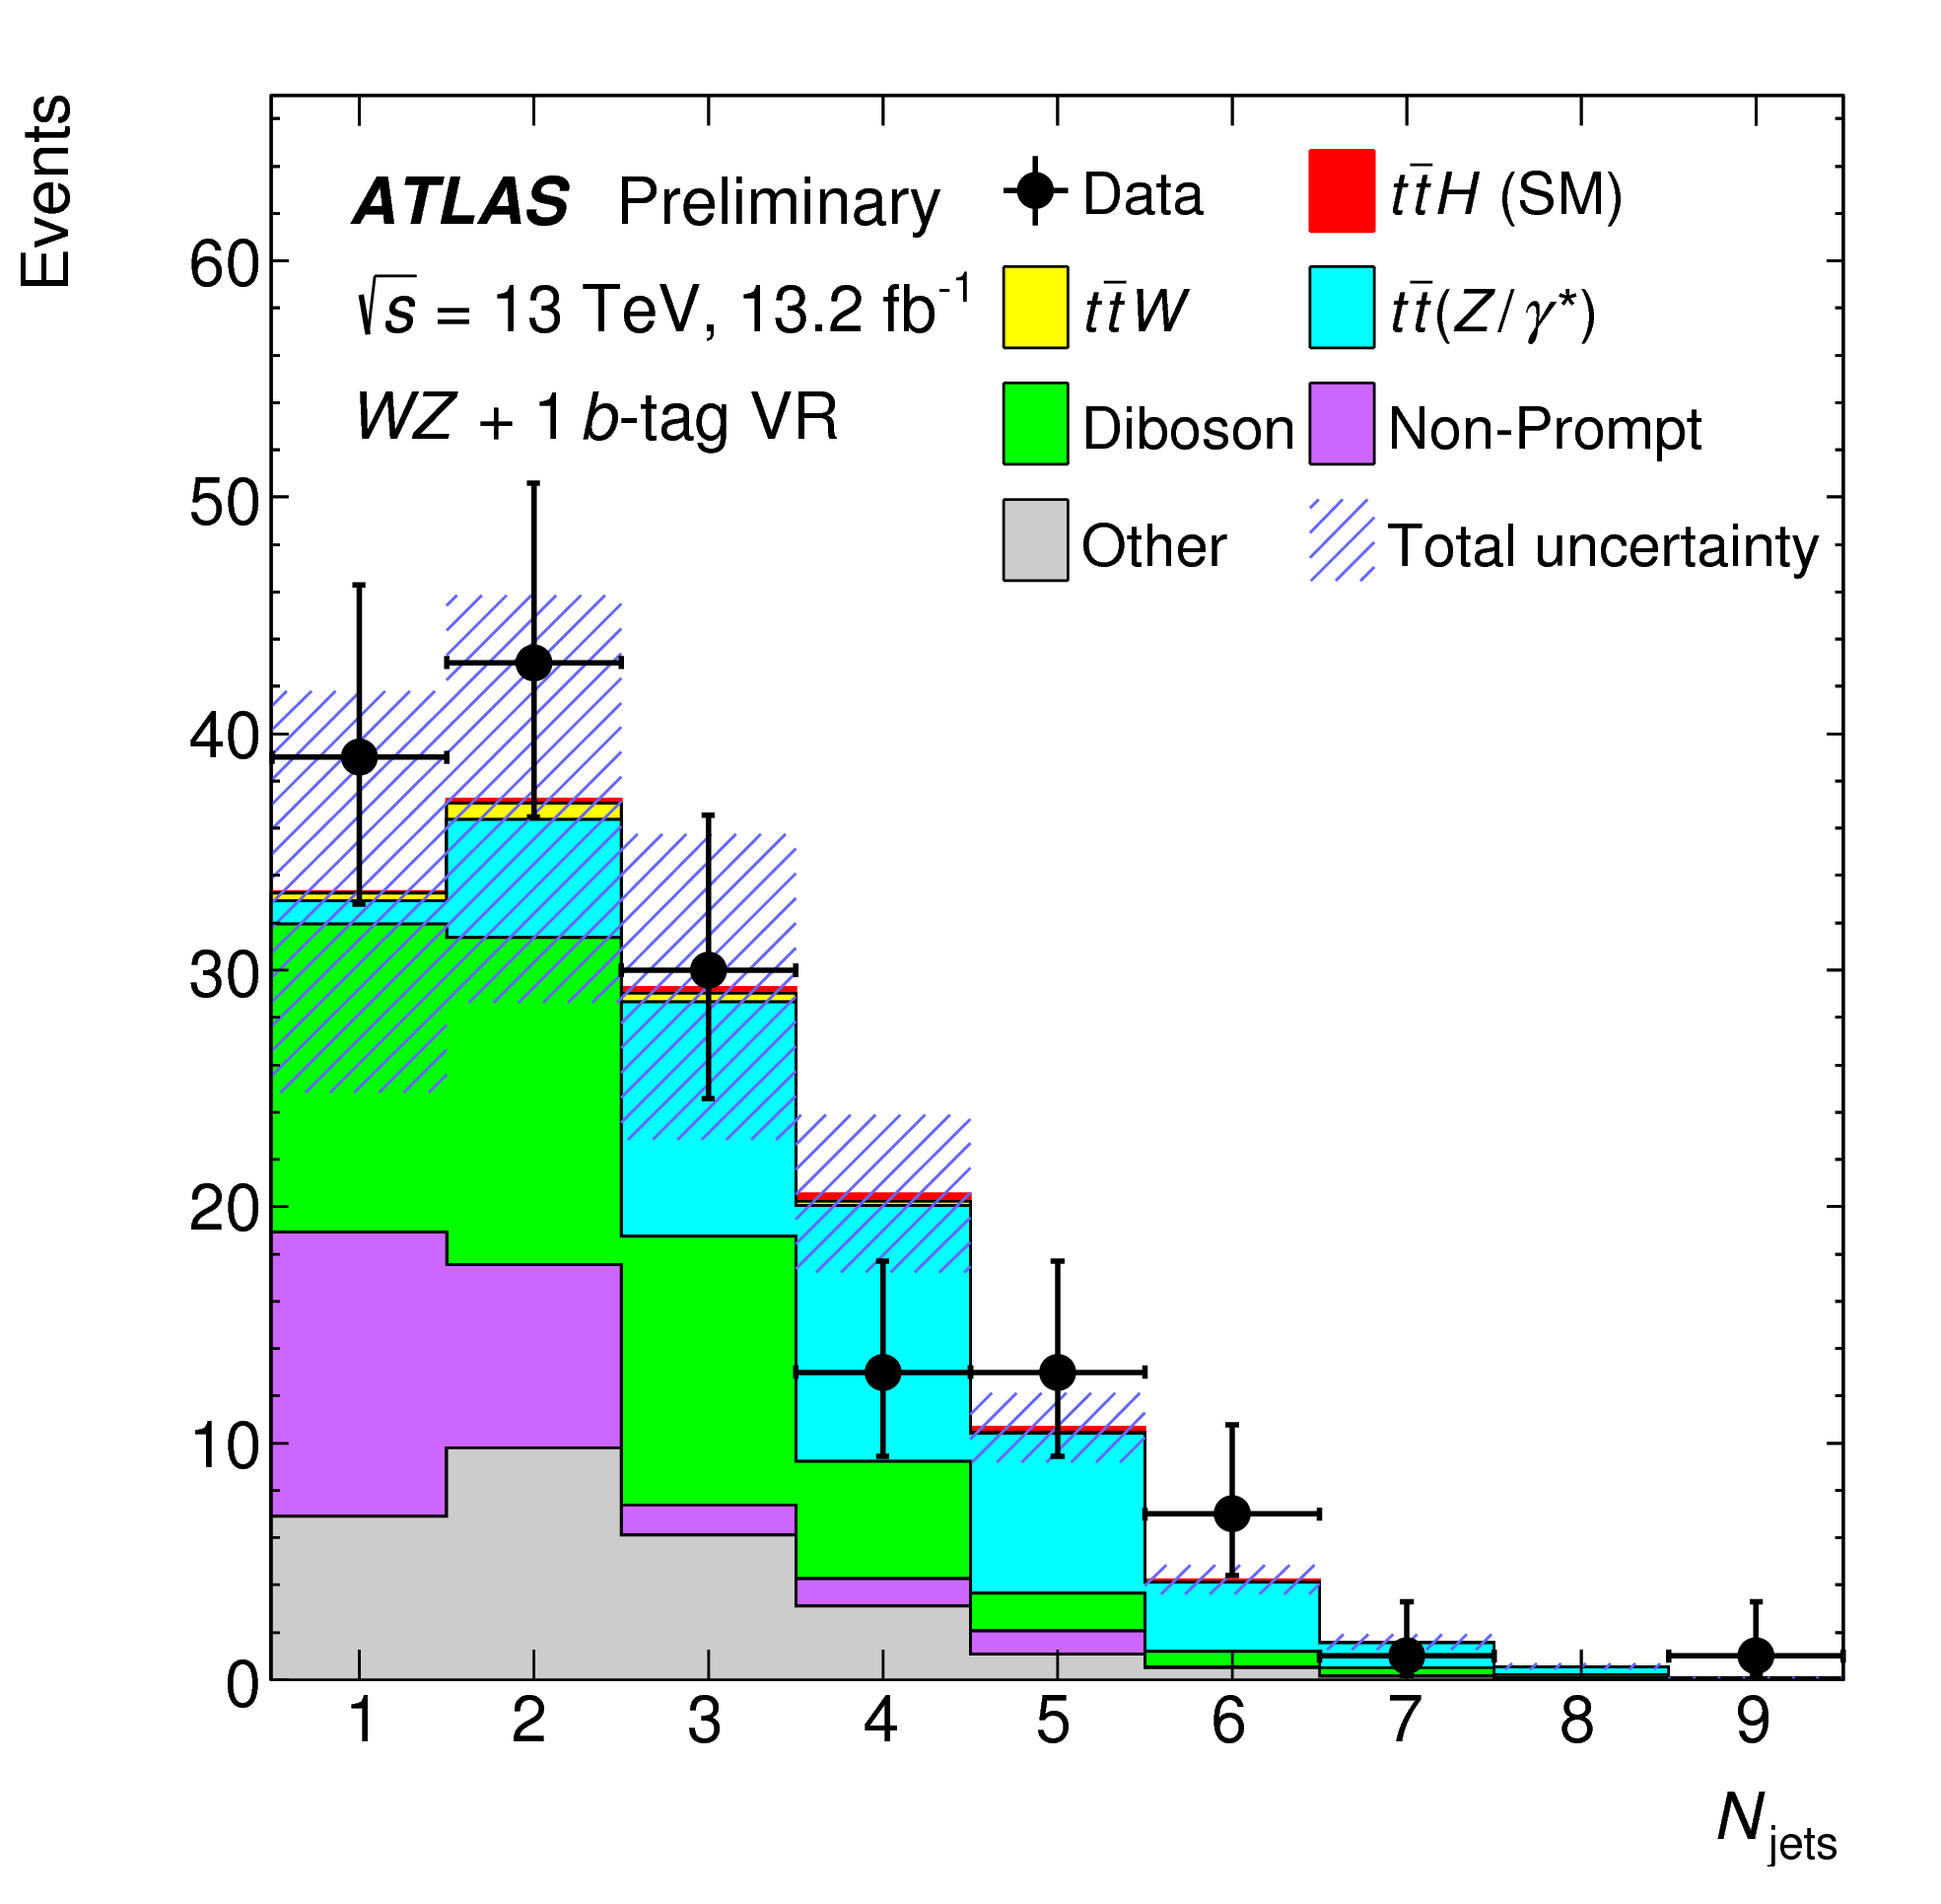
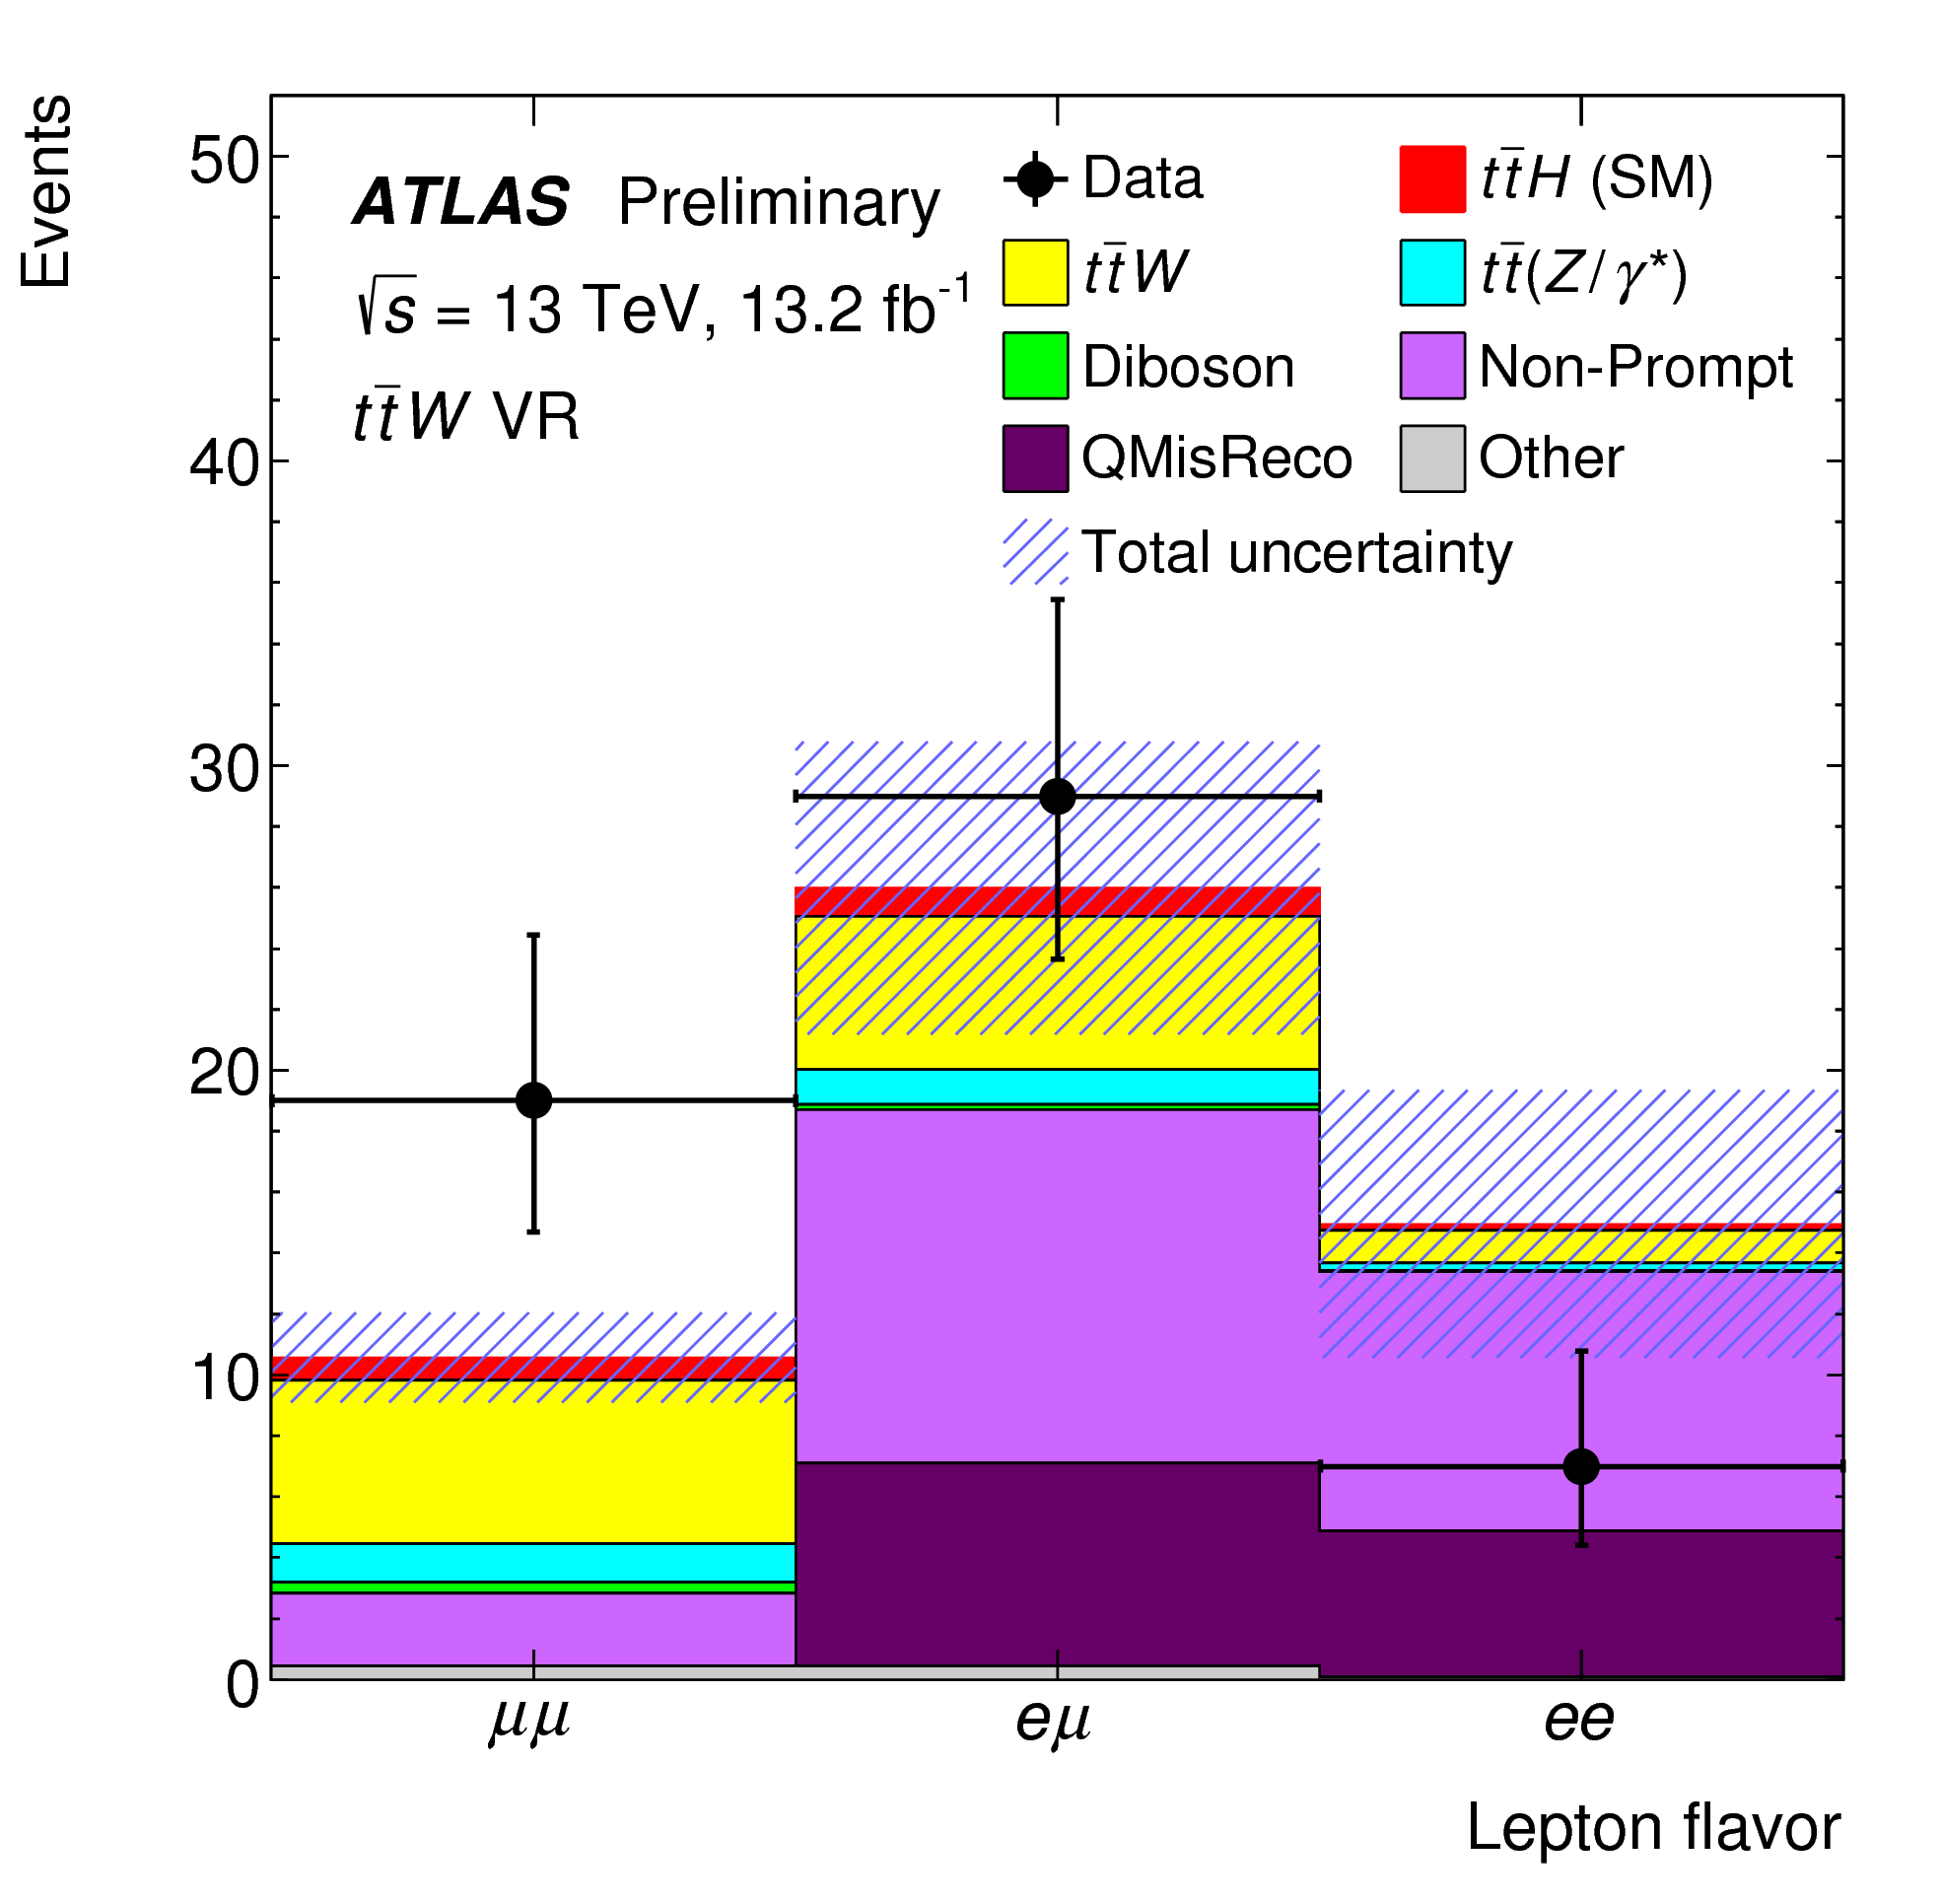
| VR | Purity (%) | Expected | Data |
|---|---|---|---|
| Loose ttZ | 58 | 89 | |
| WZ+1bjet | 33 | 147 | |
| ttW | 22 | 55 |
| Higgs boson decay mode (%) | |||||
| Category | WW∗ | ZZ∗ | Other | ||
| 77 | 17 | 3 | 3 | 14 | |
| 46 | 51 | 2 | 1 | 2.2 | |
| 74 | 20 | 4 | 2 | 9.2 | |
| 72 | 18 | 9 | 2 | 0.88 | |
5 Two Same-charge Light Leptons Plus One Hadronic Tau Final State
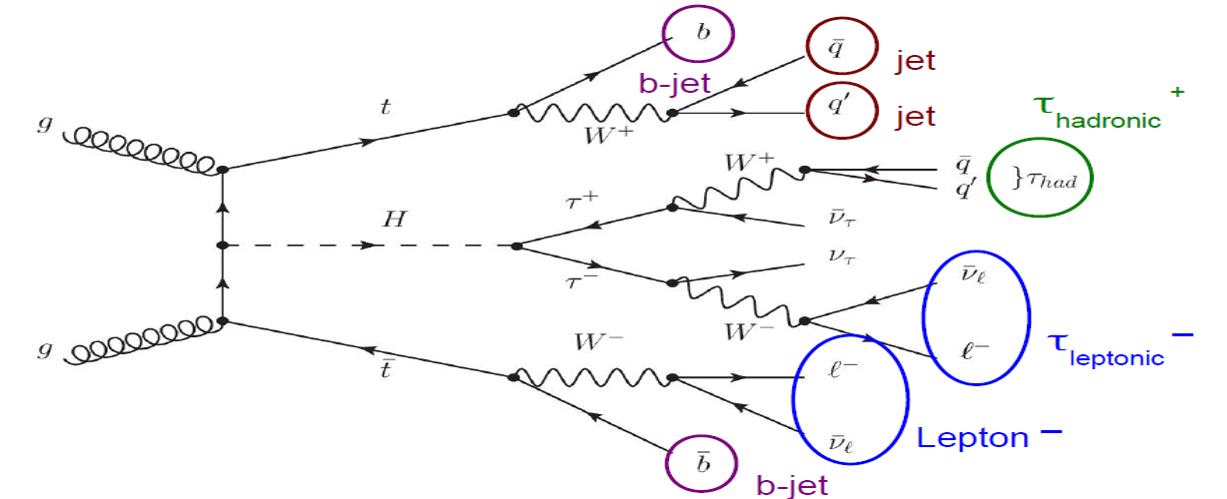
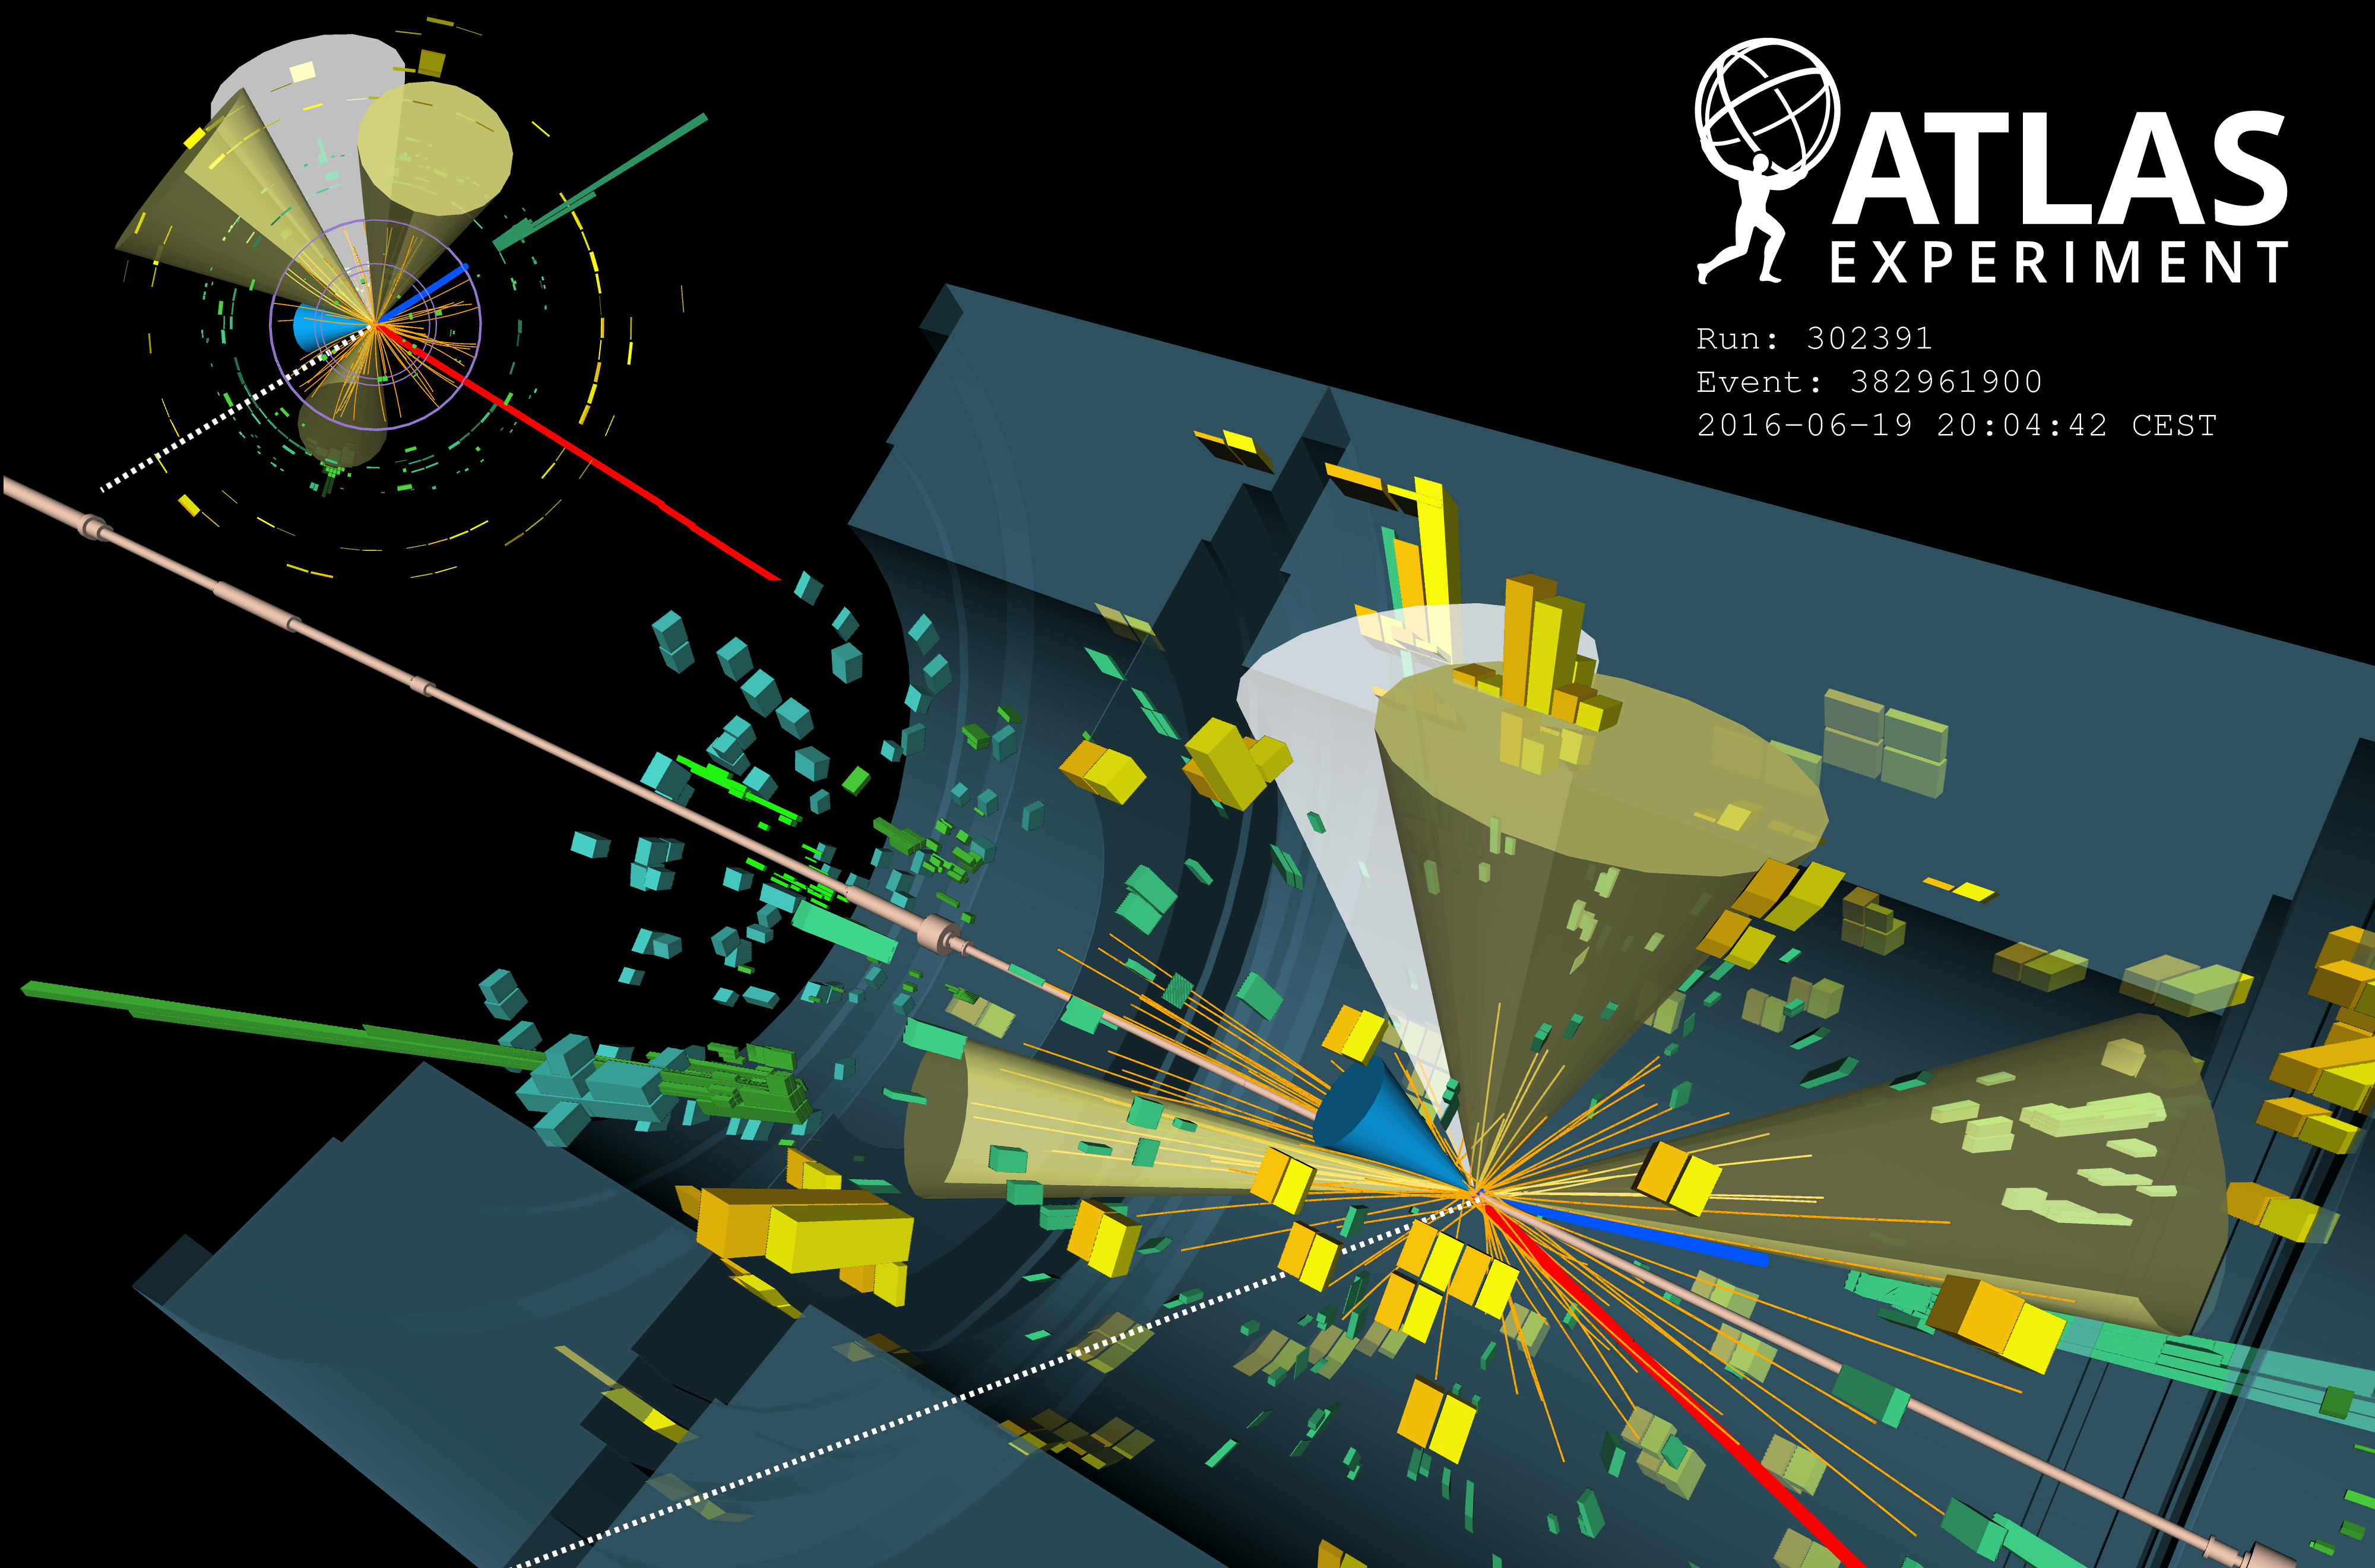
In the two same-charge light leptons plus one hadronic tau analysis channel, as illustrated in Fig. 7, one light lepton arises from the tau decay, and one from the top decay. The other tau and the other top decay hadronically, leading to the signature with multijets and b-jets. A selected candidate event display is also shown in Fig. 7 (from [10]).
6 Two Same-charge Light Leptons Without Hadronic Tau Final State, Three and Four Light Leptons Final States
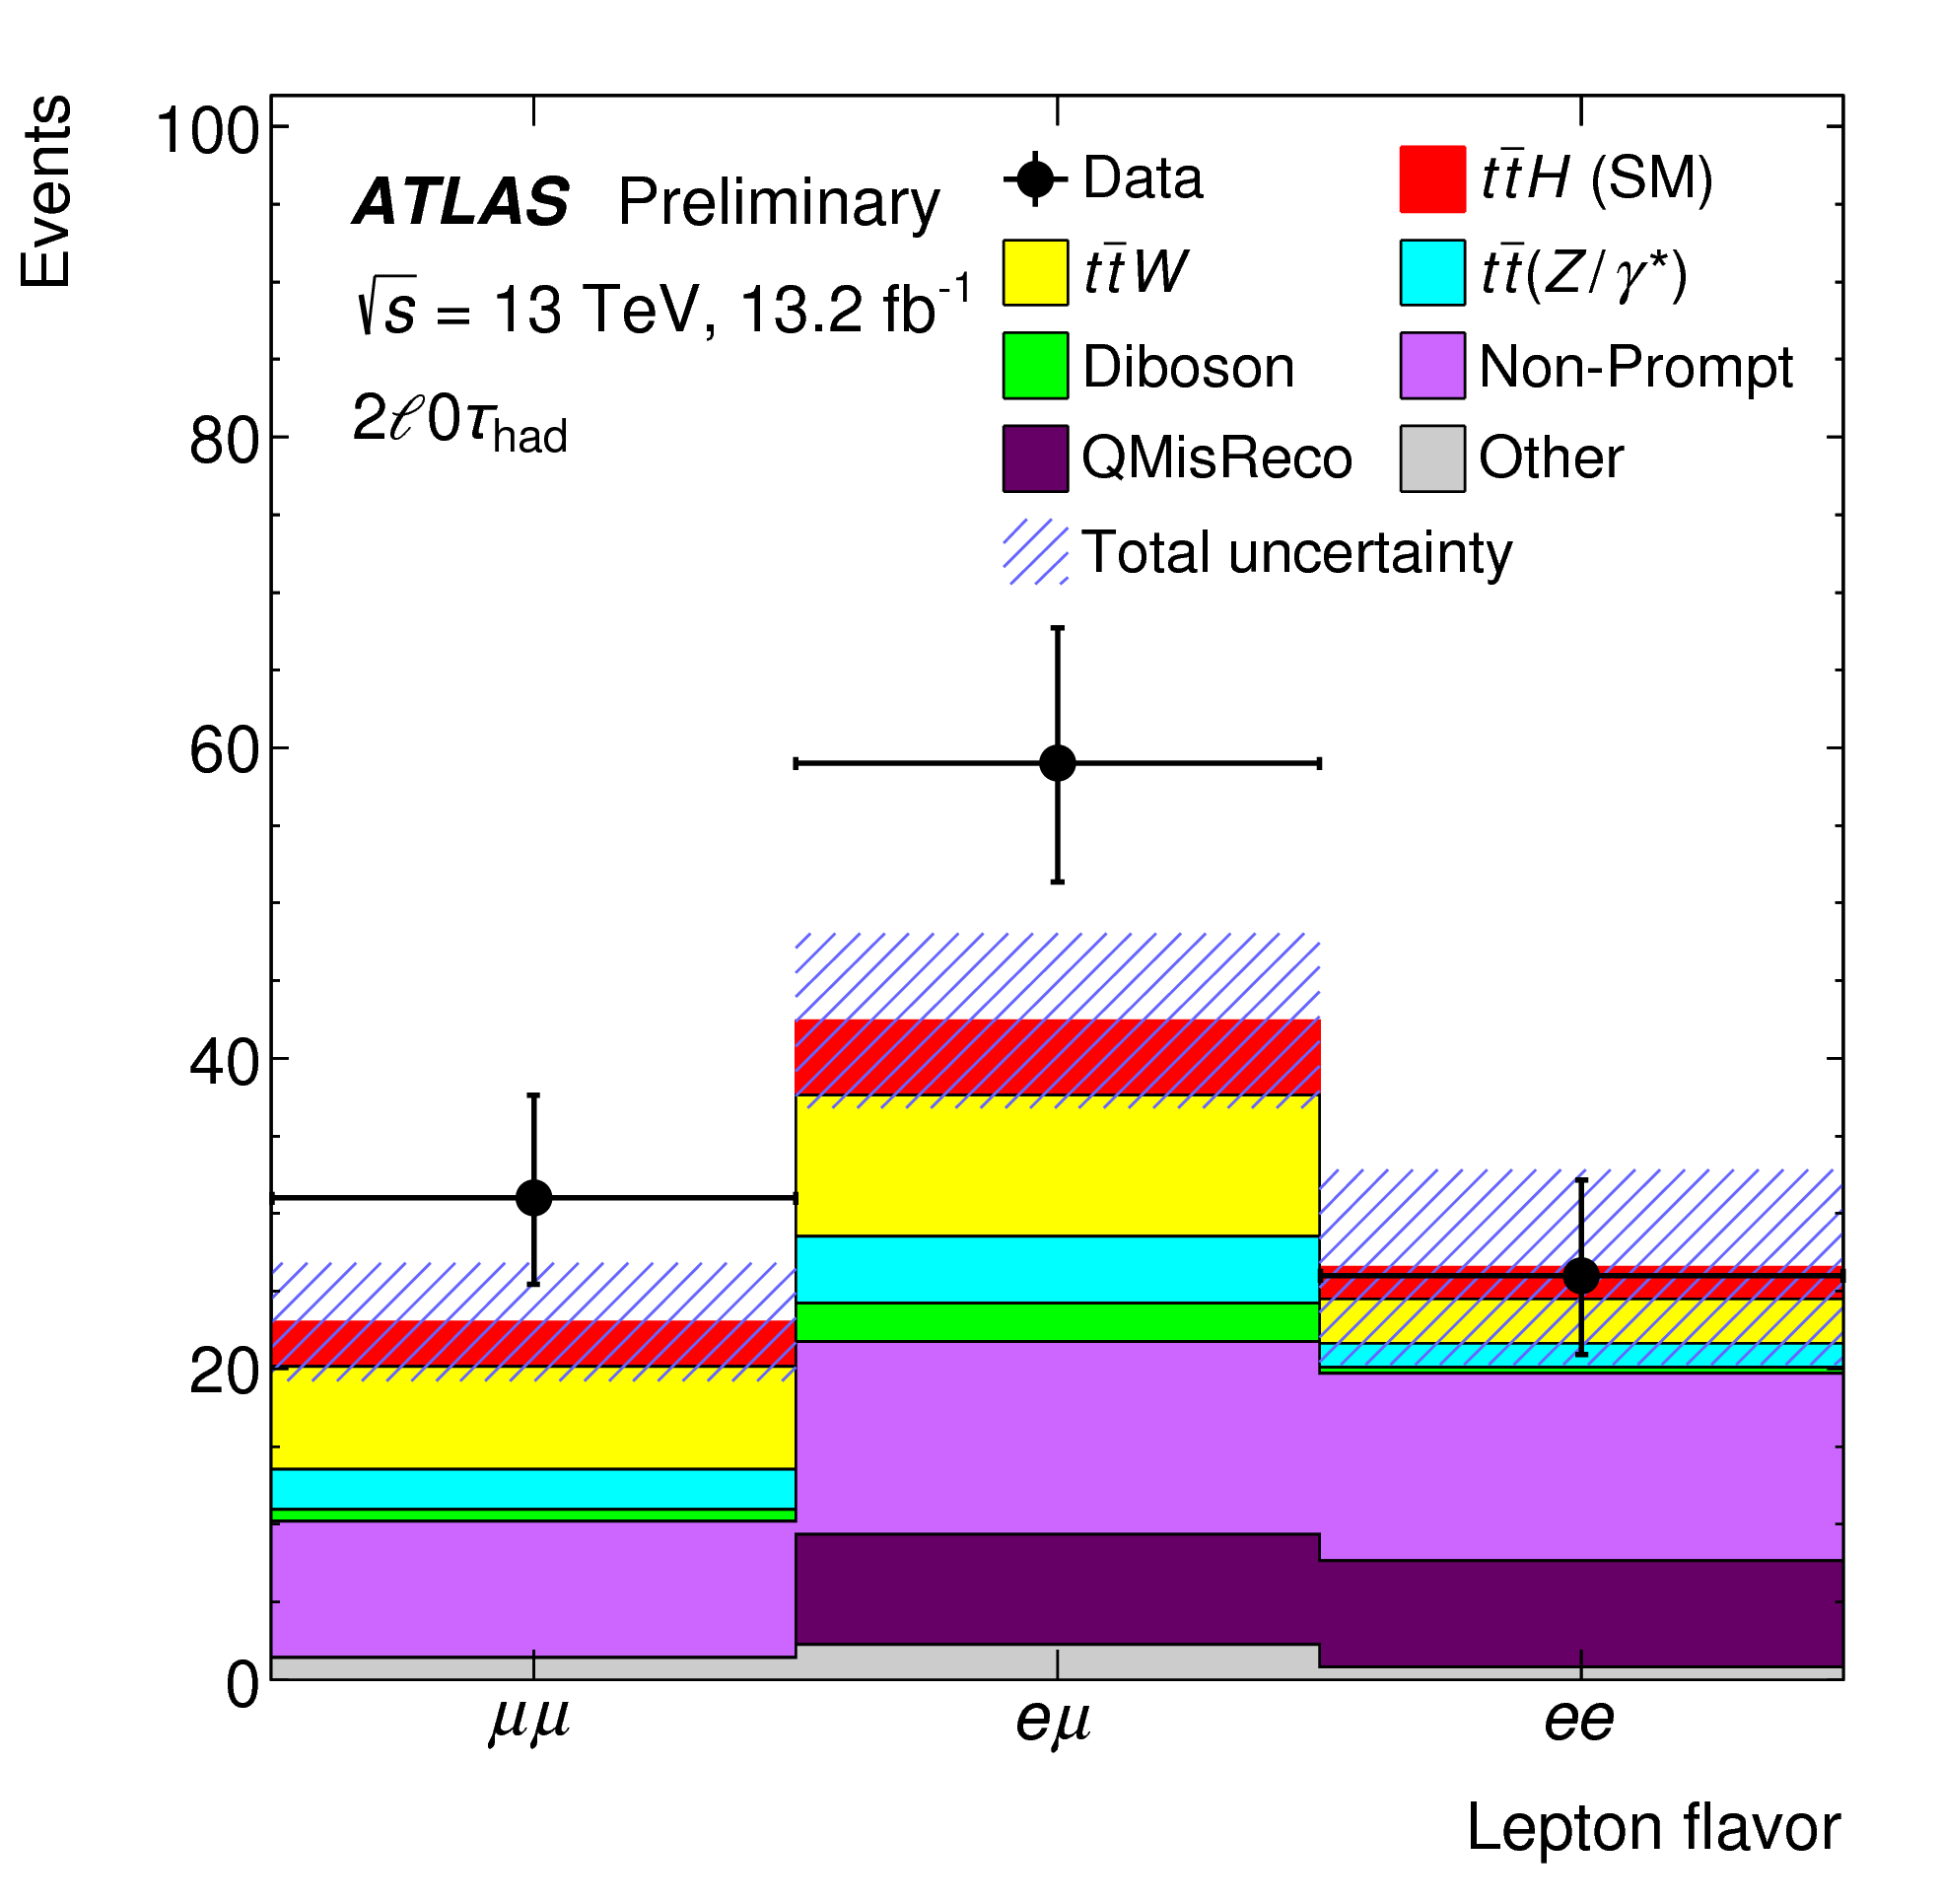
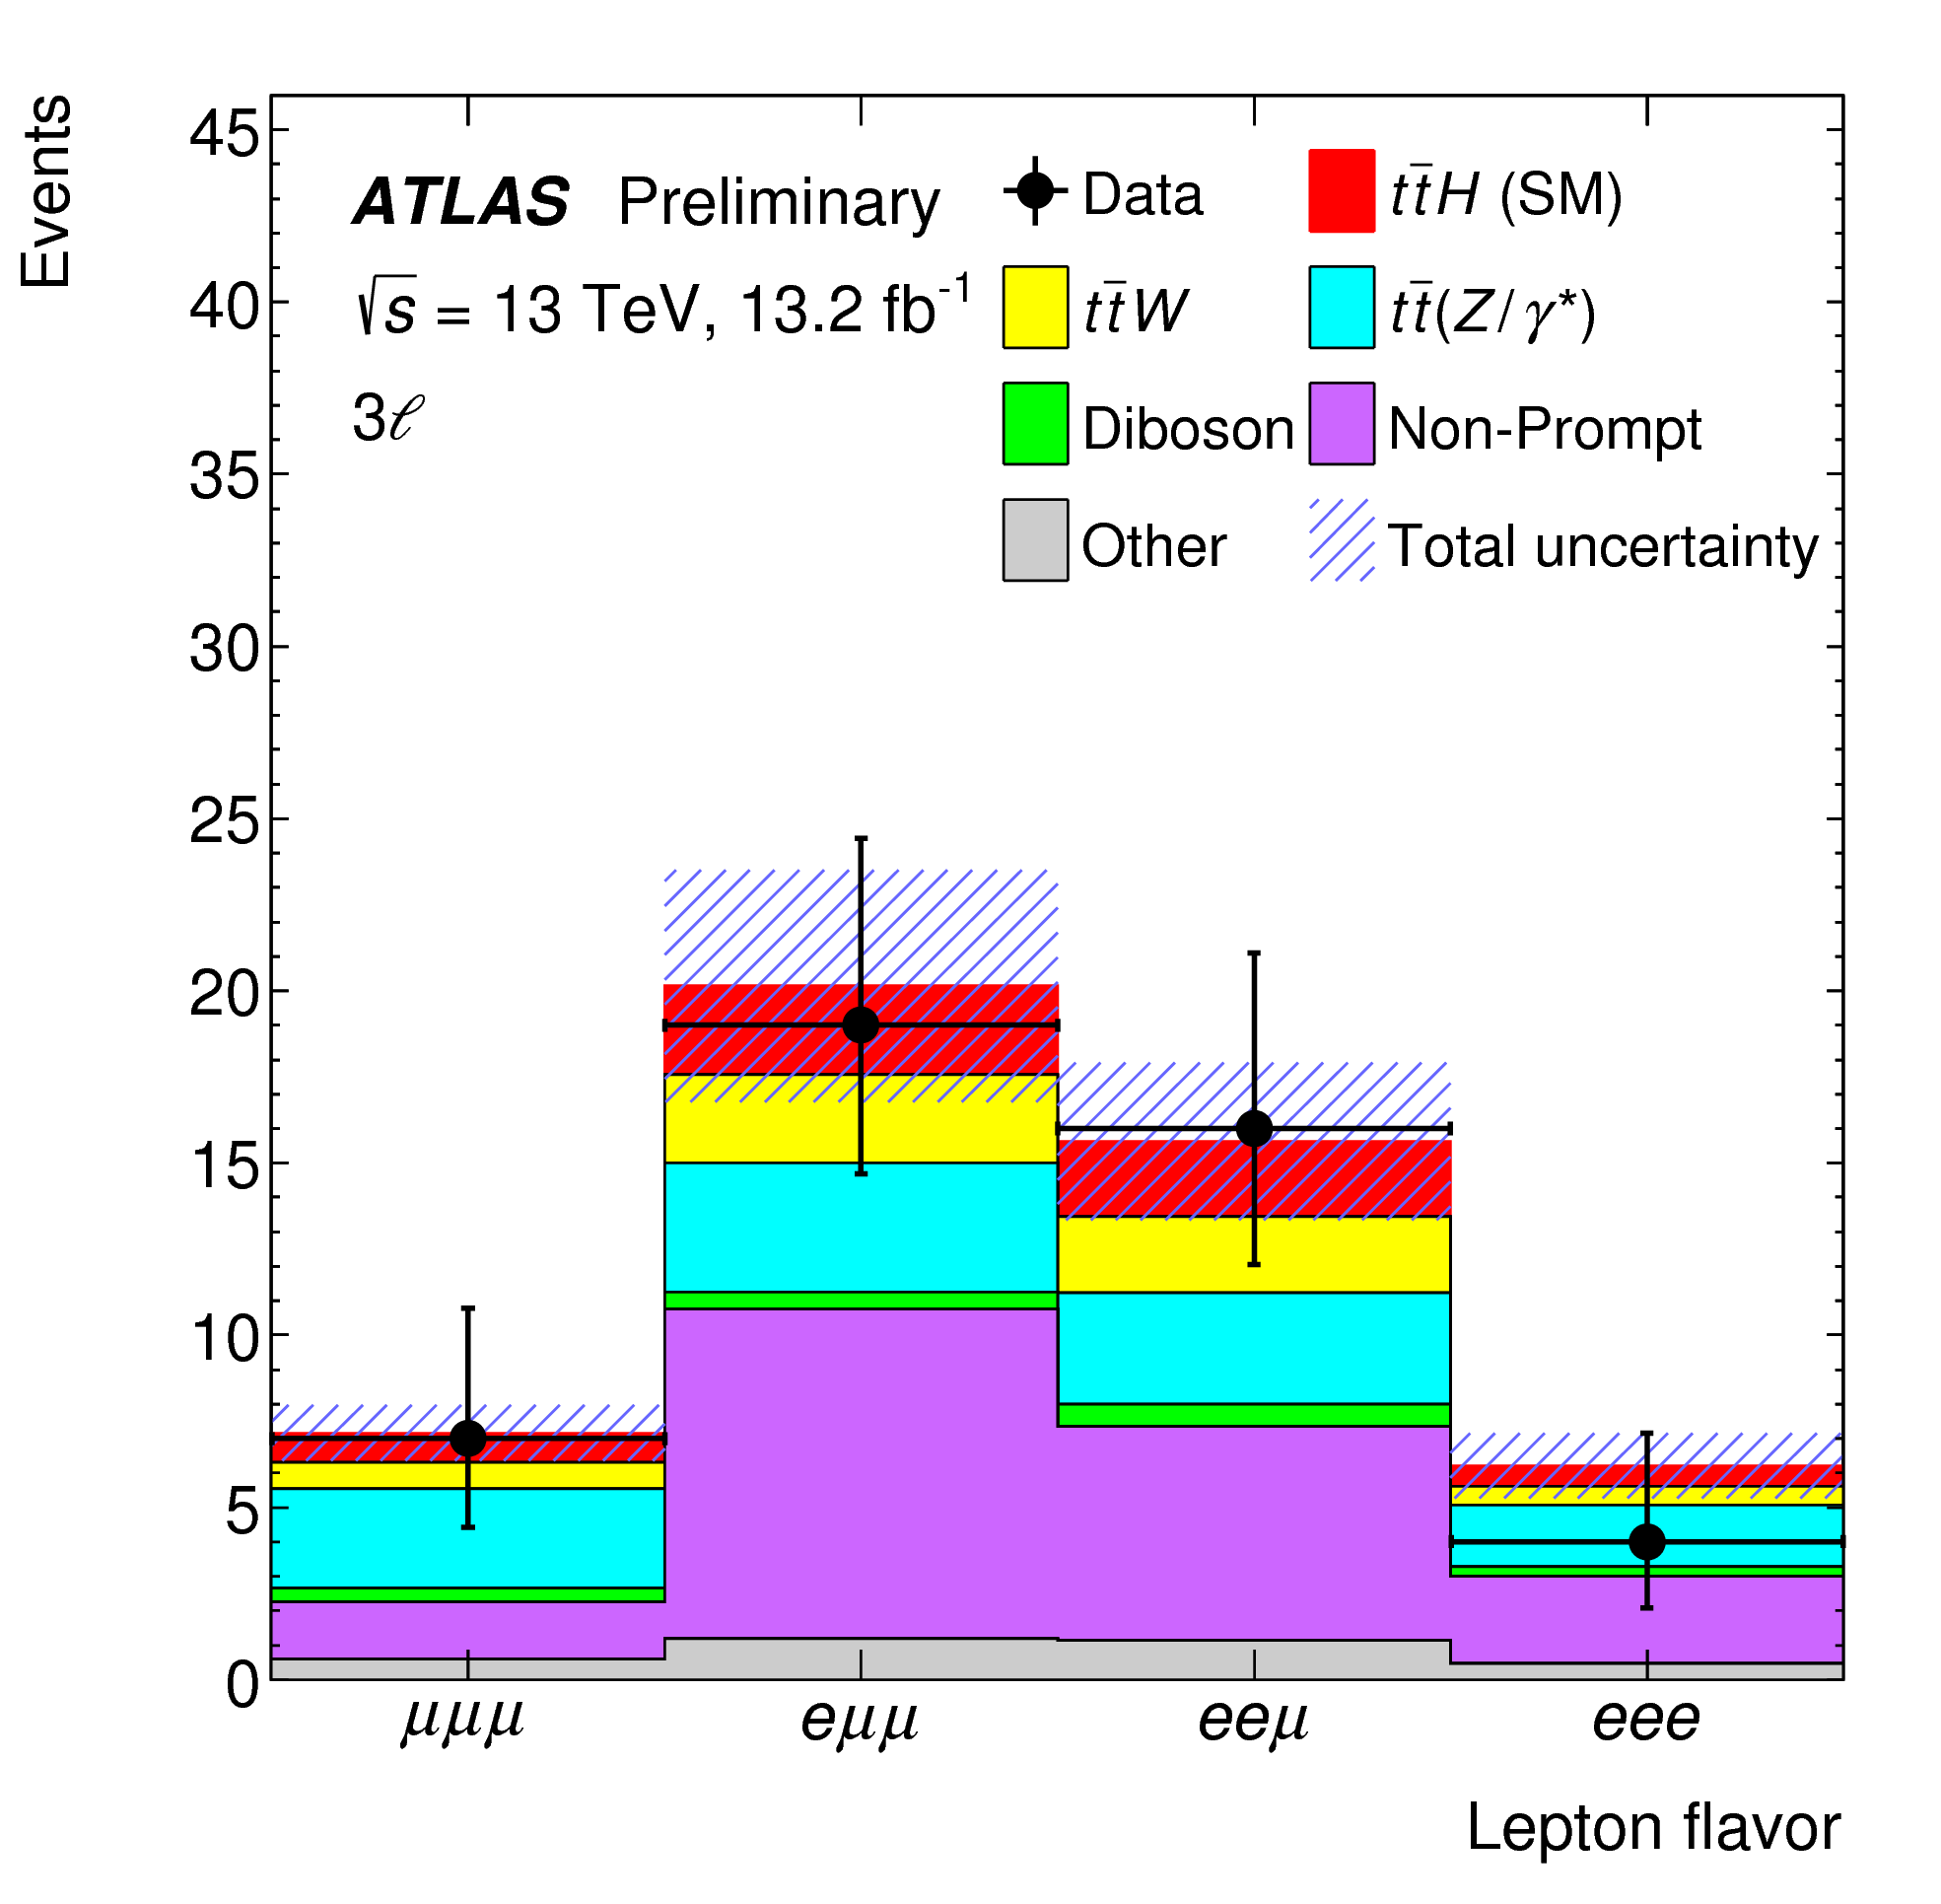
For the ttH search with two same-charge light leptons without hadronic tau final state, and three leptons, Fig. 8 (from [10]) shows the number of data, SM signal and background composition. For the four light leptons final state, no data event passes the selection.
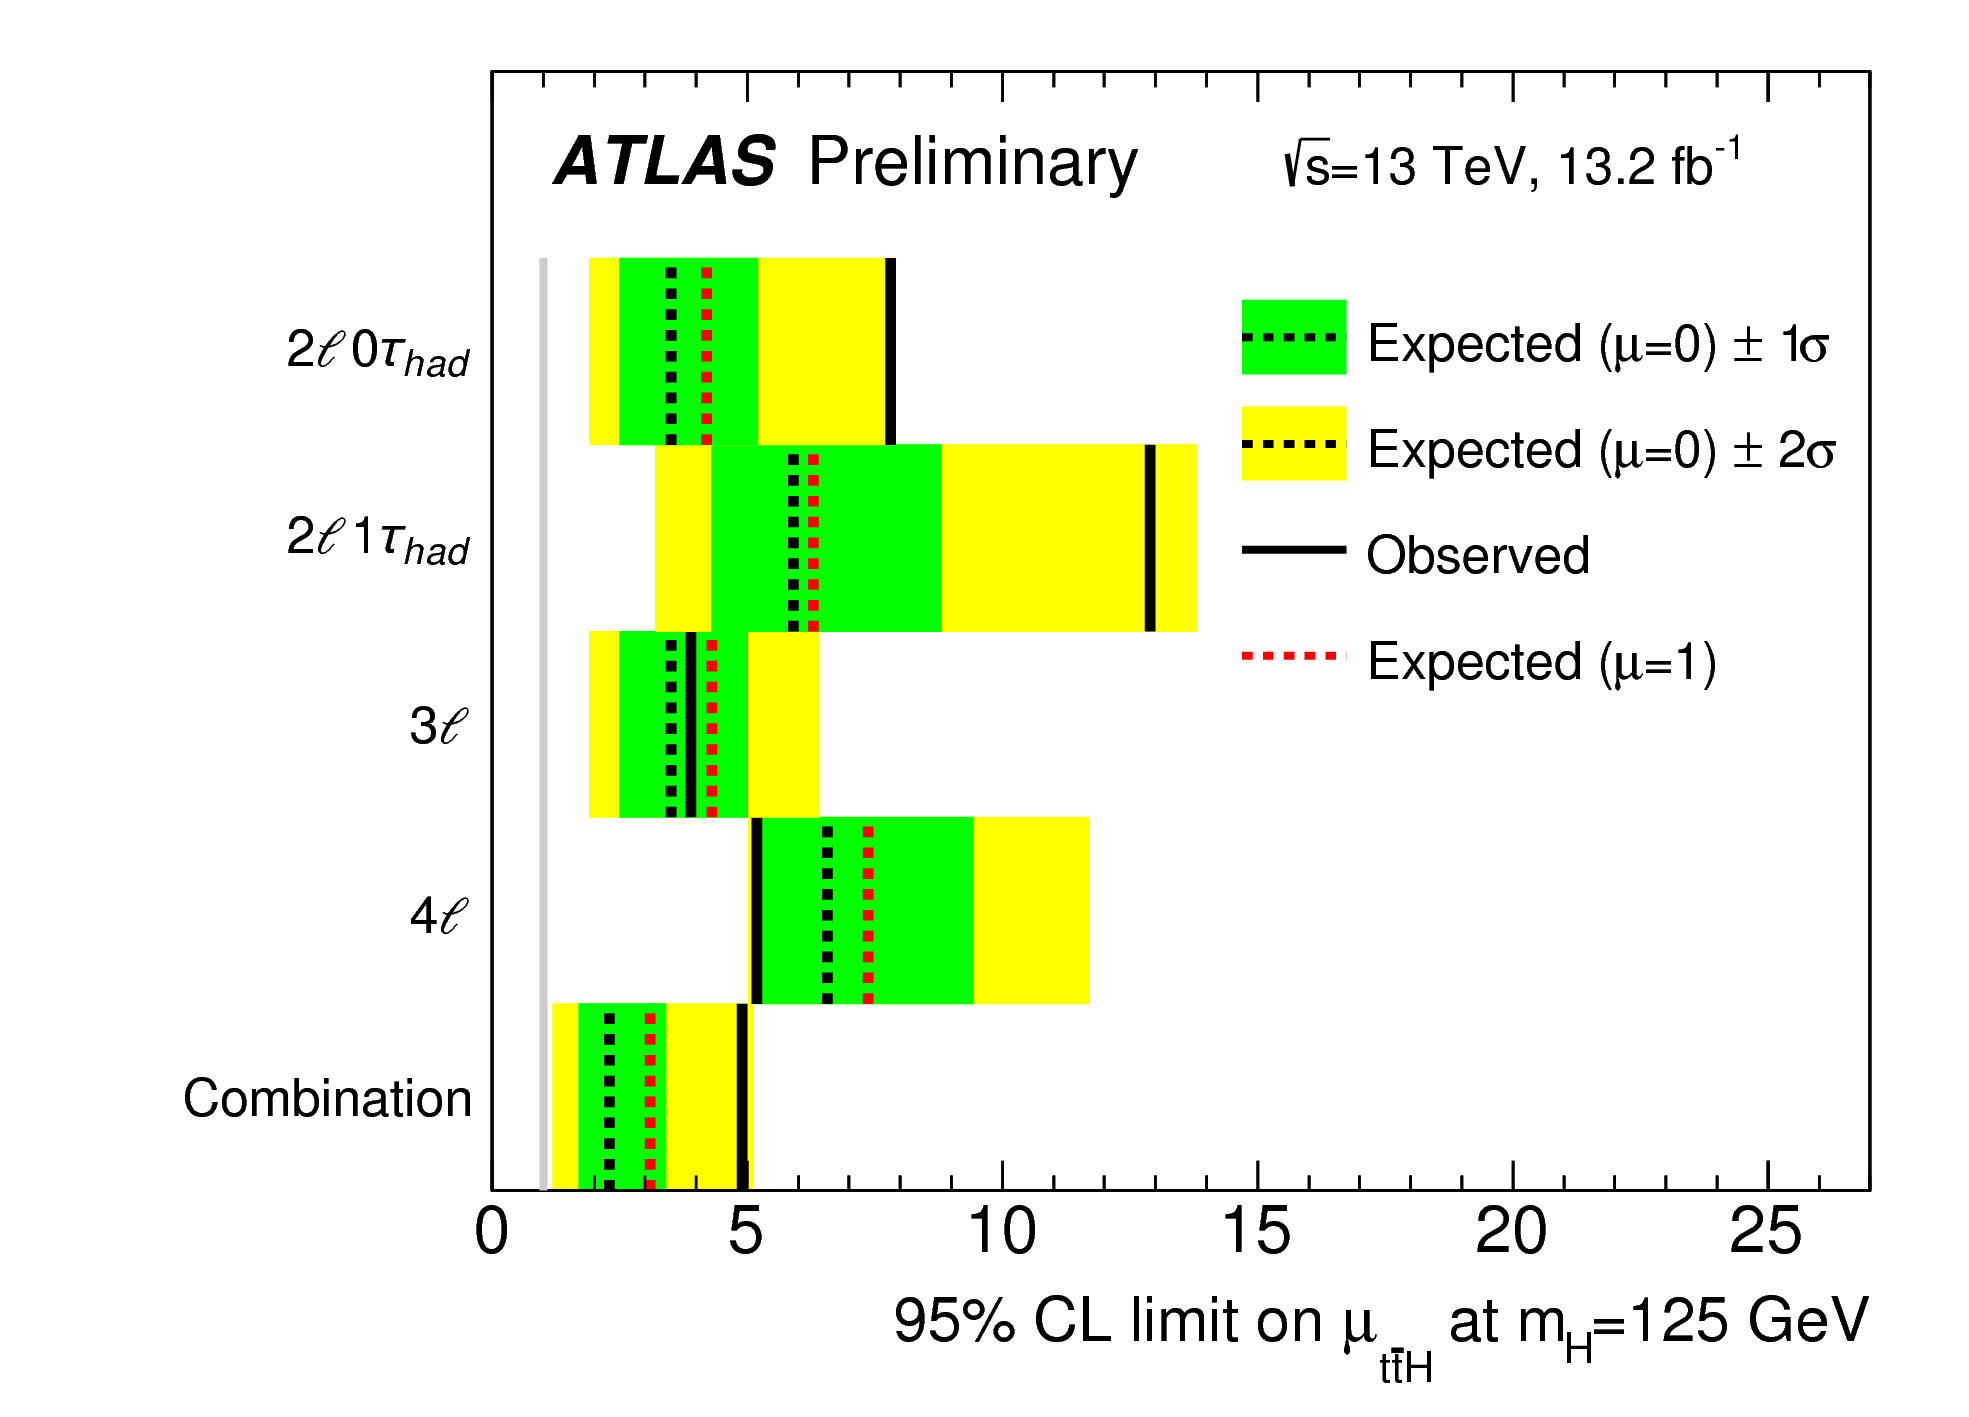
7 ttH (Multilepton) Results
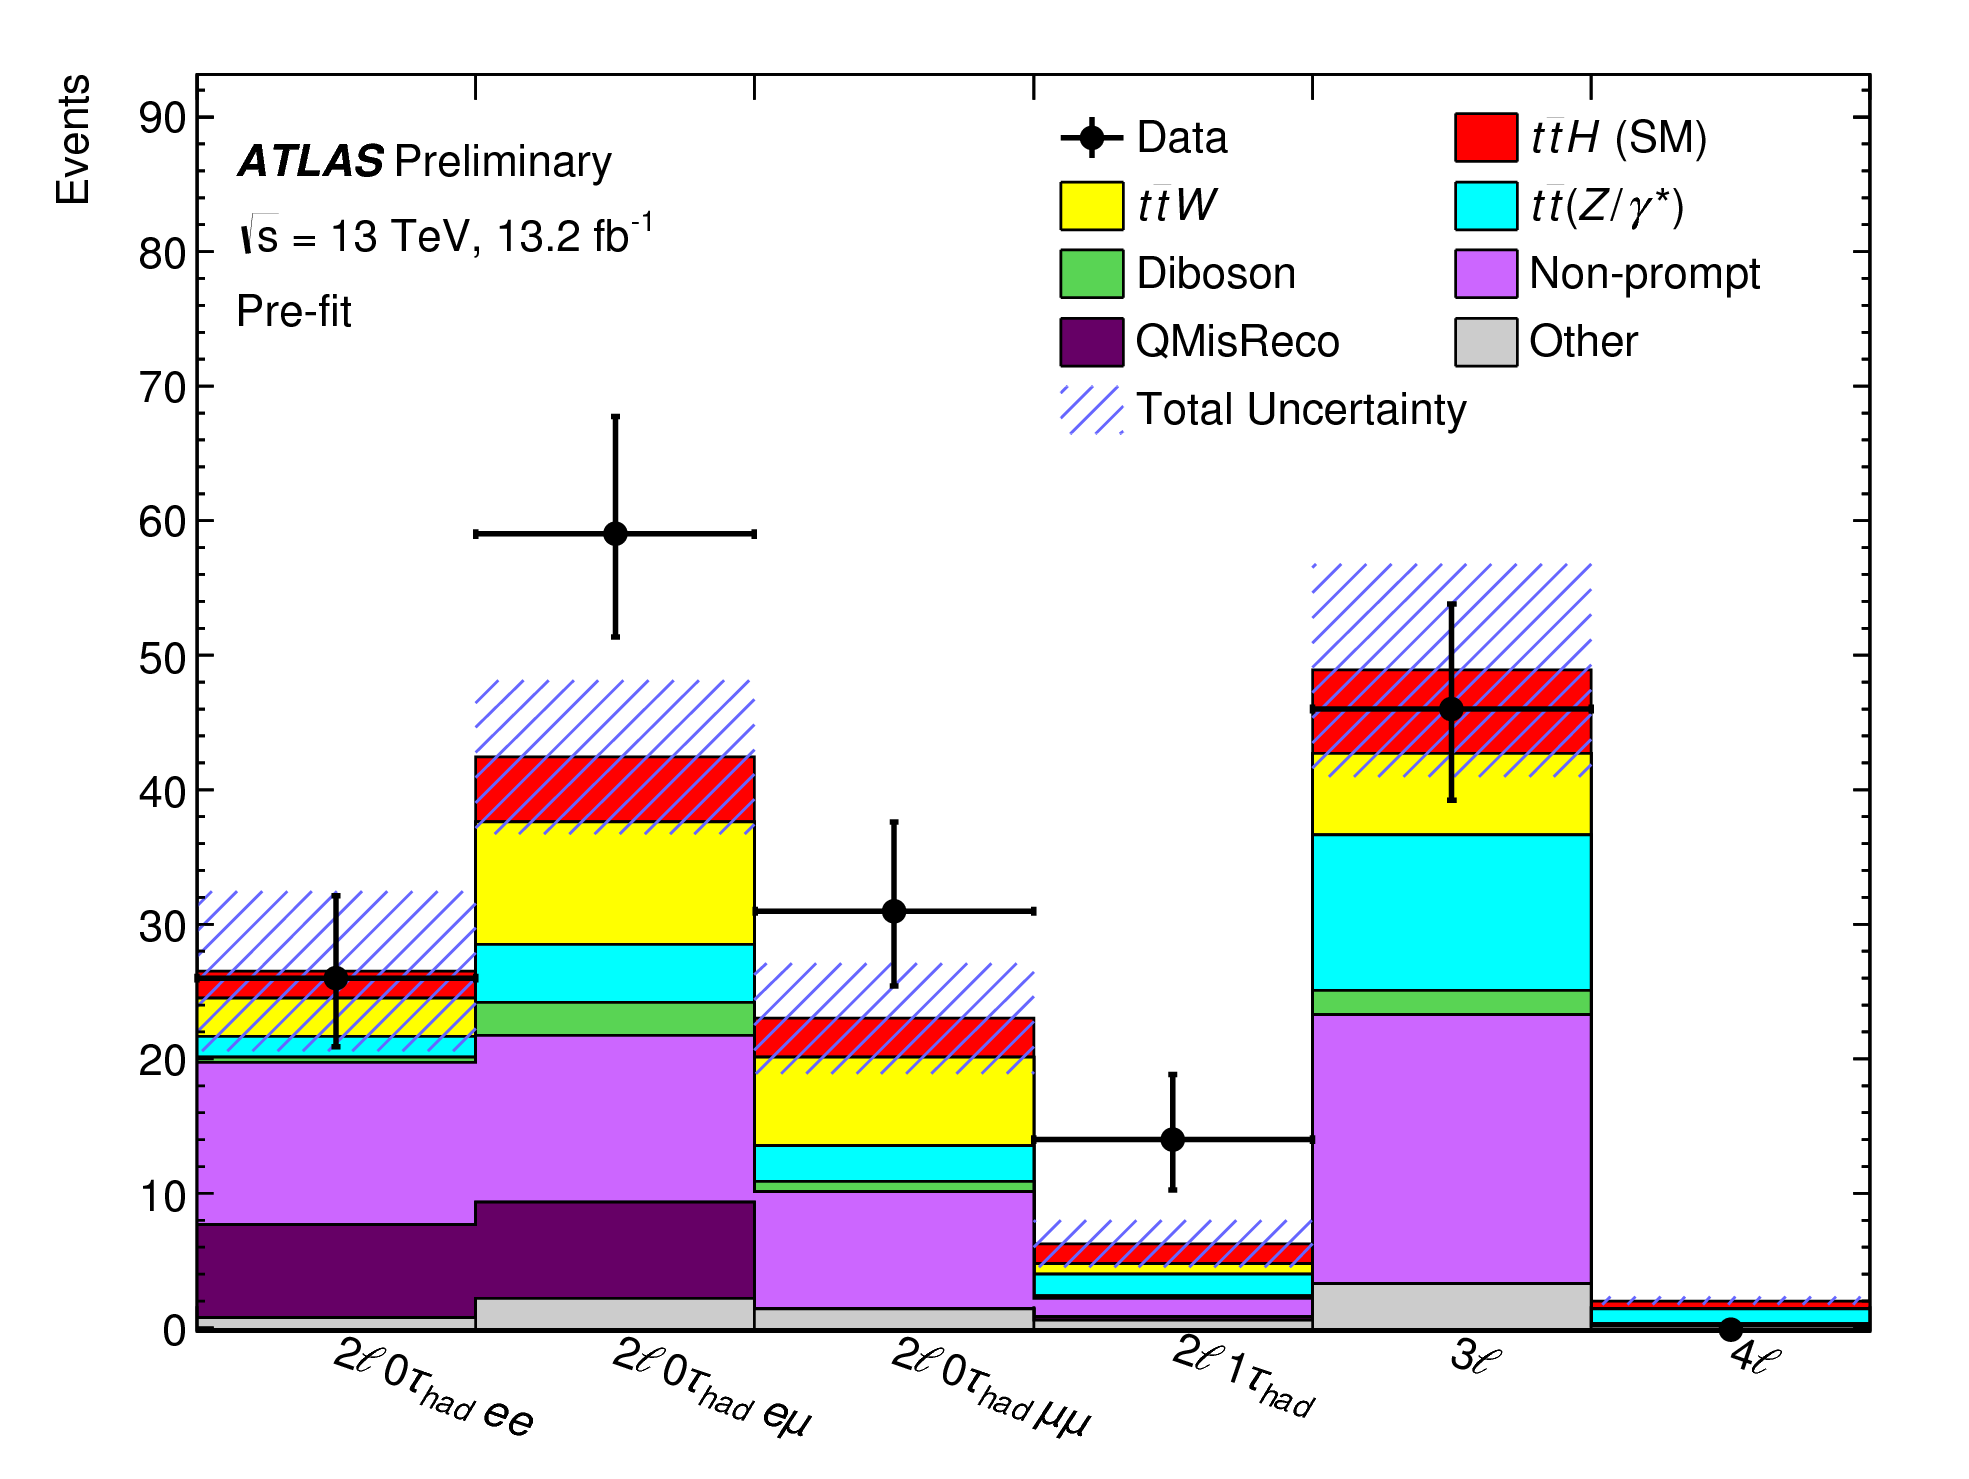
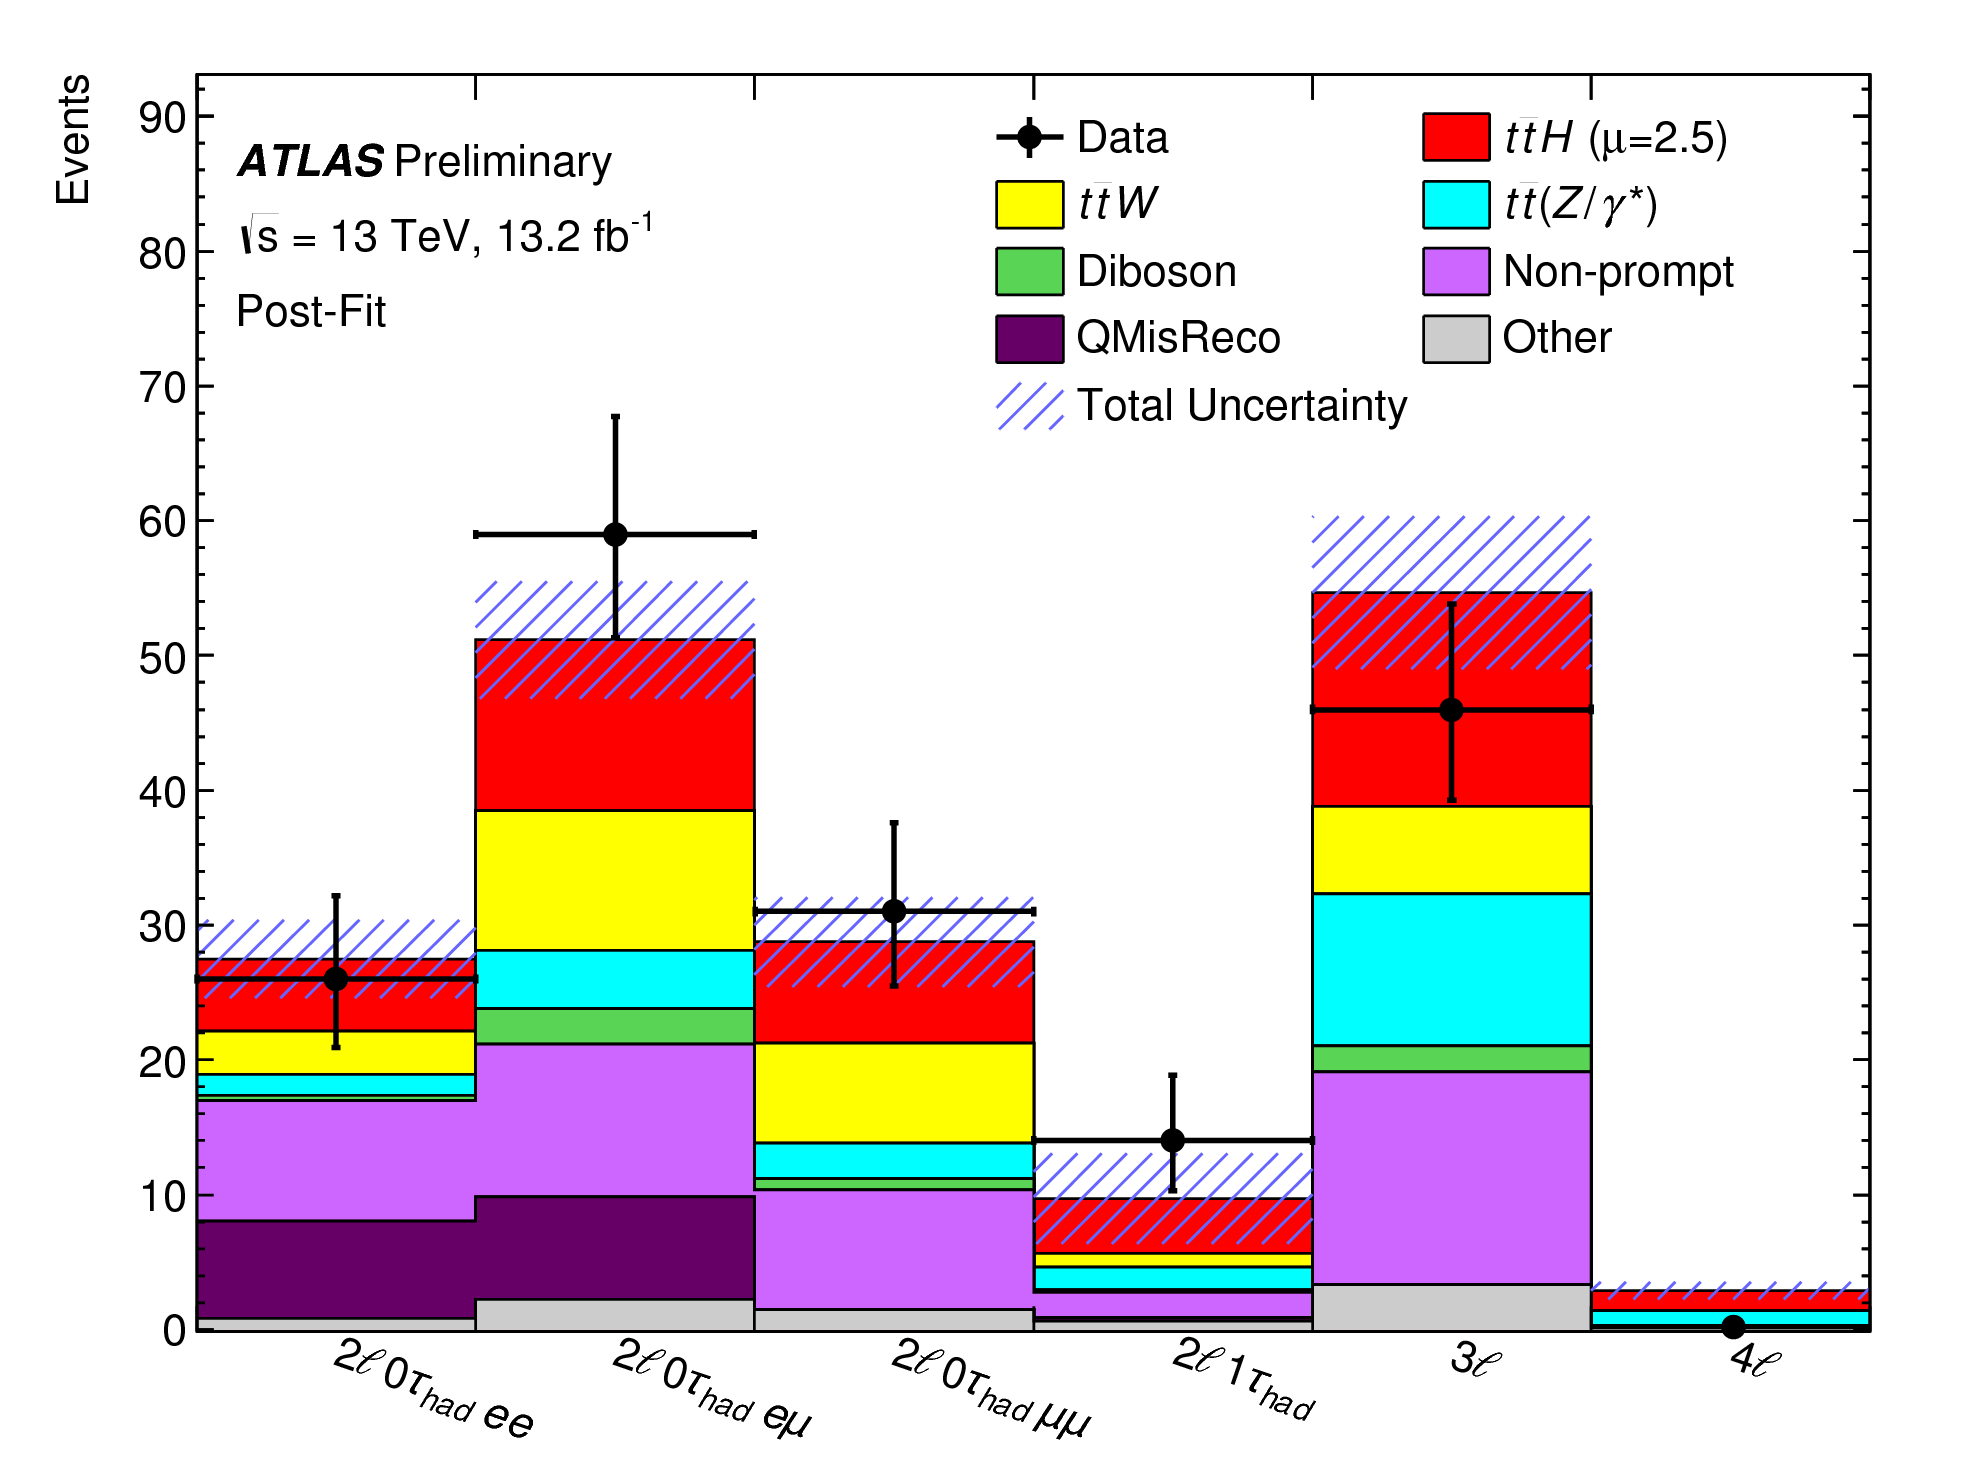
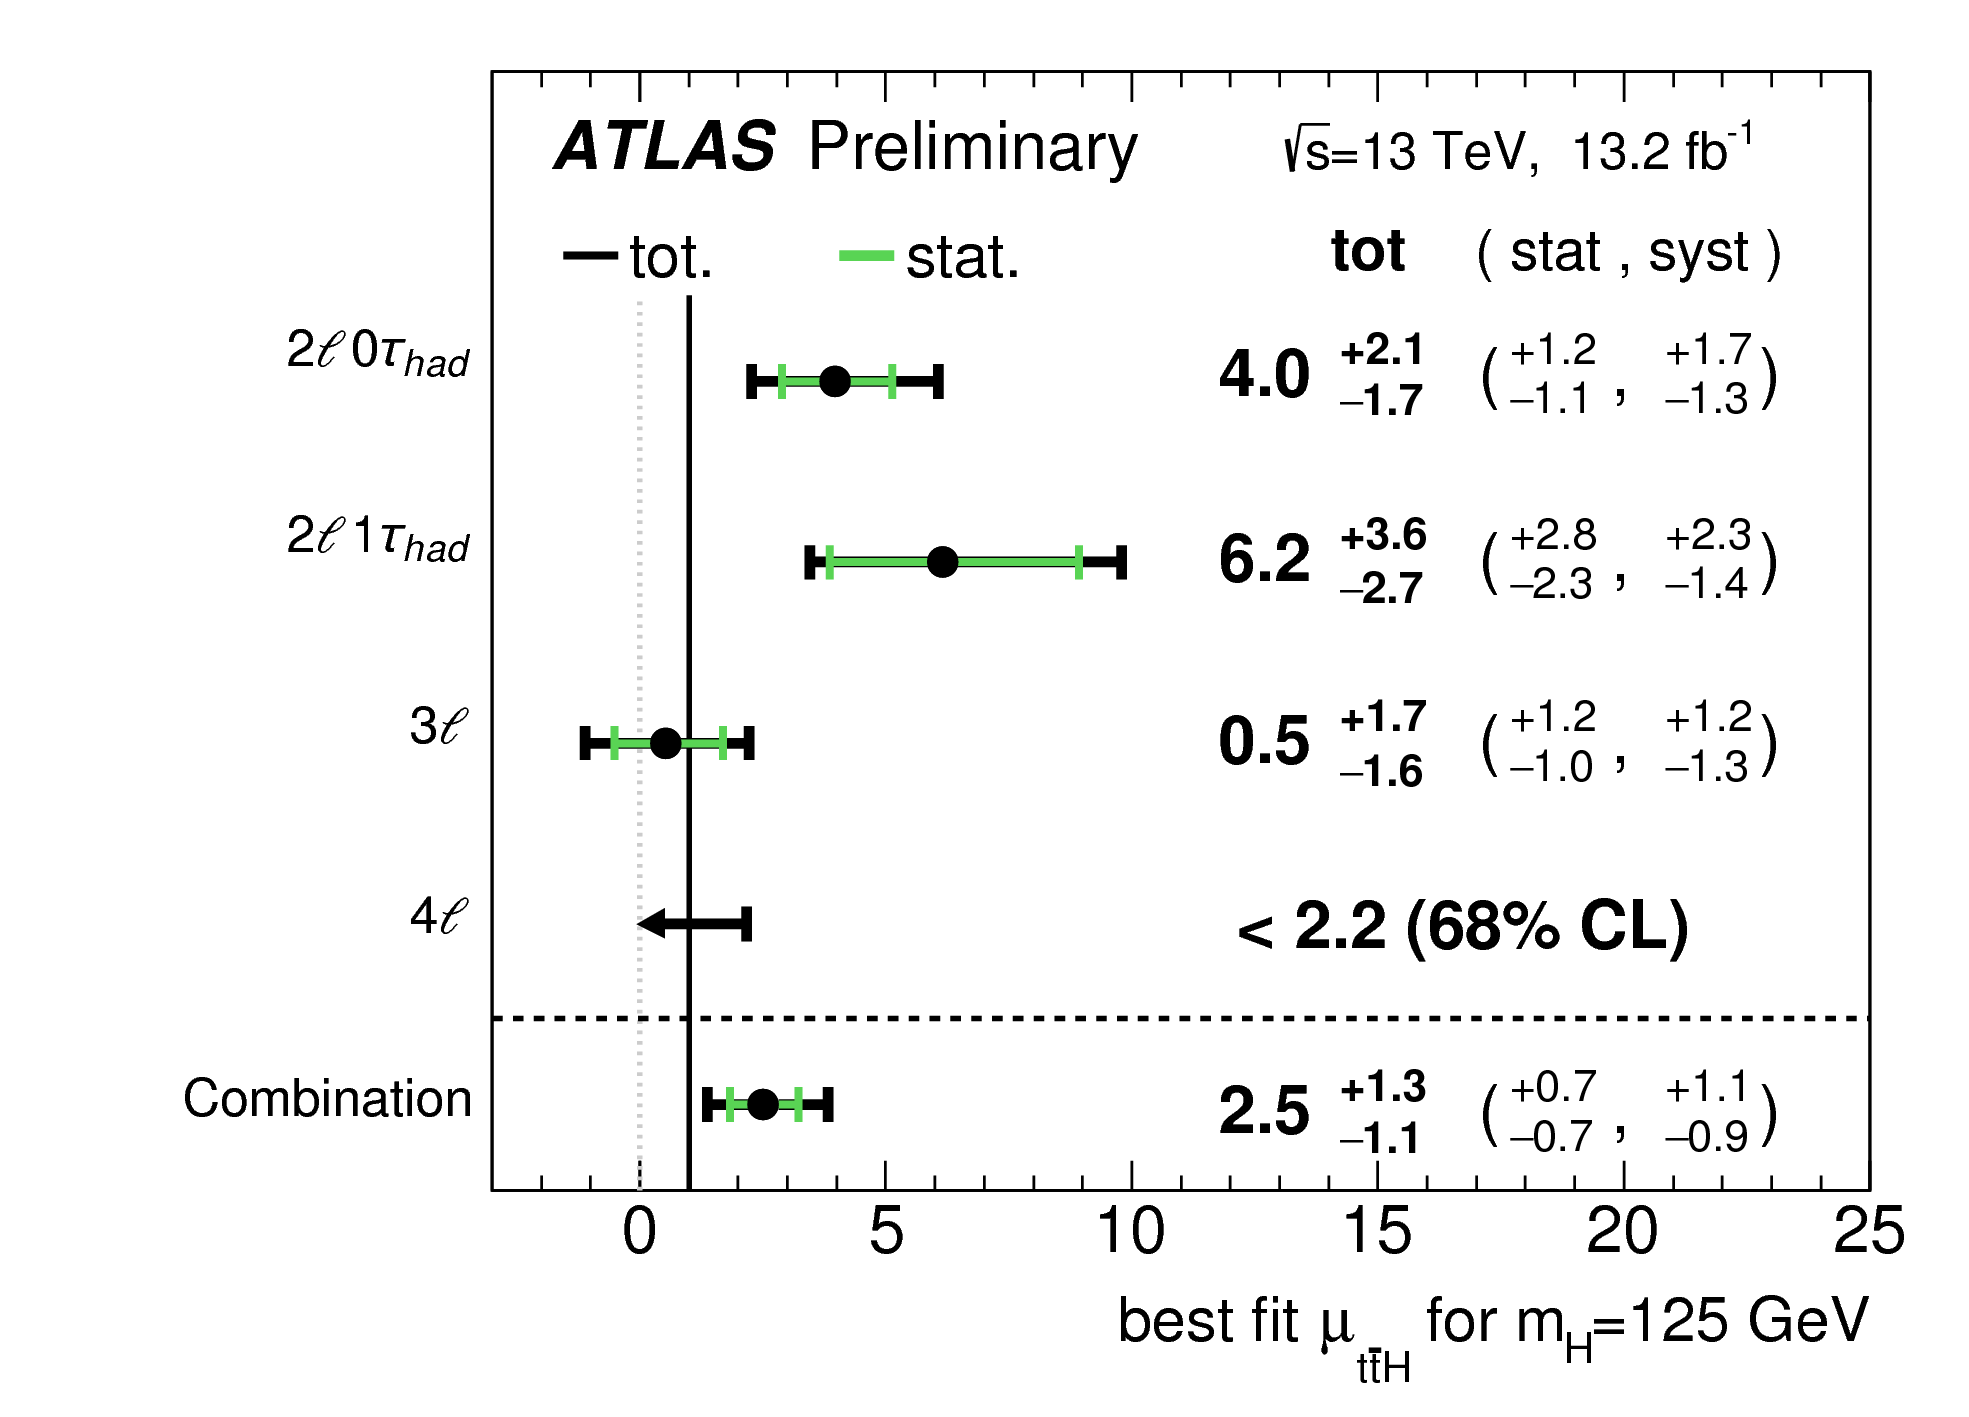
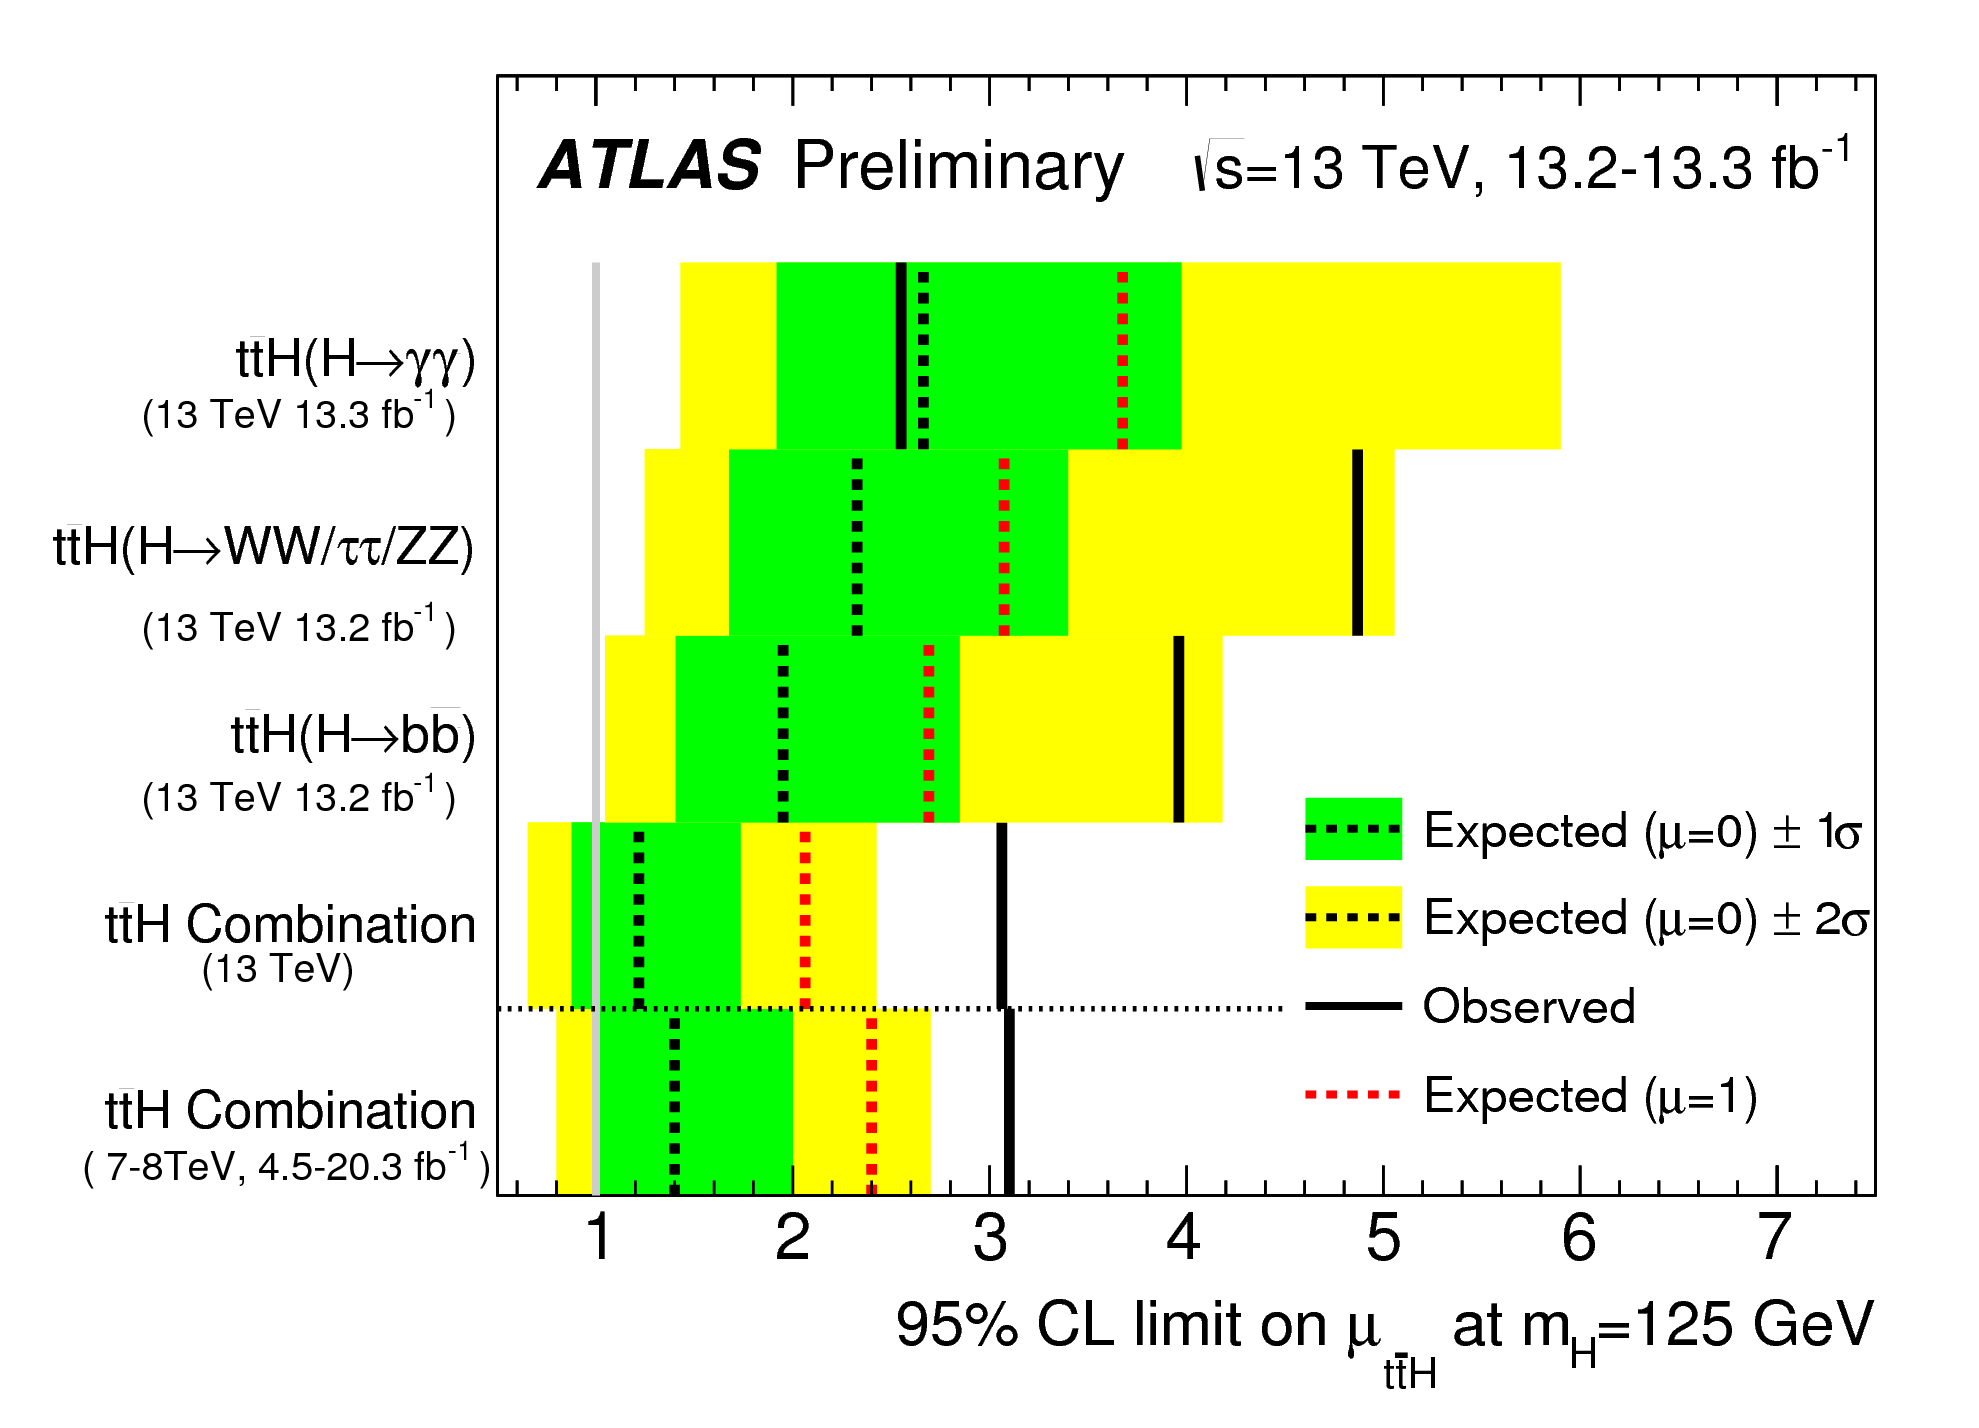
The results of the ttH search can be expressed as numbers of selected data, simulated signal and determined background events, as shown in Fig. 9 (from [10]) for pre-fit and post-fit, and pre-fit details are presented in Table 3 (from [10]). The post-fit gives indicating a mild data excess compared to the SM prediction. The comparison of the obtained signal strengths and their upper limits are given in Fig. 10 (from [10]).
| ttW | 2.9 0.7 | 9.1 2.5 | 6.6 1.6 | 0.8 0.4 | 6.1 1.3 | — |
|---|---|---|---|---|---|---|
| 1.55 0.29 | 4.3 0.9 | 2.6 0.6 | 1.6 0.4 | 11.5 2.0 | 1.12 0.20 | |
| Diboson | 0.38 0.25 | 2.5 1.4 | 0.8 0.5 | 0.20 0.15 | 1.8 1.0 | 0.04 0.04 |
| Non-prompt lepton | 12 6 | 12 5 | 8.7 3.4 | 1.3 1.2 | 20 6 | 0.18 0.10 |
| Ch.misID | 6.9 1.3 | 7.1 1.7 | — | 0.24 0.03 | — | — |
| Other | 0.81 0.22 | 2.2 0.6 | 1.4 0.4 | 0.63 0.15 | 3.3 0.8 | 0.12 0.05 |
| Total background | 25 6 | 38 6 | 20 4 | 4.8 1.4 | 43 7 | 1.46 0.25 |
| ttH (SM) | 2.0 0.5 | 4.8 1.0 | 2.9 0.6 | 1.43 0.31 | 6.2 1.1 | 0.59 0.10 |
| Data | 26 | 59 | 31 | 14 | 46 | 0 |
8 ttH () Analysis
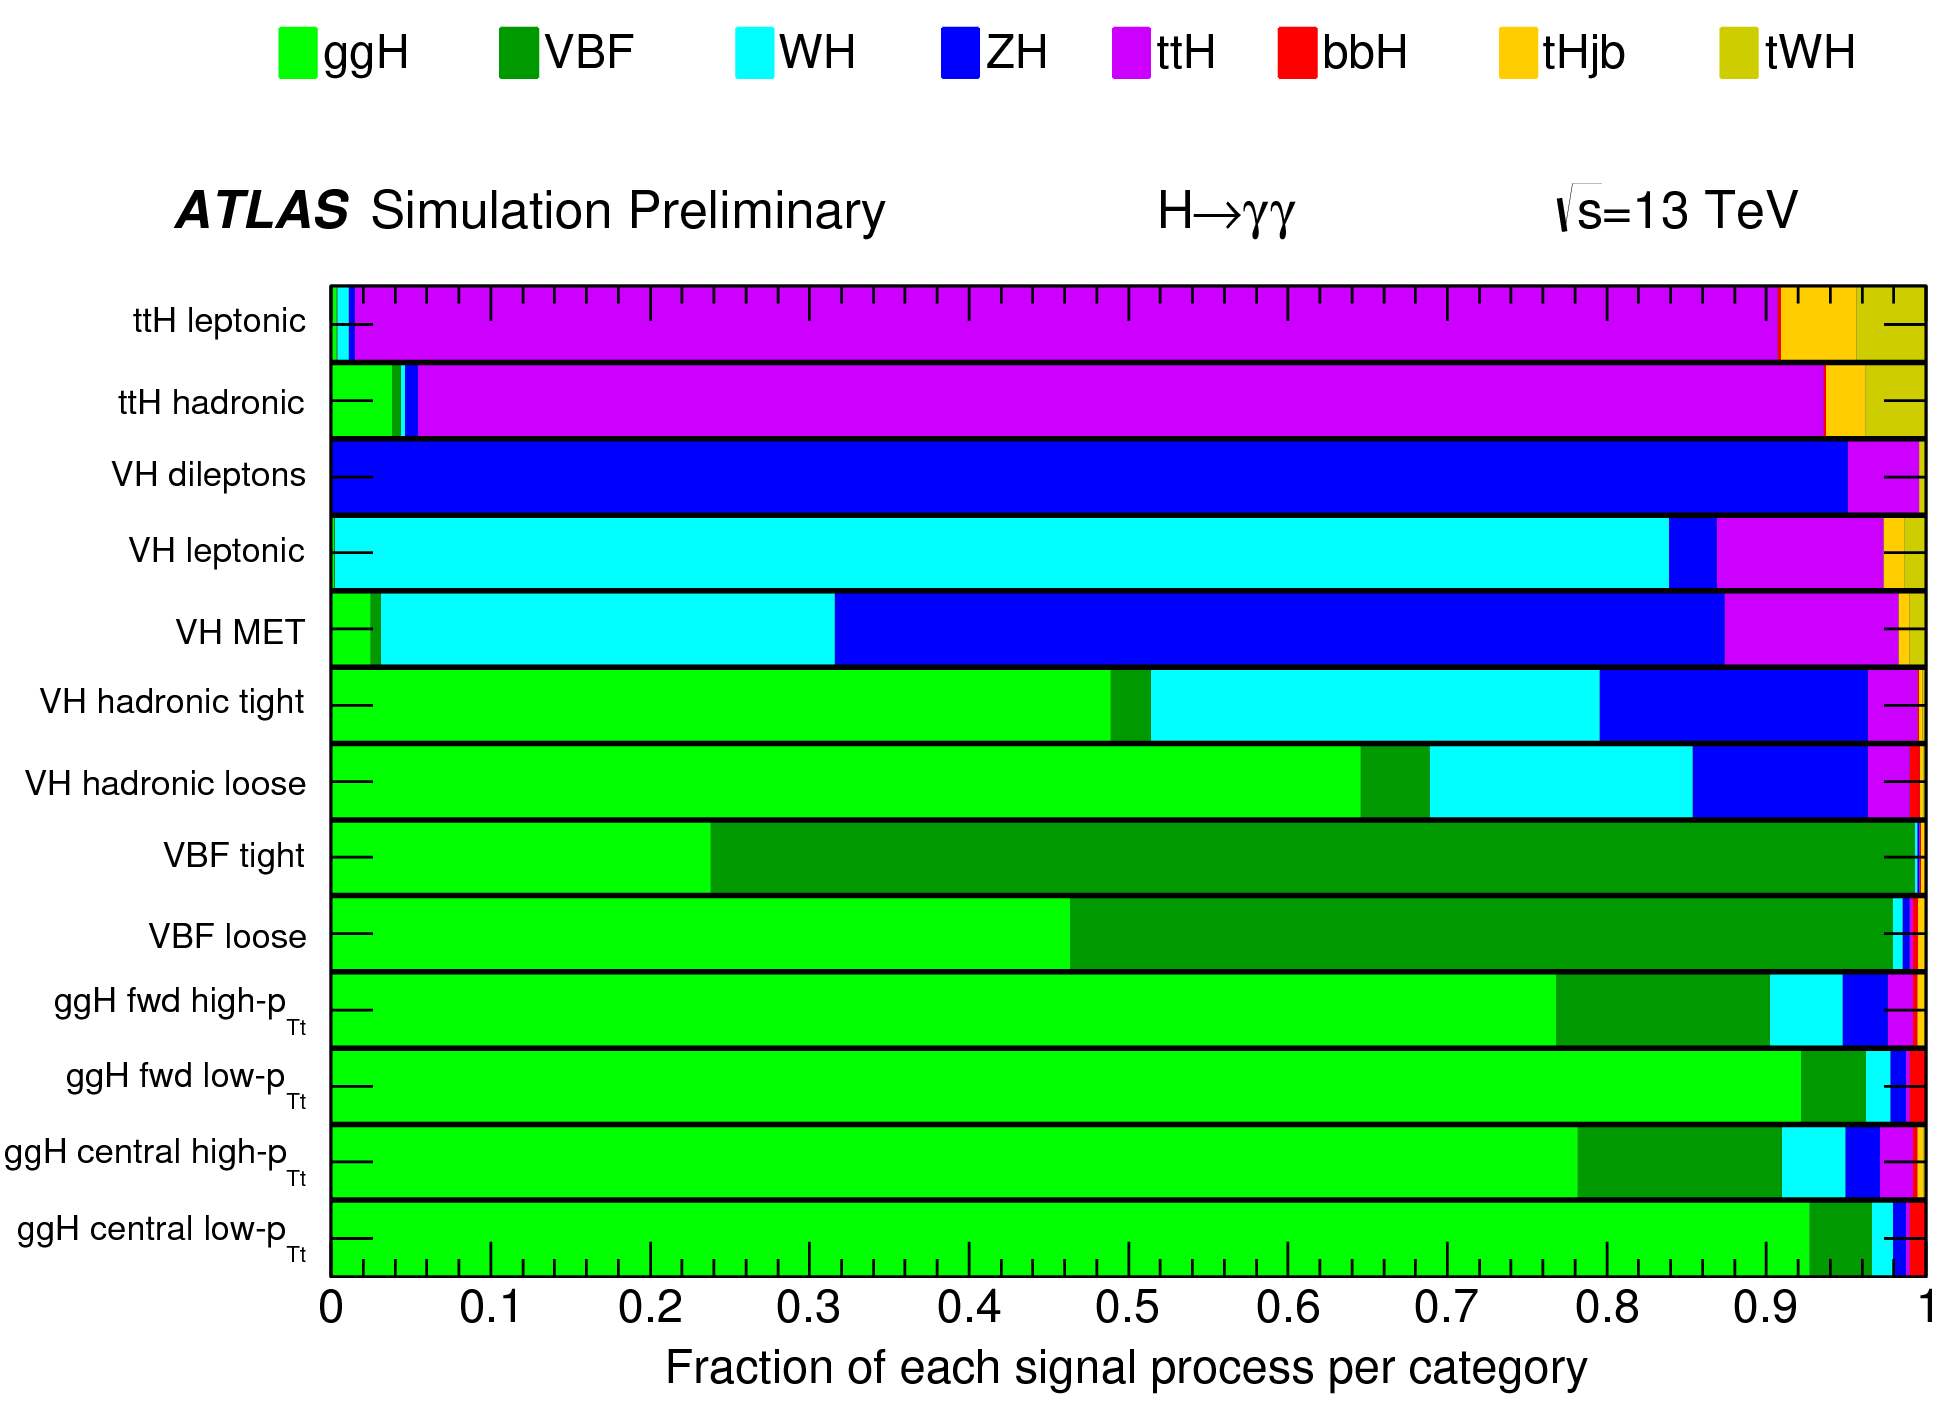
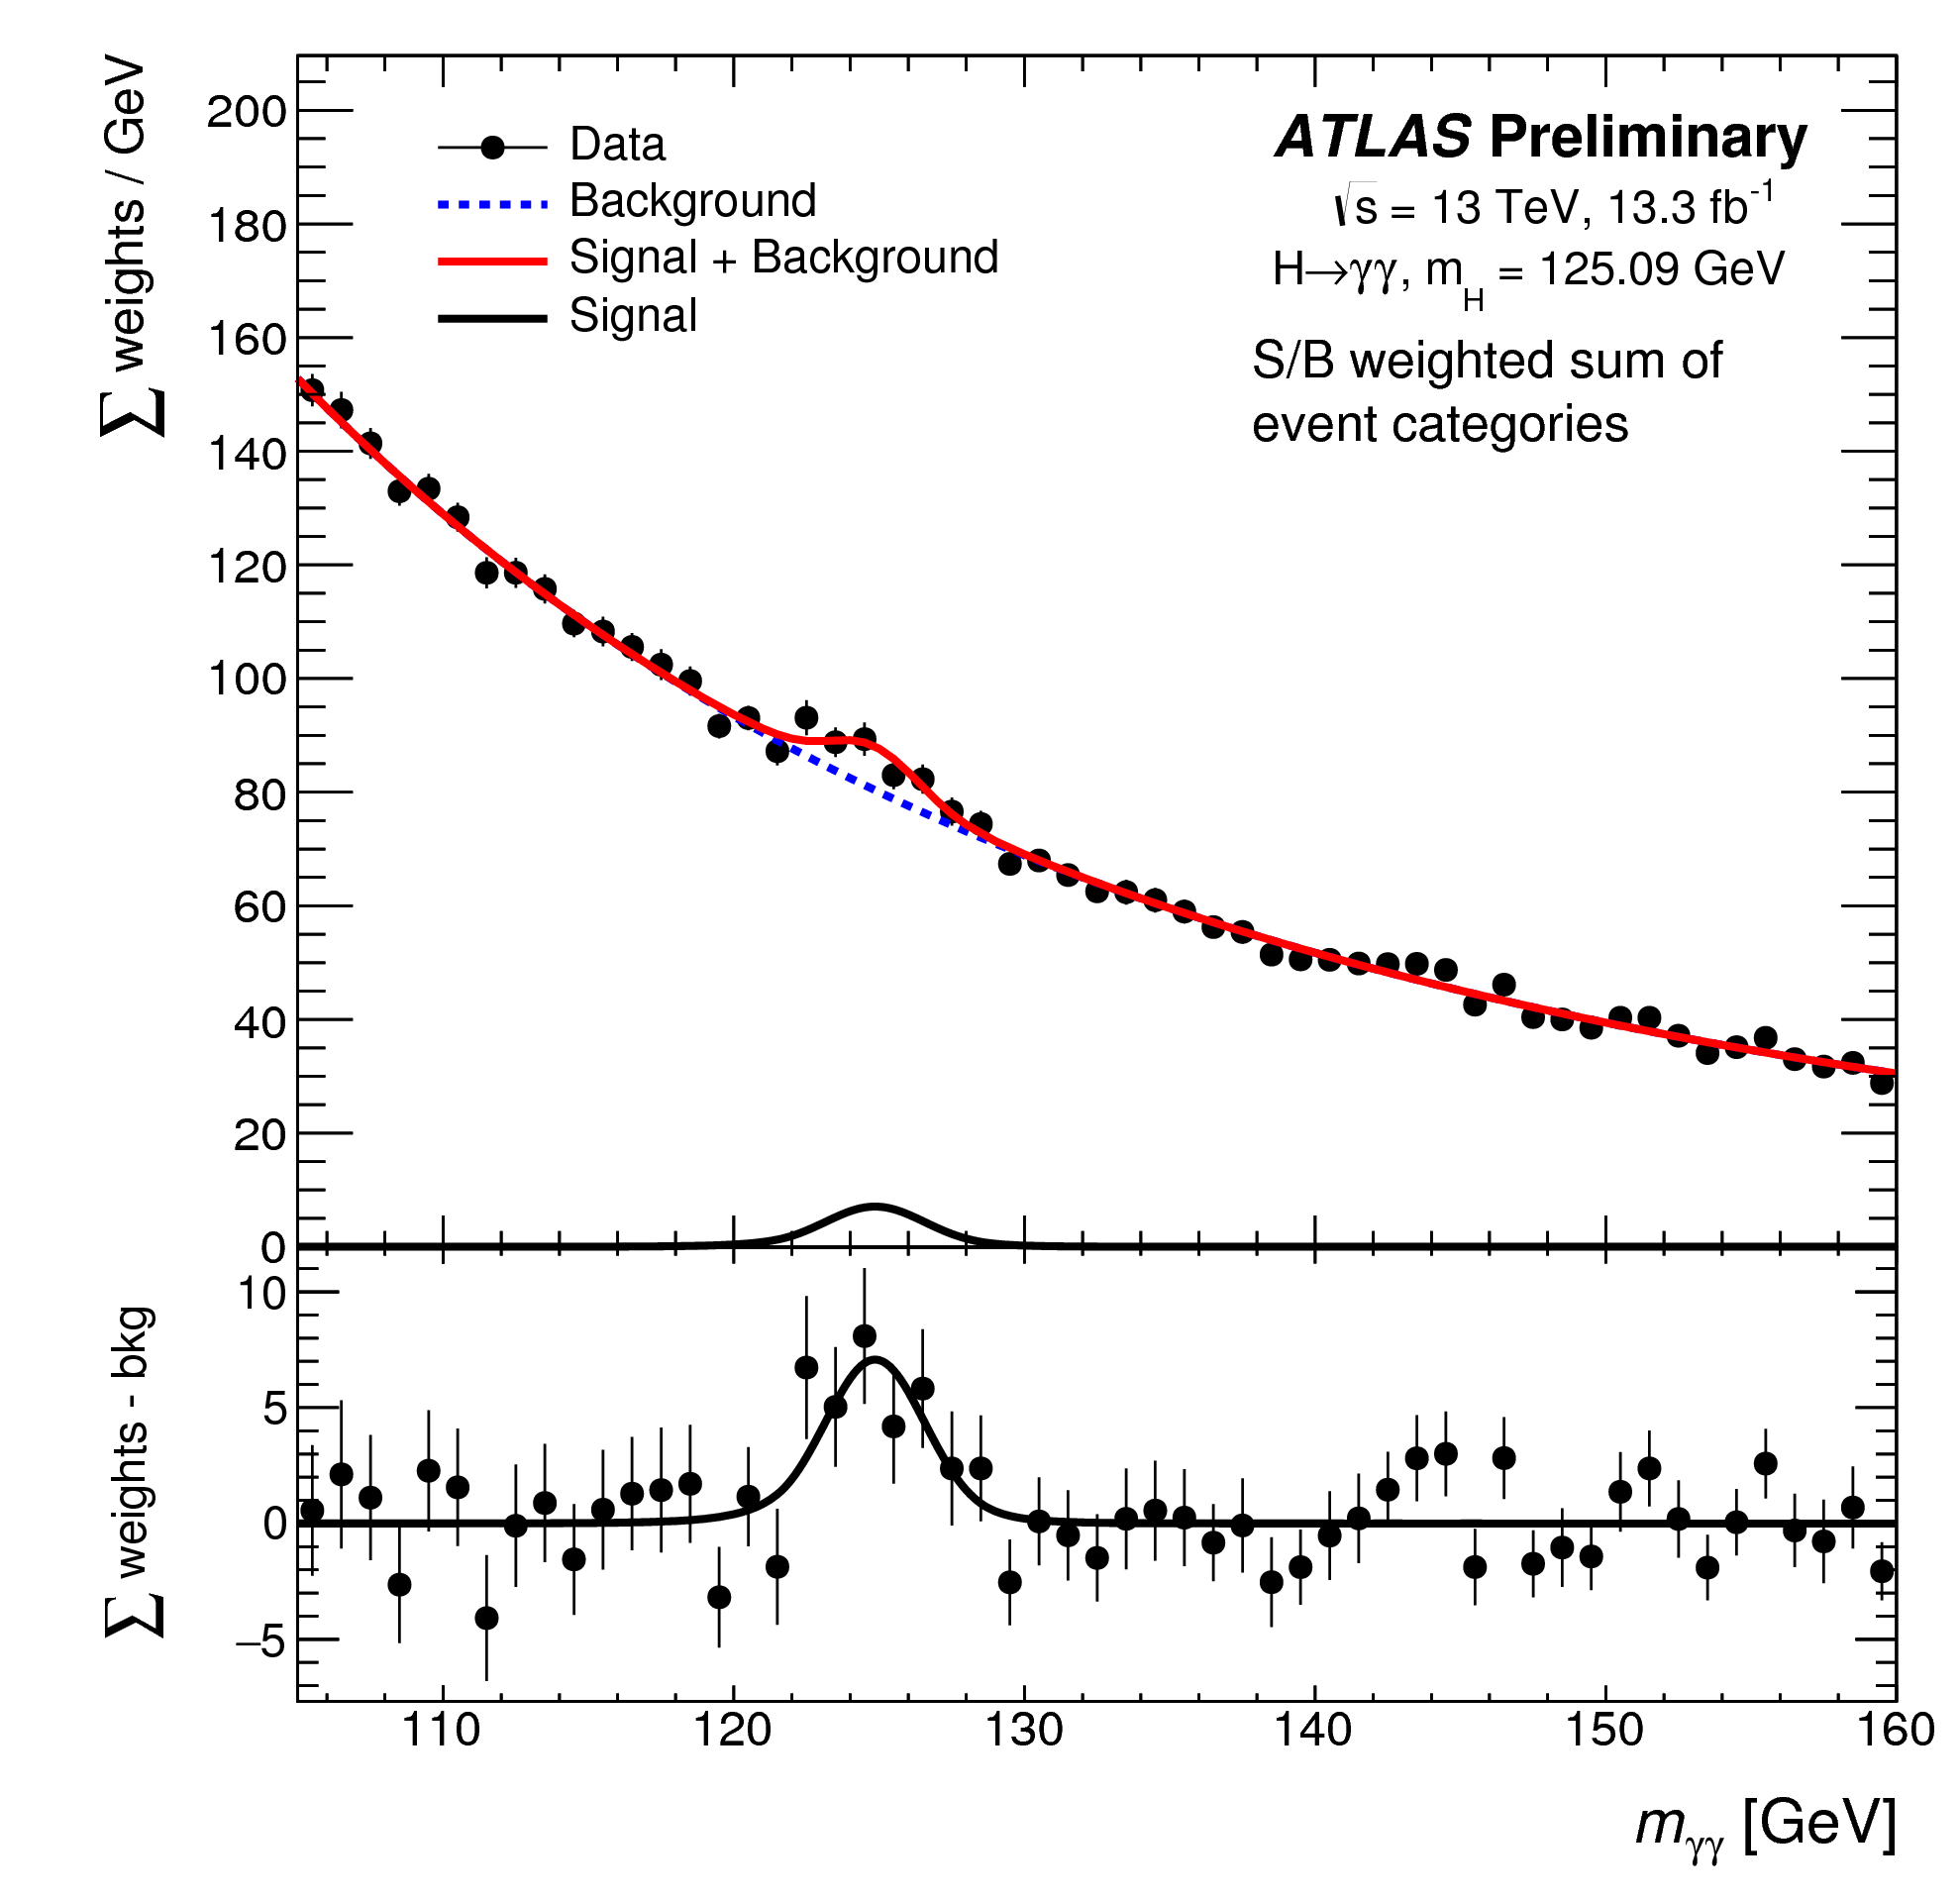
Owing to the excellent photon energy resolution of the ATLAS calorimeter, the Higgs boson signal manifests itself as a narrow peak in the diphoton invariant mass spectrum on top of a smoothly falling background, and the Higgs boson signal yield can be measured using an appropriate fit. The search for ttH () in the initial LHC Run-2 data [11] follows the Run-1 strategy, and is performed in two categories, one with associated leptons and one with associated hadrons. In both categories the ttH contents is above 90% among all Higgs boson production modes, as shown in Fig. 11 (from [11]).
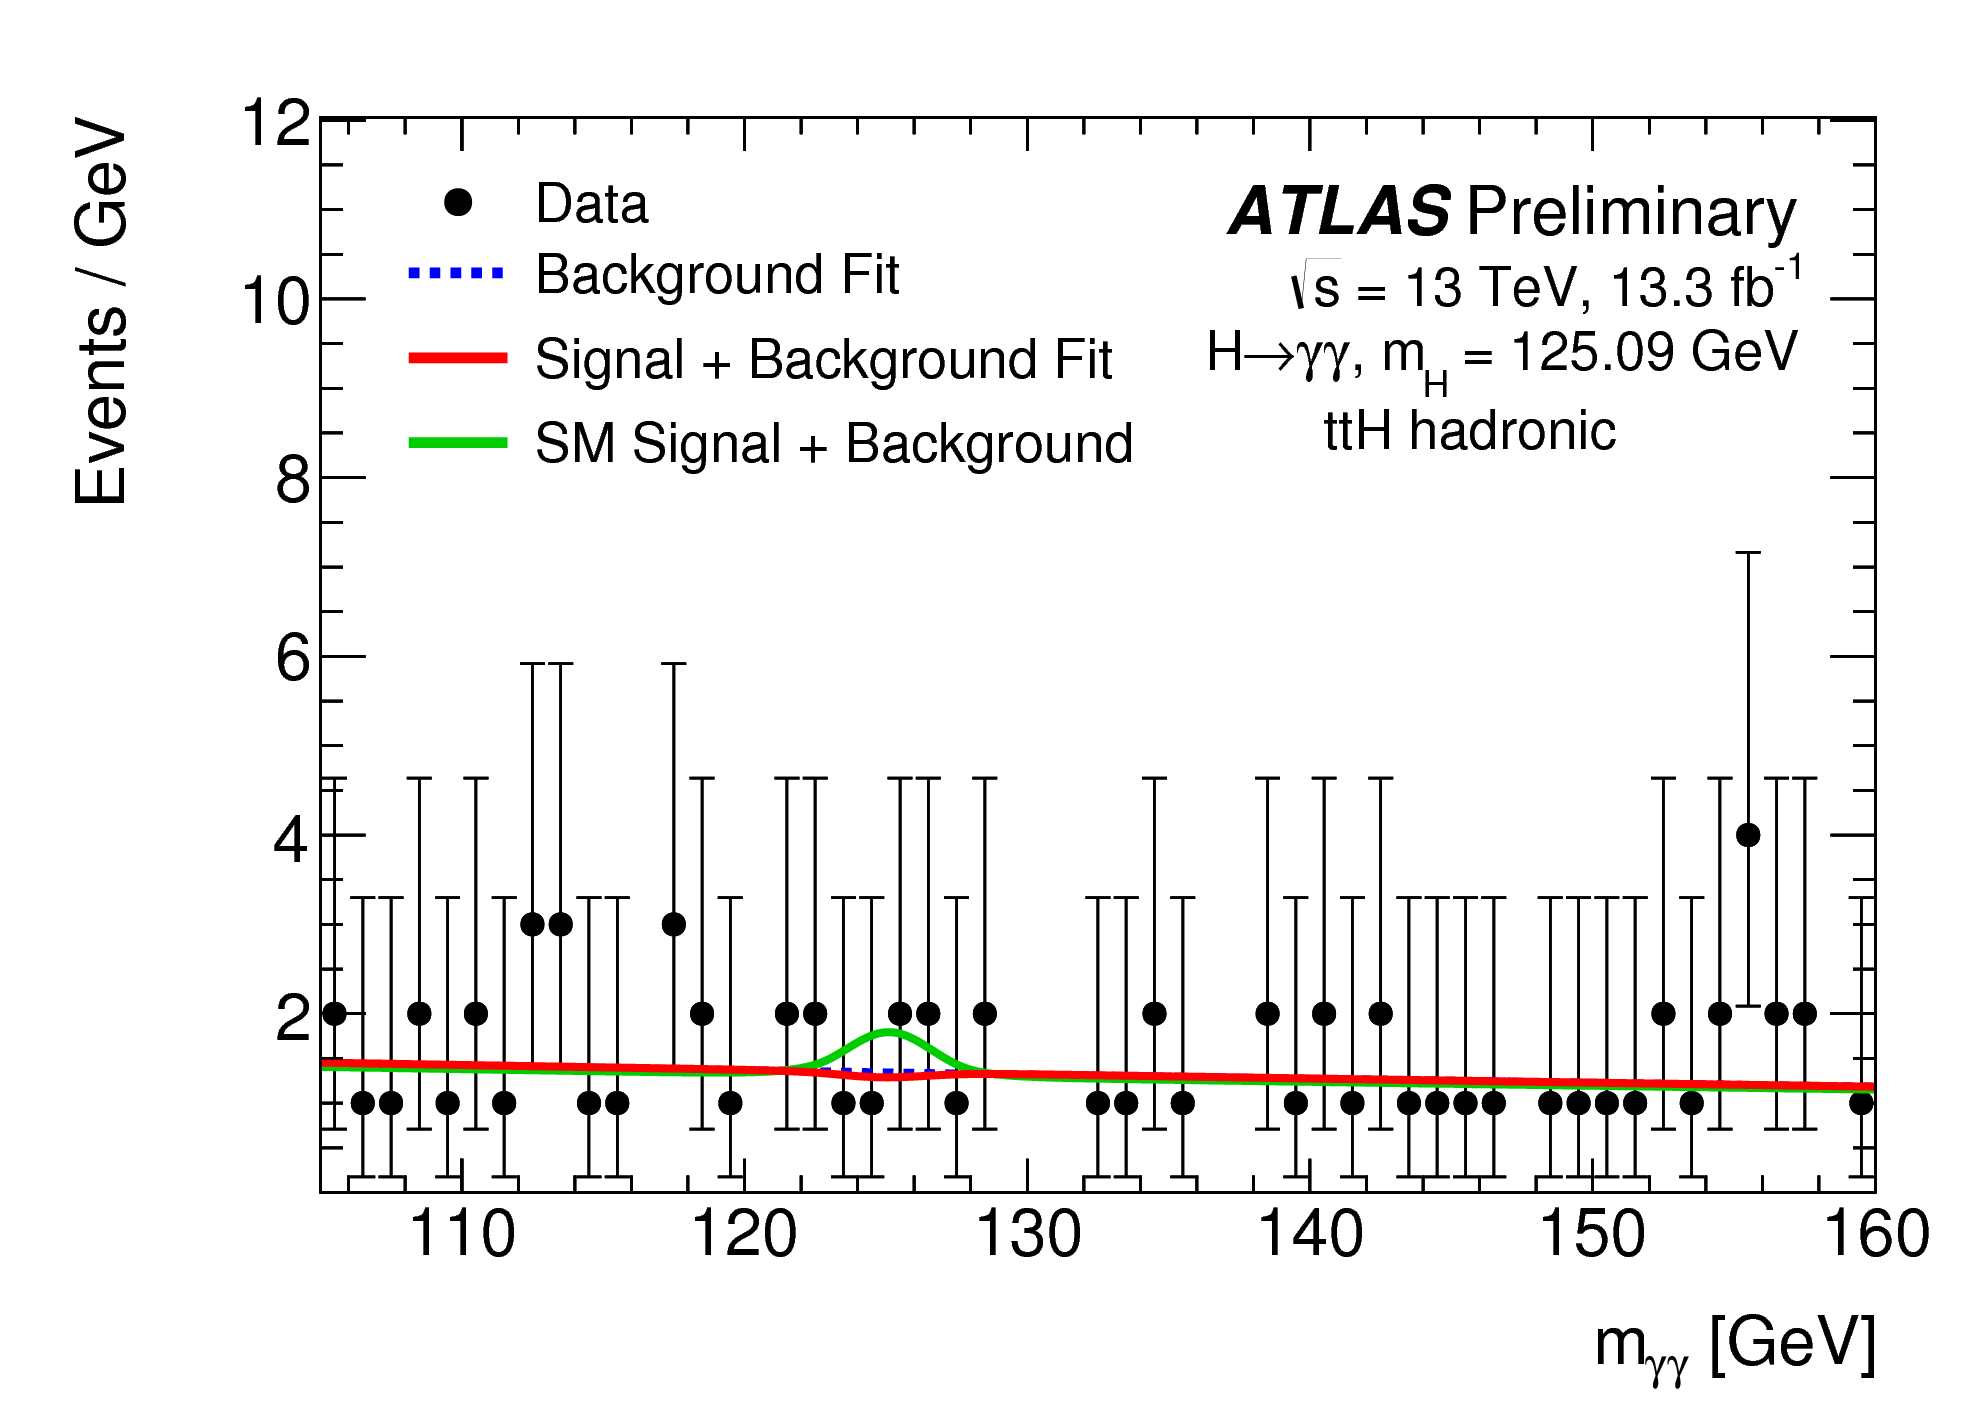
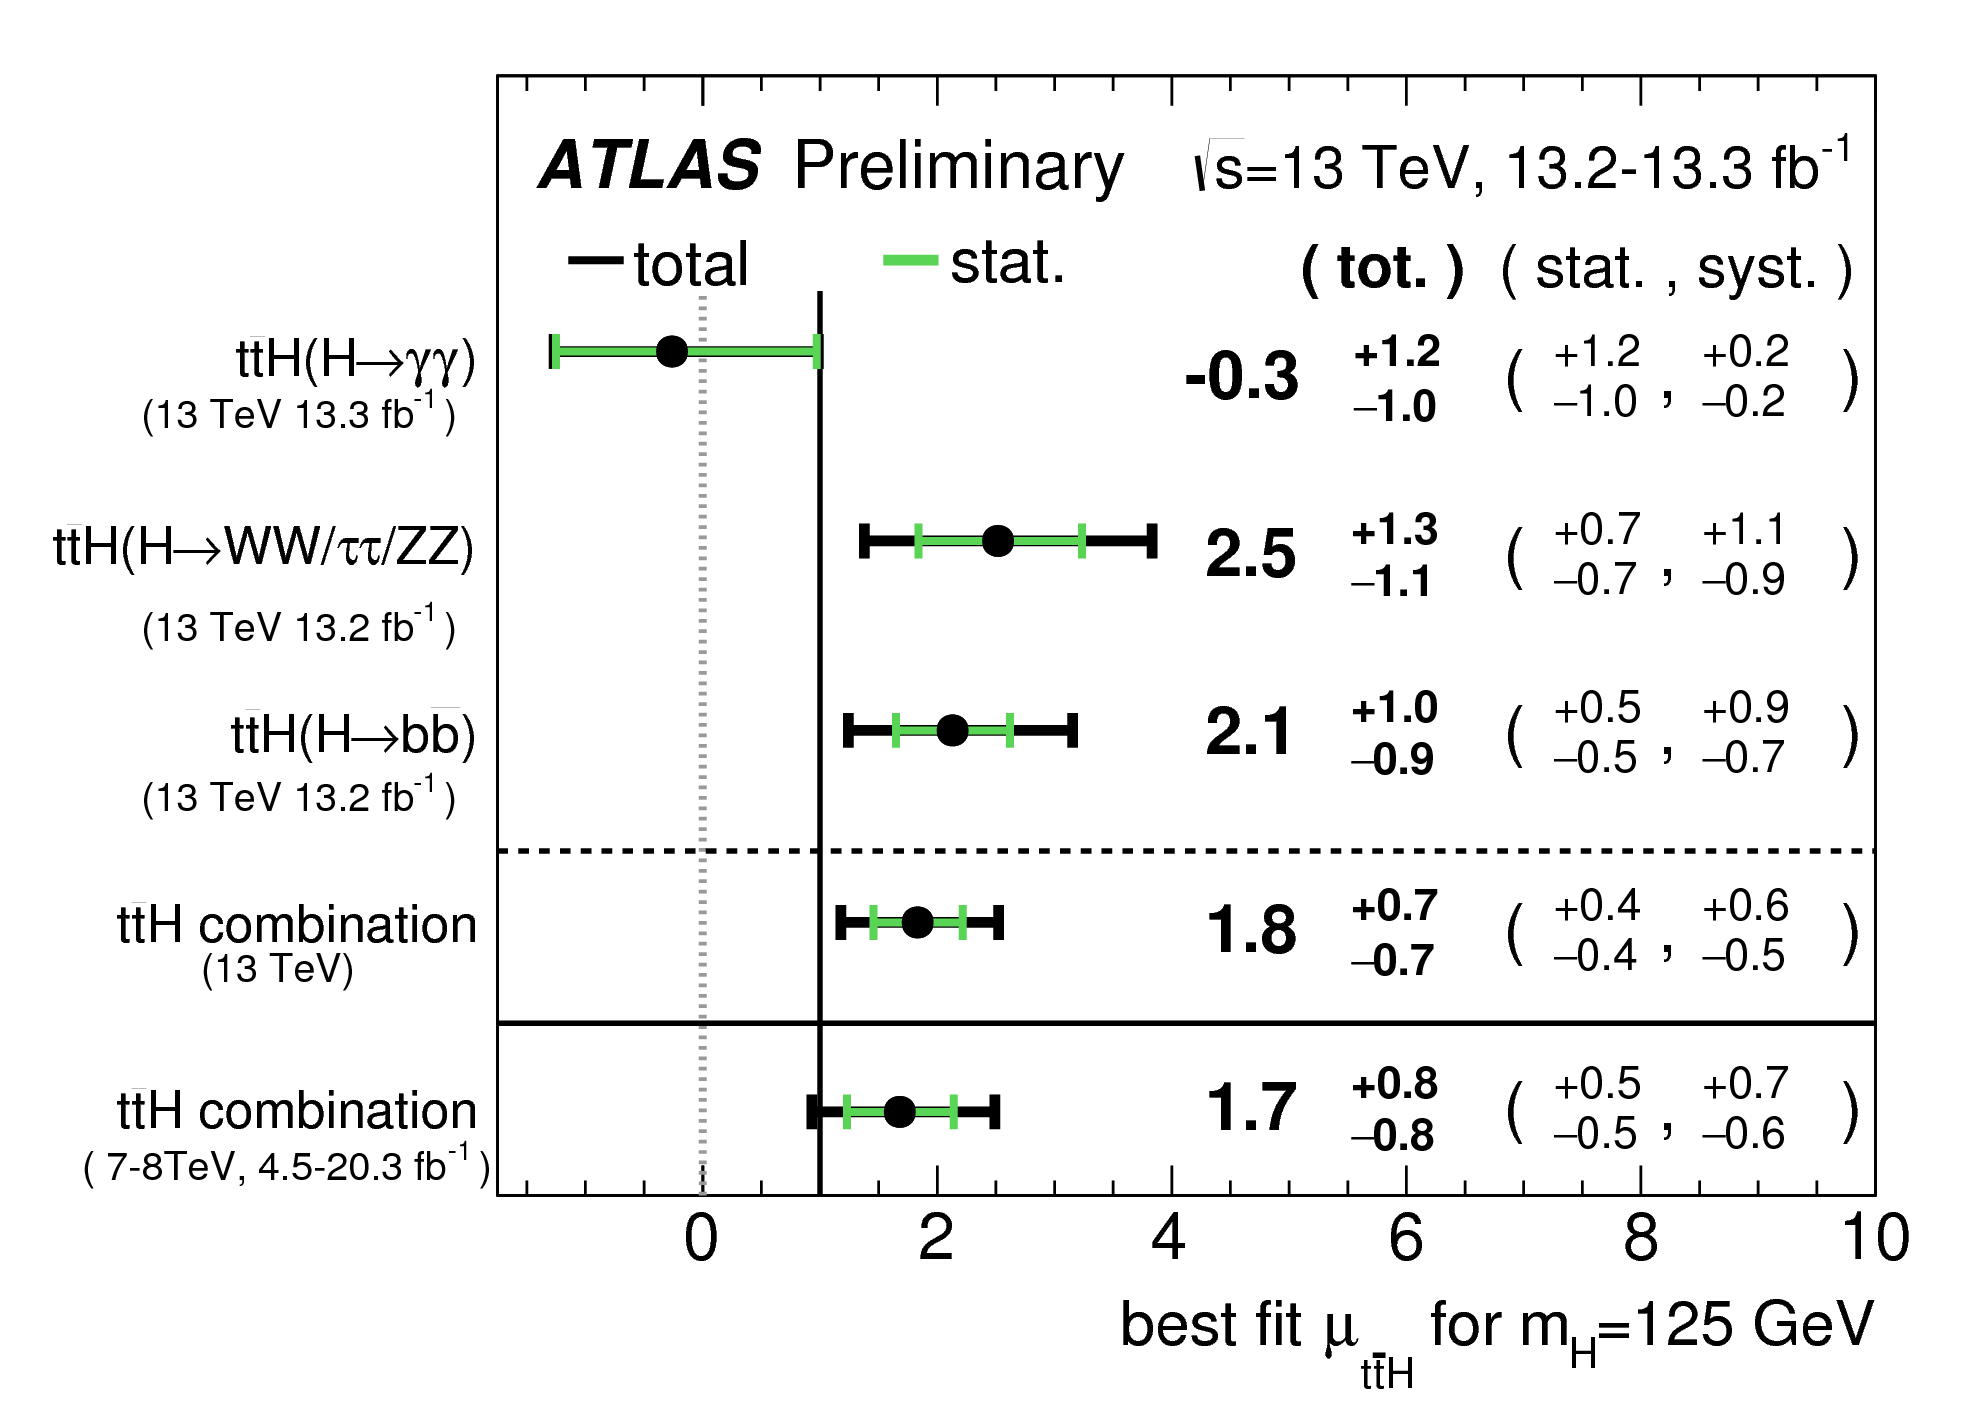
The Higgs boson mass peak in the diphoton invariant mass distribution is clearly visible combining all production modes (Fig. 11 from [11]). Figure 12 (from [11]) illustrates that in both the ttH associated leptonic and hadronic production modes, the current statistics is too small to observe a peak in the diphoton mass spectrum. Table 4 (from [12]) lists signal, background and data events. The signal strength is shown in Fig. 13 (from [12]) for ttH () together with the results from the other Higgs boson decay modes.
| Category | ttH (S) | Background (B) | tHqb+WtH | S/B | Data |
|---|---|---|---|---|---|
| all-hadronic | 1.58 | 8.27 | 0.10 | 0.19 | 9 |
| leptonic | 1.16 | 2.42 | 0.10 | 0.48 | 2 |
9 ttH Initial Run-2 Results and Comparison with Run-1 Results
The results of the ttH (multilepton) and ttH () searches are shown in Fig. 13 (from [12]) together with the results from the () search [13]. The uncertainties in the ttH (multilepton) search are dominated by the systematic uncertainties arising from non-prompt background (heavy-flavor), mis-reconstruction of electric charge, and irreducible background (diboson, ttW, ttZ simulation). With the increasing statistics from the growing dataset, these uncertainties will be reduced, together with the statistical uncertainties. In the ttH () search, an analytic function is used to fit the data sidebands in order to estimate the continuum background. The resulting systematic uncertainty is much smaller than the statistical uncertainty, and the increase of analysed data will directly lead to a significant reduction of the total uncertainty.
The ATLAS measurement of with the initial LHC Run-2 data agrees very well with the result obtained with the complete LHC Run-1 dataset, both for the mean value and its upper limit, as summarized in Fig. 13 (from [12]).
10 Conclusions
The direct ttH measurement is the key to determine the top Yukawa coupling independent of the physics in the gluon-Higgs sector. Several analysis channels contribute sensitivity. The excellent initial (2015 and 2016) LHC Run-2 operation and the efficient ATLAS detector operation allowed to record about 39 fb-1 data of which about 13 fb-1 are analysed up to now. The ttH multilepton and diphoton analyses do already have a higher sensitivity with initial Run-2 data if compared to the complete Run-1 results. There is no significant deviation from the SM expectation. The initial Run-2 results are very well in agreement with the Run-1 results, both having a mild data excess. The prospects of increasing the measurement precision with the full Run-2 dataset are excellent. This could lead to strong exclusions of models predicting non-SM ttH rates or an indication of New Physics.
Acknowledgments
I would like the thank the colleagues from the ATLAS and CMS Higgs working groups, and the theorists and phenomenologists present at the conference for the fruitful discussions, as well as the organizers of HC2016 for their invitation and hospitality. The project is supported by the Ministry of Education, Youth and Sports of the Czech Republic under projects number LG 15052 and LM 2015058.
References
References
- [1] F. Bezrukov and M. Shaposhnikov, Why should we care about the top quark Yukawa coupling?, J. Exp. Theor. Phys. 120 (2015) 335 [Zh. Eksp. Teor. Fiz. 147 (2015) 389].
- [2] ATLAS Collaboration, The ATLAS Experiment at the CERN Large Hadron Collider, JINST 3 S08003 (2008) 166.
- [3] CMS Collaboration, The CMS experiment at the CERN LHC, JINST 3 (2008) S08004.
- [4] ATLAS and CMS Collaborations, Measurements of the Higgs boson production and decay rates and constraints on its couplings from a combined ATLAS and CMS analysis of the LHC pp collision data at and 8 TeV, JHEP 1608 (2016) 045.
- [5] J. Ellis and T. You, Updated global analysis of Higgs couplings, JHEP 06 (2013) 103.
- [6] ATLAS Collaboration, Measurement of Higgs boson production in the diphoton decay channel in pp collisions at center-of-mass energies of 7 and 8 TeV with the ATLAS detector Phys. Rev. D 90 (2014) 112015.
- [7] D. de Florian et al., LHC Higgs Cross-Section Working Group Collaboration, Handbook of LHC Higgs Cross-Sections: 4. Deciphering the Nature of the Higgs Sector, arXiv:1610.07922.
-
[8]
https://twiki.cern.ch/twiki/bin/view/AtlasPublic/LuminosityPublicResultsRun2
- [9] ATLAS Collaboration, Measurement of the Inelastic Proton-Proton Cross-Section at TeV with the ATLAS Detector at the LHC, Phys. Rev. Lett. 117 (2016) 182002.
- [10] ATLAS Collaboration, Search for the Associated Production of a Higgs Boson and a Top Quark Pair in Multilepton Final States with the ATLAS Detector, ATLAS-CONF-2016-058.
- [11] ATLAS Collaboration, Measurement of fiducial, differential and production cross-sections in the decay channel with 13.3 fb-1 of 13 TeV proton-proton collision data with the ATLAS detector, ATLAS-CONF-2016-067.
- [12] ATLAS Collaboration, Combination of the searches for Higgs boson production in association with top quarks in the , multilepton, and decay channels at TeV with the ATLAS detector, ATLAS-CONF-2016-068.
- [13] ATLAS Collaboration, Search for the Standard Model Higgs boson produced in association with top quarks and decaying into a bb pair in pp collisions at TeV with the ATLAS detector, ATLAS-CONF-2016-080.