Dust Scattering from the Taurus Molecular Cloud
Abstract
We present an analysis of the diffuse ultraviolet (UV) emission near the Taurus Molecular Cloud based on observations made by the Galaxy Evolution Explorer (GALEX). We used a Monte Carlo dust scattering model to show that about half of the scattered flux originates in the molecular cloud with 25% arising in the foreground and 25% behind the cloud. The best-fit albedo of the dust grains is 0.3 but the geometry is such that we could not constrain the phase function asymmetry factor ().
keywords:
Taurus Molecular Cloud, ultraviolet: ISM1 Introduction
The Taurus Molecular Cloud (TMC) is part of the larger Taurus-Auriga complex of molecular clouds which extends over more than 100 square degrees in the sky. It is one of the nearest star forming regions at a distance of only 140 pc from the Sun with a thickness of around 20 pc (Kenyon et al., 1994; Loinard et al., 2005; Lombardi et al., 2010). Although it is near the Galactic Plane (b -14), there is little dust either in front of or behind the molecular cloud (Padoan et al., 2002; Lombardi et al., 2010). The TMC has been studied intensively at many different wavelengths and has provided a laboratory for the study of molecular cloud evolution and star formation in fine spatial and spectral detail.
High resolution optical maps show that the TMC is comprised of loosely associated diffuse filaments mixed with highly clumpy molecular cores (Panopoulou et al., 2014). The clumpy molecular gas cores in TMC have a density of about few hundred (Pineda et al., 2010) and produce very few low mass stars (Whittet et al., 2004; Palmeirim et al., 2013) with a stellar density of about 1 - 10 stars pc-3 (Luhman, 2000). In contrast to other star-forming regions such as Orion or Ophiuchus, the TMC is quiet with a low rate of star formation (Kenyon & Hartmann, 1995) and no massive stars and hence no ionizing radiation (Walter & Boyd, 1991).
The first diffuse UV studies of the TMC were made by Hurwitz (1994) using the BEST (Berkeley Extreme Ultraviolet Shuttle Telescope) instrument, which flew on the Space Shuttle (STS-61C) in 1986 as part of the UVX payload. He observed both continuum emission due to starlight scattered by interstellar dust and emission lines from H2 fluorescence. The continuum emission was inversely correlated with the optical depth suggesting that the diffuse background originated behind and was shadowed by the dense molecular cloud; a conclusion later supported by observations from the SPEAR/FIMS instrument (Lee et al., 2006).
We have used observations made by the Galaxy Evolution Explorer (GALEX) in two bands (far-ultraviolet (FUV: 1350 - 1750 Å) and near-ultraviolet (NUV: 1750 - 2850 Å)) to study the diffuse UV radiation in and around the TMC. We will describe the observations and our modelling below. Lim et al. (2013) performed a similar analysis for a much larger region (the entire Taurus-Perseus-Auriga complex of molecular clouds). However, that included areas with quite different physical properties and we have chosen to focus on the TMC.
2 Data
GALEX, a NASA Small Explorer mission, was launched on April 28, 2003 with the primary goal of studying galaxy evolution at low red-shift (Martin et al., 2005) and completed its mission on June 28, 2013 (Bianchi, 2014). The final data set of GALEX includes more than 44,000 observations (Murthy, 2014b) in two ultraviolet bands. The data products from each observation have been described by Morrissey et al. (2007) and are archived at the Mikulski Archive for Space Telescopes (MAST).
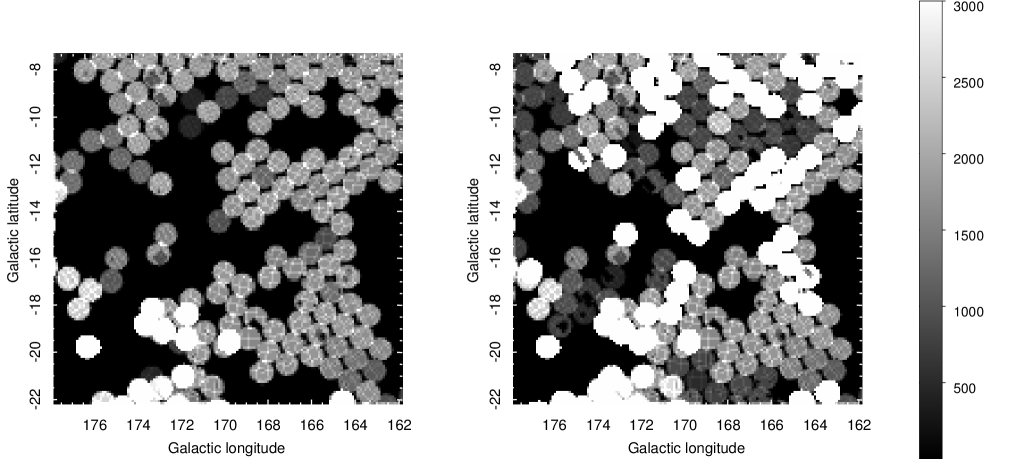
We have shown an exposure time map of the observed region in the FUV and the NUV bands in Fig. 1. There were a total of 159 FUV and 258 NUV visits near the TMC region taken over a range of 9 years from 2003 to 2012 (2003 – 2007 for the FUV). Most of the observations were taken as part of the AIS (All-sky Imaging Survey) with an exposure time of about 100 seconds per visit but with a few observations for specific science programs (eg Findeisen & Hillenbrand, 2010) with correspondingly greater exposure times. Murthy (2014b) has calculated the diffuse Galactic background (DGL) values over the entire sky by masking out point sources and binning to a resolution of and these data are available from the MAST archive111https://archive.stsci.edu/prepds/uv-bkgd/.
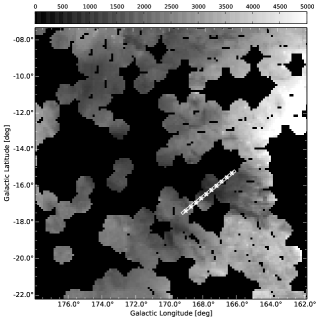
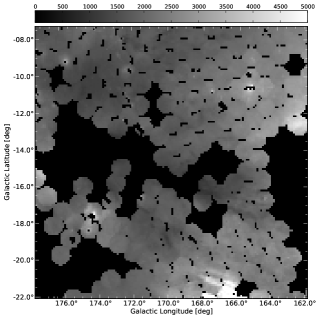
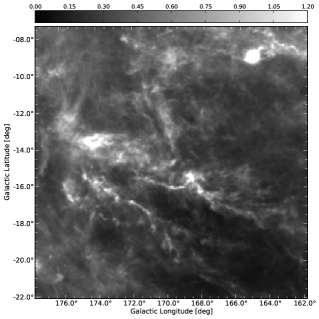
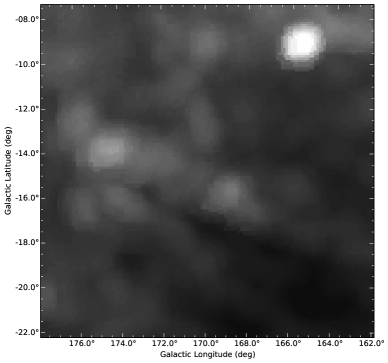
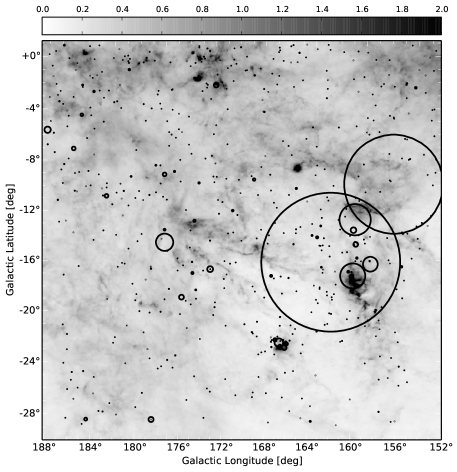
We have downloaded all the data within 8 degrees of the nominal centre of the TMC (170.0, -14.0) and binned into 6 bins, weighting each observations by its exposure time. Edge effects contaminate the outer part of the GALEX detector and we have only used the central (radius) of each observation. The resultant maps of the TMC in the FUV and the NUV are shown in Fig. 2 along with the extinction map derived from Planck observations (Planck Collaboration et al., 2014). There were no observations over significant parts of the TMC, partly because of safety concerns for the instrument (Findeisen & Hillenbrand, 2010) and partly because of the failure of the FUV power supply.

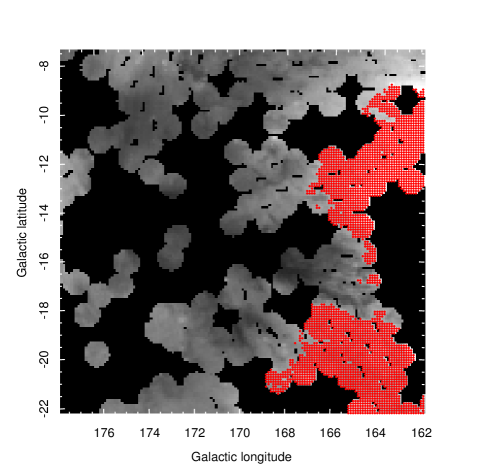

There is a strong correlation (r 0.9) between the FUV and the NUV (Fig. 3). However, it is readily apparent that there is no correlation between the extinction and the diffuse UV background; rather, the UV images appear to be brighter to the right of the field where the extinction is least. This is borne out by a weak anti-correlation between the E(B-V) and the FUV (r = -0.25) and the E(B-V) and the NUV (r = -0.24). A more detailed examination of the data suggests that there exist two separate regions, demarcated in Fig. 4 where the points in red are those that fall above the line in Fig. 5. There is a positive correlation between the E(B - V) and the UV (FUV: r = 0.69; NUV: r = 0.51) in this region. The remaining region, which encompasses most of the TMC, has a negative correlation of r=-0.36 between the E(B - V) and the FUV and r=-0.46 between the NUV and the E(B-V), as might be expected if the radiation were shadowed by the dust in the TMC.
The first observations of the diffuse UV in the TMC was done by Hurwitz (1994) using the UVX instrument on the Space Shuttle followed by observations made by using the SPEAR/FIMS (Lee et al., 2006; Lim et al., 2013). They observed the same anti-correlation between the reddening and the UV flux and interpreted this as due to the shadowing of a distant diffuse background by the molecular cloud. We will explore this in the next section.
3 Modelling
Murthy (2016) has implemented a Monte Carlo model to predict the level of dust scattered radiation throughout the Galaxy. He used stars from the Hipparcos catalog (Perryman et al., 1997) along with model spectra for each spectral type (Castelli & Kurucz, 2004) as sources for the stellar photons. Although we are interested only in the emission from the vicinity of the TMC, we have found that many of the scattered photons are from multiply scattered photons from outside the TMC and have therefore modelled the entire Galaxy, but with more detail in the vicinity of the TMC.
We have modelled the Galaxy as a 500x500x500 grid with a bin size of 2 pc on a side and filled with a hydrogen density of 1 cm-3 at the Galactic Plane falling off with a scale height of 125 pc (Marshall et al., 2006) from the plane. We calculated an optical depth for each bin using the cross-section per hydrogen atom tabulated by Draine (2003) for “Milky Way” dust. Welsh et al. (2010) have found that there is a cavity of radius 80 pc (the Local Bubble) around the Sun and we have incorporated this in the dust model. However, this does not account for the complex structure in the TMC and we have separately modelled the dust in that region.
| HIP number | l | b | Spectral | V mag222From SIMBAD. | Distance333From Hipparcos catalogue. | % Total Flux 444At constant a =0.3 and at 1500 Å | ||
|---|---|---|---|---|---|---|---|---|
| () | () | type | (pc) | |||||
| g=0.0 | g=0.5 | g=0.7 | ||||||
| 18246 | 162.3 | -16.7 | B1 | 2.84 | 301 | 7.7 | 14.7 | 23.8 |
| 18532 | 157.4 | -10.1 | B1.5 | 2.89 | 165 | 7.7 | 10.2 | 7.2 |
| 26727 | 206.5 | -16.6 | O9.7 | 1.79 | 226 | 4.3 | 4.3 | 2.2 |
| 24661 | 166.2 | 2.2 | — | 11.6 | 211 | 3.1 | 4.1 | 0.0 |
| 26311 | 205.2 | -17.2 | B0 | 1.69 | 412 | 2.7 | 3.8 | 2.3 |
| 25930 | 203.9 | -17.7 | B0 | 2.41 | 281 | 2.3 | 2.8 | 1.5 |
| 27366 | 214.5 | -18.5 | B0.5 | 2.06 | 221 | 2.3 | 1.7 | 0.8 |
| 4427 | 123.6 | -02.2 | B0.5 | 2.39 | 188 | 2.3 | 1.2 | 0.5 |
| 21881 | 176.7 | -15.1 | B3 | 4.26 | 123 | 2.2 | 1.8 | 2.0 |
| 24436 | 209.2 | -25.3 | B8 | 0.13 | 237 | 1.6 | 1.3 | 0.9 |
| 17448 | 160.4 | -17.7 | B1 | 3.84 | 452 | 1.3 | 2.6 | 4.6 |
| 17702 | 166.7 | -23.5 | B7 | 2.85 | 113 | 1.3 | 0.9 | 0.8 |
| 25336 | 196.9 | -16.0 | B2 | 1.64 | 75 | 1.3 | 0.3 | 0.2 |
| 26451 | 185.7 | -5.6 | B1 | 3.03 | 136 | 1.2 | 0.6 | 0.5 |
| 60718 | 300.1 | -0.4 | B1 | 0.81 | 98 | 1.2 | 0.3 | 0.1 |
| 18614 | 160.4 | -13.1 | O7.5 | 4.01 | 544 | 1.1 | 3.3 | 4.0 |
| 18724 | 178.4 | -29.4 | B3 | 3.41 | 114 | 1.1 | 0.5 | 0.0 |
| 30324 | 226.1 | -14.3 | B1 | 1.97 | 153 | 1.0 | 0.4 | 0.2 |
| 68702 | 311.8 | 1.3 | B1 | 0.60 | 161 | 1.0 | 0.3 | 0.1 |
| 26207 | 195.1 | -12.0 | O8 | 3.66 | 324 | 0.8 | 1.4 | 0.9 |


We first used the 3-dimensional extinction map of Green et al. (2015) (GSF hereafter) to characterize the dust distribution in the region finding that the bulk of the dust is found between 140 and 200 pc in reasonable agreement with the 140 – 160 pc from earlier results (Kenyon et al., 1994; Torres et al., 2007; Lombardi et al., 2010). However, the total column density is greater than that derived from the Planck data (Planck Collaboration et al., 2014) (Fig. 6). The GSF measurements are along specific lines of sight while the Planck measurements average over the beam of the instrument and the larger values may be an indicator of clumping in the TMC. We have therefore used a second model where we have taken the reddening along any line of sight from the Planck data (Planck Collaboration et al., 2014) and distributed the dust uniformly between 140 - 160 pc (Fig. 7). Although this gives somewhat lower column densities than the GSF data, it does match the extinction measurements of Arce & Goodman (1999). We tested the effects of both models on our derived diffuse flux finding little difference between the two. We therefore continue with only using the dust distribution as given by the Planck model.
As has been standard in studies of interstellar dust, we used the Henyey-Greenstein scattering function (Henyey & Greenstein, 1941) with the albedo (a) and the phase function asymmetry factor(g) as free parameters to determine each scattering.
4 Results
We have run a series of Monte Carlo models to predict the diffuse background in both the FUV and the NUV bands for different combinations of a and g. We used a baseline of 100 million () photons for the entire grid but used simulations with 1 billion () photons for values of and near the best fit values. We cannot compare the models directly to the GALEX data on a pixel by pixel basis because of the noise intrinsic to the Monte Carlo procedure and therefore used the root-mean-square (R.M.S) deviation of the flux as a function of Galactic longitude as a metric of the goodness of fit of the model (Fig. 8). We have plotted the R.M.S. deviations for both the FUV and the NUV as a function of and in Fig. 9 finding that the best fit occurs for an albedo of about 0.3 in both bands. Although this is in agreement with Hurwitz (1994) and Lee et al. (2006) in the same region, it is lower than the albedo found in other parts of the Galaxy (compiled in Table 4 of Murthy (2016)). Witt & Gordon (1996) showed that a clumpy medium, as in the TMC (Panopoulou et al., 2014), gives rise to a lower effective albedo and it is likely that the “true” albedo is greater than our derived value.
We have listed the 20 stars which contribute the most to the diffuse flux at in Table 1. The two stars which contribute the most flux at any value of are near the right edge of Fig. 2 accounting for part of the rise in the UV fluxes to lower longitudes. However, there are enough stars contributing with a range of distances and positions that the dependence on is washed out, as was found by Gordon et al. (1994) in the upper Scorpius region. We have adopted which is consistent with most observations in the UV (Draine, 2003).


We have run our model with photons for the best fit optical constants () to improve the signal-to-noise and plotted the modelled versus the observed fluxes in Fig. 10, where we have binned the data into bins. The correlation between the observed and modelled FUV is 0.55 with a slope of 0.68 and an offset of 980 ph cm-2 s-1 sr-1 Å-1. The slope for the NUV is 0.48 with an offset of 1360 ph cm-2 s-1 sr-1 Å-1 and a correlation coefficient of 0.51. If we look at these values in the broader context of the diffuse radiation at low latitudes, Murthy (2016) found that there was considerable scatter between the observed reddening and the UV flux, which he attributed to an uncertain dust distribution. We believe that the main source of scatter between our modelled fluxes and the data is the complex structure of the TMC. However, we do find offsets similar to the 700 — 900 ph cm-2 s-1 sr-1 Å-1 found by Murthy (2016) including 200 — 300 ph cm-2 s-1 sr-1 Å-1 from airglow Murthy (2014a), molecular hydrogen fluorescence in the FUV (Hurwitz, 1994; Lim et al., 2013) and a possibly new, unknown component (Henry et al., 2015; Hamden et al., 2013).
Finally, we return to the anti-correlation between the diffuse flux and the reddening observed by Hurwitz (1994) and Lee et al. (2006), which they interpreted as scattering from a more distant diffuse source extincted by the TMC. Our data agree with both the UVX observations of Hurwitz (1994) (Fig. 11) and the SPEAR observations of Lee et al. (2006) but we believe that the actual situation is more complex. At least part of the brightening to lower longitudes is coincidental because the two strongest contributing stars (Table 1) are near a longitude of 160∘ (Fig. 12) where the reddening is less (Fig. 13). These two B stars (HIP 18246 and HIP 18532) contribute 45% of the flux at a Galactic longitude less than 165.
Our model predicts that about 25% of the total scattered flux is from dust in front of the TMC and another 25% behind the cloud with the remaining 50% arising in the TMC itself (Fig. 14), as might be expected given that almost all of the dust is in the TMC. However, our model is not well-suited to explore the scattering within a dense molecular cloud where clumping may be important. HIP 18246 is behind the TMC, as well as the other bright stars which make much of the field unobservable by GALEX (Findeisen & Hillenbrand, 2010), and much of the flux from within the molecular cloud is due to the scattering of the light from those stars by dust within the cloud. Self-shielding within the cloud, itself, will yield the observed anti-correlation, exacerbated by the coincidental position of the two bright stars at one edge of the field.
5 Conclusions
We have modelled the diffuse radiation in the direction of the TMC using GALEX data with a Monte Carlo model finding an albedo of , but with no constraints on . The albedo is likely to be an underestimate because we do not take clumping into effect.
About half of the scattered radiation originates in the body of the cloud with self-shielding giving rise to an anti-correlation between the observed flux and the reddening. The two brightest stars in the field are located in the direction of least reddening which adds to the anti-correlation.
We find offsets of about 1000 ph cm-2 s-1 sr-1 Å-1 in both bands of which some part may be due to foreground contributors such as airglow and some to an unknown component (Henry et al., 2015).
Acknowledgements
This work is based on the data from NASA’s GALEX spacecraft. GALEX is operated for NASA by the California Institute of Technology under NASA contract NAS5-98034. The dust extinction map obtained from PLANCK (http://www.esa.int/Planck), an ESA science mission with instruments and contributions directly funded by ESA Member States, NASA, and Canada. We thank the anonymous referee for constructive suggestions which has resulted in a better paper. Sathyanarayan would like to thank Dr. Sujatha and Ms. Jyothi for their help during the early stages of this work.
References
- Arce & Goodman (1999) Arce H. G., Goodman A. A., 1999, ApJ, 517, 264
- Bianchi (2014) Bianchi L., 2014, Ap&SS, 354, 103
- Castelli & Kurucz (2004) Castelli F., Kurucz R. L., 2004, ArXiv Astrophysics e-prints
- Draine (2003) Draine B. T., 2003, ApJ, 598, 1017
- Findeisen & Hillenbrand (2010) Findeisen K., Hillenbrand L., 2010, AJ, 139, 1338
- Gordon et al. (1994) Gordon K. D., Witt A. N., Carruthers G. R., Christensen S. A., Dohne B. C., 1994, ApJ, 432, 641
- Green et al. (2015) Green G. M., Schlafly E. F., Finkbeiner D. P., Rix H.-W., Martin N., Burgett W., Draper P. W., Flewelling H., Hodapp K., Kaiser N., Kudritzki R. P., Magnier E., Metcalfe N., Price P., Tonry J., Wainscoat R., 2015, ApJ, 810, 25
- Hamden et al. (2013) Hamden E. T., Schiminovich D., Seibert M., 2013, ApJ, 779, 180
- Henry et al. (2015) Henry R. C., Murthy J., Overduin J., Tyler J., 2015, ApJ, 798, 14
- Henyey & Greenstein (1941) Henyey L. G., Greenstein J. L., 1941, ApJ, 93, 70
- Hurwitz (1994) Hurwitz M., 1994, ApJ, 433, 149
- Kenyon et al. (1994) Kenyon S. J., Dobrzycka D., Hartmann L., 1994, AJ, 108, 1872
- Kenyon & Hartmann (1995) Kenyon S. J., Hartmann L., 1995, ApJS, 101, 117
- Lee et al. (2006) Lee D.-H., Yuk I.-S., Jin H., Seon K.-I., Edelstein J., Korpela E. J., Adolfo J., Min K.-W., Ryu K.-S., Shinn J.-H., van Dishoeck E. F., 2006, ApJ, 644, L181
- Lim et al. (2013) Lim T.-H., Min K.-W., Seon K.-I., 2013, ApJ, 765, 107
- Loinard et al. (2005) Loinard L., Mioduszewski A. J., Rodríguez L. F., González R. A., Rodríguez M. I., Torres R. M., 2005, ApJ, 619, L179
- Lombardi et al. (2010) Lombardi M., Lada C. J., Alves J., 2010, A&A, 512, A67
- Luhman (2000) Luhman K. L., 2000, ApJ, 544, 1044
- Marshall et al. (2006) Marshall D. J., Robin A. C., Reylé C., Schultheis M., Picaud S., 2006, A&A, 453, 635
- Martin et al. (2005) Martin D. C., Fanson J., Schiminovich D., Morrissey P., Friedman P. G., Barlow T. A., Conrow T., Grange R., Jelinsky P. N., Milliard B., Siegmund O. H. W., Bianchi L., Byun Y.-I., Donas J., Forster K., Heckman T. M., Lee Y.-W., Madore B. F., 2005, ApJ, 619, L1
- Morrissey et al. (2007) Morrissey P., Conrow T., Barlow T. A., 2007, ApJS, 173, 682
- Murthy (2014a) Murthy J., 2014a, Ap&SS, 349, 165
- Murthy (2014b) Murthy J., 2014b, ApJS, 213, 32
- Murthy (2016) Murthy J., 2016, ArXiv e-prints
- Padoan et al. (2002) Padoan P., Cambrésy L., Langer W., 2002, ApJ, 580, L57
- Palmeirim et al. (2013) Palmeirim P., André P., Kirk J., Ward-Thompson D., Arzoumanian D., Könyves V., Didelon P., Schneider N., Benedettini M., Bontemps S., Di Francesco J., Elia D., Griffin M., Hennemann M., Hill T., Martin P. G., 2013, A&A, 550, A38
- Panopoulou et al. (2014) Panopoulou G. V., Tassis K., Goldsmith P. F., Heyer M. H., 2014, MNRAS, 444, 2507
- Perryman et al. (1997) Perryman M. A. C., Lindegren L., Kovalevsky J., Hoeg E., Bastian U., Bernacca P. L., Crézé M., Donati F., Grenon M., Grewing M., van Leeuwen F., van der Marel H., Mignard F., Murray C. A., Le Poole R. S., Schrijver H., 1997, A&A, 323
- Pineda et al. (2010) Pineda J. L., Goldsmith P. F., Chapman N., Snell R. L., Li D., Cambrésy L., Brunt C., 2010, ApJ, 721, 686
- Planck Collaboration et al. (2014) Planck Collaboration Abergel A., Ade P. A. R., Aghanim N., Alves M. I. R., Aniano G., Armitage-Caplan C., Arnaud M., Ashdown M., Atrio-Barandela F., et al. 2014, A&A, 571, A11
- Torres et al. (2007) Torres R. M., Loinard L., Mioduszewski A. J., Rodríguez L. F., 2007, ApJ, 671, 1813
- Walter & Boyd (1991) Walter F. M., Boyd W. T., 1991, ApJ, 370, 318
- Welsh et al. (2010) Welsh B. Y., Lallement R., Vergely J.-L., Raimond S., 2010, A&A, 510, A54
- Whittet et al. (2004) Whittet D. C. B., Shenoy S. S., Clayton G. C., Gordon K. D., 2004, ApJ, 602, 291
- Witt & Gordon (1996) Witt A. N., Gordon K. D., 1996, ApJ, 463, 681