Exploiting non-trivial spatio-temporal correlations of thermal radiation for sunlight harvesting
Abstract
The promise of any small improvement in the performance of light-harvesting devices, is sufficient to drive enormous experimental efforts. However these efforts are almost exclusively focused on enhancing the power conversion efficiency with specific material properties and harvesting layers thickness, without exploiting the correlations present in sunlight – in part because such correlations are assumed to have negligible effect. Here we show, by contrast, that these spatio-temporal correlations are sufficiently relevant that the use of specific detector geometries would significantly improve the performance of harvesting devices. The resulting increase in the absorption efficiency, as the primary step of energy conversion, may also act as a potential driving mechanism for artificial photosynthetic systems. Our analysis presents design guidelines for optimal detector geometries with realistic incident intensities based on current technological capabilities.
Thermal light, light correlations, harvesting enhancement
1 Introduction
The discovery of the photoelectric effect [1, 2] initiated the development of sunlight conversion, which, by mimicking nature’s capability to utilize this abundant energy source, is a promising alternative for energy production. The existing photovoltaic technologies have to date, a maximum conversion efficiency between 10% and 46%111The solar conversion efficiency is usually defined for photovoltaic systems as electrical power output (W/cm2) divided by incident solar irradiance (W/cm2) measured over the entire solar spectrum [3, 4]. This definition has been only recently set on equal footing for photosynthetic conversion [3]., acquired with relatively expensive materials[3, 4, 5, 6]. The designs encompass the competing elements of low excitonic recombination and spectrally broad high harvesting cross section. More economical technological alternatives have been proposed, e.g., nano-antennas technology, which for solar frequencies, succeed in conversion of absorbed electromagnetic radiation with up to 80%-90% efficiency in a primary collection, followed however by a rectifying stage (to convert AC into DC currents), where efficiencies drop down to 0.01% [7]. The continuous improvement of this latter stage [8, 9], still set nano-antennas as good candidates for competitive energy production, as well. Both solar cells and nano-antennae would benefit of an increased absorption cross section [9, 10]. The improvement that has been achieved so far was based on the development of material technologies, while the potential coming from exploiting correlations present in the absorbed photons has been overlooked. These correlations have lately found renewed attention, as illustrated by the violation of Bell inequalities or the observation of the Hanbury-Brown-Twiss effect with natural sunlight[11]. In fact, recent research has shown a favorable potential for thermal light spatio-temporal correlations to assist natural light harvesting in bacterial photosynthesis [12]. Therefore, a fundamental open question concerns the extent to which such correlations might be exploited in order to improve artificial light harvesting for energy conversion technologies[13, 14].
In this paper we prove that the detection geometries can be optimized for the specific radiation features, and we particularly show how thermal radiation correlations can be exploited to improve the capture of abundant energy provided by the Sun. Based on well tested theoretical results, our findings give useful directions to lead a more efficient design of solar energy collection devices, which illustrates the possibility to enhance light harvesting by engineering the receptors-architecture when spatio-temporal correlations present in the thermal radiation are exploited.
2 Methods: factorial moments generating function
Photodetection can be well characterized by the statistical properties of the incident light, and the triggering of photo-electric events [9]. All the statistical information of the stochastic photodetection events is contained in its generating function, which serves to cast the factorial moments generating function
| (1) |
where is a set of expansion parameters, is the number of detectors of the photodetection system and is the time interval during which each detector is open to detect light – called detection time or counting time [15]. The detection time value defines the capability of the detection system to perceive the light’s temporal coherence. Particularly, in light harvesting devices it depends on the specific detection mechanism and so do the results we subsequently present. In the last expression and are the eigenvalues of the temporal and spatial Fredholm equations, and which depend on the correlation functions of the electric field at different positions, i.e., the spatial correlations , and on different times, i.e., the temporal correlations . In particular, the normalized correlation functions
| (2) | |||
| (3) |
are obtained in the far field approximation assuming a small bandwidth , which is the frequency spectrum of the absorbed light. Here is the coherence time and , where is the transverse coherence length. The coherence time is inversely proportional to the bandwidth ()222This a rough approximation but valid for any kind of radiation field. Given a known temporal coherence function , the coherence time is defined as [16]. and the transverse coherence length is inversely proportional to the square root of the solid angle covered by the source () with and being the distance to the light source and its diameter, respectively, and is the mean light wavelength [16, 17]. Because of this, the transverse coherence increases for larger distances from the source – where the wavefronts tend to be plane – such that the propagation vectors at different positions on the detection surface are less spread around the perpendicular direction. Therefore, spatio-temporal correlations (Equations 2 and 3) will be relevant when and .
The photo-counting probability to jointly detect photons , in a time window for such multiple photo-detection – i.e. the detection time; or to observe an inter-photon detection time interval , , [18, 15, 19], are useful to describe respectively, spatial and temporal correlations in the photodetection events. They are obtained by differentiation of the generating function [20, 21]: and . See section I of supplementary material (SM) for more details.
3 Results and discussion: Effects of light correlations on light harvesting
3.1 Spatial configuration effects
Spatial correlations for a detection time are described by the generating function
| (4) |
where are the eigenvalues of the spatial Fredholm equation, normalized by , which is the average intensity (photons per time) reaching the -th detector, whose efficiency is . If all the detectors are identical, the total intensity gets , where . The total number of detected photons is , and therefore, in cases where the , , and are fixed, we will refer to as “intensity” indistinctly.
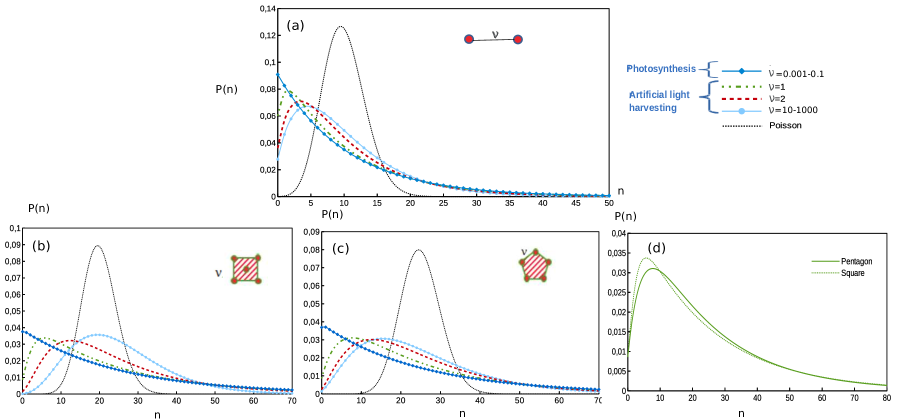
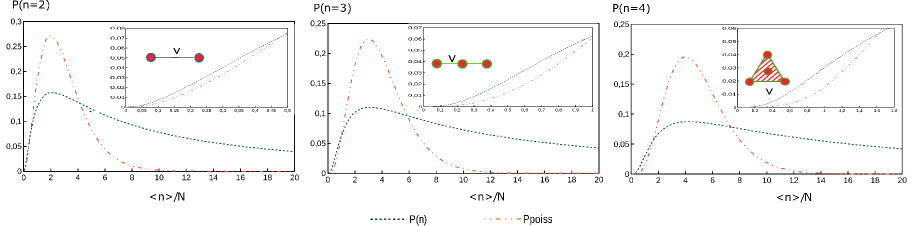
Under these conditions, the photo-counting probability distributions for two detectors , as a function of their normalized separation are shown in Figure 1 (a). For simplicity in the notation, we omit subscripts () if it is not required to specify the detectors addressed. It is important to remark that is defined as the ratio between the detectors separation and the coherence length, so that, values below 1 correspond to detectors within the coherence length. While for short separation () the distribution peaks at low photo-counts numbers reminiscent of Bose Einstein statistics, for larger separations the peak shifts to higher number of events with a rather Poisson-like profile. Figure 1 (b) and (c) display the same calculations for a set of 5 detectors covering equal areas but organized differently. These situations present, for a separation , different photo-count distributions, as Figure 1 (d) corroborates. Similar results are obtained for and detectors (cf. SM figures 2 and 3). This result implies that sunlight with transverse coherence length m [22], will imprint distinctive features in the photo-detected time traces from harvesting units with detectors set at about m apart. Otherwise, detectors farther apart will show characteristics similar (but not equal to) uncorrelated events, just as Poissonian statistics forecasts.
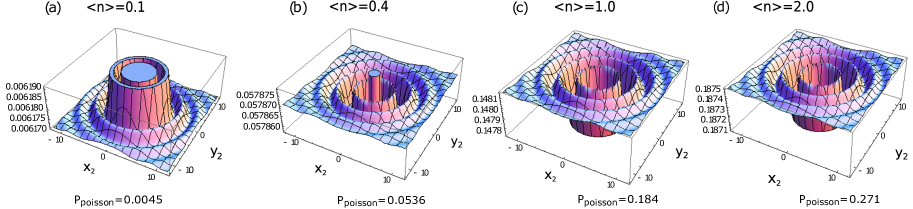
The resemblance of the Bose-Einstein distribution with for and , besides the trend at longer distances to exemplify uncorrelated events, illustrates that photo-detection results from the characteristics of the light (correlations and intensity), convoluted with the ability of the detector’s geometry to reproduce these features. For this case, the probability is maximal, and expresses the sparse long inter-photon times in between bunched packets. When measuring correlated light within a coherence area , the probability of the next absorption strike depends on the distance from the previous photo-detection. To underline the interplay between the detector’s configuration and the field properties, Figure 2 displays how the intensity and correlations of the incident field influences the joint probability density , at different positions of a second detector when the first detector is placed at the origin. Despite the changes in the probability values are small, it can be seen that there is an improvement at low intensities (Figures 2 (a) and (b)), when comparing with the Poissonian probability values which are configuration independent (displayed as a text inset for each ). Whether an improvement for thermal light detection is available, depends on the light intensity; slightly greater intensities (Fig. 2(c)-(d)) show that Poissonian detection probability is higher within the detection area being scanned.
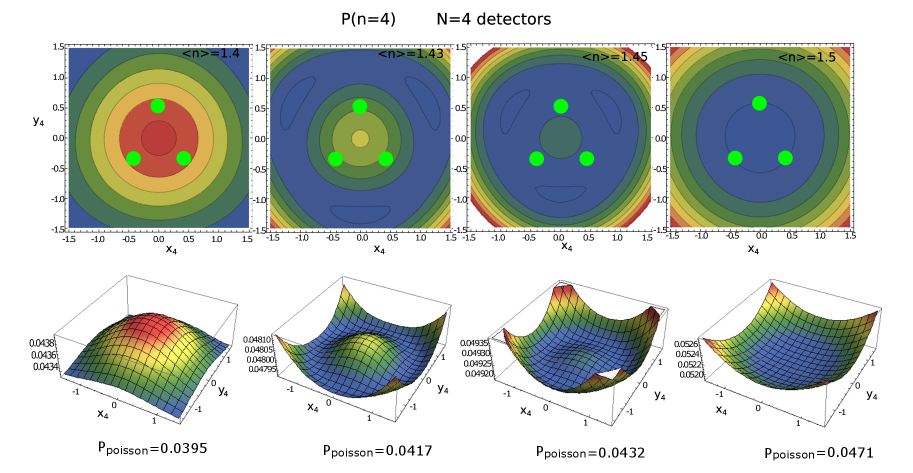
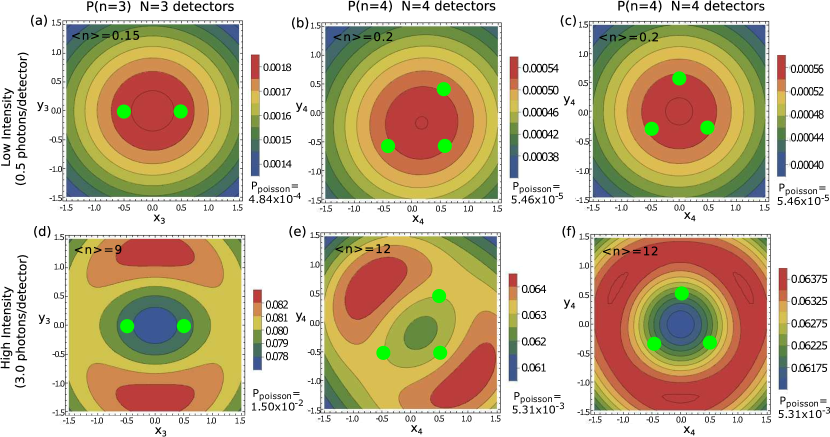
Since on actual technologies detection devices can register finite numbers of events per counting time, we show the probabilities to detect a fixed number of photons per for different configurations and intensities. Figure 3 displays the detection probability for a set of detectors with three of them fixed at the vertices of an equilateral triangle of side . Notice that for intensities equal to , the detection probability shows a maximum for the placement of the fourth detector within the coherence area (cf. Figure3 (a)), while for slightly higher intensities (cf. 3 (b)-(c)) the detection patterns present a transition such that is greater when the fourth detector is outside this area. As will be in short stated, for either lower intensities -which represent solar irradiance- or much greater irradiance, photodetection pattern are significantly different and may present several maxima within . The correlations present in thermal light improve the detection probability by about 0.1-1%, in comparison with the result obtained for Poissonian sources, provided in the text insets.
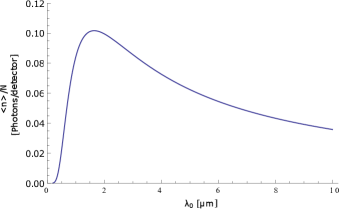
In order to explore the possibility of finding such increased probability of the central detector, it is important to underline the realistic intensities, transverse coherence area and coherence time for sunlight on Earth. Regarding the coherence area is m2, for sunlight on Earth[10, 22]). Regarding the coherence time , it ranges between 1 to 5 fs for crystalline Silicon detecting light spectrum between 400-1200 nm (PHz)[23], or can even be engineered in solar antennas which are designed to absorb at a specific wavelength or at a broad spectral bandwidth [24]333Notwithstanding, the coherence time will depend on the absorption spectrum of the specific technology, i.e., on factors such as the material’s bandgap, layers, temperature, and impurities, among others.. Realistic values for the average number of detected photons , at which correlations can be perceived by the detection system, depend on the interplay between the solar flux of photons -which peaks at about 500-600 nm-, and the detectors response (). Therefore, the maximal number of correlated detection events that can be registered per detector is limited by the coherence area and time ()
| (5) |
with
where is the speed of light in vacuum, is the Planck constant, is the Boltzmann constant and K is the temperature of the Sun. Notice that is always positive since are the lower and upper limits of the band width. The scanning of sets a maximum number of correlated detections (per detector) under natural conditions of at m in the near infra-red, as shown in Figure 4. The number of maximal correlated absorptions per detector () is not changing as a function of the band width , because of the trade-off between the sun-light intensity (at and ) and the response of the detectors. When the integrated photon-flux is increased by a larger , the detection area and time need to be smaller in order perceive the light correlations, and therefore depends only on . In this intensity regime (), Figure 5 shows that the probabilities calculated including correlations are about one order of magnitude greater than the Poissonian probabilities. Additionally, at low intensity the detection probability is always maximized when detectors configurations are dense within (from comparison of three to four detectors), and follow a crystallographic arrangement (from comparison of equilateral and scalene triangles).
Whether the configuration of detectors can exploit the sun-light correlations to increase their photodetection rate for the natural intensity, can be explored by the comparison of specific configurations subject to thermal or Poissonian light, presented in Figure 6. Here, we place the detectors at the position where the joint detection probability densities from Fig.5 is maximal, and check how behaves - being exactly the number of detectors - for different light intensities. In general, these probabilities differ importantly for thermal and Posionian light, but most importantly for the relevant intensity of sunlight reaching earth, the insets of Fig.6 show that every configuration that exploits the sun-light correlations, enhances the probability to detect so many photons as the number of detectors present under the relevant intensity of sun-light. In fact, each detection device has a limited capacity to register arrivals per time; otherwise the average number of detection events would need to be integrated over the entire domain of obtaining the same average as in the Poissonian case. Thereby, thermal light correlations can be exploited to increase the photodetection rate under the physical constraint of finite absorptions for detector’s responsiveness.
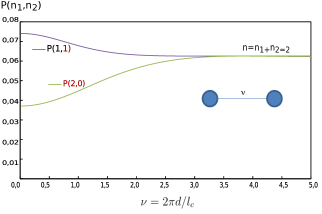
Another important consideration regards the detector’s dead time, namely, the time after each event during which the detector is not able to record another event. For such technologies of detectors, it is preferable to have detection events distributed along the detection array and not concentrated in a single detector. Figure 7 displays the probability to detect 2 photons in a two detector array, and shows that when the coherence of the sunlight is accounted for, if detectors are placed within the coherence length, the likelihood of consecutive detection at different detectors is larger than that of detecting them in a single detector , and larger than that expected from uncorrelated events -when . The same results for a three detectors system are displayed in the SM (Fig.6), to corroborate that it is more likely to have detections distributed along the detectors set.
3.2 Temporal effects
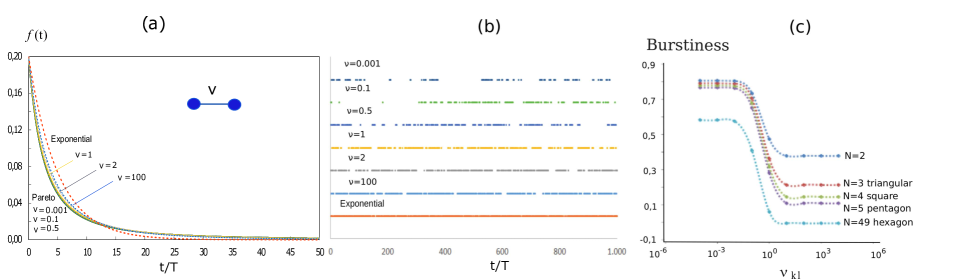
Spatial and temporal correlations are complementary to produce clustered structure in the detection signals. In the Poissonian case, the number of detections per detection time is symmetrically distributed around a central value , but in correlated cases, intervals with few or no detection event are more likely and this is precisely what gives a clustered structure to the absorption events. Figure 8 (a) shows for two detectors at different values of . Here, longer-tailed distributions emerge when the distance is smaller than the coherence length, to reflect the polynomial decay of bunched thermal light. Figure 8 (b) reflects that the apparently minor change in the distribution tails, impact severely the detected time traces because of the longer tails of the distributions. In order to better describe the effect of bunching, an adequate measure is burstiness [25], , which quantifies the relation between the mean and the standard deviation . This measure should vanish, , for a Poissonian process and be positive (negative) for bunched (anti-bunched) statistics. Interestingly, the temporal correlations, due to its complementarity to the spatial correlation, are affected by the configuration of the array of detectors as displayed in Figure 8 (c).
The burstiness in the photodection can be used as a means to amplify the signal in technologies were single detectors are not able to produce enough electrons, useful for later stages, e.g. current rectification. For instance, rectennas (rectyfing antennas) technologies [9], require an AC-DC rectifying stage achieved by diodes which require a current yield accomplished nowadays by the successful combination of the output from individual antennae. The bunched photon arrival, and hence several detections within a short time , naturally amplify the signal for such technologies. Thus, besides the increment in the detection probability shown above, spatio-temporal correlations facilitate the currents rectification where the efficiency drop is important for this technology.
Up to here we have accounted for . Calculations of and are shown and detailed explained in the SM section 3, for different values. The obtained results confirm that correlations effects are robust against increment in up to the coherence time, and beyond this limit the detection statistics tend to be Poissonian, even when detectors are very near inside of a coherence area ( ).
4 Conclusions
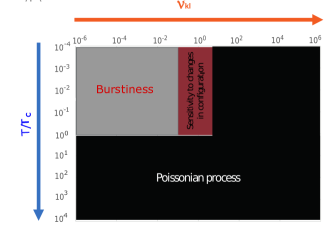
The present work outlines how the interplay between intensity and correlations of thermal light, is suggestive of densely packed and symmetric arrays of detectors, which shall be placed within the rather ample coherence area of sunlight, in order to enhance light harvesting technologies operative under normal sun-light conditions. Moreover, the study of temporal correlations in the detection of thermal light in such designs, seems promising to overcome present limitations in the post-processing of electric currents. Figure 9 summarizes the regimes at which the complementary temporal and spatial correlations of sunlight can be useful, in order to highlight that spatio-temporal correlations of thermal light can be detected and then exploited, depending on the spatio-temporal scale of the detection; in fact, all the effects found for the maximal temporal correlations regime () are conserved when the detection time increases until the limit where the statistics become Poissonian. This work opens, as a proof of principle, the perspective of exploiting specific geometries to enhance harvesting performance and facilitate the amplification-rectification of currents in present sun-light conversion technologies.
—————-
Acknowledgments
A.de M. acknowledges partial financial support from COLCIENCIAS (Colombia) through the grant for doctoral studies in Colombia-call 528. A.de M., F.J.R. and L.Q. were partially supported by Banco de la República de Colombia under grant 3646 (2016) and Faculty of Science - Universidad de Los Andes by projects 2014-2 and QUANTUM CONTROL OF NON-EQUILIBRIUM HYBRID SYSTEMS-Part II (2016). F.C.S. Acknowledges support from the EU project PAPETS, the ERC Synergy grant BioQ and the DFG via the SFB TR/21. N.F.J. is funded by National Science Foundation (NSF) grant CNS1522693 and Air Force (AFOSR) grant FA9550-16-1-0247.
References
References
- [1] Hertz H 1887 Annalen der Physik 267 983–1000
- [2] Einstein A 1905 Annalen der Physik 322 132–148 ISSN 1521-3889 URL http://dx.doi.org/10.1002/andp.19053220607
- [3] Blankenship R E, Tiede D M, Barber J, Brudvig G W, Fleming G, Ghirardi M, Gunner M R, Junge W, Kramer D M, Melis A, Moore T A, Moser C C, Nocera D G, Nozik A J, Ort D R, Parson W W, Prince R C and Sayre R T 2011 Science 332 805–809 ISSN 0036-8075 (Preprint http://science.sciencemag.org/content/332/6031/805.full.pdf) URL http://science.sciencemag.org/content/332/6031/805
- [4] Kurtz A and Emery K 2016 Best reseach-cell efficiencies Tech. rep. National Renewable Energy Laboratory (NREL), Golden, CO URL http://www.nrel.gov/pv/assets/images/efficiency_chart.jpg
- [5] Kotter D K, Novack S D, Slafer W D and Pinhero P J 2010 Journal of Solar Energy Engineering 132 011014 ISSN 0199-6231 URL http://dx.doi.org/10.1115/1.4000577
- [6] Badawy W A 2015 Journal of Advanced Research 6 123–132 ISSN 2090-1232 URL http://dx.doi.org/10.1016/j.jare.2013.10.001
- [7] Vandenbosch G A and Ma Z 2012 Nano Energy 1 494–502
- [8] Sharma A, Singh V, Bougher T L and Cola B A 2015 Nature Nanotechnology 10 1027–1032 ISSN 1748-3395 URL http://dx.doi.org/10.1038/nnano.2015.220
- [9] Corkish R, Green M and Puzzer T 2002 Solar Energy 73 395–401 ISSN 0038-092X URL http://dx.doi.org/10.1016/S0038-092X(03)00033-1
- [10] Mashaal H and Gordon J M 2011 Opt. Lett. 36 900 ISSN 1539-4794 URL http://dx.doi.org/10.1364/OL.36.000900
- [11] Ragy S and Adesso G 2012 Scientific Reports 2 ISSN 2045-2322 URL http://dx.doi.org/10.1038/srep00651
- [12] Manrique P D, Caycedo-Soler F, De Mendoza A, Rodríguez F, Quiroga L and Johnson N F 2016 Results in Physics 6 957–960 ISSN 2211-3797 URL http://www.sciencedirect.com/science/article/pii/S2211379716304090
- [13] Sim N, Cheng M F, Bessarab D, Jones C M and Krivitsky L A 2012 Phys. Rev. Lett. 109 ISSN 1079-7114 URL http://dx.doi.org/10.1103/PhysRevLett.109.113601
- [14] Brumer P and Shapiro M 2012 Proceedings of the National Academy of Sciences 109 19575–19578 ISSN 1091-6490 URL http://dx.doi.org/10.1073/pnas.1211209109
- [15] Bures J, Delisle C and Zardecki A 1972 Can. J. Phys. 50 760–768 ISSN 1208-6045 URL http://dx.doi.org/10.1139/p72-108
- [16] Mandel L and Wolf E 1995 Optical coherence and quantum optics (Cambridge university press)
- [17] Fox M 2006 Quantum optics: an introduction vol 15 (OUP Oxford)
- [18] Bédard G 1967 Phys. Rev. 161 1304–1308 ISSN 0031-899X URL http://dx.doi.org/10.1103/PhysRev.161.1304
- [19] Zardecki A 1971 Can. J. Phys. 49 1724–1730 ISSN 1208-6045 URL http://dx.doi.org/10.1139/p71-206
- [20] Van Kampen N G 1992 Stochastic processes in physics and chemistry vol 1 (Elsevier)
- [21] Rockower E B 1989 American Journal of Physics 57 616 ISSN 0002-9505 URL http://dx.doi.org/10.1119/1.15957
- [22] Mashaal H, Goldstein A, Feuermann D and Gordon J M 2012 Opt. Lett. 37 3516 ISSN 1539-4794 URL http://dx.doi.org/10.1364/OL.37.003516
- [23] van W, Meijerink A and Schropp R 2012 Solar Spectrum Conversion for Photovoltaics Using Nanoparticles (InTech) URL http://dx.doi.org/10.5772/39213
- [24] Briones E, Alda J and González F J 2013 Opt. Express 21 A412–A418 URL http://www.opticsexpress.org/abstract.cfm?URI=oe-21-103-A412
- [25] Goh K I and Barabási A L 2008 EPL (Europhysics Letters) 81 48002 URL http://stacks.iop.org/0295-5075/81/i=4/a=48002