A Deconvolution Technique to Correct Deep Images of Galaxies from Instrumental Scattered Light
Deep imaging of the diffuse light emitted by the stellar fine structures and outer halos around galaxies is now often used to probe their past mass assembly. Because the extended halos survive longer than the relatively fragile tidal features, they trace more ancient mergers. We use images reaching surface brightness limits as low as 28.5–29 mag.arcsec-2 (g–band) to obtain light and color profiles up to 5–10 effective radii of a sample of nearby early-type galaxies. They were acquired with MegaCam as part of the CFHT MATLAS large programme. These profiles may be compared to those produced by simulations of galaxy formation and evolution, once corrected for instrumental effects. Indeed they can be heavily contaminated by the scattered light caused by internal reflections within the instrument. In particular, the nucleus of galaxies generates artificial flux in the outer halo, which has to be precisely subtracted. We present a deconvolution technique to remove the artificial halos that makes use of very large kernels. The technique based on PyOperators is more time efficient than the model-convolution methods also used for that purpose. This is especially the case for galaxies with complex structures that are hard to model. Having a good knowledge of the Point Spread Function (PSF), including its outer wings, is critical for the method. A database of MegaCam PSF models corresponding to different seeing conditions and bands was generated directly from the deep images. It is shown that the difference in the PSFs in different bands causes artificial changes in the color profiles, in particular a reddening of the outskirts of galaxies having a bright nucleus. The method is validated with a set of simulated images and applied to three representative test cases: NGC 3599, NGC 3489, and NGC 4274, and exhibiting for two of them a prominent ghost halo. The method successfully removes it.
Key Words.:
galaxies: evolution – galaxies: elliptical and lenticular, cD – galaxies: stellar content – galaxies: photometry – techniques: photometric – techniques: image processing1 Introduction
The mass growth and morphological evolution of galaxies is described by different scenarios in the literature: gas accretion from cosmological filaments, internal secular evolution and series of galaxy mergers of different mass ratios and gas fractions. Depending on the dominant scenario, the simulations modeling these processes predict specific observables for the resulting galaxy, such as stellar age and metallicity profiles probed by spectroscopy as well as light and color profiles traced by photometry (e.g. Naab et al. 2007; Bullock & Johnston 2005; Oser et al. 2010; Cooper et al. 2010; Pillepich et al. 2015).
While the inner regions of galaxies have been well studied, the extended parts are still an immature but rapidly growing field of research. Multiple programs are being carried out to explore these regions that hold the imprints of recent and more ancient mergers. They make use of either stellar counts for local galaxies, or the diffuse light revealed by deep imaging for more distant ones (Mihos et al. 2005; Martínez-Delgado et al. 2010; Janowiecki et al. 2010; Abraham & van Dokkum 2014; Duc et al. 2015; Iodice et al. 2016). New imaging techniques have been developed (Mihos et al. 2005; Ferrarese et al. 2012; van Dokkum et al. 2014), allowing us to reach the very low surface brightness levels needed to investigate the extended stellar structures of galaxies. Deep images reveal the fine structures produced by recent mergers (shells, streams, tails), but also the outer stellar halos which cumulate material accreted during more ancient collisions. Stellar halos in extended regions survive longer than the fine structures. Unfortunately their photometric analysis suffers from various sources of contamination.
The difficulties of deep imaging should be taken care of elaborately to reach the desired sensitivity in the extended parts of light and color profiles. Various contamination sources hamper the integrated light analysis of the halos, in particular galactic cirrus and instrumental contamination. Due to its complex filamentary structure (Miville-Deschenes et al. 2016), and non-monochromatic colours, the optical emission from Galactic cirrus cannot be easily subtracted; heavily cirrus polluted regions should thus be avoided. Instrumental contamination affects all fields; some can be addressed by advanced flat-fielding procedures and sky subtraction; others like reflections within the camera, producing artificial halos and ghosts, are much more complex to model and remove (Slater et al. 2009; Duc et al. 2015). The importance of correcting for light scattering is well documented (Michard 2002; Slater et al. 2009; Sandin 2015; Trujillo & Fliri 2015) but the correction process is challenging. It requires in particular the availability of point spread functions (PSFs) measured up to large radius at the location of the target on the detector. Minimising artificial halos should in principle be done at the instrumental level. The scattering in classical cameras may be reduced with anti-reflective coating on the detector and on the optical elements (Mihos et al. 2005) or largely eliminated by alternative imaging systems such as photo-lens array (Abraham & van Dokkum 2014).
Sandin (2014, 2015) has investigated the impact of ghost halos on galaxy profiles by convolving galaxy models with PSFs corresponding to a variety of instruments. He quantified the importance of scattering as a function of radius for various morphological types. Duc et al. (2015) noted the wavelength dependence of the scattering effect, which for the MegaCam instrument, climax in the r band. The variation of the PSF shape from one band to the other creates artificial reddening in the outer color profiles of galaxies. Trujillo & Fliri (2015) applied a model convolution technique to estimate and remove light scattering: a pre-determined intrinsic galaxy model is convolved with the PSF, and the best solution is iteratively found fitting the convolved model to the data. With this method, having a multi-component model that minimises residuals in the model-subtracted image is fundamental: positive or negative residuals cause under-estimation or over-estimation of the scattered light. Building interactively a specific multi-component galaxy model is time consuming and becomes prohibitive for large surveys of massive, complex, galaxies.
In this paper, instead of using the model-convolution technique, we present our efforts to directly deconvolve images and remove artificial halos of galaxies. The deconvolution method relies on large kernels and uses PyOperators111http://pchanial.github.io/pyoperators/ (Chanial & Barbey 2012), which are time-efficient python tools. Our analysis is based on CFHT/MegaCam deep images acquired as part of the MATLAS (Mass Assembly of early-Type GaLAxies with their fine Structures) large programme (Duc et al. 2015) as well as simulated images used to validate the method.
This paper is structured as follows: in Section 2, we present the MATLAS images and characterize their ghost halos; we describe the method to determine the point spread functions to large radii, detail the deconvolution technique and the routines to derive light and color profiles. In Section 3, we present the results obtained with images of simulated galaxies and apply the method for images of three real galaxies – NGC 3489, NGC 3599 and NGC 4274 – that exhibit a variety of artificial halos. In Section 4, we discuss the limitations of the method due to uncertainties on the PSF and potential issues dealing with saturated images. In Section 5, the conclusions follow.
2 Data and method
2.1 The ghosts on MATLAS images
MATLAS is a deep imaging survey that uses MegaCam on the CFHT (Boulade et al. 2003) to acquire images of nearby early-type galaxies from the sample of the ATLAS3D project (Cappellari et al. 2011). The ATLAS3D sample is volume limited (within 42 Mpc) and includes galaxies with dynamical mass in the range - (Cappellari et al. 2013).
MATLAS images are obtained by stacking 6–7 individual images, each of which has 6 minutes exposure time. The individual pointings are made with large offsets from one another (in the range of 2-14 arcmin) to enable the detection of extended low-surface-brightness features. The images are collected in the g’- and r’-band and additionally some galaxies are observed in u* and i’222Noted hereafter, u, g, r and i.. In most cases, the target galaxies are located close to the center of the 1x1 square degree stacked image. Galaxies that are within the field of an already observed object were not re-observed; some are thus located closer to the edge at locations where the shape of the PSF is significantly changed with respect to that measured in the central regions. Further details on the observing strategy and data reduction technique can be found in Duc et al. (2015).
The MATLAS images were usually obtained under good seeing conditions and benefit from the excellent image quality of the MegaCam camera, while reaching low local surface brightness limits (28.5-29 mag.arcsec-2 in the g-band). They are however subject to prominent scattering effect due to the complex optical structure of the instrument. Multiple internal reflections create characteristic extended interleaved halos (from now referred as ghosts) around bright objects, stars, but also galaxies.
The ghosts are due to the light coming to the camera, that is being reflected back and forth between the CCD and the other optical elements such as the lenses and filter wheels. The origin and the physical processes behind these ghosts were investigated by Slater et al. (2009). The presence of ghosts alters the photometric analysis, i.e. change light and color profiles, especially in the outskirts of galaxies, beyond the 24 mag.arcsec-2 isophote. The radius of the most prominent ghost seen in the MegaCam deep images is 3.5 arcmin.
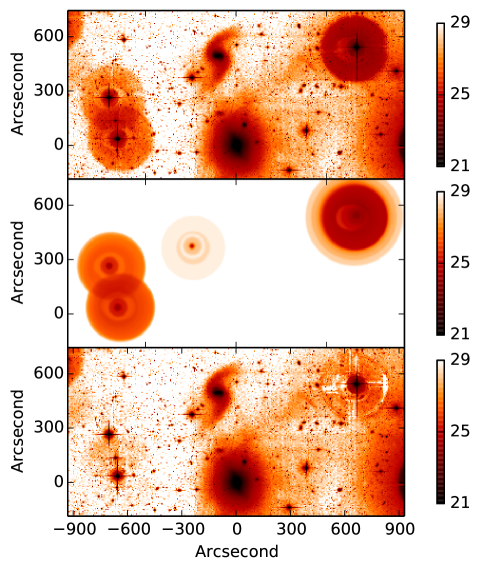
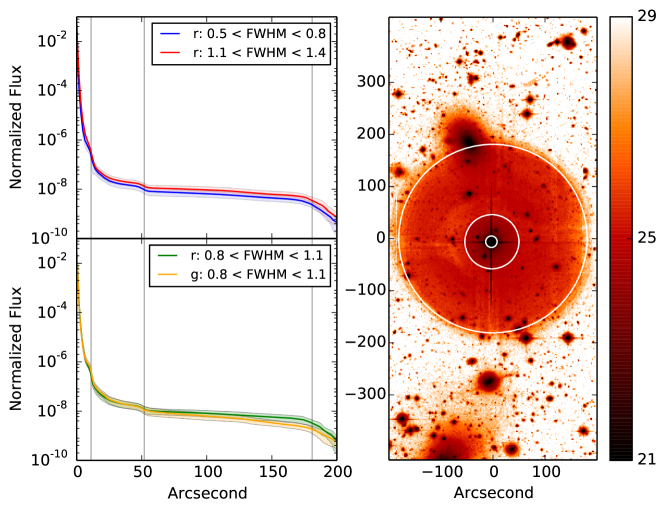
As illustrated in Figure 1, ghosts are present everywhere in the images, contributing to the image background; they are however directly visible only around bright objects. The two sources of ghosts – the bright stars and galactic nuclei – cause external and self-contamination, respectively. Different methods are applied to remove them; the ghosts of bright stars can be easily identified on the images, manually modeled and subtracted. On the other hand, reflection halos surrounding galaxies are more complex as the light contributed to them is extended. Besides such ghosts cannot be easily identified and separated from the stellar halo of the galaxy, especially when the latter is extended. Therefore, only a deconvolution technique can properly remove them. Note that this process does not eliminate the ghosts around the bright stars since they are saturated.
2.2 Subtraction of the ghosts around the bright stars close to the galaxies
The extended halos around the bright stars, close to the target galaxies, contaminate their stellar halos, and need to be subtracted.
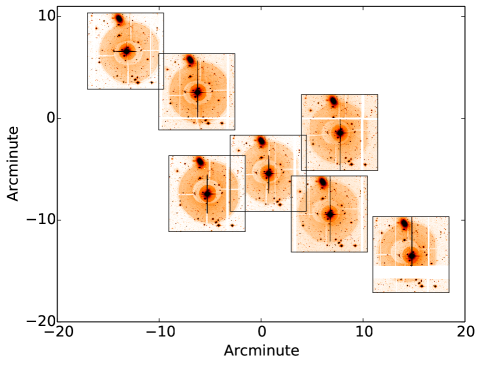
On individual images, these ghosts consist of multiple annuli partially overlapping each other that, depending on their position on the CCDs, and bands used, have different angular sizes, centres and brightnesses. The stacking procedure of these individual images that have large mutual spatial offsets (see Figure 2) adds to their complexity. A manual interactive procedure was then set up to generate models of the stacked halos: series of annuli with manually adjusted values were constructed, starting with the external regions. Each annulus is subtracted from the image and the residual image is iteratively processed until the halo disappears and a flat background is reached. The procedure is illustrated in Figure 3. Note that the method is not able to properly model the gaps with lower intensity that are present between some annuli especially in the individual images. On the stacked images, they are however partly filled (see Figure 3) and modeling them would anyway be too complex. The light fitting procedure starts at a radius of 200″, and is stopped at 50″. Modeling the profiles further in would not help much for the purpose of decontaminating the galaxy halo by the stellar ghost.
This process creates sharp edges while the boundary of the original ghosts were smoother, due to the stacking procedure on images obtained with large offsets. To take this into account, a gaussian blur was applied on the final ghost model. The shape of the halos is wavelength dependent, as further discussed in Section 2.3. Thus different models had to be constructed for each band.
Finally, the ghost halo models were subtracted from the images, as illustrated in Figure 1 for the field of galaxy NGC 3414.
2.3 Determination of the Point Spread Function
Deconvolution techniques such as the one presented here require in principle a perfect knowledge of the Point Spread Function at the location, time and wavelength of the observations, and to determine it from the innermost to the outermost regions. In the optical regime, and without any AO facility, the shape of the inner PSF is at first order governed by the seeing of the atmosphere. Far out, its outer wings are shaped by the instrumental, and especially for MegaCam by the multiple, thousands, internal reflections.
Building such a PSF is not straightforward. A physical modeling of the PSF, taking into account the complex light path between the different optical elements of the camera, can be envisioned by ray tracing techniques for instance. However, it would be computationally expensive to determine such PSF models for different locations on the image and for different wavelength ranges. Instead, empirical methods are being used, and the PSF is directly derived from the science exposures. One way is to take numerous short exposure images, preventing saturation, and stack them until the signal-to-noise in the outer part of the PSF is high enough to model the wings (Janowiecki et al. 2010; Trujillo & Fliri 2015). Such a calibration requires dedicated observations, matching the seeing conditions of the science observations, and thus a lot of telescope time. Alternatively, one may stack numerous non-saturated stars from one or if needed several science exposures, but this process would smooth the non-symmetric features of the PSF. Indeed they vary with position and time.
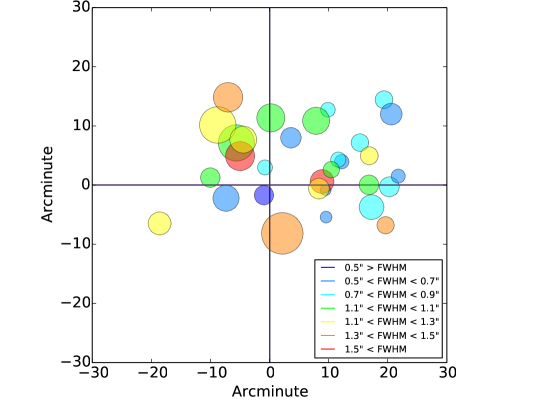
We choose here an hybrid method. To create the PSF model, we build the inner profile by stacking many faint stars on the field and the outer profile by manually modeling the ghosts of a bright neighbor star; we then merge the inner and outer profiles. The inner parts of the PSF are generated using SExtractor (Bertin & Arnouts 1996) and PSFex (Bertin 2011). Since the ellipticity, and full width at half maximum (FWHM) of the PSF vary across the field of view, the reference stars were chosen within a box of 20′x20′ centered on the target galaxy. This generally allows us to build the inner PSF model up to a radius of 6.5″. The radius is reduced when the number of stars available for the PSF model with PSFex is insufficient and the signal to noise too low.
For the outer regions of the PSF, we directly exploit the depth of the MegaCam images that allows us to model the light profile of bright (saturated) stars up to several arcmin. In most cases, the closest bright star to the target galaxy exhibiting prominent ghosts was used for the PSF fitting procedure. The positions of the various selected stars are shown in Figure 4. The wings of the PSF are computed with a similar manual method as the one used to remove the stellar ghosts (see Section 2.2), i.e. using a series of annuli with discrete intensity. One difference is that the fitting procedure was continued to a smaller radius, i.e. 4.5″.
With this method the outer PSF is azimuthally averaged. Getting away from the center of the MegaCam field, the ghosts are less and less centered on the star. For this reason, in our star profile fitting procedure, the center of the annuli are allowed to be shifted. To build our PSF model, the annuli were however artificially re-centered. Indeed, the vast majority of our target galaxies are located close to the image center at a position where the ghost halo is centered on the star. With that approximation, we make sure that the deconvolution of the galaxy is carried out with a PSF with a shape close to the expected one.
Merging the inner and outer profiles of the PSF model requires a normalisation in the overlapping region. The normalisation factor is computed as the median ratio of the pixel values in a common region with an angular size of (i.e. 6 pixels).
Figure 5 presents the typical profiles of the PSF models, for various seeing conditions and the two g and r bands. All PSF models were normalized by their estimated flux at 3″, and combined within each seeing bin, and a standard deviation was computed. The standard deviation curves shown in the figure indicate that the profiles are not uniform for a given seeing, band and star magnitude. A typical error of 30% at radius of 100 ″is measured. This could first be due to uncertainties in the merging process of the inner and outer profiles of the PSFs, and to the spatial variations of the PSF wings. The impact of the latter effect is illustrated in Figure 4 and further discussed in Section 4.1.
Though the intensity scaling used in our figures makes the ghost halos appear prominent, their contribution to the total flux is very limited: the flux integrated between 50-200″ accounts for only 1.6%; 98% of the flux is concentrated within the inner 10″.
We found that for a given seeing range, at radius above , the r–band reflected light becomes more intense than in the g–band. This is mainly due to the CCDs being more reflective in the r-band. This wavelength dependence of the PSF creates artificial reddening of the outer profiles of galaxies.
More surprisingly, for a given band, the PSF models corresponding to worse seeing conditions have more prominent halos. The difference is significant: about 45% at 100″, while the standard deviation per seeing bin is 30%. We checked that a normalization of the flux with an aperture of 10″, instead of 3″ does not change the results.
Understanding the origin of these trends is beyond the scope of this study and will be discussed in another paper presenting a physical rather than empirical modeling of the PSF. In any case, the strong wavelength, seeing and position dependence of the PSF wing intensity presented here further illustrates the need of having specific PSF models for each observation condition. However, as described in Section 2.2, obtaining a full PSF model with our manual empirical method is time consuming. For that reason, instead of creating one PSF for each image of our large sample, we have generated one PSF for each band and for different seeing conditions, ranging from 0.5″ to 1.7″.333Note however that, for the vast majority of the MATLAS fields, the r–band seeing ranges between and . A database of 71 PSF models was then generated.
2.4 Image deconvolution
To remove the ghost halos due to scattered light, we have directly deconvolved our images using the very large kernels (PSFs) presented in Section 2.3. The deconvolution technique on large images with large kernels have two downsides: (1) it requires a large computation time even for low numbers of iterations (2) the deconvolved images exhibit irregularities, i.e. wiggles and noise on small scales. This second issue is just intrinsic to the technique and unavoidable as the PSF model can never be perfect. We have however dramatically reduced the computer time using specific python operators and solvers for high-performance computing.
The deconvolution method described here uses open source PyOperators, in particular convolution operators and equation solvers that were optimised to handle large matrix calculations. This allows the process to reach high iterations in relatively short time. More specifically, the code uses a conjugate gradient method; the maximum iterations and the tolerance level for the residual are controlled by the user.
Note that the cost of solving the minimization equations directly by a Cholesky decomposition would be prohibitive. The iterative preconditioned conjugate gradient method is more efficient.
The noise in the deconvolved images due to the noise in the original images plus the imperfections in the representation of the PSF by the kernel is regulated by a regularisation parameter. In addition, a normalisation parameter444Determined for each image as 1 divided by the square of the sigma of the sky background. is given to help reaching the solution in low number of iterations.
2.5 Determination of the galaxy profiles
To derive the galaxy profiles, we have used the following routine. First, the small objects (faint stars and background galaxies) were subtracted from the images, after having been identified by SExtractor and replaced by values of the surrounding background. Bad regions (including prominent CCD gaps, galactic cirrus, bright objects etc.) were then manually masked. Initial photometric parameters were estimated by GALFIT, and the modeling of the galaxy itself was made by the ellipse task in IRAF. In the ellipse fitting procedure, the position angle and ellipticity parameters were set free, except for galaxies with prominent bar-like structures, dust lanes and bright clumps. The ellipse procedure usually breaks at locations were bright clumps within the galaxy or fine structures (tails, shells) become prominent. To force the determination of the profile farther out, a maximum semi-major axis was given. The profiles were however truncated at a fixed level of the measurement error, as described in Section 3.2.
The large scale sky background variations are the principle sources of systematic uncertainties in the light and color profile determination. Scattered light due to Galactic cirrus or clustered stars generate large fluctuations across the field. The determination of the average background around the target galaxy and its error is thus not straightforward. The code we have developed for this process samples the background in 190 homogeneously distributed circular regions (150 pixel diameter) around the galaxy. The sky value and standard deviation is derived for each of these regions by IRAF’s centroid sky fitting algorithm. Regions polluted by CCD gaps, stellar ghosts or strong cirrus contamination are identified based on the value of the standard deviation and rejected in a two iteration process. For the remaining regions, the robust mean and sigma for the sky is calculated with the biweight_mean in IDL (Landsman 1993).
The local errors are directly given by the ellipse fitting task. The error bars attached to the light and color profiles combine quadratically the systematic and local errors555Note that in the literature, the error on the sky background is usually neglected, resulting in much smaller error bars than those shown in this paper..
3 Results
In this section we present the deconvolution results on simulated images of galaxies and real images of NGC 3489, NGC 3599 and NGC 4274. The analysis of the full sample will be presented in a future paper.
3.1 Simulations
The deconvolution technique was tested on convolved images of simulated galaxies. A single component galaxy model was created with GALFIT (Peng et al. 2002, 2010) and inserted on the images, leaving enough padding to avoid any boundary effects in the convolution and deconvolution processes. The simulated galaxy has the following characteristics, typical of those of the early-type galaxies in our sample (see Table 1).
-
•
Sérsic Index: 4
-
•
Integrated Magnitude: 12.1 within a 5″ aperture
-
•
Effective Radius: 22.3″
-
•
Ellipticity: 0.5
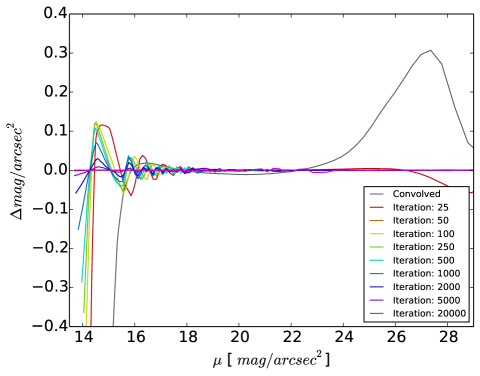
The intrinsic simulated galaxy image was convolved by the convolution tool in PyOperators with a PSF obtained from a real r-band image. Its FWHM of 0.81″ is close to the average seeing in r–band for the whole MATLAS survey. The deconvolution was performed on the convolved image with the code described in Section 2.4. No regularisation parameter was set as the simulated image is noiseless. The deconvolution was tested with different number of iterations, ranging between 25 to 20000. Figure 6 shows that convergence in the outskirts of the galaxy is already reached with a small number of iterations (100). As expected, recovering the true inner profile requires however a much higher number of iterations.
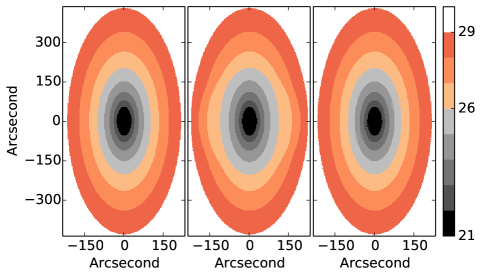
Figure 7 presents the projected images of the intrinsic, convolved and deconvolved galaxy. It illustrates how light scattering not only change fluxes but also affects the outer isophotes of the galaxy: the halo gets artificially roundish, especially between the 26th and 27th mag.arcsec-2 isophotes. This effect can vary from galaxy to galaxy depending on the size, ellipticity and brightness of the nucleus. As shown on the figure, the deconvolution technique is able to recover the intrinsic shape of the modelled galaxy.
3.2 Observations: NGC 3489, NGC 3599 and NGC 4274
The deconvolution technique was then applied to the images of real galaxies NGC 3489, NGC 3599 and NGC 4274, chosen for being representative of the variety of objects in the MATLAS survey. Their properties are listed in Table 1.
| Central Brightness | Integrated Magnitude | ||
|---|---|---|---|
| NGC 3489 | 19.9 | 14.3 | 11.7 |
| NGC 3599 | 20.8 | 16.2 | 13.5 |
| NGC 4274 | 58.0 | 16.6 | 13.1 |
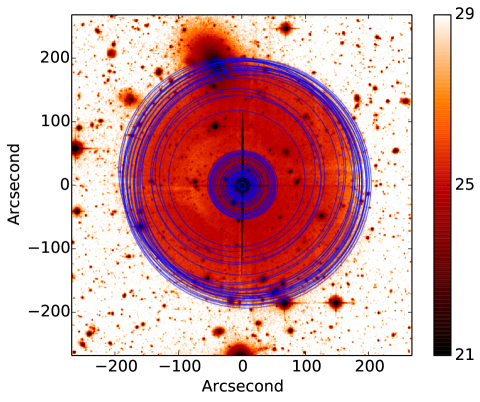
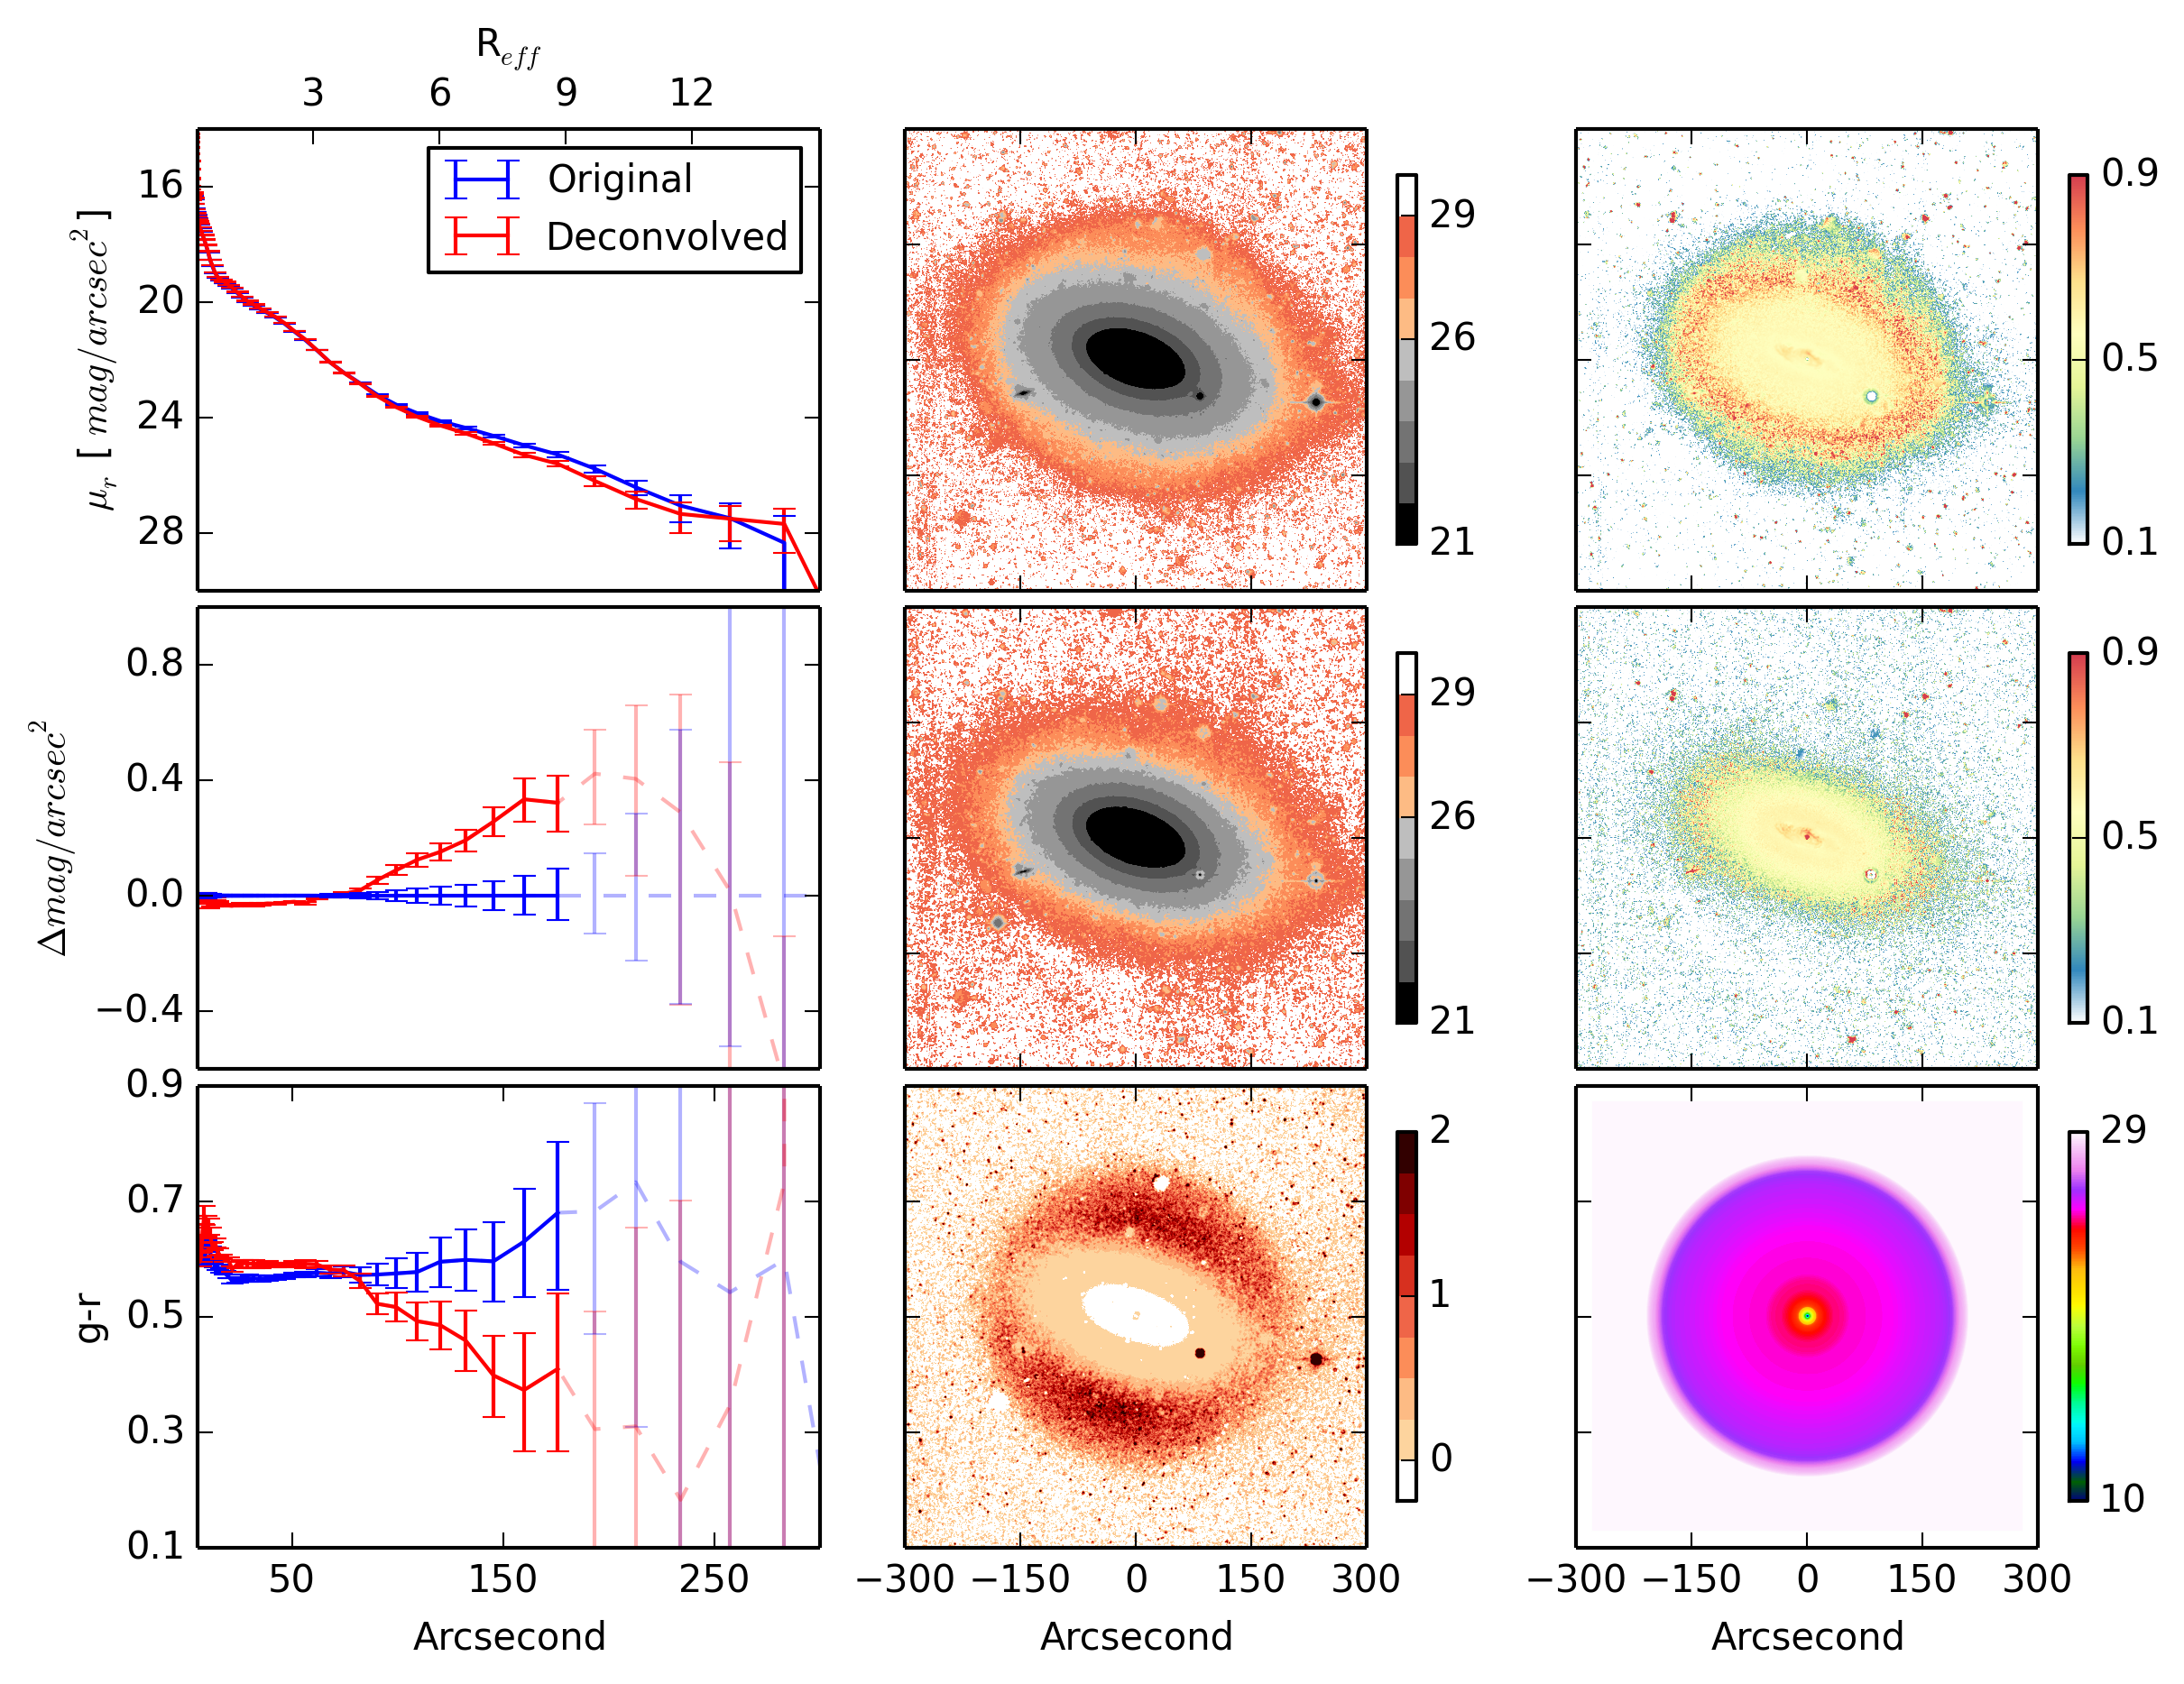
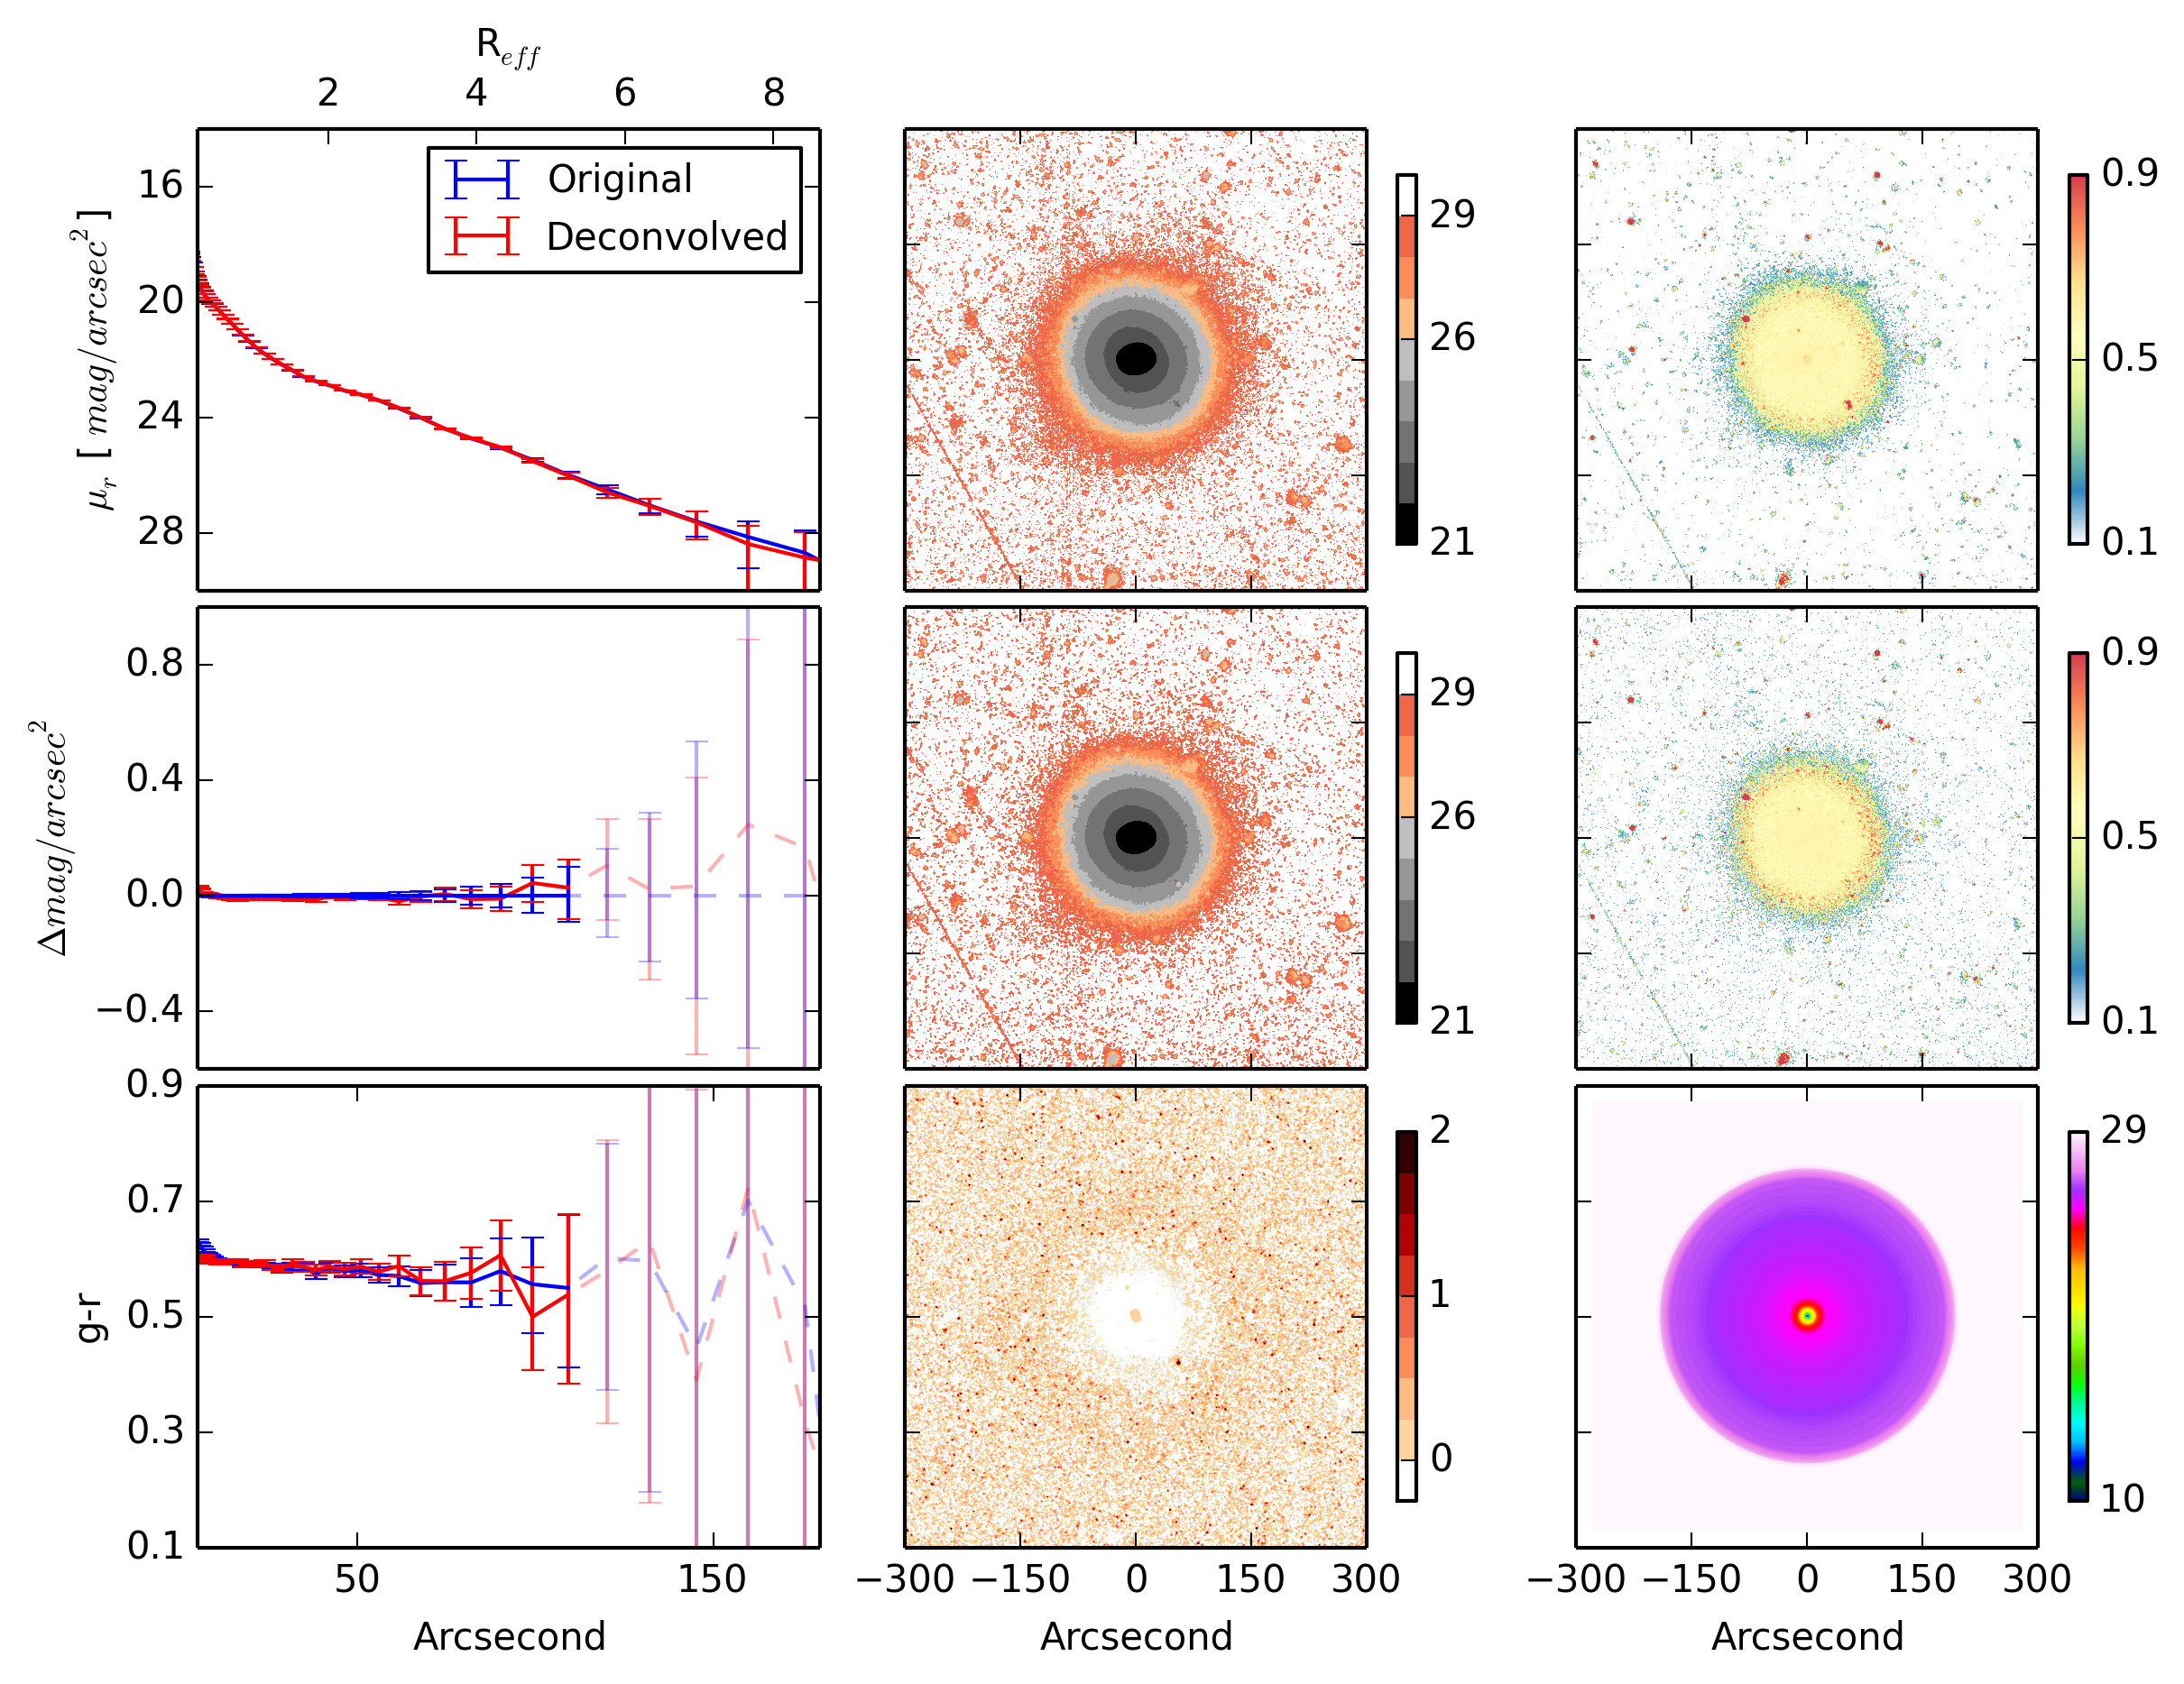
NGC 3489 exhibits a prominent ghost that can be seen directly in the surface brightness and color maps as a roundish, reddish, structure with a radius of 3.5 arcmin, typical of that surrounding bright stars (see Figure 8).
We performed the deconvolution on the g- and r-band images of NGC 3489, introducing this time a regularisation parameter. The technique successfully eliminates the artificial red halo after 500 iterations 666For real images, a higher number of iterations does not help to get rid of the wiggles generated by the deconvolution technique in the inner regions. Noise in the initial images and imperfections in the PSF modeling combine to prevent any efficient correction. For our purpose - the correction of the outer regions from light scattering -, these artificial irregularities in the deconvolved image are not a problem..
The profile in the r-band is corrected by up to 0.4 mag.arcsec-2 at the 26 mag.arcsec-2 isophote, corresponding to about 9 . Because of the wavelength dependence of the PSF, the color profile is also affected by the light scattering. At the 26th mag.arcsec-2 isophote, the deconvolution makes the g-r color bluer by 0.2 mag. This results in an overall change of the color gradient: while the initial profile indicated an (artificial) reddening, the corrected one shows instead a bluing.
The change in the color profile becomes significant, i.e. larger than
the error bar, beyond 5 .
The error bars of the color profiles are calculated by taking the square root of the sum of the square of each band’s error.
NGC 3599 is representative of the lowest mass galaxies in the
MATLAS/ATLAS3D sample (see Table 1).
Results for this galaxy are shown in Figure 9. Both
the light and the color profile show almost no change after deconvolution
and the possible correction in the outermost part stays within the error
bars due to the low signal to noise level in this region.
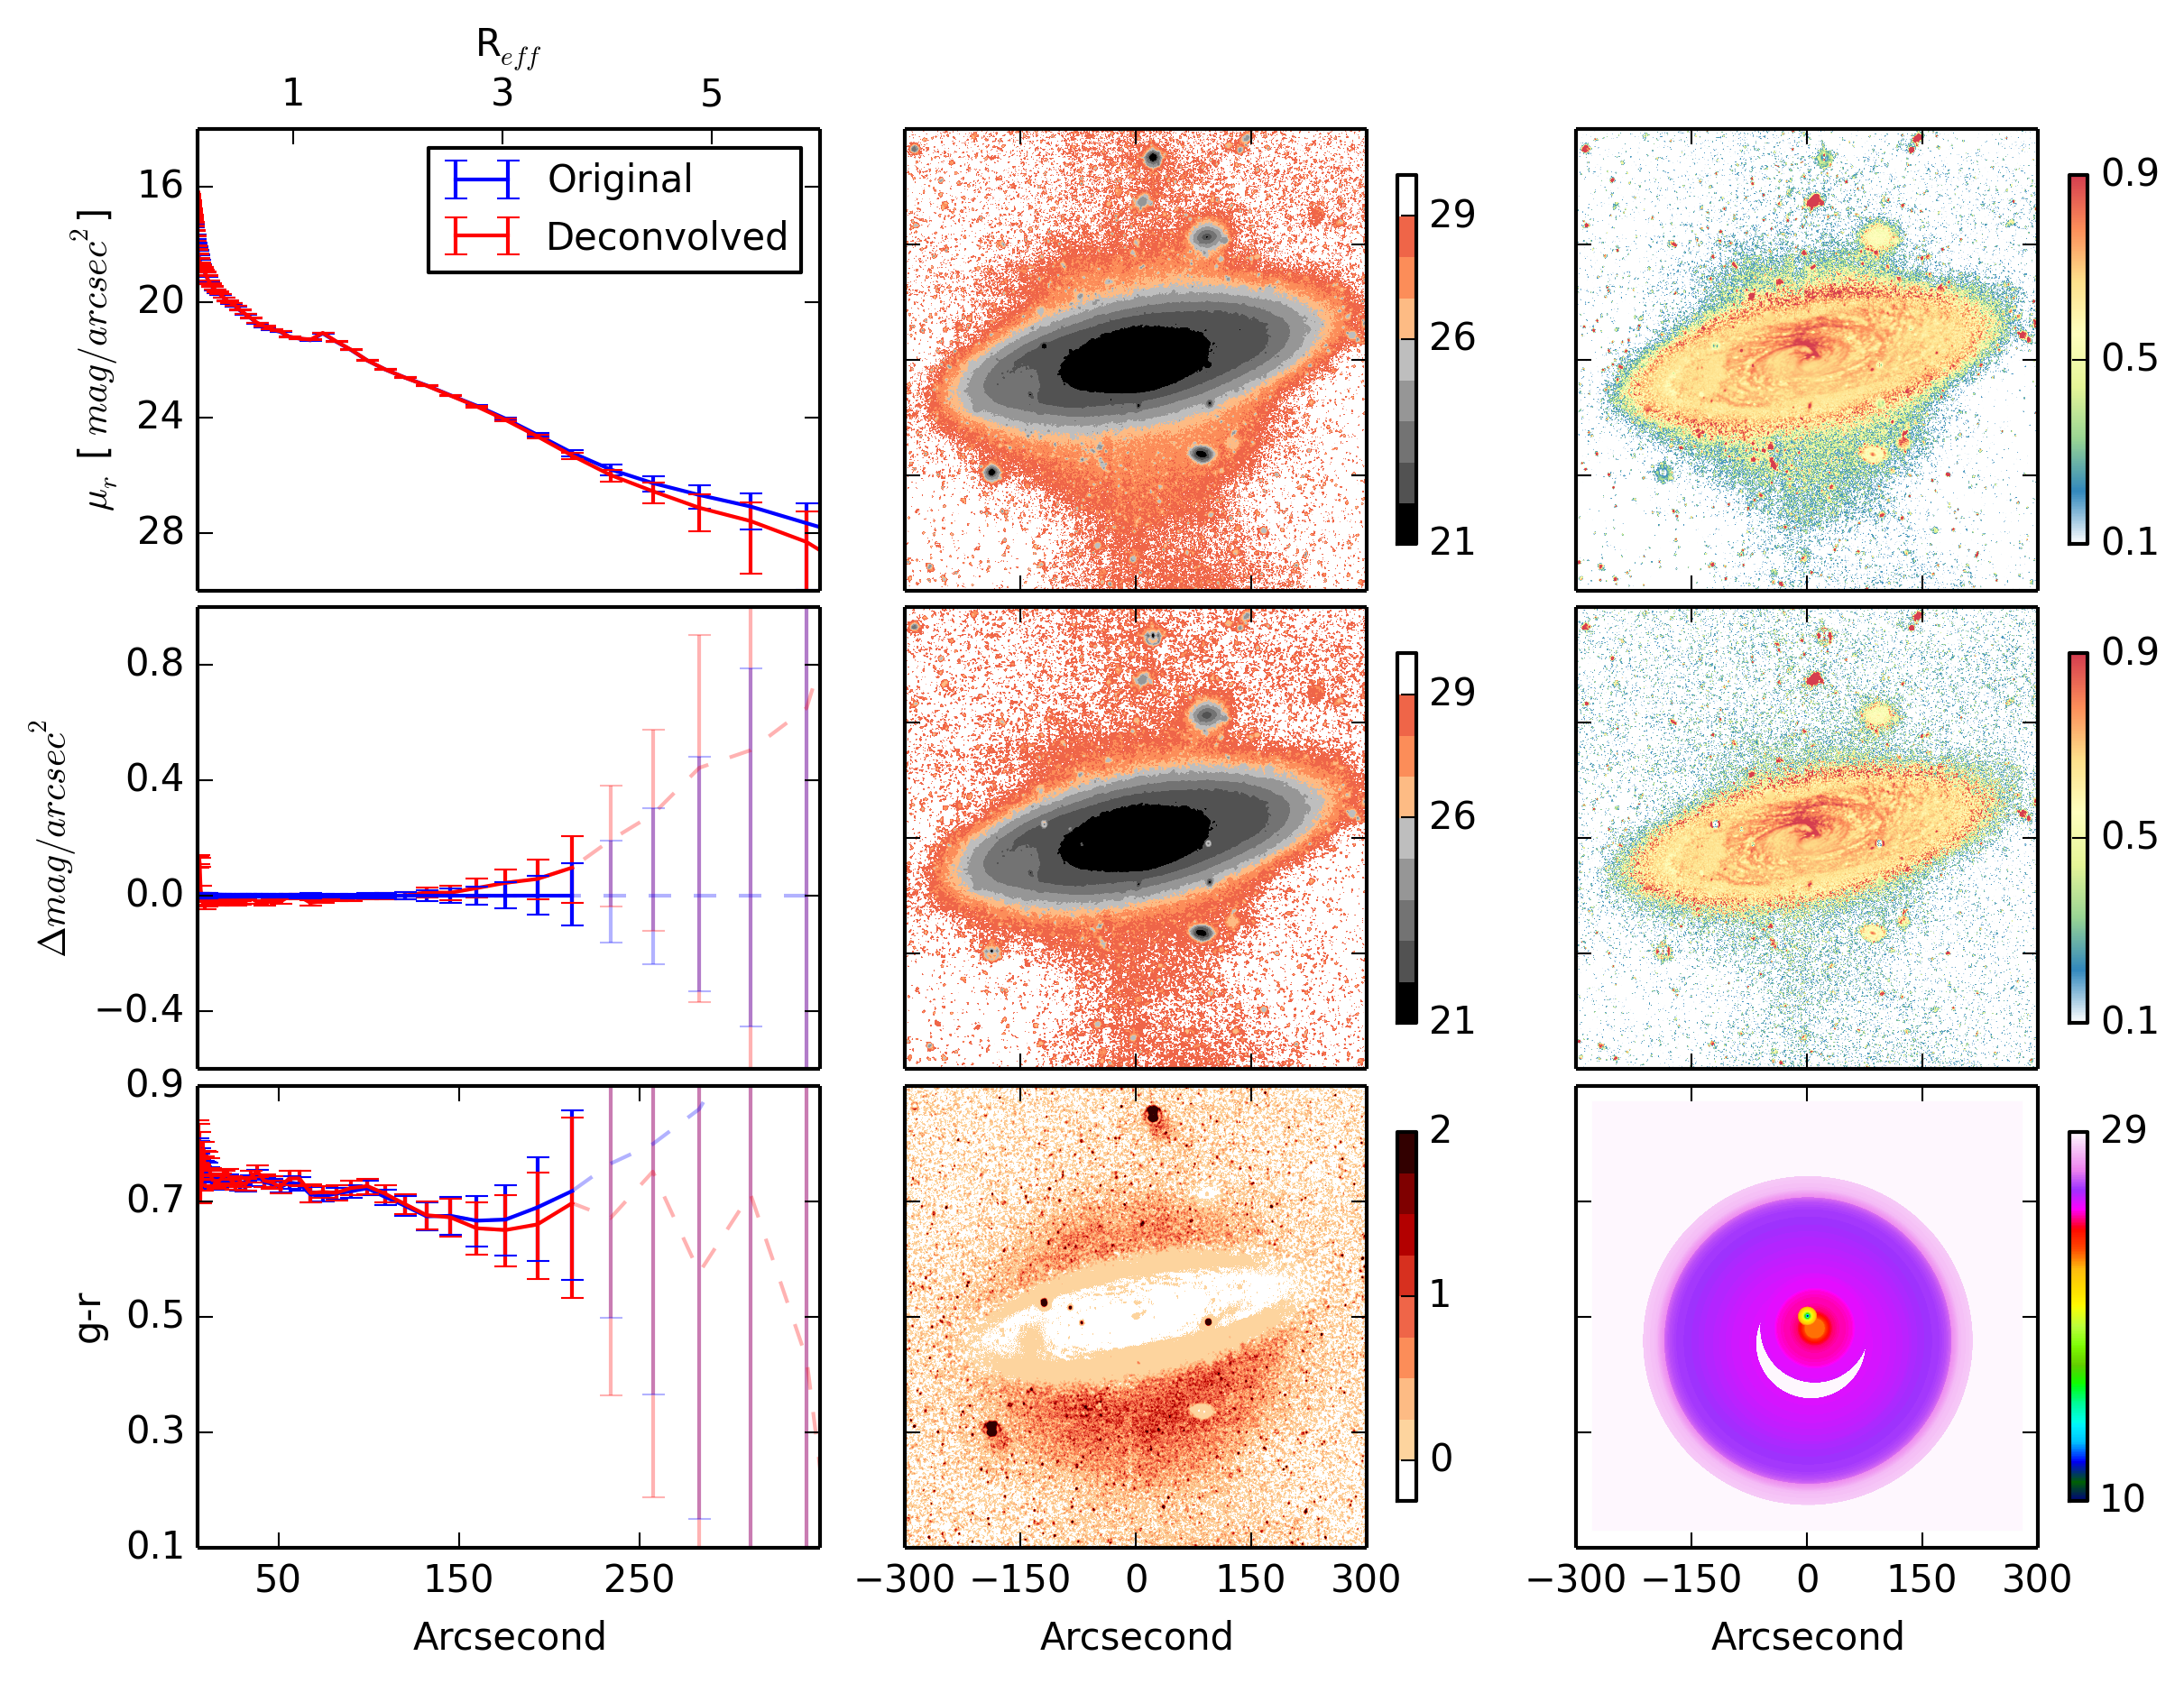
Finally the technique was tested on a late-type galaxy. LTGs that are not seen face-on have higher ellipticity and thus a shape that differs from the roundish one characteristics of the ghost halos. The scattered light is more likely to become dominant along the minor axis. LTGs are thus good cases to test the deconvolution technique. Although the MATLAS survey targets lenticular and elliptical galaxies, a number of spiral galaxies are present in the one square degree MegaCam field centred on the ETGs. At their location, often away from the center of the field, the PSF wings may be very different from the inner ones, and in particular the ghost halos may no longer be concentric. This is an opportunity to test the deconvolution method for this more complex configuration. We present here as a test case the LTG NGC 4274, located in the field of the ETG NGC 4278. An accurate PSF modeling was performed, and contrary to the previous cases, the centres of the halos were allowed to change positions. The results are shown in Figure 10. The deconvolution removed most of the original prominent ghost around the galaxy (but due to the position of the galaxy far from the center, not centred on it), but a faint residual is still visible, likely the result of the imperfect modeling of the PSF.
4 Discussion
In this section, we discuss the limitations of the deconvolution method, in particular due to the imperfect PSF modeling and saturation. The overall importance of scattered light in the MATLAS survey is briefly addressed.
4.1 Limitations of the method
The ability to recover the original profile in simulated images, and the removal of the ghosts around galaxies in real images testify the reliability of the deconvolution technique to achieve our primary goals: studying the light and color profiles of galaxies at large radius. However, as stressed before, in all convolution/deconvolution techniques, having a perfect knowledge of the PSF is critical. Our modeling of the PSF based on stars located within the science frames has some limitations.
First, the outer profile of each PSF is derived from a single bright star in the image that is not located at the exact position of the galaxy; it is in most cases selected as the closest bright star having a prominent stellar ghost. The PSFs are subsequently built for the center of the images and the reflections are modeled as concentric halos. The latter hypothesis is justified at the position of the target galaxy, close to the center of the MegaCam field, where no important decentering is observed. As illustrated in Section 3.2 with the case of the off-centered galaxy NGC 4274, even when allowing a decentering for the PSF model, the ghost subtraction is not perfect.
Besides, the PSF has been derived from stacked images and not from the individual ones. Our observing strategy requires to implement large offsets between them, up to 14 arcmin. So, as illustrated in Figure 2, the shape of the PSF, and associated ghost halos, differ from one image to the other. Thus in principle, a PSF model should be built for each image, and the deconvolution made before stacking using this specific PSF. This procedure would however highly increase the interaction and computation time making our largely manually method unpractical for the whole sample. As a tradeoff, a proper parametrisation of the ghost properties, and determination of the parameter spatial variations using linear regressions could be done (Slater et al. 2009). An even better method is to derive the PSFs with a physical model of the principle internal reflections in the camera. It would allow us to predict the PSF shape at each pixel. There are on-going efforts to achieve this for the MegaCam camera.
One should also note that, in practice, the individual images most often lack signal to build the outer wings of the PSFs with the method described in Section 2.3, and given the low S/N in the galaxy outskirts, the deconvolved image would be extremely noisy. The stacking procedure we used blurs the differences due to the large offsets. However it does it the same way for the stars used to derive the PSF and the target.
4.2 The importance of scattered light in the MATLAS survey
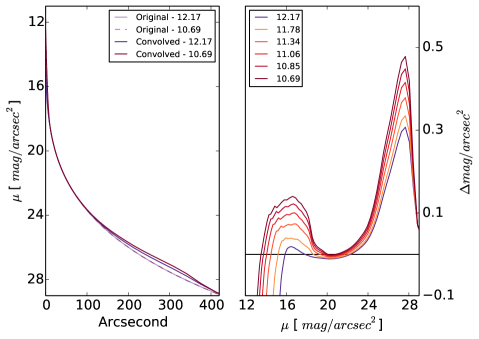
The results of both simulations and observations show that the scattering should significantly vary from galaxy to galaxy. In the MATLAS sample, we expect to see a significant effect for some of the galaxies and almost none for others, depending on the brightness of the nucleus and also on galaxy size. When the stellar light and signal-to-noise decrease, the correction for the scattered light becomes smaller than the error bars.
We have created a simulated galaxy to test how the brightness of nucleus determines the amount of scattered light. The galaxies’ properties are selected as described in Section 3.1. New galaxy models with higher central surface brightness are subsequently produced keeping the same light profile beyond r=5″ and steepening the inner profiles. All these images are then convolved with a real r-band PSF. The results are shown in Figure 11. Brighter cores indeed create more artificial flux which, for the model tested here, starts to be significant, i.e. above 0.1 mag.arcsec-2, beyond the 24 mag.arcsec-2 isophote. The effect peaks at the 27 mag.arcsec-2 isophote, and decreases at lower surface brightness, i.e. at large radius. This is due to the fact that for our model, the galaxy is more extended than the primary ghost (of 3.5 arcmin radius).
Conversely, if for whatever reason, including the presence of dust lanes, the nuclear light is dimmed, the ghosts become less prominent. Saturation is a special case for which the flux on the image is artificially dimmed while the light of the nucleus arriving on the detector and level of internal reflections is unchanged. Here, the image should have a ghost contamination higher than anticipated from the measured central brightness. In other words, since the deconvolution process corrects the scattered light effect in the outer region based on the bright core, deconvolution of saturated sources leads to underestimated corrections. About 75% of the galaxies in the MATLAS long exposures are saturated and short exposures have been acquired for all of them to recover the true inner profiles of the galaxies. The observations and the method of merging long and short exposure images to prevent saturation will be described in a future paper, together with the deconvolved light and color profiles of all MATLAS galaxies.
Note, however, that saturation will not necessarily significantly affect the reconstructed light profile for all galaxies. The effect is expected to be worse for relatively small low luminosity galaxies with a bright saturated nucleus. Such objects are actually rare in the ATLAS3D sample.
5 Conclusions
In this paper we have addressed the instrumental scattering effect in deep CFHT/MegaCam images. Our results are however relevant for the many cameras suffering from instrumental reflections (such as the one equipping the Sloan or ESO VST). These reflections produce wings – ghost halos – in the PSF, the importance of which depend on the wavelength and position in the field of view. With MegaCam, they are worse in the r–band. The wings of the PSF generate themselves ghost halos around the galaxies, that may be directly visible on the images as round, reddish, disks. The scattered light affects the shape of the light and color profiles of galaxies. Our simulations show that the effect is worse between the 24th and 28th mag.arcsec-2 isophote, a region of prime importance as it accumulates tidal debris and thus trace the last accretion events of galaxies.
We have presented a method, based on a direct deconvolution of the image, which is able to efficiently remove the ghost halos in a relatively low number of iterations. It requires a proper modeling of the PSF, made combining the inner profile of stacked faint stars in the field, and the outer profile of a bright (saturated) star close to the galaxy. We have built a PSF database covering different seeing conditions, bands and locations on the MegaCam field of view. With respect the model-convolution technique also used to remove artificial halos in deep images, the deconvolution technique has the advantage of not requiring a proper, multi-component, modeling of the galaxy. It is thus much faster for large samples of complex galaxies, such as those studied as part of the MATLAS deep imaging survey. Intensive tests of the method have been made on simulations and on real galaxies presenting a variety of morphologies and sizes. We have presented here the results for three test cases: NGC 3489, NGC 3599 and NGC 4274.
The saturation in the cores of some of the galaxies in principle averts the proper removal of the ghosts. A follow-up short exposure program has been completed to allow us to carry out a proper analysis. The full analysis of the sample will be presented in a following paper.
Acknowledgements.
We thank the referee for his carefully reading of the paper and for having pointing out some issues that required some further analysis. The paper is based on observations obtained with MegaPrime/MegaCam, a joint project of CFHT and CEA/DAPNIA, at the Canada-France-Hawaii Telescope (CFHT), which is operated by the National Research Council (NRC) of Canada, the Institute National des Sciences de l’Univers of the Centre National de la Recherche Scientifique of France, and the University of Hawaii. All observations were made as part of the service mode offered by the CFHT. We are grateful to the queue team for their dedication. We warmly thank C. Mihos, N. Regnault, C. Sandin, I. Trujillo and L. Kelvin for the multiple discussions on ghost and scattered light effects. We are grateful to the CFHT staff for they dedication to the data acquisition.References
- Abraham & van Dokkum (2014) Abraham, R. G. & van Dokkum, P. G. 2014, PASP, 126, 55
- Bertin (2011) Bertin, E. 2011, in Astronomical Society of the Pacific Conference Series, Vol. 442, Astronomical Data Analysis Software and Systems XX, ed. I. N. Evans, A. Accomazzi, D. J. Mink, & A. H. Rots, 435
- Bertin & Arnouts (1996) Bertin, E. & Arnouts, S. 1996, A&AS, 117, 393
- Boulade et al. (2003) Boulade, O., Charlot, X., Abbon, P., et al. 2003, in Proc. SPIE, Vol. 4841, Instrument Design and Performance for Optical/Infrared Ground-based Telescopes, ed. M. Iye & A. F. M. Moorwood, 72–81
- Bullock & Johnston (2005) Bullock, J. S. & Johnston, K. V. 2005, ApJ, 635, 931
- Cappellari et al. (2011) Cappellari, M., Emsellem, E., Krajnović, D., et al. 2011, MNRAS, 413, 813
- Cappellari et al. (2013) Cappellari, M., Scott, N., Alatalo, K., et al. 2013, MNRAS, 432, 1709
- Chanial & Barbey (2012) Chanial, P. & Barbey, N. 2012, in SF2A-2012: Proceedings of the Annual meeting of the French Society of Astronomy and Astrophysics, ed. S. Boissier, P. de Laverny, N. Nardetto, R. Samadi, D. Valls-Gabaud, & H. Wozniak, 513–517
- Cooper et al. (2010) Cooper, A. P., Cole, S., Frenk, C. S., et al. 2010, MNRAS, 406, 744
- Duc et al. (2015) Duc, P.-A., Cuillandre, J.-C., Karabal, E., et al. 2015, MNRAS, 446, 120
- Ferrarese et al. (2012) Ferrarese, L., Côté, P., Cuillandre, J.-C., et al. 2012, ApJS, 200, 4
- Iodice et al. (2016) Iodice, E., Capaccioli, M., Grado, A., et al. 2016, ApJ, 820, 42
- Janowiecki et al. (2010) Janowiecki, S., Mihos, J. C., Harding, P., et al. 2010, ApJ, 715, 972
- Landsman (1993) Landsman, W. B. 1993, in Astronomical Society of the Pacific Conference Series, Vol. 52, Astronomical Data Analysis Software and Systems II, ed. R. J. Hanisch, R. J. V. Brissenden, & J. Barnes, 246
- Martínez-Delgado et al. (2010) Martínez-Delgado, D., Gabany, R. J., Crawford, K., et al. 2010, AJ, 140, 962
- Michard (2002) Michard, R. 2002, A&A, 384, 763
- Mihos et al. (2005) Mihos, J. C., Harding, P., Feldmeier, J., & Morrison, H. 2005, ApJ, 631, L41
- Miville-Deschenes et al. (2016) Miville-Deschenes, M.-A., Duc, P.-A., Marleau, F., et al. 2016, ArXiv e-prints [arXiv:1605.08360]
- Naab et al. (2007) Naab, T., Johansson, P. H., Ostriker, J. P., & Efstathiou, G. 2007, ApJ, 658, 710
- Oser et al. (2010) Oser, L., Ostriker, J. P., Naab, T., Johansson, P. H., & Burkert, A. 2010, ApJ, 725, 2312
- Peng et al. (2002) Peng, C. Y., Ho, L. C., Impey, C. D., & Rix, H.-W. 2002, AJ, 124, 266
- Peng et al. (2010) Peng, C. Y., Ho, L. C., Impey, C. D., & Rix, H.-W. 2010, AJ, 139, 2097
- Pillepich et al. (2015) Pillepich, A., Madau, P., & Mayer, L. 2015, ApJ, 799, 184
- Sandin (2014) Sandin, C. 2014, A&A, 567, A97
- Sandin (2015) Sandin, C. 2015, A&A, 577, A106
- Slater et al. (2009) Slater, C. T., Harding, P., & Mihos, J. C. 2009, PASP, 121, 1267
- Trujillo & Fliri (2015) Trujillo, I. & Fliri, J. 2015, ArXiv e-prints [arXiv:1510.04696]
- van Dokkum et al. (2014) van Dokkum, P. G., Abraham, R., & Merritt, A. 2014, ApJ, 782, L24
- Vika et al. (2013) Vika, M., Bamford, S. P., Häußler, B., et al. 2013, MNRAS, 435, 623