iPTF Discovery of the Rapid ”Turn On” of a Luminous Quasar
Abstract
We present a radio-quiet quasar at discovered “turning on” by the intermediate Palomar Transient Factory (iPTF). The transient, iPTF 16bco, was detected by iPTF in the nucleus of a galaxy with an archival SDSS spectrum with weak narrow-line emission characteristic of a low-ionization emission line region (LINER). Our follow-up spectra show the dramatic appearance of broad Balmer lines and a power-law continuum characteristic of a luminous ( ergs s-1) type 1 quasar 12 years later. Our photometric monitoring with PTF from 2009-2012, and serendipitous X-ray observations from the XMM-Newton Slew Survey in 2011 and 2015, constrain the change of state to have occurred less than 500 days before the iPTF detection. An enhanced broad H to [O III] 5007 line ratio in the type 1 state relative to other changing-look quasars also is suggestive of the most rapid change of state yet observed in a quasar. We argue that the increase in Eddington ratio inferred from the brightening in UV and X-ray continuum flux is more likely due to an intrinsic change in the accretion rate of a pre-existing accretion disk, than an external mechanism such as variable obscuration, microlensing, or the tidal disruption of a star. However, further monitoring will be helpful in better constraining the mechanism driving this change of state. The rapid “turn on” of the quasar is much shorter than the viscous infall timescale of an accretion disk, and requires a disk instability that can develop around a black hole on timescales less than a year.
Subject headings:
galaxies:active – accretion, accretion disks – black hole physics – surveys1. Introduction
Variability is a ubiquitous property of quasars on timescales of hours to years, and likely attributed to processes in the accretion disk fueling the central supermassive black hole (SMBH) (Pereyra et al., 2006; Kelly et al., 2009). More dramatic changes in accretion activity are also expected to occur on much longer timescales. Hydrodynamic simulations of quasar fueling and feedback reveal a “duty cycle” of accretion activity on timescales of a Myr (Novak et al., 2011), and may explain the lack of clear observational evidence for causal connections between AGN activity and star-formation in galaxy studies (Hickox et al., 2014). Observations of ionization nebulae on the outskirts of galaxies have indicated the shut off of quasar engines on timescales of tens of thousands of years (e.g., Schawinski et al., 2010), and our own Galactic center shows signs of X-ray reflection from enhanced nuclear activity on a timescale of only hundreds of years ago (Ponti et al., 2010). However, as we explore the behavior of active galactic nuclei (AGN) more systematically in the time domain with optical imaging and spectroscopic surveys, we are finding evidence for significant accretion state changes on even shorter timescales.
In the AGN unification model, type 1 (spectra with narrow and broad lines) and type 2 (spectra with narrow lines only) classifications are explained as a viewing angle effect due to nuclear obscuration of the broad-line region and accretion disk continuum (Antonucci, 1993). A challenge to this paradigm is the rare class of “changing-look” AGN, who change their spectral class with the appearance and/or disappearance of broad Balmer lines, accompanied by large-amplitude changes in the AGN continuum. Most of the changing-look AGN cases reported to date have been spectroscopically known Seyferts who have shown a dramatic appearance or disappearance of their broad Balmer lines in follow-up spectra resulting in a “change of state” between a type 1 and a type 1.8-2 spectrum. A type 1.8 or 1.9 Seyfert classification depends on the presence of weak broad H or broad H, respectively (Osterbrock, 1981).
Notable examples of changing-look AGN include the appearance of broad, double-peaked H and H lines in LINER galaxy NGC 1097 (Storchi-Bergmann et al., 1993), and the complete disappearance of the broad H line in Seyfert 1 galaxy Mrk 590 (Denney et al., 2014). More recently the ASAS-SN optical time domain survey discovered an outburst from NGC 2617 at , that was accompanied by a transition from a Seyfert 1.8 to a Seyfert 1 optical spectrum on a timescale of yr (Shappee et al., 2014). And recent follow-up observations of the changing-look AGN Mrk 1018, which had changed from a type 1.9 to type 1 Seyfert in 1984, revealed a change back to a type 1.9 Seyfert 30 years later (McElroy et al., 2016). The fact that the variable UV/optical continuum in Mrk 1018 followed the relation expected for thermal emission from a disk, and that there was no evidence for neutral hydrogen absorption in its X-ray spectrum, favored intrinsic changes in the accretion flow instead of an obscuration event (Husemann et al., 2016), which has been inferred to be the cause for rapid drops in the UV continuum (Guo et al., 2016) and X-ray flux (Risaliti et al., 2009; Marchese et al., 2012) in some AGN.
The first case of a changing-look AGN with the luminosity of a quasar (which we define as ergs s-1) was SDSS J0159+0033 at (LaMassa et al., 2015), which was discovered to change from a type 1 to type 1.9 spectrum between its SDSS DR1 spectrum in 2001 and its SDSS-III BOSS spectrum in 2010. Since then, there was a systematic search by Ruan et al. (2016) of SDSS quasars with multiple epochs of spectra for which the spectroscopic pipeline classification changed between a ”QSO” to a ”GALAXY”, or vice versa, that recovered SDSS J0159+0033, and revealed two more cases of changing-look quasars (at and ) with a dimming in their continuum and disappearance of the broad H line on a timescale of years in the rest-frame. An archival search of SDSS quasars with multiple epochs of spectra and large amplitudes of variability ( mag) by MacLeod et al. (2016) also yielded SDSS J0159+0033, and 9 more changing-look quasars at , 5 of which show the appearance of broad H between the SDSS and BOSS spectral epochs. New epochs of spectra from the Time-Domain Spectroscopic Survey (TDSS; Morganson et al. (2015)) have also revealed one new case of a transition from a type 1 to type 1.9 quasar at z=0.246 (Runnoe et al., 2016).
Here we report the rapid ( yr) emergence of a type 1 radio-quiet quasar from a galaxy at with weak narrow-line emission in its pre-event spectrum characteristic of a LINER nucleus that does not require an AGN to power the line emission. Throughout this paper, we refer to quasars as radio quiet or radio loud AGN above a bolometric luminosity of ergs s-1. We also adopt a cosmology where km s-1 and and , yielding a luminosity distance for iPTF 16bco of Mpc.
2. Observations
2.1. SDSS Archival Imaging and Spectroscopy
The source SDSS J155440.25+362952.0 was imaged by the SDSS survey on UT 2003 April 29 (all days hereafter are in the UT system), and morphologically classified as a galaxy with mag. It was targeted in the SDSS spectroscopic legacy survey as a -selected quasar, selected for lying more than 4 from the stellar locus (Richards et al., 2002) at high Galactic latitude (QSO_CAP). It turns out that while the colors measured in the SDSS survey are outside the stellar locus, with mag, mag, and mag, given the known redshift of the galaxy, they are inconsistent with the quasar color-redshift relation measured for the SDSS spectroscopic sample (Schneider et al., 2007).
The SDSS legacy spectrum, obtained on 2004 June 16, was determined by the spectroscopic pipeline to have a , and a spectroscopic classification of a ”GALAXY”, with a stellar velocity dispersion of km/s. The galaxy classification was due the presence of strong galaxy absorption features (Ca H&K, G band, Mg I, Na D), with only weak [O III] and [N II] emission lines detected. According to the scaling relation, this velocity dispersion corresponds to a central black hole mass of (McConnell & Ma, 2013).
We find no evidence for significant flux variations between the SDSS survey image in 2003 and legacy spectrum in 2004. The synthetic -band magnitude of the 2004 SDSS spectrum (measured by projecting the best-fit spectral template onto the -band filter) is spectroSynFlux_r mag. The corresponding fiber magnitude for the SDSS imaging in 2003 (measured with an aperture equal to the 3 diameter spectroscopic fiber) is mag. Since the SDSS spectrum in 2004 is dominated by host galaxy starlight in the wavelength range of the -band ( Å), we conclude that the SDSS image in 2003 is also dominated by host galaxy starlight.
2.2. GALEX Archival Imaging
The source was observed by the GALEX All-Sky Imaging Survey on 2004 May 15 with an 6 (4 pixel) radius aperture magnitude corrected for the total energy enclosed (Morrissey et al., 2007) of mag, and a 5 point-source upper limit of mag for s, and a background of cts s-1 pix-1. Note that the color measured by GALEX and SDSS of mag is entirely consistent with normal galaxies with a similar luminosity on the blue sequence (Wyder et al., 2007).
2.3. iPTF Detection
iPTF 16bco was discovered as a transient detection by the Palomar 48-in telescope (P48) on 2016 Jun 1 during an (intermediate) Palomar Transient Factory (iPTF) band experiment by the real-time difference imaging pipeline run at LBNL (Cao et al., 2016), with mag and mag. The source was flagged as a “nuclear” transient given the measured offset of arcsec from its host galaxy; within our centroiding accuracy of arcsec. The data were re-reduced with the PTFIDE pipeline run at IPAC (Masci et al., 2016).
2.4. Follow-up Spectroscopy
On the next day after the discovery (2016 Jun 2), the transient iPTF 16bco was followed-up with the robotic low-resolution (R = ) Integral Field Unit (IFU) spectrograph, part of the Spectral Energy Distribution Machine (SEDM) instrument on the Palomar 60-in telescope (P60). The spectrum was strikingly different than its archival SDSS spectrum, and three more epochs of spectroscopy were obtained with DEIMOS (Faber et al., 2003) on the Keck-II telescope on 2016 June 4, and the DeVeny spectrograph on the Discovery Channel Telescope (DCT) on 2016 June 13 and 2016 July 9.

The SEDM IFU obtained 2700 s exposures on 2016 June 2 and July 24, and data reduction was performed by the SEDM pipeline00footnotetext: http://www.astro.caltech.edu/sedm. Sky subtraction was performed using “A-B” extraction: two exposures of the same length are taken offset by a few arcsec, so that the object of interest lies on an empty sky region on the next exposure, and then subtracted from each other to remove the sky lines. The spectrum is extracted in each exposure separately, and then the fluxes are summed to get the final spectrum.
The Keck spectrum was obtained with a 08 slit and the exposure time was 240 seconds. Data were reduced with usual procedures from the DEEP2 pipeline in IDL (Cooper et al., 2012; Newman et al., 2013) and in PyRAF. The flux calibration and telluric correction were done with the flux standard star BD262606. The spectrum covers wavelengths ranging from 4550 Å to 9550 Å with a spectral resolution of 4 Å. The DCT spectra were obtained with a 15 slit and an exposure time of 600 s and 1200 s, respectively, with a spectral resolution of Å. Data were reduced in standard IRAF routines, and flux calibration was performed with the flux standard star BD+40d4032.
Figure 1 shows the series of follow-up spectra, which demonstrate strong, broad, Balmer emission lines characteristic of a type 1 quasar at .
2.5. Palomar 60 inch Imaging
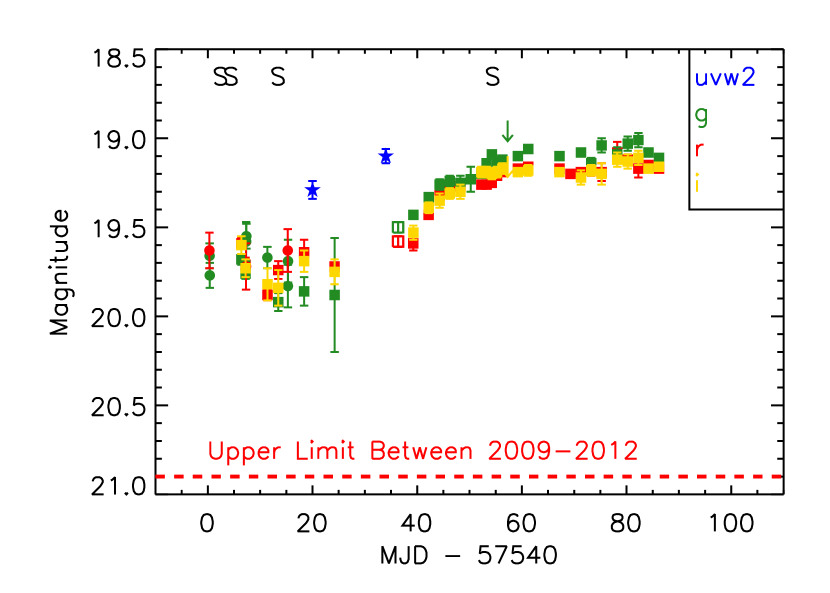
We also monitored the source in 3 filters () with the SEDM on the P60 telescope. The data were host-subtracted using FPipe (Fremling et al., 2016). One epoch of the P60 data points on MJD 57576 are from the GRBCam. We do not plot the -band GRBCam data from this night due to the large difference in the shape of its filter transmission curve in this band. The light curve of the transient iPTF 16bco is presented in Figure 2, and the photometry is given in Table 1. We adjust the -band P48 photometry by +0.25 mag in order to match the P60 photometry. This offset is attributed to the difference in filter curves in the -band, and the strong blue continuum. Note that since its discovery by iPTF on 2016 Jun 1 in the and bands, iPTF 16bco has retained a blue color, mag, and demonstrated a rise in brightness of 0.5 mag over a timescale of month.
2.6. PTF Historical Light Curve
The source was observed in the PTF survey in , and no variability was detected in this time frame, with a median transient point source upper limit over 151 epochs of mag, with the last non detection on 2012 May 28. When adding in the host galaxy flux measured by SDSS, this corresponds to a total magnitude of mag, or a mag during this time period. The P48 observations constrain the onset of the nuclear transient to be after the last non-detection on 2012 May 28, 4 years before the iPTF discovery.
2.7. Swift Observations
The source was observed with our Swift Key Project program for UV follow-up of iPTF nuclear transients (PI: Gezari) on 2016 June 21 and July 5. We extracted the source from a 50 region using a background region of 200 radius using the task uvotsource in HEASoft which includes a correction for the enclosed energy in the aperture. The source was observed in the filter with ks exposures, and detected with mag and mag in the AB system, respectively. The corresponding UV-optical color of iPTF 16bco (with a negligible contribution of UV flux from the host) is mag, notably bluer than the colors of low-redshift quasars measured by GALEX and SDSS ( mag) (Bianchi et al., 2005; Agüeros et al., 2005).
Simultaneous Swift XRT observations were processed with the UK Swift Data Science Centre111http://www.swift.ac.uk/user_objects/ pipeline that takes into account dead columns and vignetting to extract counts from the source in the energy range of 0.3-10 keV. The X-ray count rate on June 21 and July 5 is and counts s-1, respectively. We further obtained a 1.7 ks Swift XRT exposure on 2016 October 21 and the source was detected with counts s-1. This confirms the lack of significant X-ray variability between the Swift observations. Furthermore, the combined spectrum of all the data can be modeled with an absorbed power-law with a spectral index of and fixed at the Galactic value of cm-2 (Dickey & Lockman, 1990). The average unabsorbed 0.2-10 keV flux of the source is ergs s-1 cm-2, corresponding to a luminosity of ergs s-1 by assuming an absorbed power-law with cm-2 and at .
2.8. Archival X-ray Observations
The ROSAT upper limit in the 0.1-2.4 keV band from All-Sky Survey in 1990-1991 (Voges et al., 1999) is 0.1 cts s-1 which corresponds to an unabsorbed flux of ergs s-1 cm-2. There are even more constraining 2 upper limits from the XMM Slew Survey222http://xmm.esac.esa.int/UpperLimitsServer/ of and cts s-1 in the keV band on 2011 Feb 27 and 2015 Feb 08 corresponding to and ergs s-1 cm-2, respectively. The latest XMM Slew Survey upper limit implies a factor of increase in flux in the Swift XRT detection on a timescale of yr in the quasar rest-frame.
2.9. Radio Observations
We observed iPTF 16bco with the AMI-LA at 15.5 GHz on 2016 Oct 16.63. The source is not detected, with the 3 upper limit of 68 Jy. We can also convert this to a 1.4 GHz upper limit of 370 Jy using a spectral index of . This is consistent with the non-detection in the VLA FIRST survey (Becker et al., 1995) from 1999 which gives an independent 1.4 GHz upper limit of 500 Jy.
3. Analysis
3.1. Host Galaxy Classification
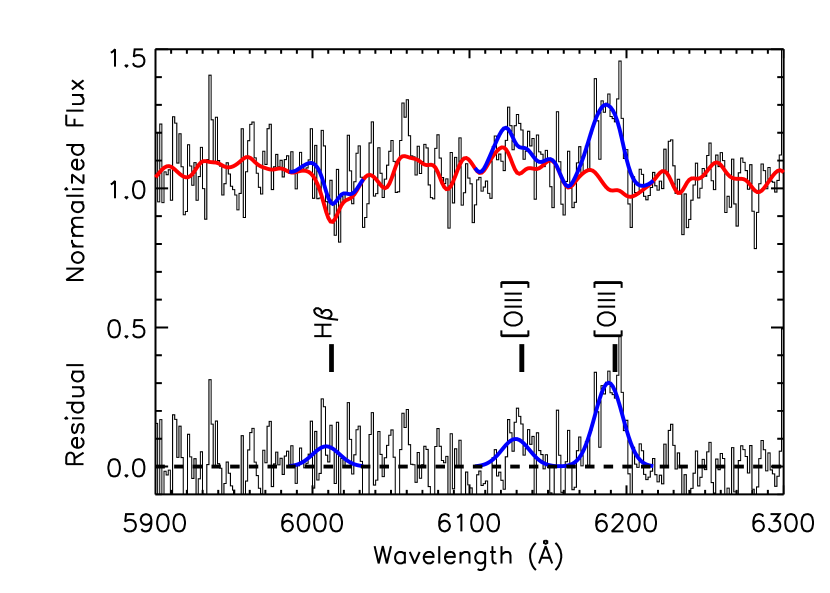
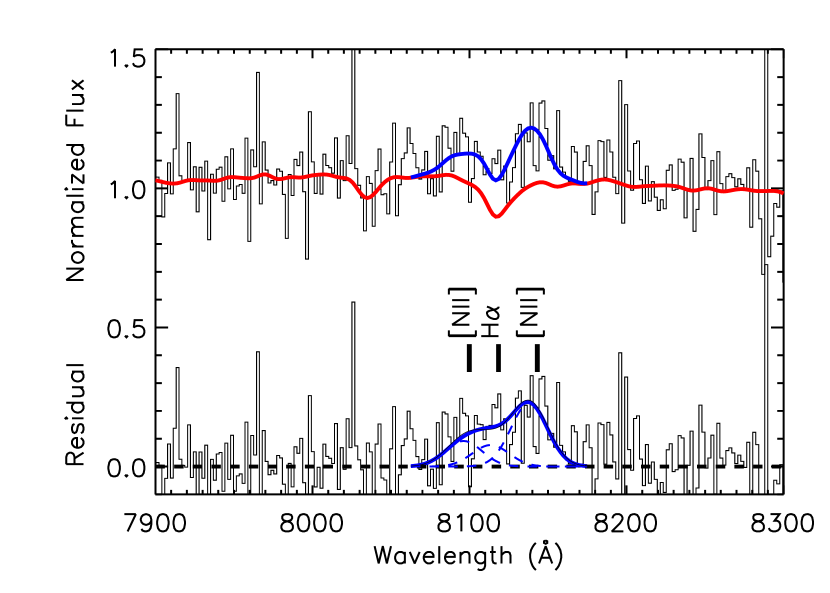
The archival SDSS spectrum from 2004 was fitted by the automated spectroscopic pipeline (Bolton et al., 2012) with a combination of stellar, galaxy, and quasar templates plus emission lines. After visual inspection of the pipeline fit, we found a poor fit to the the H+[N II] and [O III] emission line complexes, and refitted the spectrum with host galaxy template and emission-line gas components using ppxf (Cappellari & Emsellem, 2004; Cappellari, 2016) which uses the MILES stellar template library (Vazdekis et al., 2010). The emission line fits are shown in Figure 3, and are fitted with a narrow Gaussian with a km s-1, with no evidence for a broad H or H components. The narrow-line ratios of ([O III]/H and ([N II] H, together with ([O III] ) = ergs s-1, classify the SDSS spectrum as a type 2 AGN in the LINER region (Kewley et al., 2006) in the diagnostic narrow-line diagrams (Baldwin et al., 1981; Veilleux & Osterbrock, 1987; Kauffmann et al., 2003) shown in Figure 4. Note that the archival WISE colors from the all-sky survey in 2010 (Cutri et al., 2011) of W1-W2 = 0.48 mag and W2-W3 = 1.6 mag, where W1, W2, and W3 are 3.4, 4.6, and 12 m, respectively, place the host in the region of Seyfert and star-forming galaxies (Yan et al., 2013). However, in the WHAN diagram (shown in Figure 4) for emission-line galaxies (Cid Fernandes et al., 2010, 2011), the weak equivalent-width of H ( Å) classifies the galaxy as a “retired galaxy” powered by hot low-mass evolved (post-asymptotic giant branch) stars and not an AGN.

3.2. Change of State
The transient iPTF 16bco shows two remarkable changes: a factor of 10 increase in UV flux, and a transformation from a LINER galaxy to a luminous type 1 quasar. Figure 5 shows the dramatic change of state between the SDSS spectrum in 2004 and the follow-up Keck spectrum in 2016.
3.2.1 Continuum Variability
According to the empirical correlation between hard X-ray emission and [O III] luminosity for AGNs (Heckman et al., 2005; Ueda et al., 2015), from the [O III] luminosity measured in the pre-event SDSS spectrum in 2004, one would expect )keV ergs s-1. This could be even lower if the narrow line emission in iPTF 16bco is powered by stars, and infers a pre-event X-ray luminosity at least an order of magnitude below the X-ray luminosity of ergs s-1 measured by Swift XRT during the type 1 state of iPTF 16bco in 2016. The change in flux between the GALEX AIS measurement in 2004 and the Swift UVOT measurement in 2016 also indicates a brightening by mag. Allowing for some fraction of the flux in the GALEX measurement to be from star-formation in the host galaxy, this yields a lower-limit of a factor of increase in flux.
When adding back in the host galaxy -band magnitude measured by SDSS (see §2.1) the amplitude of optical variability since 2003 is only mag. However, since the SDSS photometry in 2003 is dominated by host galaxy starlight, the mag of variability is only a lower limit to the true amplitude of the continuum increase in the optical.
Thus we conclude that the continuum in iPTF 16bco had an increase in X-ray/UV/optical flux by a factor of between 2004 and 2016. It is not entirely surprising that such a large increase in the photoionizing continuum was also accompanied by dramatic spectral changes.
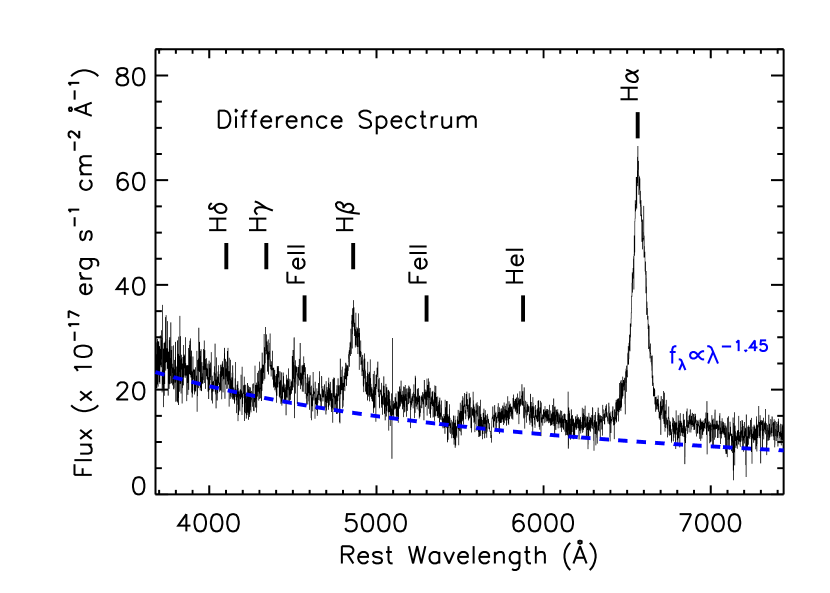
3.2.2 Spectral Variability
The spectra of iPTF 16bco demonstrate a strong blue continuum and broad Balmer-line, Fe II, and He I features characteristic of a type 1 quasar. Figure 5 also shows the difference between the Keck spectrum in 2016 and the archival SDSS spectrum from 2004. After correcting for Galactic extinction of E(BV) = 0.021 mag from the Schlegel et al. (1998) dust extinction map and using the extinction curve of Cardelli et al. (1989), the continuum in the difference spectrum (after masking the broad emission lines) is reasonably fitted with a single power law of , where . This is shallower than the standard theoretical thin accretion disc spectrum with , where , and , which is well fitted to difference spectra (Wilhite et al., 2005; MacLeod et al., 2016) and difference spectral energy distributions (Hung et al., 2016) of quasars. However, it is close to the power-law observed in averaged optical quasar spectra () blueward of H (Vanden Berk et al., 2001; Wilhite et al., 2005). A power-law index similar to the average quasar spectrum in the difference spectrum is another indication that the low-state spectrum has very little contribution from a non-stellar continuum.
The [O III] luminosity in 2016 is ergs s-1, consistent within the errors of the [O III] luminosity measured in SDSS. The broad H flux, in contrast, dramatically appears, with (H ergs s-1 with a full-width at half-maximum (FWHM) of km s-1. This difference in behavior between the broad and narrow lines can be explained by the fact the [O III] line luminosity traces the average AGN continuum over a much longer timescale that the flaring event detected by iPTF. While the emissivity decay time (dominated by recombination charge transfer) for [O III] is only a few years, light-travel time effects prolong the response time to hundreds of years (the light-crossing time of the narrow-line region) (Eracleous et al., 1995). Thus the narrow-line region has not yet had the chance to respond to the continuum flux changes happening on the timescale of year.
The monochromatic optical luminosity in the 2016 Keck spectrum after subtracting the starlight using the archival SDSS spectrum, is Å) = ergs s-1 Å erg s-1. This is in excellent agreement with the nearly linear correlation between broad H luminosity and optical continuum luminosity in AGN (Greene & Ho, 2005), which for this broad H luminosity, one would expect (5100 Å) ergs s-1.
The FWHM of the broad H line, km s-1, and the monochromatic luminosity at 5100 Å can be used to estimate the central black hole mass to be (Vestergaard & Peterson, 2006), in good agreement with inferred from the host galaxy stellar velocity dispersion. We adopt a bolometric correction factor for the monochromatic optical luminosity of 8.1 (Runnoe et al., 2012) to get ergs s-1. We then derive an Eddington ratio of during the type 1 quasar state.
3.3. Nature of the Variability
3.3.1 Variable Obscuration or Microlensing
The Eddington ratio inferred for iPTF 16fnl from its nearly constant narrow [O III] line luminosity is in disagreement with the Eddington ratio observed in its type 1 quasar state (). Therefore, we favor a change in accretion rate (intrinsic change of state) in the quasar as opposed to variable obscuration (extrinsic change of state) of a non-variable quasar.
Timescale arguments also disfavor a variable line-of-sight extinction due to the disappearance of an intervening absorber to explain the appearance of the broad H line in iPTF 16bco. In the case of an obscuring cloud, the distance between the nucleus and the cloud must be larger than the radius of the broad-line region it is obscuring. Using the radius-luminosity relation measured for AGN from reverberation mapping studies of broad lines (Bentz et al., 2013), the luminosity of iPTF 16bco would have H broad-line emission with a characteristic radius of days. Following the argument of LaMassa et al. (2015) (Equation 4), this translates to a crossing time on a circular, Keplerian orbit, , where arcsin is the angular length of the arc, and is the Keplerian frequency, which for yields yr, which is much longer than the timescale over which the continuum appeared in iPTF 16bco.
Finally, we note that lensing of a background broad-line quasar by a star in an intervening galaxy (Lawrence et al., 2016) is also ruled out, since the redshift of the quasar is the same as the galaxy in its dim state.

3.3.2 Tidal Disruption Event
One mechanism to rapidly increase the mass accretion rate onto a SMBH is to get a new supply of gas from a star that wanders close enough to the SMBH to be torn apart by tidal forces. In a tidal disruption event (TDE), roughly half of the disrupted stellar debris remains bound to the black hole, falls back onto the SMBH, circularizes through shocks, and is accreted (Rees, 1988). The characteristic timescale of a TDE is the orbital period of the most tightly bound debris, which is given by yr, where , and (Lodato & Rossi, 2011). The peak mass accretion rate is given by , and can exceed the Eddington rate ( yr-1, where is the radiative efficiency) for black holes . Following the peak, a TDE has a characteristic power-law decay determined by the fallback rate of the stellar debris to pericenter (Rees, 1988; Phinney, 1989; Evans & Kochanek, 1989).
However, we point out several issues with interpreting the flaring state of iPTF 16bco with a TDE. 1) For a , the tidal disruption radius of a solar-type star ( cm) is smaller than the Schwarzschild radius ( cm), and the star crosses the event horizon before being disrupted. 2) The X-ray power-law () continuum of iPTF-16bco is unlike the extremely soft, thermal X-ray spectra observed in TDEs (Komossa, 2002; Miller et al., 2015). 3) The light curve of iPTF 16bco shows a complex shape uncharacteristic of a TDE, with month-long plateau, followed by a 2 week rise to another plateau. 4) The broad Balmer lines in iPTF 16bco are narrower and stronger than have been observed in TDEs, and iPTF 16bco does not have strong broad He II which is characteristic of TDE spectra (Gezari et al., 2012; Arcavi et al., 2014; Holoien et al., 2014, 2016a, 2016b). 5) Finally, the fact that the broad-line emission and X-ray continuum in iPTF 16bco are consistent with radio-quiet quasars in the “Eigenvector 1” parameter space: the FWHM velocity width of the broad H line vs. the ratio of the equivalent widths of the Fe II 4570 complex to broad H strength () (Sulentic et al., 2000), favors a change in of a pre-existing accretion disk, instead of a newly formed debris disk from a TDE. Continued photometric monitoring can determine if the light curve of iPTF 16bco eventually evolves into a power-law decline as expected for a TDE.
3.4. Accretion Disk Instabilities
We now investigate the scenario that iPTF 16bco was the result of a change of state in a pre-existing quasar accretion disk. Interestingly however, iPTF 16bco puts stringent limits on the timescale over which such accretion rate changes must occur. In the rest-frame, iPTF 16bco demonstrates a dramatic change in continuum flux over a timescale of yr or in yr based on the archival X-ray upper limits. The timescale by which an accretion disk can change its accretion rate should be determined by the viscous radial inflow timescale, . Furthermore, this timescale is expected to be longer for a quasar “turning on” instead of “turning off”, since it scales as (LaMassa et al., 2015). The corresponding to the Eddington ratio and black hole mass estimated for iPTF 16bco in its dim state, and assuming a radiation-pressure dominated inner region of a Shakura-Sunyaev disk, is,
a much longer timescale than the observed rapid change in continuum flux in iPTF 16bco.
One possibility could be an accretion disk eruption as the result of thermal-viscous instabilities in a partial ionization zone, analogous to the outbursts observed in cataclysmic variables and X-ray novae (Siemiginowska et al., 1996). However, while such instabilities can produce amplitudes of a factor of , the expected durations scale with the central mass, and so while cataclysmic variables (CVs) and X-ray novae show large-amplitude outbursts on the timescale of weeks to months, for an accretion disk around a black hole, this corresponds to timescales of yr. However, state changes on minute timescales have been observed in some X-ray binaries (Fender, 2001; Fender & Belloni, 2004), which would imply similar changes in a SMBH on the timescale of only yr.
In the accretion-disk instability model, the more narrow the unstable zone, the more rapid the timescale of variability. The size of the unstable zone depends on the accretion rate: the lower the accretion rate, the closer in the unstable region is to the inner edge of the disk. However, the smaller the unstable zone, the smaller the expected amplitude of variability. For models that demonstrate a factor of variability ( yr-1) in Siemiginowska et al. (1996), they have a “turn-on” timescale of yr. This is still 3 orders of magnitude longer than we require for the “turn-on” timescale of iPTF 16bco.
Interestingly, the thermal timescale itself, , is much shorter, adopting Equation 8 from (Siemiginowska et al., 1996):
A disk with local thermal fluctuations, potentially driven by the magneto-rotational instability, could be consistent with the rapid timescale of the continuum variability in iPTF 16bco (Dexter & Agol, 2011). While an inhomogeneous disk has been demonstrated to fit composite difference spectra (Ruan et al., 2014) and color variability of quasars (Schmidt et al., 2012), Hung et al. (2016) find a simple disk model adequate to fit difference-flux UV/optical spectral energy distributions of individual quasars. Moreover, Kokubo (2015) argue that the tight inter-band correlations observed in SDSS quasar light curves are inconsistent with the inhomogeneous disk model. However, whether or not these thermal fluctuations can be coherent enough to produce a large-amplitude outburst, is still to be determined.
An instability that arises in a radiation-pressure dominated disk (Lightman & Eardley, 1974) has been used to model recurrent flares in accreting Galactic X-ray binaries (Belloni et al., 1997) and has recently been applied by Saxton et al. (2015) and Grupe et al. (2015) to explain the large-amplitude soft X-ray flares in Seyfert galaxies NGC 3599 and IC 3599, respectively. In this scenario, when the internal radiation pressure of the disk become greater than the gas pressure, a heating wave propagates through the disk. This results in a enhanced local viscosity, scale height, and accretion rate, which rapidly drains the disk. The instability recurs when the inner disk fills back in. The rise-time and recurrence timescale can be as short as a year to hundreds of years for a black hole, respectively.
Another mechanism for driving large amplitude variability in a quasar accretion disk could be related to the presence of a binary SMBH. Hydrodynamical simulations show that in a circumbinary disk, streams penetrate the disk cavity to feed the primary and secondary black hole at a periodic rate, and that at close to equal mass ratios, the perturbed circumbinary disk has an enhanced accretion rate that can be quite bursty on a timescale of times the orbital period of the SMBH binary (Farris et al., 2014). Such a scenario could in principle be testable, due to the intrinsically periodic nature of the outbursts. Furthermore, one could look for periodic changes in the broad-line profiles, if they originate in the circumbinary disk. However, the circumbinary disk outbursts in Farris et al. (2014) have a sawtooth pattern, with a rise time much shorter than the decay time. Already the light curve of iPTF 16bco is not in good agreement with this model, given its rebrightenning by mag during its high state (see Figure 2).
The continued intrinsic variability during the high state of iPTF 16bco, as also seen in the study of changing look quasars by MacLeod et al. (2016), may also provide insight as to the nature of what caused the “changing look” of the quasar. The optical variability amplitudes of these sources in their type 1 quasar states of mag are on the high amplitude tail of what is typically observed on these timescales for quasars of a similar luminosity range (MacLeod et al., 2012). Although we note that in both of our studies the changing look quasars were selected by their optical variability. However, intrinsic variability is also observed in the changing-look quasar presented in LaMassa et al. (2015), which was selected based on its spectral changes. In fact, the rapid rise and power-law decline of its light curve was interpreted as a signature of a TDE (Merloni et al., 2015). However, the light curves of iPTF 16bco and the other changing-look quasars with archival photometry, have large fluctuations that are inconsistent with the smooth, power-law decline observed in the optical light curves of known tidal disruption events (e.g., Gezari et al., 2008; van Velzen et al., 2011; Gezari et al., 2012; Arcavi et al., 2014; Holoien et al., 2014, 2016a, 2016b). The erratic intra-burst behavior in the two-state (hot and cold) instability models of Siemiginowska et al. (1996) could be promising. A potential testable prediction, is that in these models, the accretion disks spend the majority of their time in the low-state. The variability during the enhanced accretion state in iPTF 16bco could also be a signature of clumpy accretion in an advection-dominated accretion flow (ADAF), for which cold clumps form in the accretion flow due to instabilities in the radiation-dominated regions of the disk (Wang et al., 2012)
3.5. Disk-Jet Connection
The dramatic change in accretion rate from to inferred for iPTF 16bco could be accompanied by a structural change in the accretion flow if the quasar accretion disk is transitioning from a radiatively inefficient to radiatively efficient mode. Note that such changes in X-ray binaries are often accompanied by changes in jet activity. The implied high-state radio-to-optical flux density ratio for iPTF 16bco of and radio luminosity W Hz-1, is typical of radio-quiet AGN (e.g., Padovani et al., 2011). While these values are consistent with the LINER classification from the optical spectrum, it is surprising that if the accretion event in iPTF 16bco were triggered by a disk instability, that there is no evidence for a jet or outflow during its high-state in the radio. This is in contrast with X-ray binaries and CVs, which generally show flaring at radio, optical and X-ray wavelengths alongside strong Balmer emission lines. Similarly, the fundamental plane of black hole activity, e.g. (Plotkin et al., 2012; Saikia et al., 2015) predicts significantly greater than W Hz-1 when erg s-1.
3.6. Comparison to Other Changing-Look Quasars
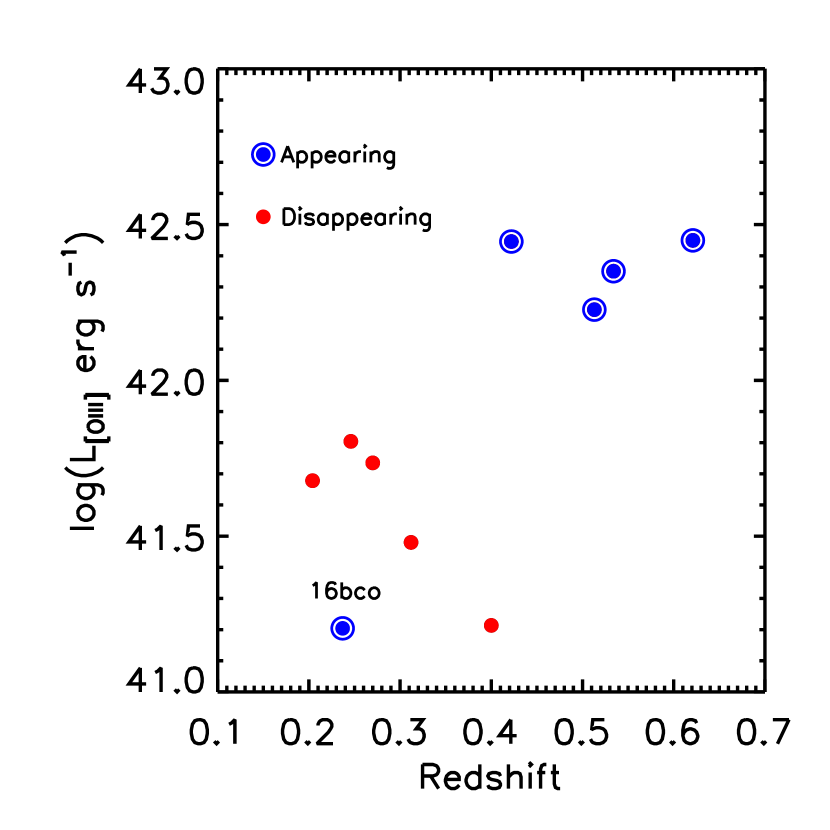
iPTF 16bco is one of only a dozen other changing-look quasars (here we define as mag, ([O III]) ergs s-1), roughly half of which have been caught in the act of “turning on” by demonstrating the sudden appearance of broad-lines. Figure 6 shows the redshift and [O III] luminosity of all the changing-look quasars in the literature that pass our [O III] luminosity cut (thus we exclude SDSS J0126-0839 and SDSS J2336+0017 from Ruan et al. (2016)), color-coded by whether they show appearing broad lines, or disappearing broad lines. We also do not include three changing-look quasars from the MacLeod et al. (2016) sample that do not have good coverage of the broad H line in its high state (appearing SDSS J214613 at , disappearing SDSS J022562 at , and both appearing and disappearing SDSS J022556 at ). Given that all the other appearing changing-look quasars are from MacLeod et al. (2016), there appears to be a bias towards finding appearing broad-lines in higher redshift galaxies. This is likely due to the fact that the BOSS spectra extend to longer wavelengths than the SDSS spectra, and thus finding an appearing broad H line in the BOSS spectrum is possible at higher-redshift than finding a disappearing broad H line in the SDSS spectrum.
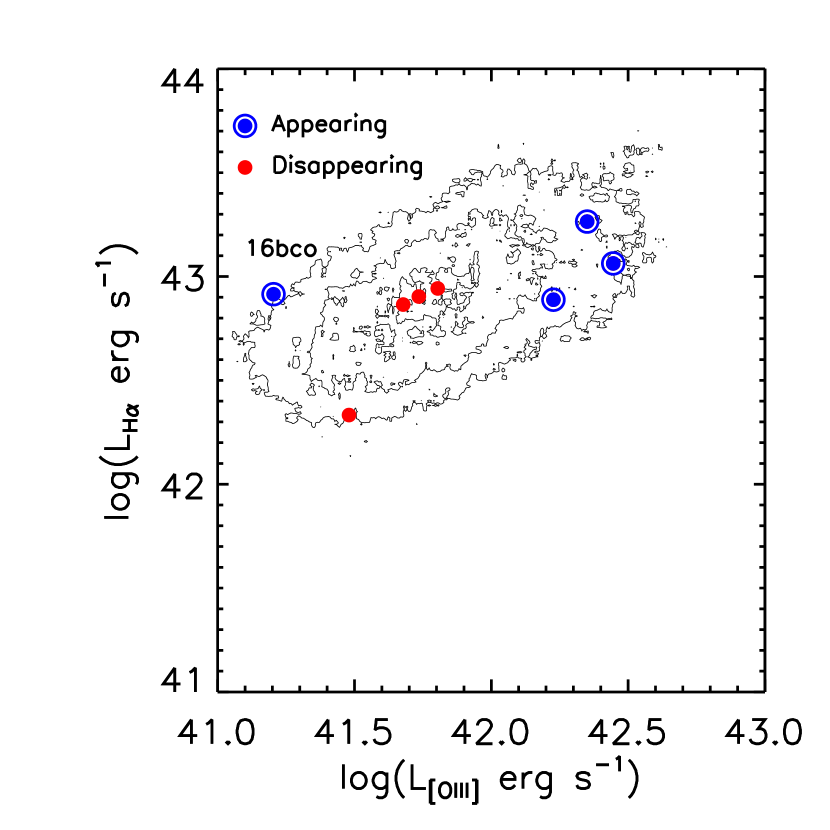
Figure 6 also shows the [O III] vs. broad H luminosity in all the changing-look quasars in their type 1 state, in comparison to the full SDSS quasar sample. We determine the [O III] luminosity from the line flux measured in the SDSS DR7 SpecLine table and the DR12 interactive spectrum line measurement table. We use the broad H fluxes from the Shen et al. (2011) catalog for broad-line quasars, or from the literature when available. All luminosities are calculated for our adopted cosmology. Note that iPTF 16bco is on the edge of the normal quasar distribution, while the other changing-look quasars reported in the literature appear to lie squarely in the distribution of normal quasars in this parameter space.
The enhanced broad H luminosity observed in iPTF 16bco relative to [O III] in comparison to normal quasars, as well as the previously discovered changing-look quasars, is likely a signature of its rapid transition to a type 1 state. As discussed in §3.2.2, given the extended size of the narrow-line region, the [O III] line will lag in its response to a continuum flare in comparison to the broad emission lines due to light-travel time effects. Interestingly, in the MacLeod et al. (2016) sample, the rise-time in the continuum flux of the quasars was serendipitously measured by photometric monitoring to be days. Given the significantly weaker [O III] line emission relative to broad H in iPTF 16bco compared to these objects, this would imply an even shorter “turn-on” timescale, in agreement with the inferred “turn-on” timescale for the continuum in iPTF 16bco of yr.
One interesting aspect of changing look quasars is the lack of strong changes in Mg II line emission, despite the dramatic changes in the Balmer lines. This was explained by MacLeod et al. (2016) as due to the relatively weak responsivity of the Mg II line to continuum flux changes, as has been measured in rest-frame UV reverberation mapping studies (Cackett et al., 2015). Given that Mg II is a low-ionization line, its weak responsivity can be explained as a consequence of the stratification of the broad-line region (Korista & Goad, 2004). Unfortunately, we do not have short-enough wavelength coverage in the archival or follow-up spectra to determine the presence and/or response of the Mg II line during the change of state in iPTF 16bco.
4. Summary
We present the rapid “turn on” of a luminous broad-line quasar at discovered from its nuclear optical variability in the iPTF survey (iPTF 16bco), and identified as a newly emerged quasar from comparison of follow-up spectroscopy with an archival SDSS spectrum from over a decade earlier which shows LINER narrow-line emission potentially powered by stars. Pre-event optical, UV, and X-ray imaging indicate that the quasar continuum increased by a factor of on a timescale of yr in the quasar rest-frame. The broadband properties of iPTF 16bco in its high state are best explained by an intrinsic change of state to a radio-quiet type 1 quasar, than variable obscuration or a TDE. However, continued monitoring will help further constrain the nature of its rapid brightening. The dramatic appearance of broad Balmer lines during the high-state of iPTF 16bco, with no significant change in the [O III]5007 line, is explained as a delayed response of gas in the narrow-line region to the flare in photoionizing continuum due to light-travel time effects. The enhanced broad H to narrow [O III]5007 ratio in iPTF 16bco relative to normal quasars and previously reported changing-look quasars, is further evidence that iPTF 16bco may have demonstrated the most rapid change of state yet observed in a quasar. iPTF 16bco pushes the limits of accretion disk theory, and may represent a new class of state changes in quasars that will be discovered more routinely in regular monitoring of millions of quasars with the next generation of optical time domain surveys (Zwicky Transient Facility and the Large Synoptic Survey Telescope) together with follow-up spectroscopy triggered by flaring events.
References
- Agüeros et al. (2005) Agüeros, M. A., et al. 2005, AJ, 130, 1022
- Antonucci (1993) Antonucci, R. 1993, ARA&A, 31, 473
- Arcavi et al. (2014) Arcavi, I., et al. 2014, ApJ, 793, 38
- Baldwin et al. (1981) Baldwin, J. A., Phillips, M. M., & Terlevich, R. 1981, PASP, 93, 5
- Becker et al. (1995) Becker, R. H., White, R. L., & Helfand, D. J. 1995, ApJ, 450, 559
- Belloni et al. (1997) Belloni, T., Méndez, M., King, A. R., van der Klis, M., & van Paradijs, J. 1997, ApJ, 479, L145
- Bentz et al. (2013) Bentz, M. C., et al. 2013, ApJ, 767, 149
- Bianchi et al. (2005) Bianchi, L., et al. 2005, ApJ, 619, L27
- Bolton et al. (2012) Bolton, A. S., et al. 2012, AJ, 144, 144
- Cackett et al. (2015) Cackett, E. M., Gültekin, K., Bentz, M. C., Fausnaugh, M. M., Peterson, B. M., Troyer, J., & Vestergaard, M. 2015, ApJ, 810, 86
- Cao et al. (2016) Cao, Y., Nugent, P. E., & Kasliwal, M. M. 2016, PASP, 128, 114502
- Cappellari (2016) Cappellari, M. 2016, ArXiv e-prints, 1607.08538
- Cappellari & Emsellem (2004) Cappellari, M., & Emsellem, E. 2004, PASP, 116, 138
- Cardelli et al. (1989) Cardelli, J. A., Clayton, G. C., & Mathis, J. S. 1989, ApJ, 345, 245
- Cid Fernandes et al. (2011) Cid Fernandes, R., Stasińska, G., Mateus, A., & Vale Asari, N. 2011, MNRAS, 413, 1687
- Cid Fernandes et al. (2010) Cid Fernandes, R., Stasińska, G., Schlickmann, M. S., Mateus, A., Vale Asari, N., Schoenell, W., & Sodré, L. 2010, MNRAS, 403, 1036
- Cooper et al. (2012) Cooper, M. C., et al. 2012, MNRAS, 419, 3018
- Cutri et al. (2011) Cutri, R. M., et al. 2011, Explanatory Supplement to the WISE Preliminary Data Release Products, Tech. rep.
- Denney et al. (2014) Denney, K. D., et al. 2014, ApJ, 796, 134
- Dexter & Agol (2011) Dexter, J., & Agol, E. 2011, ApJ, 727, L24
- Dickey & Lockman (1990) Dickey, J. M., & Lockman, F. J. 1990, ARA&A, 28, 215
- Eracleous et al. (1995) Eracleous, M., Livio, M., & Binette, L. 1995, ApJ, 445, L1
- Evans & Kochanek (1989) Evans, C. R., & Kochanek, C. S. 1989, ApJ, 346, L13
- Faber et al. (2003) Faber, S. M., et al. 2003, in Proc. SPIE, Vol. 4841, Instrument Design and Performance for Optical/Infrared Ground-based Telescopes, ed. M. Iye & A. F. M. Moorwood, 1657–1669
- Farris et al. (2014) Farris, B. D., Duffell, P., MacFadyen, A. I., & Haiman, Z. 2014, ApJ, 783, 134
- Fender & Belloni (2004) Fender, R., & Belloni, T. 2004, ARA&A, 42, 317
- Fender (2001) Fender, R. P. 2001, MNRAS, 322, 31
- Fremling et al. (2016) Fremling, C., et al. 2016, A&A, 593, A68
- Gezari et al. (2008) Gezari, S., et al. 2008, ApJ, 676, 944
- Gezari et al. (2012) ——. 2012, Nature, 485, 217
- Greene & Ho (2005) Greene, J. E., & Ho, L. C. 2005, ApJ, 630, 122
- Grupe et al. (2015) Grupe, D., Komossa, S., & Saxton, R. 2015, ApJ, 803, L28
- Guo et al. (2016) Guo, H., et al. 2016, ApJ, 826, 186
- Heckman et al. (2005) Heckman, T. M., Ptak, A., Hornschemeier, A., & Kauffmann, G. 2005, ApJ, 634, 161
- Hickox et al. (2014) Hickox, R. C., Mullaney, J. R., Alexander, D. M., Chen, C.-T. J., Civano, F. M., Goulding, A. D., & Hainline, K. N. 2014, ApJ, 782, 9
- Holoien et al. (2016a) Holoien, T. W.-S., et al. 2016a, MNRAS, 463, 3813
- Holoien et al. (2016b) ——. 2016b, MNRAS, 455, 2918
- Holoien et al. (2014) ——. 2014, MNRAS, 445, 3263
- Hung et al. (2016) Hung, T., et al. 2016, ArXiv e-prints, 1609.06307
- Husemann et al. (2016) Husemann, B., et al. 2016, A&A, 593, L9
- Kauffmann et al. (2003) Kauffmann, G., et al. 2003, MNRAS, 346, 1055
- Kelly et al. (2009) Kelly, B. C., Bechtold, J., & Siemiginowska, A. 2009, ApJ, 698, 895
- Kewley et al. (2001) Kewley, L. J., Dopita, M. A., Sutherland, R. S., Heisler, C. A., & Trevena, J. 2001, ApJ, 556, 121
- Kewley et al. (2006) Kewley, L. J., Groves, B., Kauffmann, G., & Heckman, T. 2006, MNRAS, 372, 961
- Kokubo (2015) Kokubo, M. 2015, MNRAS, 449, 94
- Komossa (2002) Komossa, S. 2002, in Lighthouses of the Universe: The Most Luminous Celestial Objects and Their Use for Cosmology, ed. M. Gilfanov, R. Sunyeav, & E. Churazov, 436–+
- Korista & Goad (2004) Korista, K. T., & Goad, M. R. 2004, ApJ, 606, 749
- LaMassa et al. (2015) LaMassa, S. M., et al. 2015, ApJ, 800, 144
- Lawrence et al. (2016) Lawrence, A., et al. 2016, ArXiv e-prints, 1605.07842
- Lightman & Eardley (1974) Lightman, A. P., & Eardley, D. M. 1974, ApJ, 187, L1
- Lodato & Rossi (2011) Lodato, G., & Rossi, E. M. 2011, MNRAS, 410, 359
- MacLeod et al. (2012) MacLeod, C. L., et al. 2012, ApJ, 753, 106
- MacLeod et al. (2016) ——. 2016, MNRAS, 457, 389
- Marchese et al. (2012) Marchese, E., Braito, V., Della Ceca, R., Caccianiga, A., & Severgnini, P. 2012, MNRAS, 421, 1803
- Masci et al. (2016) Masci, F., et al. 2016, ArXiv e-prints, 1608.01733
- McConnell & Ma (2013) McConnell, N. J., & Ma, C.-P. 2013, ApJ, 764, 184
- McElroy et al. (2016) McElroy, R. E., et al. 2016, A&A, 593, L8
- Merloni et al. (2015) Merloni, A., et al. 2015, MNRAS, 452, 69
- Miller et al. (2015) Miller, J. M., et al. 2015, Nature, 526, 542
- Morganson et al. (2015) Morganson, E., et al. 2015, ApJ, 806, 244
- Morrissey et al. (2007) Morrissey, P., et al. 2007, ApJS, 173, 682
- Newman et al. (2013) Newman, J. A., et al. 2013, ApJS, 208, 5
- Novak et al. (2011) Novak, G. S., Ostriker, J. P., & Ciotti, L. 2011, ApJ, 737, 26
- Osterbrock (1981) Osterbrock, D. E. 1981, ApJ, 249, 462
- Padovani et al. (2011) Padovani, P., Miller, N., Kellermann, K. I., Mainieri, V., Rosati, P., & Tozzi, P. 2011, ApJ, 740, 20
- Pereyra et al. (2006) Pereyra, N. A., Vanden Berk, D. E., Turnshek, D. A., Hillier, D. J., Wilhite, B. C., Kron, R. G., Schneider, D. P., & Brinkmann, J. 2006, ApJ, 642, 87
- Phinney (1989) Phinney, E. S. 1989, in IAU Symposium, Vol. 136, The Center of the Galaxy, ed. M. Morris, 543–+
- Plotkin et al. (2012) Plotkin, R. M., Markoff, S., Kelly, B. C., Körding, E., & Anderson, S. F. 2012, MNRAS, 419, 267
- Ponti et al. (2010) Ponti, G., Terrier, R., Goldwurm, A., Belanger, G., & Trap, G. 2010, ApJ, 714, 732
- Rees (1988) Rees, M. J. 1988, Nature, 333, 523
- Richards et al. (2002) Richards, G. T., et al. 2002, AJ, 123, 2945
- Risaliti et al. (2009) Risaliti, G., et al. 2009, ApJ, 696, 160
- Ruan et al. (2016) Ruan, J. J., et al. 2016, ApJ, 826, 188
- Ruan et al. (2014) Ruan, J. J., Anderson, S. F., Dexter, J., & Agol, E. 2014, ApJ, 783, 105
- Runnoe et al. (2012) Runnoe, J. C., Brotherton, M. S., & Shang, Z. 2012, MNRAS, 422, 478
- Runnoe et al. (2016) Runnoe, J. C., et al. 2016, MNRAS, 455, 1691
- Saikia et al. (2015) Saikia, P., Körding, E., & Falcke, H. 2015, MNRAS, 450, 2317
- Saxton et al. (2015) Saxton, R. D., Motta, S. E., Komossa, S., & Read, A. M. 2015, MNRAS, 454, 2798
- Schawinski et al. (2010) Schawinski, K., et al. 2010, ApJ, 724, L30
- Schlegel et al. (1998) Schlegel, D. J., Finkbeiner, D. P., & Davis, M. 1998, ApJ, 500, 525
- Schmidt et al. (2012) Schmidt, K. B., Rix, H.-W., Shields, J. C., Knecht, M., Hogg, D. W., Maoz, D., & Bovy, J. 2012, ApJ, 744, 147
- Schneider et al. (2007) Schneider, D. P., et al. 2007, AJ, 134, 102
- Shappee et al. (2014) Shappee, B. J., et al. 2014, ApJ, 788, 48
- Shen et al. (2011) Shen, Y., et al. 2011, ApJS, 194, 45
- Siemiginowska et al. (1996) Siemiginowska, A., Czerny, B., & Kostyunin, V. 1996, ApJ, 458, 491
- Storchi-Bergmann et al. (1993) Storchi-Bergmann, T., Baldwin, J. A., & Wilson, A. S. 1993, ApJ, 410, L11
- Sulentic et al. (2000) Sulentic, J. W., Zwitter, T., Marziani, P., & Dultzin-Hacyan, D. 2000, ApJ, 536, L5
- Ueda et al. (2015) Ueda, Y., et al. 2015, ApJ, 815, 1
- van Velzen et al. (2011) van Velzen, S., et al. 2011, ApJ, 741, 73
- Vanden Berk et al. (2001) Vanden Berk, D. E., et al. 2001, AJ, 122, 549
- Vazdekis et al. (2010) Vazdekis, A., Sánchez-Blázquez, P., Falcón-Barroso, J., Cenarro, A. J., Beasley, M. A., Cardiel, N., Gorgas, J., & Peletier, R. F. 2010, MNRAS, 404, 1639
- Veilleux & Osterbrock (1987) Veilleux, S., & Osterbrock, D. E. 1987, ApJS, 63, 295
- Vestergaard & Peterson (2006) Vestergaard, M., & Peterson, B. M. 2006, ApJ, 641, 689
- Voges et al. (1999) Voges, W., et al. 1999, A&A, 349, 389
- Wang et al. (2012) Wang, J.-M., Cheng, C., & Li, Y.-R. 2012, ApJ, 748, 147
- Wilhite et al. (2005) Wilhite, B. C., Vanden Berk, D. E., Kron, R. G., Schneider, D. P., Pereyra, N., Brunner, R. J., Richards, G. T., & Brinkmann, J. V. 2005, ApJ, 633, 638
- Wyder et al. (2007) Wyder, T. K., et al. 2007, ApJS, 173, 293
- Yan et al. (2013) Yan, L., et al. 2013, AJ, 145, 55
| Telescope+Camera | Filter | MJD | Magnitude | Error |
|---|---|---|---|---|
| P48+CFH12k | 57540.336 | 19.66 | 0.07 | |
| P48+CFH12k | 57540.371 | 19.77 | 0.07 | |
| P48+CFH12k | 57547.328 | 19.58 | 0.11 | |
| P48+CFH12k | 57547.359 | 19.55 | 0.07 | |
| P48+CFH12k | 57551.375 | 19.67 | 0.06 | |
| P48+CFH12k | 57555.297 | 19.83 | 0.12 | |
| P48+CFH12k | 57555.324 | 19.69 | 0.12 | |
| P48+CFH12k | 57540.305 | 19.63 | 0.10 | |
| P48+CFH12k | 57547.293 | 19.72 | 0.13 | |
| P48+CFH12k | 57555.270 | 19.63 | 0.12 | |
| P60+SEDM | 57546.410 | 19.68 | 0.03 | |
| P60+SEDM | 57547.211 | 19.76 | 0.03 | |
| P60+SEDM | 57553.465 | 19.92 | 0.05 | |
| P60+SEDM | 57558.398 | 19.86 | 0.08 | |
| P60+SEDM | 57564.219 | 19.88 | 0.32 | |
| P60+SEDM | 57579.262 | 19.43 | 0.02 | |
| P60+SEDM | 57582.199 | 19.33 | 0.02 | |
| P60+SEDM | 57584.281 | 19.26 | 0.03 | |
| P60+SEDM | 57586.215 | 19.24 | 0.03 | |
| P60+SEDM | 57588.258 | 19.25 | 0.04 | |
| P60+SEDM | 57590.227 | 19.23 | 0.07 | |
| P60+SEDM | 57592.266 | 19.20 | 0.02 | |
| P60+SEDM | 57593.266 | 19.14 | 0.02 | |
| P60+SEDM | 57594.258 | 19.09 | 0.02 | |
| P60+SEDM | 57595.258 | 19.13 | 0.02 | |
| P60+SEDM | 57596.281 | 19.12 | 0.02 | |
| P60+SEDM | 57599.246 | 19.10 | 0.02 | |
| P60+SEDM | 57601.211 | 19.06 | 0.02 | |
| P60+SEDM | 57607.199 | 19.10 | 0.01 | |
| P60+SEDM | 57611.289 | 19.08 | 0.02 | |
| P60+SEDM | 57613.254 | 19.14 | 0.03 | |
| P60+SEDM | 57615.242 | 19.04 | 0.04 | |
| P60+SEDM | 57618.230 | 19.09 | 0.04 | |
| P60+SEDM | 57620.223 | 19.03 | 0.04 | |
| P60+SEDM | 57622.266 | 19.01 | 0.04 | |
| P60+SEDM | 57624.199 | 19.08 | 0.02 | |
| P60+SEDM | 57626.188 | 19.11 | 0.02 | |
| P60+SEDM | 57546.406 | 19.59 | 0.03 | |
| P60+SEDM | 57547.207 | 19.71 | 0.04 | |
| P60+SEDM | 57551.395 | 19.88 | 0.03 | |
| P60+SEDM | 57553.461 | 19.74 | 0.05 | |
| P60+SEDM | 57558.391 | 19.64 | 0.07 | |
| P60+SEDM | 57564.215 | 19.72 | 0.02 | |
| P60+SEDM | 57579.258 | 19.59 | 0.04 | |
| P60+SEDM | 57582.191 | 19.43 | 0.02 | |
| P60+SEDM | 57584.277 | 19.32 | 0.04 | |
| P60+SEDM | 57586.211 | 19.28 | 0.03 | |
| P60+SEDM | 57588.254 | 19.27 | 0.03 | |
| P60+SEDM | 57592.262 | 19.26 | 0.02 | |
| P60+SEDM | 57593.258 | 19.26 | 0.02 | |
| P60+SEDM | 57594.254 | 19.25 | 0.02 | |
| P60+SEDM | 57595.254 | 19.21 | 0.02 | |
| P60+SEDM | 57596.277 | 19.19 | 0.02 | |
| P60+SEDM | 57599.242 | 19.17 | 0.02 | |
| P60+SEDM | 57601.207 | 19.16 | 0.02 | |
| P60+SEDM | 57607.191 | 19.17 | 0.02 | |
| P60+SEDM | 57609.301 | 19.20 | 0.02 | |
| P60+SEDM | 57611.285 | 19.19 | 0.02 | |
| P60+SEDM | 57613.250 | 19.18 | 0.03 | |
| P60+SEDM | 57615.238 | 19.19 | 0.05 | |
| P60+SEDM | 57618.223 | 19.08 | 0.06 | |
| P60+SEDM | 57620.219 | 19.12 | 0.03 | |
| P60+SEDM | 57622.262 | 19.17 | 0.05 | |
| P60+SEDM | 57624.191 | 19.15 | 0.02 | |
| P60+SEDM | 57626.184 | 19.17 | 0.02 | |
| P60+SEDM | 57546.406 | 19.60 | 0.05 | |
| P60+SEDM | 57547.211 | 19.73 | 0.05 | |
| P60+SEDM | 57551.398 | 19.82 | 0.09 | |
| P60+SEDM | 57553.465 | 19.84 | 0.10 | |
| P60+SEDM | 57558.395 | 19.69 | 0.06 | |
| P60+SEDM | 57564.219 | 19.75 | 0.07 | |
| P60+SEDM | 57579.258 | 19.53 | 0.04 | |
| P60+SEDM | 57582.195 | 19.39 | 0.03 | |
| P60+SEDM | 57584.281 | 19.35 | 0.04 | |
| P60+SEDM | 57586.215 | 19.31 | 0.03 | |
| P60+SEDM | 57588.254 | 19.30 | 0.04 | |
| P60+SEDM | 57592.262 | 19.19 | 0.03 | |
| P60+SEDM | 57593.262 | 19.19 | 0.03 | |
| P60+SEDM | 57594.254 | 19.20 | 0.03 | |
| P60+SEDM | 57595.254 | 19.19 | 0.03 | |
| P60+SEDM | 57596.277 | 19.17 | 0.03 | |
| P60+SEDM | 57599.242 | 19.19 | 0.02 | |
| P60+SEDM | 57601.211 | 19.18 | 0.03 | |
| P60+SEDM | 57607.195 | 19.19 | 0.02 | |
| P60+SEDM | 57611.285 | 19.22 | 0.04 | |
| P60+SEDM | 57613.254 | 19.18 | 0.03 | |
| P60+SEDM | 57615.238 | 19.20 | 0.06 | |
| P60+SEDM | 57618.227 | 19.12 | 0.04 | |
| P60+SEDM | 57620.223 | 19.13 | 0.04 | |
| P60+SEDM | 57622.266 | 19.11 | 0.04 | |
| P60+SEDM | 57624.195 | 19.17 | 0.02 | |
| P60+SEDM | 57626.188 | 19.16 | 0.02 | |
| P60+GRBCam | 57576.348 | 19.50 | 0.03 | |
| P60+GRBCam | 57576.348 | 19.58 | 0.03 |