Evolution of Cosmic Molecular Gas Mass Density from to
Abstract
We try to constrain the cosmic molecular gas mass density at and that in the local universe by combining stellar mass functions of star-forming galaxies and their average molecular gas mass fractions against the stellar mass. The average molecular gas mass fractions are taken from recent CO observations of star-forming galaxies at the redshifts. The cosmic molecular gas mass density is obtained to be at and at by integrating down to . Although the values have various uncertainties, the cosmic molecular gas mass density at is about ten times larger than that in the local universe. The cosmic star formation rate density at is also about ten times larger than that in the local universe. Our result suggests that the large cosmic molecular gas mass density at accounts for the large cosmic star formation rate density at .
=1 \fullcollaborationNameThe Friends of AASTeX Collaboration
1 Introduction
Cosmic star formation rate density (CSFRD) at is considered to be about ten times larger than that in the present-day universe (e.g., Lilly et al. 1996; Madau & Dickinson 2014); i.e., galaxies were forming stars about ten times more active on average at the epoch. What is the cause for this large CSFRD? Since stars form in molecular clouds in galaxies, a simple explanation for this is due to a large cosmic molecular gas mass density (CMGD) at the redshift. Another possible cause is a large star formation efficiency at the epoch. Thus, revealing the CMGD is important to understand the evolution of CSFRD. Based on semi-analytic model, Lagos et al. (2011) and Popping et al. (2014) calculated the cosmological evolution of the CMGD. They showed the CMGD is 5 to 8 times larger at than at . However, the molecular gas mass depends on prescriptions (such as pressure based, metallicity based) to evaluate the molecular gas mass fraction among various phases of the gas. Hence, observational constraints are desirable.
In order to assess the CMGDs at the redshifts, a most straightforward way would be to derive the molecular gas mass function in the local universe and at , and to integrate them. The molecular gas mass in a galaxy can be derived from its CO(1-0) luminosity. For the local universe, the measurements of the CMGD using CO(1-0) luminosity were made (e.g., Keres et al. 2003; Obreschkow & Rawlings 2009). Using an FIR- and a -band selected sample of galaxies included in the Five College Radio Astronomy Observatory (FCRAO) Extragalactic CO survey, Keres et al. (2003) derived a CO luminosity function and a CMGD by adopting a constant CO-to- conversion factor. Obreschkow & Rawlings (2009) applied variable CO-to- conversion factor (depending on CO luminosity and -band luminosity) to the CO luminosity function by Keres et al. (2003).
For normal star-forming galaxies at , CO observations of them have been very much time consuming and have been hard to be achieved. Such a try was made by Walter et al. (2014) as a blank sky survey in the Hubble Deep Field North using IRAM Plateau de Bure interferometer (PdBI); they obtained CO luminosity functions at = 0.34(CO(1-0)), 1.52(CO(2-1)) and 2.75(CO(3-2)) and derived the CMGD at each redshift. Although they depicted the cosmological evolution of the CMGD, the uncertainty is very much large due to a small number of galaxies from which CO emission lines are detected. More recently, Decarli et al. (2016a) conducted a spectroscopic survey with Atacama Large Millimeter/submillimeter Array (ALMA) in the Hubble Ultra Deep Field and the situation is improved.
As an alternative approach to the CMGD, Berta et al. (2013) derived the molecular gas mass in main sequence galaxies at by using a correlation of molecular gas mass and star formation rate. But this approach does not fit to our motivation in this study.
The molecular gas mass in a star-forming galaxy can also be derived from the dust mass in the galaxy, by assuming a gas-to-dust ratio obtained in the local universe can be applied to high redshift galaxies. However, a possibility that the gas-to-dust ratio at is several times larger than those in the local universe at the same gas metallicity is pointed out by Seko et al. (2016a, b), though Berta et al. (2016) claim such evolution is not seen. In this study, considering the possibility of the evolution of gas-to-dust ratio, we derive the molecular gas mass without using the dust mass.
In this study, we take another approach to estimate a CMGD; we combine the average gas mass fraction against stellar mass and the stellar mass function of star-forming galaxies. Although the molecular gas mass fractions in CO detected star-forming galaxies have been individually derived, the fractions tend to bias to more active star-forming galaxies with a high specific star formation rate and gas mass fraction. Thus, the unbiased average gas mass fractions against stellar mass of star-forming galaxies are needed. Thanks to the recent large CO surveys, the average gas mass fraction against stellar mass of star-forming galaxies at and has been unveiling. Saintonge et al. (2011a) and Boselli et al. (2014) revealed the molecular gas masses of a few hundred of local star-forming galaxies. Tacconi et al. (2010, 2013) studied the molecular gas masses in main sequence star-forming galaxies at with the IRAM PdBI and showed the average molecular gas mass fraction increases with decreasing stellar mass. Seko et al. (2016a) have studied the average molecular gas mass in main sequence galaxies at with the ALMA and extended the trend to the lower stellar mass galaxies.
In this paper, although the average molecular gas mass fraction against stellar mass may still have an uncertainty, nevertheless we try to constrain the CMGD at as well as that in the local universe adopting this new approach mentioned above. In section 2, we describe the molecular gas mass fraction and its dependence on the stellar mass, and stellar mass function of star-forming galaxies. Then in section 3, we present the resulting CMGDs obtained by combining these data, and describe uncertainties on them. In section 4, we compare the results with the recent studies and model predictions, and discuss implications. In the same way as Madau & Dickinson (2014), initial mass function (IMF) we use here is Salpeter IMF with an upper and lower mass of and , respectively. Stellar mass, star formation rate (SFR) and molecular gas mass fraction [] appear below are corrected to those with Salpeter IMF; (or SFR (or SFRChabrier). We adopt cosmology parameters of , , and .
2 Average Molecular gas mass fraction and stellar mass function
2.1 Average molecular gas mass fraction against stellar mass
Tacconi et al. (2010, 2013) used a sample of main sequence star-forming galaxies with and SFR at (50 galaxies) observed with IRAM PdBI. The molecular gas masses were derived by adopting the CO(3-2) (CO(2-1)) to CO(1-0) luminosity ratio of 0.5 (0.6) and the CO-to- conversion factor of . They also derived molecular gas mass fraction against the stellar mass for which CO emission is significantly detected. Since the CO detected sample biases to higher specific SFR, they derived the average molecular gas mass fraction in a stellar mass bin by correcting for the specific SFR of observed galaxies. Resulting gas mass fraction at ranges from at to at .
Seko et al. (2016a) used a sample of 18 randomly selected main sequence star-forming galaxies at . Stellar mass and SFR covered are and SFR , respectively, expanding to the lower stellar mass. Further, gas metallicity of the target galaxies was obtained with N2 method (Yabe et al., 2012, 2014). CO(5-4) observations were made with ALMA. The molecular gas mass was derived by adopting the CO(5-4) to CO(1-0) luminosity ratio of 0.23 based on observations of main sequence star-forming galaxies (sBzK) of by Daddi et al. (2015) and the metallicity dependent CO-to- conversion factor (equation (7) by Genzel et al. 2012). To obtain the average value of the fraction at a stellar mass bin, Seko et al. (2016a) made stacking analysis including non-CO detected sample galaxies. The fraction amounts to at the lowest stellar mass bin of .
For the local star-forming galaxies, several surveys were conducted. CO Legacy Database for Galex Arecibo SDSS Survey (COLD GASS: Saintonge et al. 2011a) measured the CO(1-0) luminosity for a sample of 350 nearby galaxies () using the IRAM 30-m telescope. CO(1-0) line was detected towards 222 galaxies, and they derived the molecular gas mass and its fraction against the stellar mass by adopting the CO-to- conversion factor of . The CO detected galaxies are likely to consist mostly of late-type galaxies, by considering their distributions in color, concentration, and stellar mass surface density (Saintonge et al., 2011a); they are considered to be main sequence galaxies. The average gas mass fraction among the galaxies in a stellar mass bin ranges from 0.03 to 0.06; a slight tendency that the fraction increases with decreasing stellar mass is seen.
In Reference Survey (HRS: Boselli et al. 2014), they extended to lower stellar mass (). They also measured the CO(1-0) luminosity for a sample of 225 galaxies consisting of 57 E-S0a type galaxies and 168 Sa-Im-BCD type galaxies. The detection rate is very low for early-type galaxies (16%) and high for late-type galaxies (80%). They derived the molecular gas mass and its fraction against the stellar mass by adopting the CO-to- conversion factor of . The fraction is 0.19 at . There is the same tendency as seen in Saintonge et al. (2011a) that the fraction increases with decreasing stellar mass.
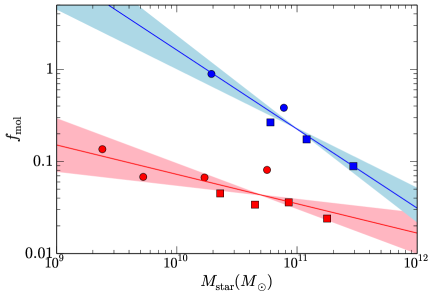
The gas mass fractions against the stellar mass are summarized in Figure 1. Since different CO-to-H2 conversion factors are used to derive the molecular gas mass in the data mentioned above, we recalculated them by adopting the metallicity dependent CO-to-H2 conversion factor by Leroy et al. (2011, their Figure 6) and Genzel et al. (2012) at and , respectively. (Hereafter, we do not include the helium in the molecular gas mass.) To do this, we estimated the gas metallicity from the mass-metallicity relation at by Erb et al. (2006, their Figure 3) and at by Yabe et al. (2014) to use the same metallicity calibration.
Using these data, we fit the relation with the following function by Popping et al. (2012):
| (1) |
where and are constant parameters. This function form was designed to match the molecular gas mass fractions against the stellar mass at and local data including Saintonge et al. (2011a). The best-fit values are and at and , respectively. Note that the original function form is for the fitting to the gas mass fraction of and does not exceed 1.0. Uncertainties (1) of the best-fit functions are shown as shaded region in Figure 1. We derived the uncertainties by random realizations of the data points according to their errors.
2.2 Stellar mass function of star-forming galaxies
We use the stellar mass functions (SMFs) at by Tomczak et al. (2014, T14) and Mortlock et al. (2015, M15). At , we adopt the SMF of star-forming galaxies by Moustakas et al. (2013). The SMFs are also corrected for the IMF difference.
T14 derived galaxy SMFs over a redshift range of using 13,000 galaxies from the FourStar Galaxy Evolution Survey obtained in the Chandra Deep Field South, the Cosmic Evolution Survey, and the Hubble Ultra Deep Field. T14 derived the SMF down to about 1 dex lower stellar mass than those of the previous studies at . T14 reached stellar mass of at . They separated the full galaxy sample into star-forming and quiescent populations based on a rest-frame vs. diagram, and then derived SMF for respective populations. They fitted the SMFs with double-Schechter function as
| (2) | |||||
where is the characteristic stellar mass. We derived a SMF of star-forming galaxies at by combining the best-fit double-Schechter SMFs at and (their Table 2).
M15 derived SMFs over the similar redshift range () using a combination of the UK Infrared Telescope Infrared Deep Sky Survey (UKIDSS) Ultra Deep Survey (UDS), Cosmic Assembly Near-infrared Deep Extragalactic Legacy Survey (CANDELS) UDS and CANDELS the Great Observatories Origins Deep Survey-South survey data sets. M15 reached stellar mass of at . They selected SF galaxies based on classification (contamination by SF galaxies in quiescent population is estimated to the on average % by using 24 m data), and derived SMF of star-forming galaxies at and fitted with the single-Schecheter function. The uncertainties on the SMFs of T14 and M15 include the uncertainties of the classification (i.e., contamination due to the color classification), the uncertainties in the SED modeling, the Poisson uncertainties, and cosmic variance.
Moustakas et al. (2013) derived a SMF of nearby galaxies () using 170,000 galaxies from the Sloan Digital Sky Survey (SDSS). The SMF in the local universe reached stellar mass of . They separated the galaxies into star-forming and quiescent populations based on whether they lie on or below the main sequence in SFR vs. stellar mass diagram. We fitted the single-Schechter function and obtained the best-fit parameters : .
3 cosmic molecular gas mass density
Combining the dependence of the molecular gas mass fraction on the stellar mass and the SMF, we derived the CMGD as
| (3) |
where is the SMF of star-forming galaxies and refers to (equation (1)).
Since we intend to compare the cosmic evolution of the CMGD with that of the CSFRD, obtaining the molecular gas masses in the galaxies in the same stellar mass range as that for the CSFRD is desirable. Madau & Dickinson (2014) derived the CSFRD by integrating luminosity function from where is the characteristic luminosity of the Schechter function. This does not necessarily correspond to stellar mass exactly. But considering the correlation between SFR and stellar mass, i.e., main sequence for star-forming galaxies, it would be reasonable to choose as at each redshift. From the best-fit , in the local universe is and that at is (T14) and (M15). As for , we take .
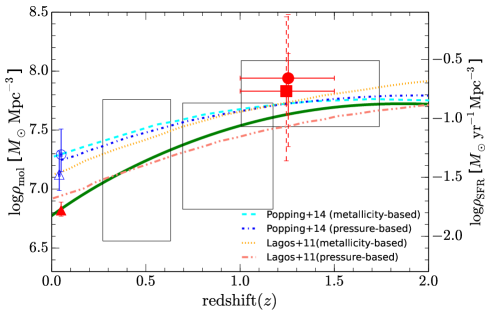
The resulting CMGD at is and that at is (T14) and (M15). The results are shown in Figure 2. The results by adopting T14 and M15 agree with each other within the error. Here the uncertainties () shown with solid error bars to the obtained values are calculated from the uncertainties on the molecular gas mass fraction (equation (1)) and the SMF; we ran realizations assuming the error distribution for the best-fit values is Gaussian.
The CMGD at is about ten times larger than that in the local universe. This seems to imply that the large CFRDS is due to the large CMGD at . There are, however, many uncertainties in deriving the CMGD other than the fitting error on the molecular gas mass fraction and the SMF: (1) CO luminosity ratio, (2) CO-to- conversion factor, (3) in low stellar mass range, (4) slope of main sequence, and (5) contribution from Ultra-Luminous InfraRed Galaxies (ULIRGs). We discuss these uncertainties.
(1) To obtain CO(1-0) luminosity, Seko et al. (2016a) assumed the ratio of 0.23 for CO(5-4) luminosity by Daddi et al. (2015). Daddi et al. (2015) reported that CO(5-4) emissions from three main sequence galaxies (sBzK) at are more excited than that of our Galaxy, but are not so excited as compared with M82. Meanwhile, Decarli et al. (2016b) recently found the -ladders of star-forming galaxies are more similar to that of our Galaxy.
If the CO -ladder is similar to that of M82 (e.g., Carilly & Walter 2013), the CO(1-0) luminosity would be lower by a factor of . If the ladder resembles to that of our Galaxy, it increases by a factor of . Dashed error bars in Figure 2 show the uncertainty. For the CO(3-2) and CO(2-1) lines, the uncertainties are smaller than this.
(2) If we adopt a metallicity independent CO-to- conversion factor of (not including helium mass), the CMGD decreases 23 % (T14) and 25 % (M15) at and 6 % at .
(3) We extrapolated the molecular gas mass fraction to at to cover the similar stellar mass range used for the derivation of the CSFRD. Saintonge et al. (2013) and Dessauges-Zavadsky et al. (2015) show the molecular gas mass fractions in lensed star-forming galaxies with stellar mass of at are , supporting our extrapolation. However, the average molecular gas mass fraction in star-forming galaxies with the low stellar mass range may be smaller, because the low metallicity and the low gas column density are likely to suppress formation of molecular component. Although the CO-to- conversion factors we used are metallicity dependent, we also calculated the CMGD assuming in . Resulting CMGD is reduced by 25% (44%). Further studies of the gas mass fraction in the low stellar mass range are desirable.
(4) If we consider that the slope of the main sequence is slightly flatter (), would be . In this case, the resultant CMGD increases % at and 18 % at , though the uncertainties of the fractions and SMFs are larger than those for the case of .
(5) SMFs of star-forming galaxies used here do not exclude ULIRGs, but here we discuss the contribution to the CMGD from the ULIRGs. The gas mass fractions of ULIRGs at by Silverman et al. (2015) are the same order as those of main sequence galaxies. This can also be seen by comparing the stellar mass vs. SFR diagram (e.g., Rodighiero et al. 2011, their Figure 1) and the molecular gas mass vs. SFR diagram (e.g., Sargent et al. 2014, their Figure 2). Considering the stellar mass of ULIRGs is about , the number density of ULIRGs (Goto et al., 2015) is more than ten times smaller than that of main sequence galaxies with ((T14) and (M15)). Hence, the contribution to the CMGD from ULIRGs is expected to be small.
The largest uncertainty seems to be the CO luminosity ratio, and the observations in lower CO transitions are more desirable.
4 Discussion and summary
The CMGD at obtained here is consistent with that recently derived value based on the CO luminosity function at (Decarli et al., 2016a). They derived CO(2-1) luminosity function and used the CO emission line -ladder by Daddi et al. (2015). They also conclude the CMGD at is times larger than that at the present-day universe. The CMGDs by Decarli et al. (2016a) are shown in Figure 2 without correcting for the difference of the CO-to-H2 conversion factor used. Since they used the constant conversion factor of , we also use the same factor to directly compare with their results. Resulting values are (T14) and (M15) which are in the range of by Decarli et al. (2016a). It should be note that the CO luminosity corresponding to our is close to the lowest CO luminosity used by Decarli et al. (2016a).
The CMGD at obtained here is about two times smaller than that by Obreschkow & Rawlings (2009) (), which is also shown in Figure 2. They derived the CMGD using the CO luminosity function by Keres et al. (2003) and adopting the the CO luminosity and -band luminosity dependent CO-to- conversion factor. Obreschkow & Rawlings (2009) noted that Keres et al. (2003) overestimated the CMGD due to the constant CO-to- conversion factor. Although the CO luminosity corresponding to our is close to the lowest CO luminosity used by Obreschkow & Rawlings (2009), the CMGD does not agree with that by Obreschkow & Rawlings (2009). The cause for this discrepancy is not clear, but it may be worth noting that if we use only by Boselli et al. (2014), the CMGD agrees with that by Obreschkow & Rawlings (2009)
We also show the semi-analytic model predictions by Lagos et al. (2011) and Popping et al. (2014) of the CMGD in Figure 2. The model predictions roughly agree with the observational results. However, the increase factor of the gas density from is rather smaller than that in this study.
In Figure 2, the best-fit CSFRD evolution by Madau & Dickinson (2014) is also plotted, which has an uncertainty of about dex as seen in their Figure 9. The CSFRD increases about ten times from to (contribution from ULIRGs at is not large (%) (Casey et al. 2012; Goto et al. 2015). Our results show the CMGD is also about ten times larger at than at . Thus the large CSFRD at is considered to be due to the large CMGD at the redshift. This would be reasonable if we recall that the SFR is mostly proportional to he molecular gas mass in a star-forming galaxy (e.g. Sargent et al. 2014). This also implies that the star formation efficiency is similar at the both epochs on average. Seko et al. (2016a) pointed out that the star formation efficiency ( SFR / molecular gas mass, or gas depletion time) is slightly larger at the higher stellar mass than at the lower mass in contrast to the trend seen in the local universe (Saintonge et al., 2011b; Boselli et al., 2014). Although the trend is slightly different, the values are similar each other at the stellar mass of , which is almost middle of the stellar mass sampled in this study.
In this paper, in order to constrain the CMGD at and that in the local universe,
we combined the average molecular gas mass fraction against the stellar mass and the stellar mass function of star-forming galaxies at the redshifts.
By integrating down to , the CMGD is derived.
The obtained CMGD at is .
Although these values still have various uncertainties,
this CMGD at is about ten times larger than that in the local universe (),
implying that the large CSFRD at is due to the large CMGD.
The CMGD at the redshift obtained in this study agrees with that recently obtained from integration of CO luminosity function,
indicating that the approach employed here is effective.
We would like to thank the referee for useful comments and suggestions.
K.O. is supported by Grant-in-Aid for Scientific Research (C) (16K05294) from Japan Society of the Promotion of Science (JSPS).
A.S. is supported by Research Fellowship for Young Scientists from JSPS.
References
- Berta et al. (2016) Berta, S., Lutz, D., Genzel, R., et al. 2016, A&A, 587, A73
- Berta et al. (2013) Berta, S., Lutz, D., Nordon, R., et al. 2013, A&A, 555, L8
- Boselli et al. (2014) Boselli, A., Cortese, L., Boquien, M., et al. 2014, A&A, 564, A66
- Carilly & Walter (2013) Carilli, C. L., & Walter, F. 2013, ARA&A, 51, 105
- Casey et al. (2012) Casey, C. M., Berta, S., Bock, J., et al. 2012, ApJ, 761, 140
- Daddi et al. (2015) Daddi, E., Dannerbauer, H., Liu, D., et al. 2015, A&A, 577, A46
- Decarli et al. (2016a) Decarli, R., Walter, F., Aravena, M., et al. 2016a, ApJ, in press, arXiv:1607.06770
- Decarli et al. (2016b) Decarli, R., Walter, F., Aravena, M., et al. 2016b, ApJ, in press, arXiv:1607.06771
- Dessauges-Zavadsky et al. (2015) Dessauges-Zavadsky, M., Zamojski, M., Schaerer, D., et al. 2015, A&A, 577, A50
- Erb et al. (2006) Erb, D. K., Shapley, A. E., Pettini, M., et al. 2006, ApJ, 644, 813
- Genzel et al. (2012) Genzel, R., Tacconi, L. J., Combes, F., et al. 2012, ApJ, 746, 69
- Goto et al. (2015) Goto, T., Oi, N., Ohyama, Y., et al. 2015, MNRAS, 452, 1684
- Keres et al. (2003) Keres, D., Yun, M. S., & Young, J. S. 2003, ApJ, 582, 659
- Lagos et al. (2011) Lagos, C. D. P., Baugh, C. M., Lacey, C. G., et al. 2011, MNRAS, 418, 1649
- Leroy et al. (2011) Leroy, A. K., Bolatto, A., Gordon, K., et al. 2011, ApJ, 737, 12
- Lilly et al. (1996) Lilly, S. J., Le Fevre, O., Hammer, F., Crampton, D. 1996, ApJL, 460, L1
- Madau & Dickinson (2014) Madau, P., & Dickinson, M. 2014, ARA&A, 52, 415
- Magdis et al. (2012) Magdis, G. E., Daddi, E., Béthermin, M., et al. 2012, ApJ, 760, 6
- Mortlock et al. (2015) Mortlock, A., Conselice, C. J., Hartley, W. G., et al. 2015, MNRAS, 447, 2
- Moustakas et al. (2013) Moustakas, J., Coil, A. L., Aird, J., et al. 2013, ApJ, 767, 50
- Obreschkow & Rawlings (2009) Obreschkow, D., & Rawlings, S. 2009, MNRAS, 394, 1857
- Popping et al. (2012) Popping, G., Caputi, K. I., Somerville, R. S., Trager, S. C. 2012, MNRAS, 425, 2386
- Popping et al. (2014) Popping, G., Somerville, R. S., Trager, S. C. 2014, MNRAS, 442, 2398
- Rodighiero et al. (2011) Rodighiero, G., Daddi, E., Baronchelli, I., et al. 2011, ApJL, 739, L40
- Saintonge et al. (2011a) Saintonge, A., Kauffmann, G., Kramer, C., et al. 2011a, MNRAS, 415, 32
- Saintonge et al. (2011b) Saintonge, A., Kauffmann, G., Wang, J., et al. 2011b, MNRAS, 415, 61
- Saintonge et al. (2013) Saintonge, A., Lutz, D., Genzel, R. 2013, ApJ, 778, 2
- Sargent et al. (2014) Sargent, M. T., Daddi, E., Béthermin, M., et al. 2014, ApJ, 793, 19
- Santini et al. (2014) Santini, P., Maiolino, R., Magnelli, B., et al. 2014, A&A, 562, A30
- Seko et al. (2016a) Seko, A., Ohta, K., Yabe, K., et al. 2016a, ApJ, 819, 82
- Seko et al. (2016b) Seko, A., Ohta, K., Yabe, K., et al. 2016b, PASJ, 68, 62
- Silverman et al. (2015) Silverman, J. D., Daddi, E., Rodighiero, G., et al. 2015, ApJL, 812, L23
- Tacconi et al. (2010) Tacconi, L. J., Genzel, R., Neri, R., et al. 2010, Nature, 463, 781
- Tacconi et al. (2013) Tacconi, L. J., Neri, R., Genzel, R., et al. 2013, ApJ, 768, 74
- Tomczak et al. (2014) Tomczak, A. R., Quadri, R. F., Tran, K. H., et al. 2014, ApJ, 783, 85
- Walter et al. (2014) Walter, F., Decarli, R., Sargent, M., et al. 2014, ApJ, 782, 79
- Yabe et al. (2012) Yabe, K., Ohta, K., Iwamuro, F., et al. 2012, PASJ, 64, 60
- Yabe et al. (2014) Yabe, K., Ohta, K., Iwamuro, F., et al. 2014, MNRAS, 437, 3647