Identifying ‘Island-Mainland’ phase transition using the Euler number
Tajkera Khatun1, Tapati Dutta2 and Sujata Tarafdar3∗
1 Physics Department, Charuchandra College, Kolkata 700029, India
2 Physics Department, St. Xavier’s College, Kolkata 700016, India
3 Condensed Matter Physics Research Centre, Physics Department, Jadavpur University, Kolkata 700032, India
∗ Corresponding author, email: sujatatarafdar@hotmail.com, Phone: +913324146666(Extn. 2760), Fax: +913324138917
Abstract
In the present communication we describe the Island-Mainland transition, occurring in a square lattice, when black squares are randomly dropped on a white background, with increasing concentration . Initially clusters of black squares (islands) are observed on the connected white background forming a ‘sea’. But as concentration of black sites increases, at some point the background break up. As deposition of black squares continues the system passes through a ‘mixed phase’ (MP) where neither the black nor white regions are fully connected. With further increase in concentration of black squares, the black squares form a fully connected background, which now becomes the ‘mainland’ with isolated pockets of white (lakes). So, as ‘p’ goes from 0 to 1, the system undergoes the following sequence of transitions Islands in sea(IS)Mixed Phase(MP)Lakes in mainland(LM). We show that the Euler number , defined as the difference between number of white clusters and number of black clusters, is maximum at the ISMP transition and minimum at the MPLM crossover.
We show that the phenomenon can be related to experimental observations in several physical systems.
PACS Numbers : 36.40.Ei; 64.60.ah; 81.40.Np
Keywords: Island-Mainland transition, Euler number, Percolation
We describe here, a transition sequence often observed in many physical systems which we designate as the Island-Mainland transition. The subject of phase transitions is one of the most widely studied in condensed matter physics [1], but there still remain observations waiting to be properly characterized and classified. The case we present here is a transition related to, but distinct from the well-studied percolation phase transition [2]. Supposing one starts with a square lattice which has all square cells white and randomly colors a fraction of the cells black, increasing gradually from 0 to 1. Initially there would be scattered black cells, or clusters of black cells, which we term islands in a connected sea of white cells. Here we define connected clusters as a group of cells of same color which share edges or corners.
Let us denote the number of connected black clusters by and the number of connected white clusters by . When , and . As increases from 0, increases upto the stage where black clusters are small and isolated, but later as black islands start to get connected with each other starts to fall. Meanwhile the ocean of white clusters starts to break up into smaller seas or lakes, so increases too. As deviates from a value very close to 1 to non-zero values, the system enters a mixed phase (MP) with neither black sites nor white sites forming a fully connected background.
However as becomes larger and larger approaching 1, must again decrease and ultimately reach 0 when . So after a certain , the MP phase crosses over to a phase where isolated white lakes are scattered randomly on a black land mass or mainland. We call this the MPLM transition.
We show that this transition sequence represents a concept different from the percolation transition, the percolation threshold is the point where the black squares first form a ‘connected cluster’ spanning the system. If two conducting bars were placed along the upper and lower sides of the square and connected to a voltage source, is the point where a non-zero current passes through the sample. To analyze the evolution of the complex morphology of the system and identify the ISMPLM transition sequence, we use the topological concept of the Euler number [3], which is simply
| (1) |
Obviously
| (2) |
and
| (3) |
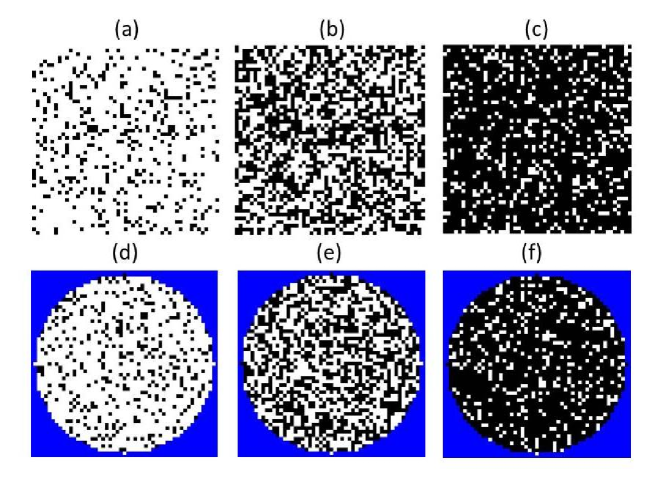
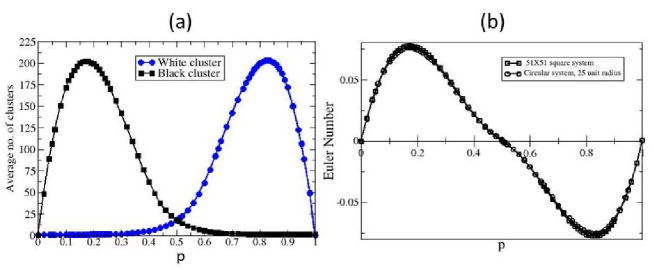
We simulate the situation described above for a system of size on a square lattice using a Fortran program. We increase in steps and calculate the evolution of . Since the system is stochastic, we average the result over configurations. The appearance of the system for several values for a square lattice with both square and circular boundaries is shown in fig(1). The graph of plotted against averaged over =100 configurations, on a 5151 system is shown in fig(2a). We see that first reaches a maximum at , then falls, has a slight inflection when crossing the X-axis, and decreases further until it reaches a minimum at . Following this it climbs up, finally reaching the value at . The simulation was repeated for several system sizes with similar results.
Fig(2a) shows that is very near 1 from up to where reaches a maximum. Fig(2b) shows that reaches a maximum here, we identify this point as the ISMP transition. The graphs for and are mirror images of each other, but the slopes to the right and left of each peak are not identical. The minimum of can be identified with the MPLM transition after which the black clusters form a fully connected system.
The percolation threshold () has been calculated by implementing the Hoshen-Kopelman algorithm [4] considering the cluster to include second nearest neighbors. The threshold in this case is at , when the first system spanning black cluster appears with increasing from 0. The corresponding threshold for the white spanning cluster when decreases from 1 is .
We illustrate the greater generality of the IM transition, by working out the whole process on a square lattice with a circular boundary (fig(1)d-f). If the system is confined by a circular boundary, the concept of the percolation transition is no longer meaningful. Here we cannot define a system spanning ‘infinite’ cluster, stretching from one side to another. However, the IM transition remains equally significant as for the square system with straight boundaries. calculated for the circular system fig(2b) shows that and occur at the same value of and as for the square system. Further, the curve for , when normalized by the total area of the system i.e. for the square and for the circular, match each other exactly as shown in fig(2b). The inflection point represents =0, which occurs from symmetry at =0.5, here .
The well-known results for critical exponents in phase transitions [1] prompts us to look for similar characteristics in the ISMP and MPLM transitions observed here. Since =1 in the IS phase and non-zero in the other phases, we define the order parameter for the ISMP transition as
| (4) |
and plot this as a function reduced defined as
| (5) |
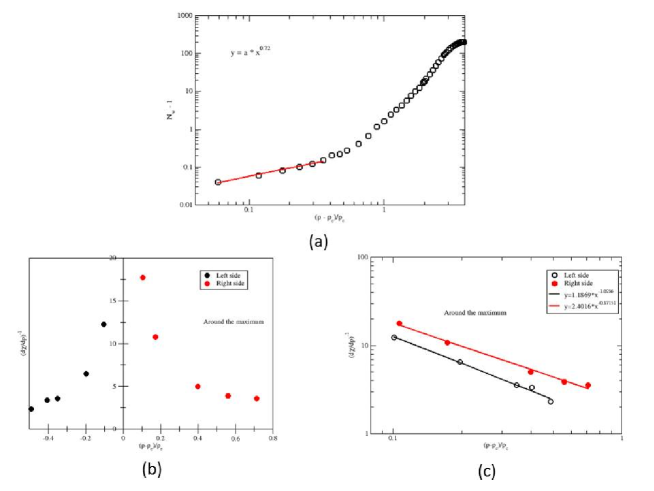
A similar behavior is found from symmetry at , the other transition point. We show in fig3 that near , approaches 0 for decreasing with a power-law having exponent 0.72 as evident from the log-log plot in figure(3a).
Another parameter we find of interest is the curve for the inverse of the derivative of the Euler number as function of , i.e. , which approaches at and . The magnitude of these derivatives are shown in figure(3b) near as a function of . Similar symmetric curves can be drawn near . When plotted on a logarithmic scale, these results show power-law behavior with exponents -1.03 for and -0.87 for . These results indicate scale invariance and critical behavior near the transitions studied here. Work on the variation of the correlation length is in progress. We now discuss the relevance of these transitions observed in two different experimental situations observed in our lab.
Two recent experiments have demonstrated that the MPLM transition identified by plays a significant role in evolving complex systems. The experiments and relevant results are as follows.
-
1.
Dutta Choudhury et al. [5] studied crystal growth during evaporation of a sessile droplet of complex fluid containing gelatin, water and sodium chloride. Videos of the drying process [6] showed a transition between formation of faceted large crystals in early stages of drying, to intricate dendritic patterns in later stages. From the video it appears that as evaporation proceeds, voids form in the continuous film of fluid and at some point, the film breaks up into small isolated fluid blobs. This crossover is similar to the MPLM transition proposed here. A simulation of the evaporation and crystal growth was carried out by Dutta Chowdhury et al. [5]. The Euler number for the fluid and void clusters (which are analogous to the white and black clusters respectively, in the present paper ) was calculated and the transition from faceted to dendritic growth was switched on when reached a minimum. The simulation agreed very closely with the experimentally observed time development of the crystal growth pattern.
-
2.
The other experiment studies desiccation crack formation in layers of clay [7]. The crack pattern depends on the thickness of the clay layer. There is a critical cracking thickness, below which cracks do not form at all. For a thin layer, just thicker than the critical, isolated cracks form randomly over the whole layer. As the thickness is increased further, cracks start to form a connected network. Regions of the clay layer now appear which are bounded by cracks on all sides, these are termed peds. With increase of the clay layer thickness, the average distance between cracks increases and the number of peds decreases. We may thus identify the number of peds with and number of cracks as . The Euler number, as function of layer thickness was calculated in this way and showed a minimum at the thickness where the crack network becomes fully connected.
To conclude we present a preliminary description of a transition we name as the ‘Island-Mainland’ transition. This is seen to be a physically significant phenomenon, observed in simulated as well as real systems. It needs to be studied in further detail and properly characterized to reveal its full richness.
References
- [1] H.E. Stanley, Introduction to Phase Transitions and Critical Phenomena (1971, Clarendon Press, Oxford)
- [2] D. Stauffer, A. Aharony, Introduction to Percolation Theory (2nd ed. 1994 Taylor and Francis, London)
- [3] H.-J. Vogel, H. Hoffmann and K. Roth, Studies of crack dynamics in clay soil I. Experimental methods, results, and morphological quantification, Geoderma, 2005, 125,203–211
- [4] J. Hoshen, R. Kopelman, Percolation and cluster distribution. I. Cluster multiple labelling technique and critical concentration algorithm, Phys. Rev. B 14 (1976) 3438.
- [5] Moutushi Dutta Choudhury, Tapati Dutta and Sujata Tarafdar, Growth kinetics of NaCl crystals in a drying drop of gelatin: transition from faceted to dendritic growth, Soft Matter, 2015,11, 6938
- [6] https://www.youtube.com/watch?v=ovYjDXcEtxk
- [7] T. Khatun, T. Dutta, S. Tarafdar, Topology of desiccation crack patterns in clay and invariance of crack interface area with thickness, Eur. Phys. J. E, 2015,