A Video-Based Method for Objectively Rating Ataxia
Abstract
For many movement disorders, such as Parkinson’s and ataxia, disease progression is usually assessed visually by a clinician according to a numerical rating scale, or using questionnaires. These tests are subjective, time-consuming, and must be administered by a professional. We present an automated method for quantifying the severity of motion impairment in patients with ataxia, using only video recordings. We focus on videos of the finger-to-nose test, a common movement task used to assess ataxia progression during the course of routine clinical checkups.
Our method uses pose estimation and optical flow techniques to track the motion of the patient’s hand in a video recording. We extract features that describe qualities of the motion such as speed and variation in performance. Using labels provided by an expert clinician, we build a supervised learning model that predicts severity according to the Brief Ataxia Rating Scale (BARS). Our model achieves a mean absolute error of on a scale and a prediction-label correlation of in a leave-one-patient-out experiment. The accuracy of our system is comparable to the reported inter-rater correlation among clinicians assessing the finger-to-nose exam using a similar ataxia rating scale. This work demonstrates the feasibility of using videos to produce more objective and clinically useful measures of motor impairment.
Introduction
Over million people globally are affected by movement disorders, and this number is projected to double in the next few decades [bach2011projected]. Quantifying the severity of motor incapacity is useful in monitoring the progression of these diseases and measuring the effectiveness of treatments. Estimates of motor incapacity are most commonly made via questionnaries, or visual assessments combined with numerical rating scales [goetz2008movement, schmahmann2009development, schmitz2006scale]. While many of these rating scales have been shown to be useful [schmitz2006reliability, schmahmann2009development, schmitz2006scale], the tests are subjective, and must be administered by an experienced clinician. An automated, objective measurement of severity could open the door to more consistent and fine-grained evaluations, and even self-administered testing.
We present an automated video-based method for quantifying the severity of motor impairment in patients with ataxia. The term ataxia describes a heterogenous group of neurodegenerative diseases characterized by gait incoordination, involuntary extremity and eye movements, and difficulty in articulating speech [schmahmann2004disorders, klockgether2010sporadic]. The severity of ataxia is often assessed using motor function tests such as the finger-to-nose maneuver, in which a patient alternates between touching his/her nose and the clinician’s outstretched finger. A neurologist observing the patient’s action rates the disease severity on a numeric scale such as the Brief Ataxia Rating Scale (BARS) [schmahmann2009development]. These rating scales often consider aspects of the patient’s movement such as speed, smoothness, and accuracy. This process typically happens during scheduled clinical visits, which can be time-consuming for the patient as well as the neurologist. Furthermore, this process ultimately produces a subjective and coarse-grained rating of the patient’s degree of motor impairment.
Our work focuses on automatically producing a rating of motor impairment directly from a video recording of a patient performing the finger-to-nose test. Our dataset consists of videos taken with a handheld camera during clinical visits. Some of these videos contain camera movements such as panning and zooming. The dataset also contains considerable variation in viewing angle and lighting conditions. While these characteristics present many challenges, the video quality is representative of what one might expect from clinical or home settings. Therefore, it is important for our system to be robust to the issues raised by quality. Another challenge is that patients with the same severity rating could be impaired in different aspects of their motion.
Our method combines optical flow and pose estimation techniques to track the location of the patient’s wrist and head in each video. We extract features from this motion signal, and use them in a learning algorithm to build a model that predicts the severity rating of the patient’s action on the BARS scale. We achieve a mean absolute error of on a BARS scale and a Pearson’s correlation of relative to the score provided by an experienced neurologist specializing in ataxia. The accuracy of our model compares favorably to the inter-rater consistency of humans that has been reported for the finger-to-nose maneuver in a similar ataxia rating scale [burk2009comparison, weyer2007reliability]. This work demonstrates the feasibility of an automated method for assessing the severity of motor impairment in ataxic patients. Such a system could be useful in clinical or even home settings by allowing more frequent and more objective assessment of the disease. An objective assessment could also be useful for reducing observer bias in clinical trials.
Related Work
Ataxia Rating Scales
Ataxias are a group of degenerative movement disorders that are characterized by incoordination of the extremities, eyes and gait [schmahmann2004disorders, klockgether2010sporadic]. Since their introduction, quantitative rating scales have been the gold standard for ataxia severity assessment. Some examples of the scales include the International Cooperative Ataxia Rating scale (ICARS), the Scale for the Assessment and Rating of Ataxia (SARA) and the Brief Ataxia Rating Scale (BARS) [trouillas1997international, schmitz2006scale, schmahmann2009development]. These scales require an expert clinician to visually assess the qualities of the patient’s movements and determine a numerical rating, and can be time-consuming. In 2009, the BARS was developed as a scale that is sufficiently fast and accurate for clinical purposes. Nonetheless, as the designer of the BARS says, an objective, fine-grained method for assessing ataxia is still “sorely needed” [schmahmann2009development]. We believe that this work is the first step towards such a method.
Human Motion Analysis
The use of camera systems to measure and detect pathological movement is well-studied for many diseases [sutherland2002evolution, galna2014accuracy]. These systems typically utilize multiple camera setups along with passive or active markers and other sensing methods such as electromyography to track the motion of the subject [muro2014gait, kugler2013automatic, lizama2016use]. These systems are expensive and complicated, must be operated by expert technicians, and often require experts to interpret the data. Other simpler systems utilize specialized hardware such as depth cameras [galna2014accuracy] or accelerometers [mancini2012isway] to measure specific pathological movements. While these kinds of hardware are becoming more readily available, monocular consumer camera-based systems are still easier to set up and operate in clinical settings. In this work, we focus on monocular consumer-quality videos, since their ubiquity could allow for widespread applications of our technique in both clinical and home settings.
To the best of our knowledge, this is the first work that uses monocular video recordings to automatically assess the severity of a neurological movement disorder. Most existing approaches rely on more specialized hardware [mancini2012isway, sutherland2002evolution], and solve different problems: they measure movements but do not produce a rating of disease severity [galna2014accuracy], or they focus on differentiating heathy and impaired patients [fazio2013gait, weiss2011toward]. One exception is the work by \citeauthorgiuffrida2009clinically, which produces a Unified Parkinson’s Disease Rating Scale rating from inertial sensor data [giuffrida2009clinically, goetz2008movement]. Our work focuses on a different disease and different input data, so a direct comparison would not be meaningful.
Human Motion Analysis in Monocular Videos
Human analysis in monocular videos often uses pose estimation as the initial step. Human pose estimation aims to localize a human’s joints in images or videos. State-of-the-art pose estimation systems are effective at localizing joints even when they are occluded by objects or other parts of the body. We use the publicly available implementation of a convolutional neural network-based pose estimator [wei2016convolutional] to track the hand of the patient in our videos.
More generally, motion analysis in monocular videos often relies on optical flow. Optical flow measures the relative motion between the pixels in one frame and another. Optical flow algorithms can be divided into sparse and dense categories [bruhn2005lucas]. Sparse flow methods [lucas1981iterative, shi1994good], track only a sparse set of salient points in the video while dense flow methods [horn1981determining] measure motion at every pixel in the frame. We use sparse optical flow to track background points for video stabilization, and use dense optical flow [brox2009large] to refine the output of our pose estimator and to improve the tracking of the patient’s hand in each video.
The BARS Dataset
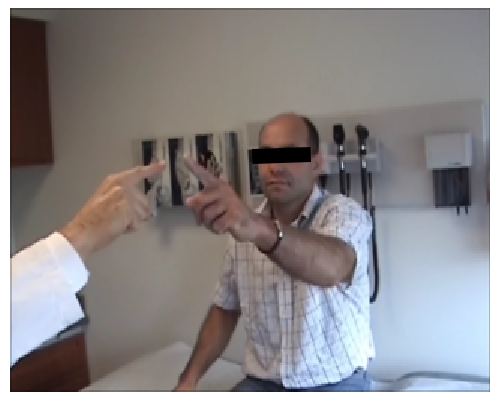
In order to train a system to predict the BARS rating from a video, we use a dataset of videos of ataxic patients. Our dataset consists of videos. The videos show distinct subjects performing several repetitions of the finger-to-nose test with one hand at a time (Figure 1). The videos were shot during clinic visits with handheld cameras. All videos were labeled by an experienced neurologist specializing in ataxia, according to a version of the BARS that uses half-point increments. For several patients, there are two videos for each hand. The scores were assigned separately for each hand, so a patient might have different ratings for their right and left hands.
Eight videos were shot with the patient’s hand moving almost directly towards the camera. This unusual viewpoint makes it difficult for modern computer vision techniques to discern motion along the nose-finger axis. These videos were excluded from the dataset, leaving us with videos of patients. Figure 2 shows the distribution of the severity ratings for the remaining videos.
Some videos contain occasional panning and zooming. We adjust for this by using sparse optical flow to track points in the background, and then estimating a similarity transformation from the tracked points to stabilize each frame [shi1994good, lucas1981iterative]. Because of the low number of salient background points in some of the videos, only 61 videos were successfully stabilized. We processed the remaining videos without stabilization.


Feature Extraction
From the videos in the BARS dataset, we extract features that quantify the motion characteristics of each patient’s active hand. We use pose estimation and optical flow to track the location of the patient’s wrist and head, segment the motion signal into cycles, and compute motion features from the signal segments. This process is summarized in Figure 3, and explained in detail in the following sections.
Head and Wrist Tracking
Head and Wrist Location Estimates Using Pose Estimation
As a first step towards extracting features, we obtain the location of the moving hand in each video frame. The quality of the videos, which are representative of what might be captured in practice, make this a difficult task. Most of the videos have low contrast, harsh lighting, and significant motion blur, making local appearance-based tracking techniques such as sparse point tracking [lucas1981iterative] or mean-shift [comaniciu2000real] ineffective. In addition, there is significant variation in viewing angle across videos, causing simple hand-recognition detectors to fail. We instead rely on a more complex pose estimation system that calculates the likely location of each body part in an image by leveraging information about the configuration of the entire body. We use a state-of-the-art pose estimation system based on convolutional neural networks [wei2016convolutional] due to the availability of the code, even though the system was designed for images rather than videos. The system is capable of predicting the location of several body joints, such as the wrist and the top of the neck (bottom of the head). We use the relative location of the wrist to the top of the neck to approximate the location of the patient’s hand relative to his/her head.
Using the pose estimator “out of the box” did not produce accurate wrist location estimates. This is because the videos in our dataset contain poses that are not well-represented in the MPII Human Pose dataset [andriluka20142d], the dataset that the pose estimator was trained on. To address this, we fine-tune a network on a new annotated dataset of individuals performing the finger-to-nose-test, none of whom appear in the BARS dataset. Our dataset consists of images from distinct individuals; images are taken from videos of healthy individuals, and images are downloaded from internet resources on ataxia. We annotated the locations of joints in our dataset and fine-tuned the network for iterations with a batch size of .

Temporal Regularization Using Optical Flow
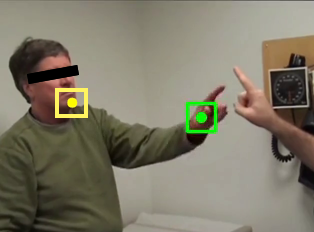
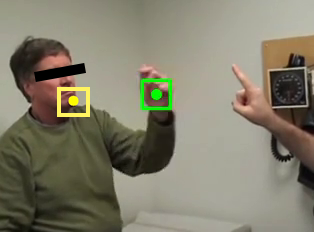
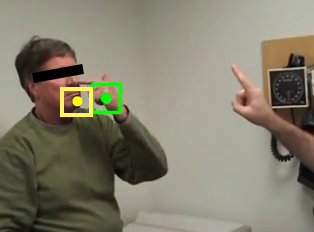
The pose estimator we use is designed for images, and does not encode temporal continuity between neighboring video frames. We enforce this continuity by temporally smoothing the joint estimates for each frame, using the estimates from neighboring frames and dense optical flow as described in [charles2014upper]. We further improve the smoothed wrist location estimates by constraining the estimates to fall within the fastest-moving region, which we assume to contain the patient’s active hand. We determine these regions by computing dense trajectories from flow spanning multiple frames as described in [sundaram2010dense], and then selecting the trajectories with the highest amount of motion over the course of the video. An example of our tracking results is shown in Figure 5.
Cycle Segmentation
Figure 6a shows examples of the wrist -position signal (relative to head) produced by our tracking algorithm. Each signal contains a varying number of repetitions of the finger-to-nose action. To account for this, we assess the motion characteristics of each cycle independently. We first segment the wrist location signal in time. The automated algorithm takes as input the position of the patient’s wrist relative to his/her head, and attempts to segment cycles beginning when the wrist is halfway between the patient’s head and the doctor’s finger. For robustness against tremors and noise around the midpoint, we use hysteresis thresholding, a common thresholding technique used in signal processing, to detect the forward and backward portions of the action. The threshold for the forward portion is of the way from the patient’s head to the doctor’s finger; the backward threshold is . We approximate the location of the patient’s head using the minimum of the wrist position signal, and the location of the doctor’s finger using the maximum. Since the beginning and the end of the videos often include unrelated motions, we only compute the head and doctor’s finger positions from the middle half of the signal. We define a cycle to be finger-nose-finger or nose-finger-nose based on which designation produces the higher number of cycles in a video, and exclude any portions of the signal that do not fall within a complete cycle. The results of applying our cycle segmentation algorithm to the signals is shown in Figure 6b.
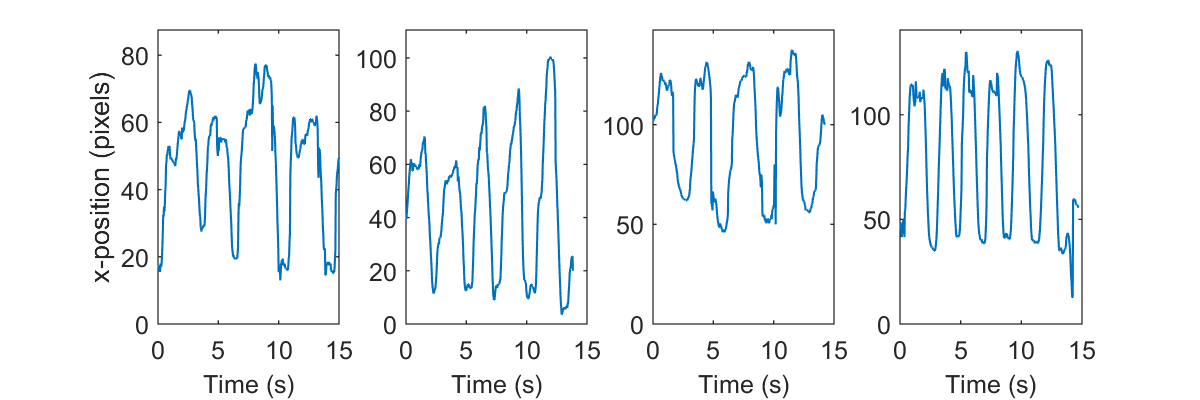

position
Motion Features
From these wrist location signal segments, we extract 10 features. The features are designed based on the BARS guidelines for rating the finger-to-nose test in half-point increments. For example, the guidelines state that patients with a severity rating of show slowed movement, and patients with a severity rating of show oscillating movements. As the severity rating increases, patients should show increasing variation of performance within the same examination, as well as increasing amounts of dysmetria (a lack of coordination).
Average Cycle Duration
As described in the BARS guidelines, healthy patients are able to complete each cycle of the finger-to-nose test more rapidly than impaired patients. We compute the average time it takes for each patient to complete a cycle, as well as just the nose-to-finger and finger-to-nose portions of the cycles. We use the logarithms of these three values in our feature vector, because we hypothesize that a difference in cycle length at low severities is more discriminative than the same difference at high severities.
Number of Direction Changes
We capture the amount of oscillation by counting the number of times the wrist changes direction during the finger-to-nose action. We do this by counting the number of sign changes in the first derivative of the wrist’s and position signals. Our features include the raw counts for both signals as well as the counts normalized by the total number of cycles in the video. These features also describe the patient’s degree of dysmetria, since patients who are more incoordinated have difficulty controlling the trajectory of their hand during the test.
Variation in Cycle Duration
Another important characteristic of ataxic movement is variation of performance. Patients with more severe ataxia are unable to perform the finger-to-nose action in a consistent manner. We capture this by computing the standard deviations of the full cycle times, and the nose-to-finger and finger-to-nose times.
Model
Using the features described in the previous section, we train a linear regression model to predict the BARS severity rating for each video. Though the BARS rating is not necessarily a linear function of our feature space, we prefer to use a simpler model to avoid overfitting on our limited dataset. We use the LASSO technique, a method for linear regression that includes a regularization term to help with feature selection [tibshirani1996regression]. We use cross-validation to select the regularization parameter, and round the predicted rating to the nearest valid BARS severity rating (which goes in half point increments from 0 to 4).
Results
We used leave-one-patient-out cross validation to test our models. This approach allows us to train each model with the maximum amount of data, and evaluate the model’s performance on a patient that it has not seen yet. Our models predicted the severity rating of each test video with a mean absolute error of on a BARS scale. The prediction-label Pearson’s correlation was .
Prediction Error
Most of our models’ prediction errors are less than one level on the BARS (88.1%). Figure 7 shows the distribution of errors, as well as the error for each ground truth severity rating. Only three videos produced an absolute error greater than 1 point. In one of those videos, the patient stopped in the middle of the exam to ask the clinician a question. This pause was interpreted by our system as a long average cycle duration, which caused our system to overestimate the rating by . In the the other two videos, the patient exhibited high amounts of oscillation, but performed each finger-to-nose cycle fairly quickly, causing an underestimation by . These errors might be explained by the importance of the average cycle time feature in our models, which received consistently high weights in the regressions. We discuss this further in the Limitations section.
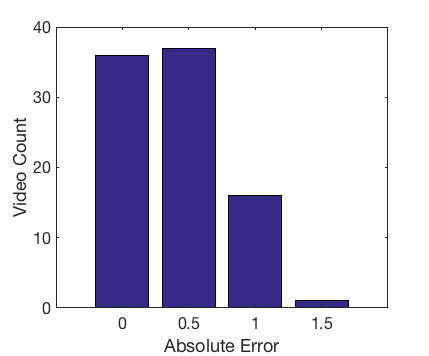
absolute errors
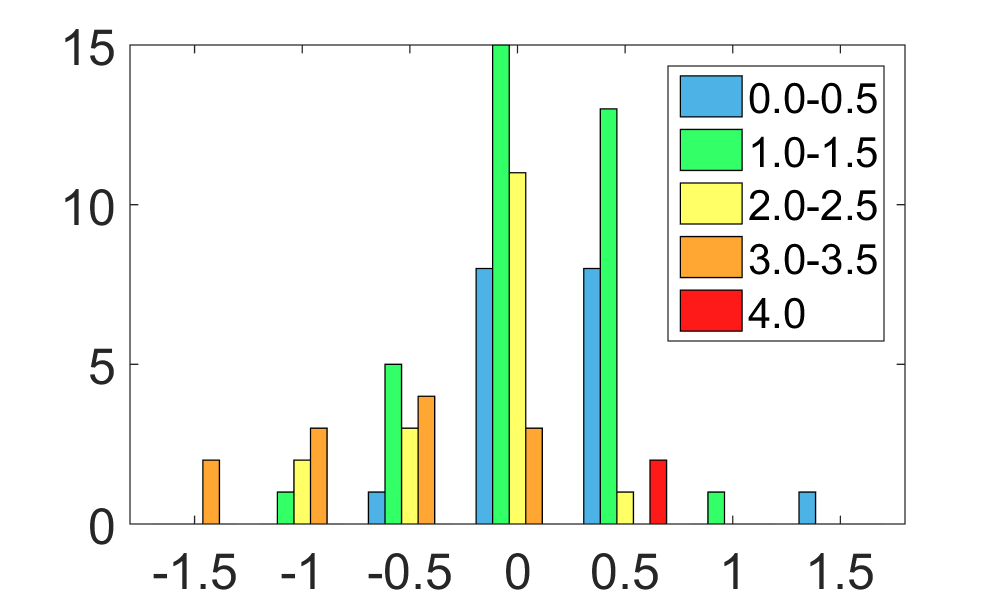
Comparison with Human Performance
Our system is the first attempt at automatically producing a rating of ataxia severity from video recordings. Thus, we compare the performance of our system to that of human raters using an ataxia rating scale, the current gold standard for assessing ataxia severity. Among human raters, the ground truth rating of ataxia severity is not well-defined, and thus the concept of error is less meaningful. We instead compare the prediction-label correlation of our system to the inter-rater correlation of humans.
To the best of our knowledge, no assessments of human consistency in rating the finger-to-nose maneuver in the BARS have been published. However, the evaluation of human consistency in rating the finger-to-nose maneuver has been reported for the Scale for Assessment and Rating of Ataxia (SARA) in two studies [burk2009comparison, weyer2007reliability]. \citeauthorburk2009comparison focus on 96 Freidreich’s ataxia patients, and \citeauthorweyer2007reliability study 64 patients of diverse types of ataxia. Like the BARS, the SARA rates the finger-to-nose maneuver from (normal) to (at which the patient is unable to complete the maneuver), but differs in the criteria for the intermediate levels [schmitz2006scale].
The BARS ratings in our dataset use a half-point scale, while the SARA uses a full-point scale. In order to make a fair comparison, we investigate two methods for converting our dataset to use a full-point scale.
-
1.
Discarding Half-Point Videos
We train and test on only the full-point videos in our dataset. This restricted dataset contains 50 full-point videos of 32 distinct patients. We evaluate our model using leave-one-patient-out cross-validation as described earlier. -
2.
Random Rounding of Half-Point Videos
Half-point ratings may be interpreted as cases where the rater is uncertain about the appropriate integer rating. We randomly round each half-point rating up or down, and then train and evaluate our model on the entire rounded dataset. We repeat the rounding process times and report the average error and prediction-label correlation.
Both dataset conversion methods are expected to have a negative effect on our system’s performance; discarding videos significantly decreases the size of our dataset, and randomly rounding video ratings introduces noise into our labels. Table 1 compares our system’s performance on full-point videos to the inter-rater correlation of human raters reported in the literature. The inter-rater correlation is presented using Pearson’s correlation coefficient by \citeauthorburk2009comparison, and the intra-class correlation coefficient [shrout1979intraclass] by \citeauthorweyer2007reliability [burk2009comparison, weyer2007reliability]. Despite the challenges posed by our dataset conversion methods, our system achieved considerably higher correlation than the Pearson’s correlation coefficient of reported by \citeauthorburk2009comparison Our system performed comparably to the intra-class correlation of and reported for the right and left hand respectively [weyer2007reliability].
Our system had mean absolute errors of and respectively on the full-point datasets. While these errors are higher compared to our models built using the half-point scale, the the error relative to the rating step size is smaller.
| Metric | Human | Our System | |
|---|---|---|---|
| Discard | Randomly Round | ||
| Pearson’s Correlation | 0.55 | 0.757 | 0.741 |
| Intra-class Correlation | 0.793 (right) | ||
| 0.848 (left) | 0.753 | 0.743 | |
Limitations
Our results show that we can predict the BARS ratings with a prediction-label correlation that is comparable to the published inter-rater correlation among humans. However, our method did fail on a few videos, suggesting areas of improvement. For example, it underestimated the rating for a severity- patient who moved quickly but with inaccuracies and oscillations. Using a model more complex than linear regression can help capture these more complicated cases, but a larger dataset would be necessary to avoid overfitting.
Our dataset contains a limited number of examples for the higher severities. For instance, the videos with severity ratings of and were all of the same patient. While our system performed reasonably well on these videos (0.5 absolute error for all videos of this patient), it is unclear if our system will generalize well for other severely impaired patients. Our model could be made more generalizable by obtaining more videos of severely impaired patients, making the dataset more evenly distributed over the range of BARS severity ratings.
The BARS ratings for our dataset were provided by a single neurologist. Obtaining BARS ratings from multiple neurologists would allow us to average the ratings and compute a ground truth label that is less subject to personal bias. Furthermore, such ratings would allow us to make a more direct comparison of our method to human raters.
Conclusion
We described a video-based method for quantifying the severity of motion impairment, and used the method to predict the severity rating of ataxic patients performing the finger-to-nose test described in the Brief Ataxia Rating Scale (BARS). Our method uses convolutional neural network-based pose estimation and optical flow to track the location of a patient’s wrist and head. This tracking method is robust to the variations in camera angle and lighting conditions present in our dataset. We segmented the resulting wrist position signal into cycles, and extracted features such as average cycle time and amount of oscillation from these signal segments based on the BARS guidelines. We used these features to build a linear regression model to predict the severity rating of the patient’s action. Our models had a mean absolute error of on a BARS scale and a correlation of relative to the ratings assigned by a trained neurologist. This performance is comparable to the inter-rater correlation reported for humans using a similar ataxia rating scale.
We have demonstrated the feasibility of an automated system for assessing the severity of ataxic patients. Such a system could be used to improve the management of the disease in clinical or home settings, or to reduce observer bias in clinical trials. We believe that our system is an important step towards the automatic evaluation of movement disorders.