HILDCAA* events between 1998 and 2007, and their related interplanetary magnetic field and plasma values
Abstract
We investigate the interplanetary conditions during 135 less strict high-intensity, long-duration, continuous AE activity (HILDCAA*) events between the years 1998–2007. The HILDCAA* events were chosen by following the three “traditional” criteria which describe the high-intensity, long-duration, continuous AE activity (HILDCAA). However, we include a small modification in the criteria that considers: “the AE values do not drop below 200 nT for more than 2 h at a time”. This criteria is modified by changing 2 to 4 hours period in which the AE values should not drop below 200 nT. Once the events are selected, we perform a statistical analysis of the interplanetary parameters during their occurrences. The distribution of HILDCAA* events along the solar cycle shows a pattern of double peak, with a peak around the maximum of the sunspot cycle, and an other in the descending phase. This kind of distribution is similar to the distribution of low-latitude coronal holes. For each of the HILDCAA* events, we have found its related Interplanetary Magnetic Field (IMF) and plasma parameter signatures. The average values of AE, AU, AL, and Dst indices, the density and temperature of the solar wind protons, the solar wind speed, the Bz component of the IMF, the IMF intensity, dynamic pressure, and plasma beta, among all the 135 HILDCAA* events, found here are: AE (348.1 67.1 nT), AU (123.9 34.2 nT), AL (-224.2 47.3 nT), Dst (-22.1 9.1 nT), Density (4.3 1.3 cm-3), Temperature (170976.3 58049.9 K), Flow speed (547.1 83.9 km/s), Bz (-0.70 0.88 nT), IMF magnitude average (6.6 1.2 nT), pressure (2.4 0.6 nPa), and plasma Beta (0.66 0.27).
keywords:
HILDCAAs*; Solar cycle; Interplanetary parameters; Table of events1 Introduction
Different solar wind sources cause variations in the interplanetary medium, such as variations in density, speed, temperature, and interplanetary magnetic field (IMF). Upon reaching Earth magnetosphere, these variations generate disturbances in the magnetospheric and ionospheric current systems changing the geomagnetic field values measured on ground. Solar activity is responsible for many disturbances in the geomagnetic field that can be recurrent or transient. In general, there are basically 2 solar sources responsible for geomagnetic variation over a solar cycle. First: Interplanetary Coronal Mass Ejection (ICME) related magnetic storms near solar maximum, and second: Corotating Interaction Regions (CIR) storms during the solar minimum and its declining phase (Tsurutani and Gonzalez, 1987, 1997; Tsurutani et al., 1988, 1995; Gosling, 1993; Gonzalez et al., 1994; Suess and Tsurutani, 1998; Richardson et al., 2000; Echer et al., 2008). The solar activity varies over an 11-year period, therefore, the interplanetary medium structures and the interplanetary magnetic field also vary systematically according to the solar activity (Parks, 1991; Kivelson and Russell, 1995).
During minimum and descending solar activity, the possibility for geomagnetic disturbance is mainly due to the reccurent of coronal holes HSS (High Speed Stream). It is common that the coronal holes persist for more than one solar rotation (Sheeley et al., 1976, 1977; Tsurutani et al., 1995). Therefore, their recurring effects can be seen on Earth for several days or weeks, lasting up to an entire solar rotation about 27 days (Tsurutani et al., 1995). High Speed Streams (HSSs) (Smith and Wolfe, 1976) are characterized by the presence of Alfvén waves propagating from the Sun (Belcher and Leverett, 1971; Shugai et al., 2009). Due to their fast velocity, the HSSs flow more radially from the Sun than the slow solar wind from other regions (Guarnieri et al., 2006).
Alfvén waves are often detected a few days after the CIRs, and they can last (but not always) for several days. The magnetic reconnection between the component in the southern direction of the magnetic field of Alfvén waves and the magnetospheric field is the mechanism to energy transfer between the solar wind and the Earth’s magnetosphere. Sometimes, High-Intensity Long-Duration Continuous AE Activity (HILDCAA) can occur (Tsurutani et al., 1995, 2004).
Tsurutani and Gonzalez (1987) defined HILDCAA events as intervals of: (1) High-Intensity - AE peak values exceed 1000 nT; (2) Long-Duration - the durations were greater than 2 days; (3) Continuous AE Activity - the AE values never dropped below 200 nT for more than 2 h at a time; and (4) HILDCAAs must occur outside of the main phase of magnetic storms. These criteria were imposed to illustrate the physical process related to the aforementioned solar energy transfer into the magnetosphere. However, the same physical process may occur even one or more of the four criteria are not strictly followed (Tsurutani et al., 2004).
Here, we are interested in analyzing the solar wind speed, density, intensity and orientation of the interplanetary magnetic field, and temperature during HILDCAA* events. During geomagnetically quiet periods, the solar wind flows at Earth’s orbit with speed of about 400 km/s and density of approximately 5 , and it carries a magnetic field of about 5 nT. The solar wind controls the size of the magnetic cavity, through its dynamic pressure, and the energy flow into the magnetosphere by the magnetic reconnection of the interplanetary field with the terrestrial field (Dungey, 1961). The bow shock heats and compresses the magnetospheric plasma. It also compresses the magnetic field, so Alfvén waves in the HSS are amplified as they pass through the bow shock. Moreover, the southward component direction of the interplanetary magnetic field is amplified as well. If there are strong southward components within the CIR, a magnetic storm will happen (Dungey, 1961).
Moreover, we verify the effects of the interactions between the solar wind and the magnetosphere using the geomagnetic indices, AE and Dst, which are designed to represent the disturbance level of the Earth’s magnetosphere. Basically, the goal of any index is to provide information in a continuous manner about a more or less complex phenomena which varies with time. An index can be used for two purposes: to study the phenomenon itself, or as a reference to study an associated phenomenon (Mayaud, 1980). Here, we will use the AE and Dst indices to verify the associated interplanetary medium conditions.
2 Datasets and methodology
In this paper, we use the same methodology developed and evaluated by Prestes et al. (2016) to the identify HILDCAAs* events. As discussed by Prestes et al. (2016), HILDCAA* events are defined by the following criteria: (1) AE peak values must exceed 1000 nT at least once during each event; (2) The event should last at least two days, (3) the AE values should never drop below 200 nT for periods longer than 4 hours at a time, and (4) HILDCAAs* must occur outside of the main phases of magnetic storms.
In order to determine the typical values of the solar wind parameters related to HILDCAA* events, we use ACE spacecraft data set with one-minute temporal resolution. The interplanetary solar wind data used here are: solar wind speed (Vsw in km/s), plasma density (Nsw in cm ), temperature (Tsw in K), flow pressure (Psw in nPa), IMF magnitude (Bo in nT), the Bx (nT), By (nT), Bz (nT) components in the GSM coordinate system, and plasma beta. We also use the AE, AU, and AL indices with one-minute temporal resolution, and the Dst index with one-hour resolution.
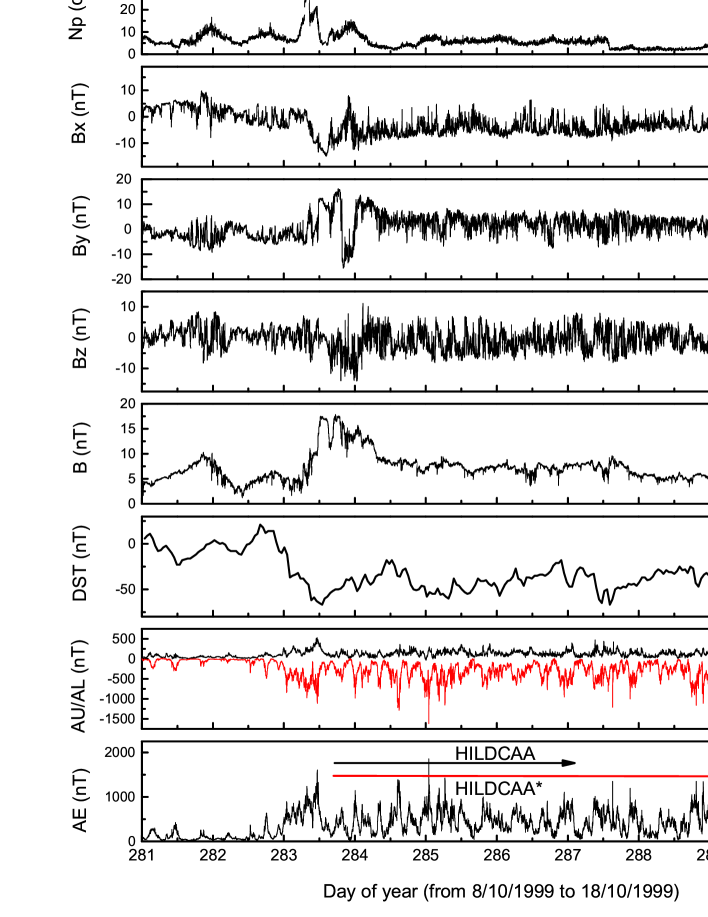
Figure 1 gives an example of “traditional” HILDCAA and HILDCAA* events. It is possible to notice that the HILDCAA event defined by Tsurutani and Gonzalez (1987)) is entirely contained within a HILDCAA* event defined by Prestes et al. (2016) (event ). In this example, both events followed a geomagnetic storm. For this reason, the onset of HILDCAAs and/or HILDCAAs* is not taken until Dst-50 nT, and consequently, these events occurred within the storm recovery phase. As discussed by Tsurutani and Gonzalez (1987), the recovery phase during this kind of events is much longer than usual and can last for more than a week as shown in Figure 1. In addition, it is possible to notice that the AE index shows intense and continuous activity.
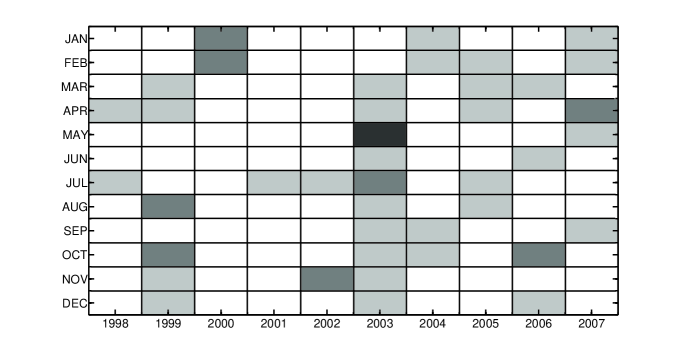
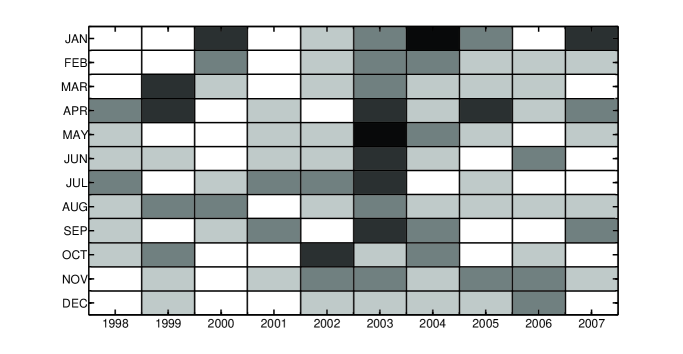
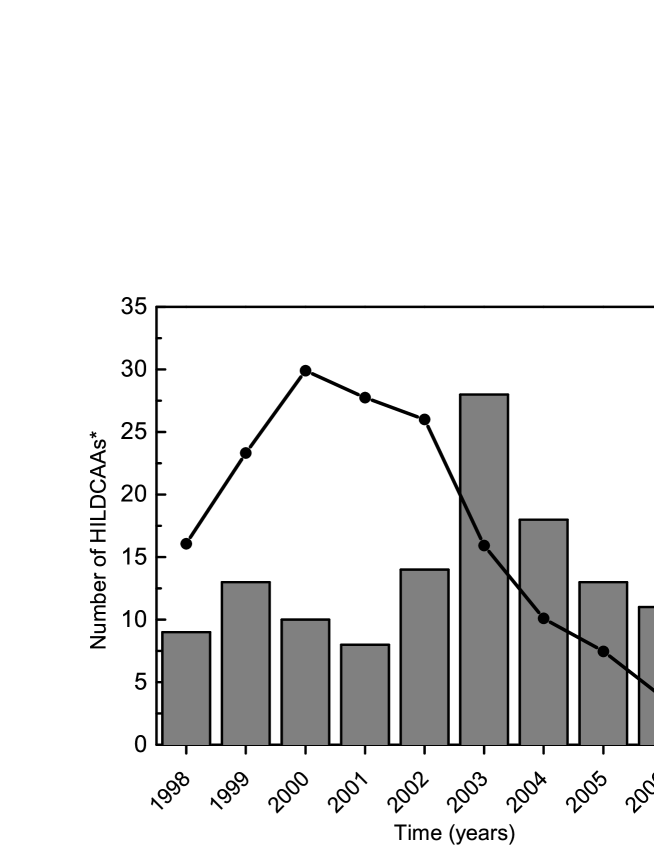
Figure 2 shows all of the monthly HILDCAAs (top panel) and HILDCAAs* detected between 1998–2007. From this figure, it is seen an increase of the event numbers using the criteria defined by Prestes et al. (2016). On the top panel, there are only a few regions where there are many events. On the other hand, on the bottom panel this fact is not true, but the HILDCAA* events present the same variability of HILDCAA events according to the solar activity. There are a larger occurrence of HILDCAA and HILDCAA* during the declining phase (2003), a poor occurrence during the high solar activity (2001).
Following the criteria defined by Prestes et al. (2016), a total of 135 HILDCAA* events were found in the dataset from the years 1998 to 2007. The list of these events is presented in Table LABEL:grid_mlmmh, which is arranged as follows: column 1 gives the studied events defined by numbers (from 1, 2, 3 and so forth…) and occurrence year; column 2 gives the starting date; column 3 gives the starting time in Universal Time (UT); column 4 gives the ending date; column 5 gives the ending time; and column 6 gives the preceding and/or associated interplanetary feature. In column 6, CIR stands for CIR magnetic storm preceding HILDCAA; CIR? stands for the possibility of CIR magnetic storm preceding HILDCAA; ICME stands for ICME magnetic storm preceding HILDCAA; ICME? stands for the possibility of ICME magnetic storm preceding HILDCAA; ICME+CIR stands for ICME and CIR magnetic storm preceding HILDCAA; ICME/CIR stands for ICME followed by CIR magnetic storm preceding HILDCAA; CIR/ICME stands for CIR followed by ICME magnetic storm preceding HILDCAA; CIR/ICME? stands for the possibility of CIR followed by ICME magnetic storm preceding HILDCAA; and ? indicates that any interplanetary feature was observed.
3 Results
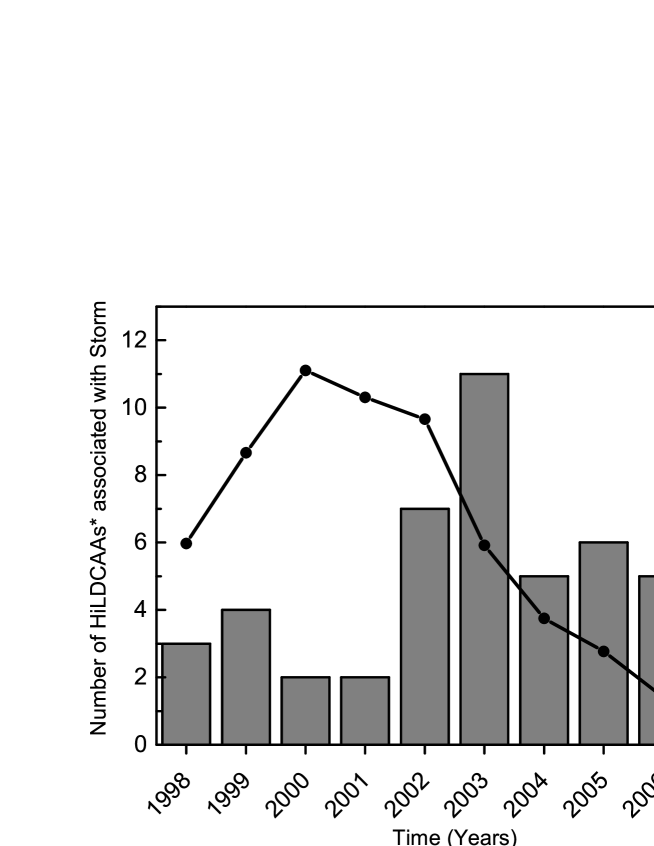
Figure 3 shows the HILDCAA* events distribution, and the sunspot number variation over the years 1998–2007. Two peaks in the HILDCAA* distribution are observed in this figure. One: around the maximum of the sunspot cycle, and another: very intense in the descending phase of the cycle. The same kind of feature was observed by Hajra et al. (2013). From 135 HILDCAA* events occurring between 1998 and 2007, 47 followed the storm main phase and occurred during the recovery phase. Figure 4 shows the number of HILDCAA* events which followed geomagnetic storms between the years of 1998 and 2007.
In addition, these 47 storm-associated HILDCAA events are highlighted in gray color in Table LABEL:grid_mlmmh. The majority (75% – CIR (24 events), CIR? (4 events), ICME/CIR (3 events), CIR/ICME (3 events) and CIR+ICME (1 event)) of these storm-associated HILDCAA* events are associated with HSS. Approximately 10% of the cases (5 events) occurred after the passage of ICMEs. The remaining 15% could not be related to any interplanetary feature. Hajra et al. (2013) observed that 94% of storm-associated HILDCAA events were typically HSS-related, and consequently, associated with large interplanetary magnetic field (IMF) Bz variances. As discussed by Hajra et al. (2013), the small percentage of ICME-related HILDCAA events can be explained due to the small, steady southward Bz intervals or low-frequency fluctuations during the passage of these interplanetary features.
3.1 Statistical analysis
For each HILDCAA* event obtained for the period of 1998–2007, the following solar wind parameters are calculated using a statistical approach: proton density; proton temperature; solar wind speed and its components (Vx, Vy, Vz); magnetic field components (Bx, By, Bz); pressure and plasma beta; as well as the auroral geomagnetic indices: AE, AU, AL; and the low- to middle-latitude geomagnetic index: Dst. Histograms will be present next for all the aforementioned parameters calculated for ten consecutive years (1998–2007).
3.1.1 AE index
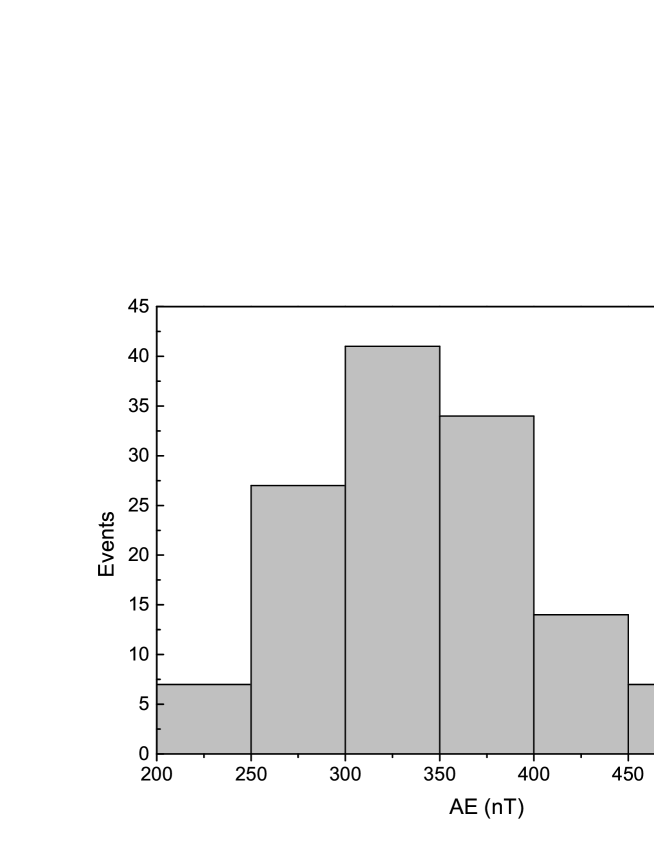
Figure 5 shows the distribution of AE index mean values for all 135 HILDCAAs* during 1998–2007. The average values for these events are above 213.75 nT for the whole period, and often they reach values above the double of the average value. The intensity range of the AE average is from a minimum of 224 nT to a maximum of 545 nT.
The majority of the AE average values occurs between 300-400 nT. In the year of 2003, there are 28 events, almost one every 10 days, and in this year, the AE index has an extremely high average of 328.26 nT, nearly 100 nT higher than the other years of the cycle 23, see Table 2. Coronal holes, as well HSSs and CIRs, are a possible source for explain this unsual average value.
3.1.2 AU/AL indices
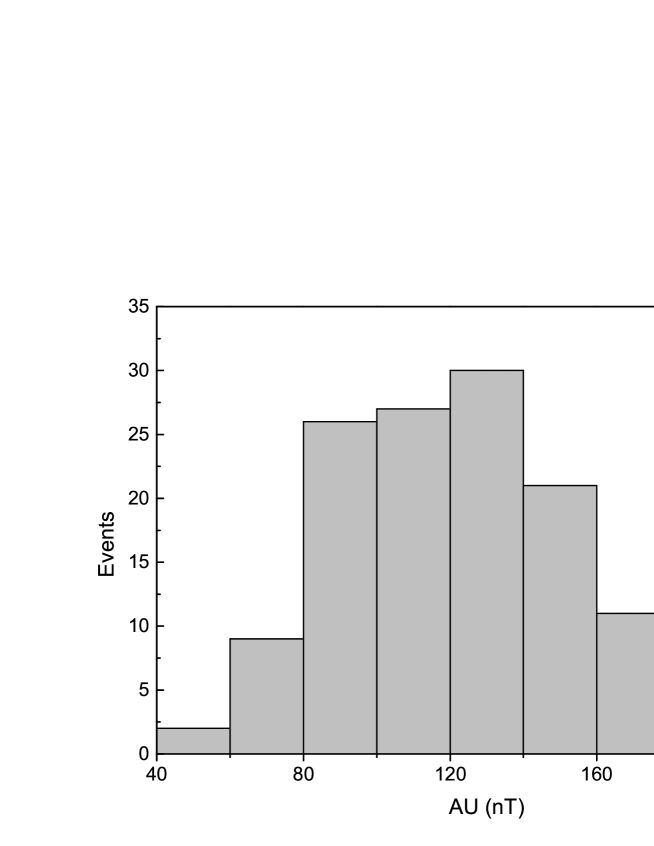
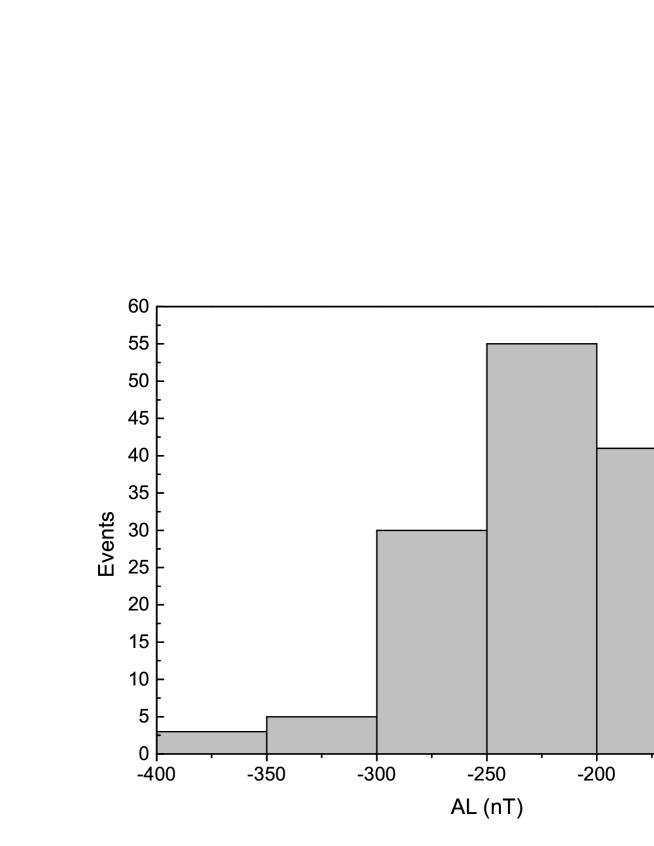
Figure 6 shows the histograms of the average values of the AU and AL indices for 135 HILDCAA* events. For the AU index, we verify a minimum average of 51 nT and a maximum average of 214 nT.
In relation to the AL index during the HILDCAA* events, we verify a minimum average of -393 nT, and a maximum average of -146 nT. The largest number of events presents mean values of AL index between -250 to -150 nT.
3.1.3 Solar wind proton density
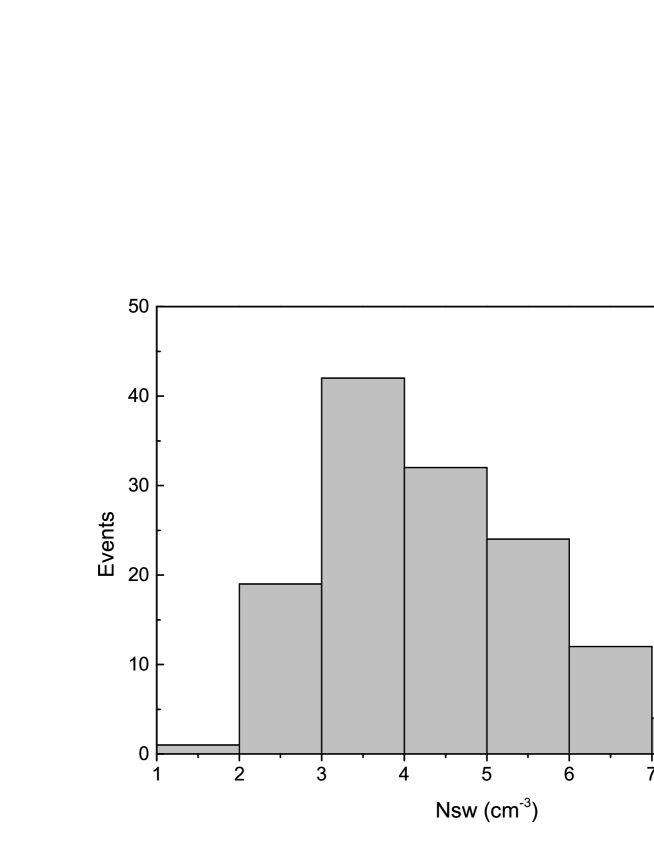
The average values of the solar wind proton density vary 1.9 to 8.8 , as noticed in Figure 7. Most of the events shows a density average lower than 6.1 particles per . This kind of results may be related to HSSs.
3.1.4 Solar wind proton temperature
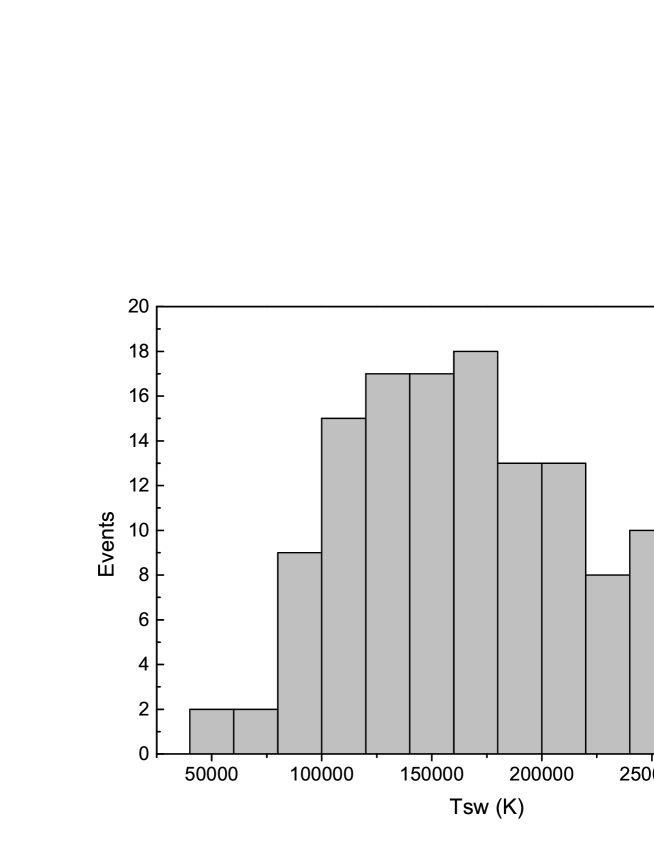
The average values of the solar wind proton temperature presented a minimum of 48379 K and a maximum of 298180 K, see Figure 8. About 85% of the events has average values above 125000 K. Once more, this kind of results may be related to HSSs.
3.1.5 Solar wind speed
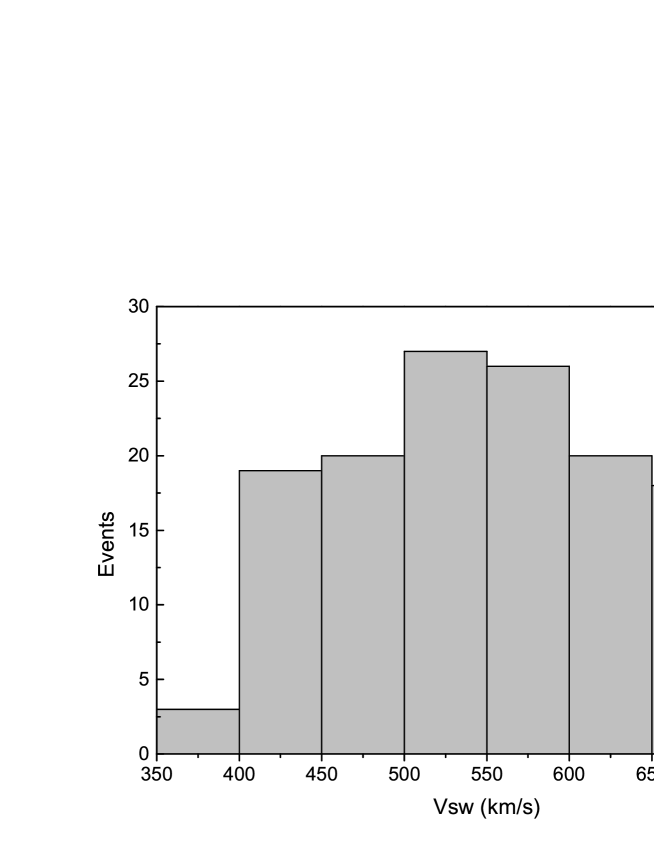
Among the 135 events, a minimum average value of the solar wind speed is 369 km/s and a maximum average is 715 km/s, as shown in Figure 9. The 85% of the events has average values higher than whole period average which is 450 km/s. If we compare to the histogram of the solar wind speed derived from 18 months of ISSE-3 observations (see Russell, 2001, page 77, Figure 5) to the solar wind speed histogram in Figure 9, we verify that the distribution of velocity during the occurrence of HILDCAA* events is shifted with respect to the most probable values, and they are above the level of of the velocity quartiles.
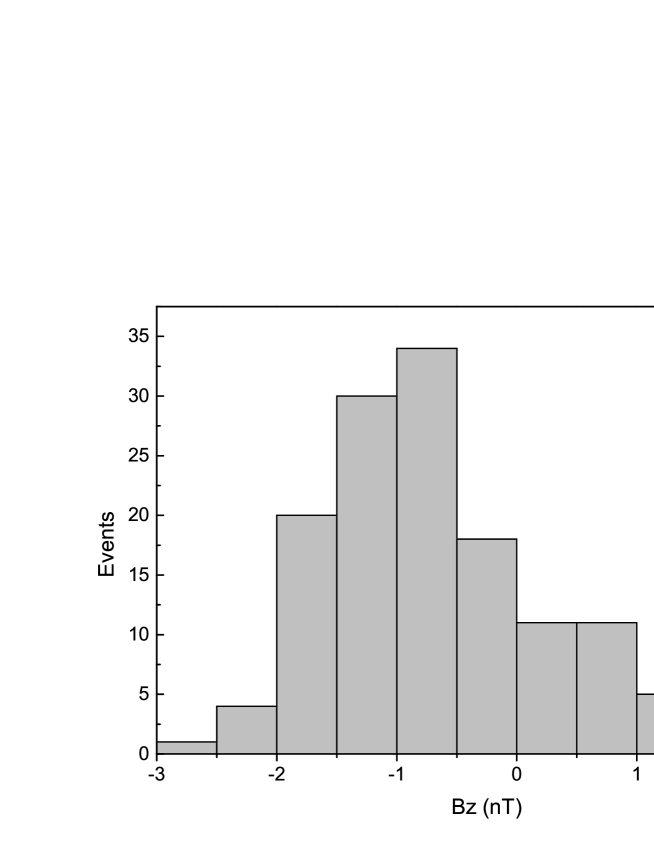
3.1.6 Bz component of the interplanetary magnetic field
The Bz component of the interplanetary magnetic field shows mean values between -2.8 nT and 2.0 nT, see Figure 10. The distribution of Bz shows an almost a Gaussian distribution with a slight tendency to the left different from the distribution of Bz around zero observed by (Russell, 2001, page 82, Figure 23). However, when these values is compared to the Bz values during geomagnetic storms, we observe that the Bz during HILDCAAs* has smaller values than the average Bz values during storms, which is -3 nT for at least 1 hour (Gonzalez et al., 1994).
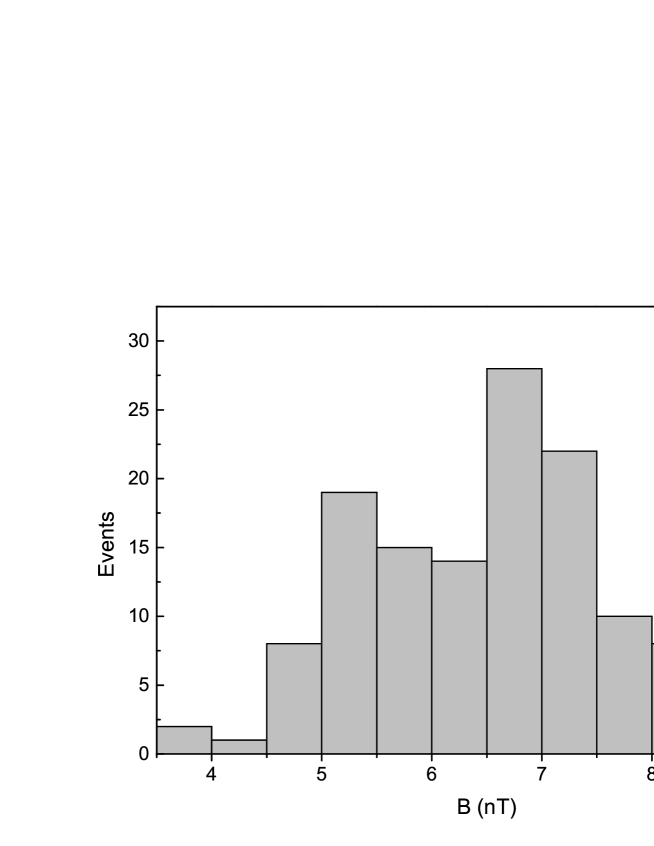
3.1.7 Magnitude of solar wind magnetic field
The distribution of average values for the interplanetary magnetic field magnitude B is shown in Figure 11. The occurrence interval of average is between 3.8 nT and 9.4 nT. However, the HILDCAA* events occur predominately in the range of 5 to 8 nT.
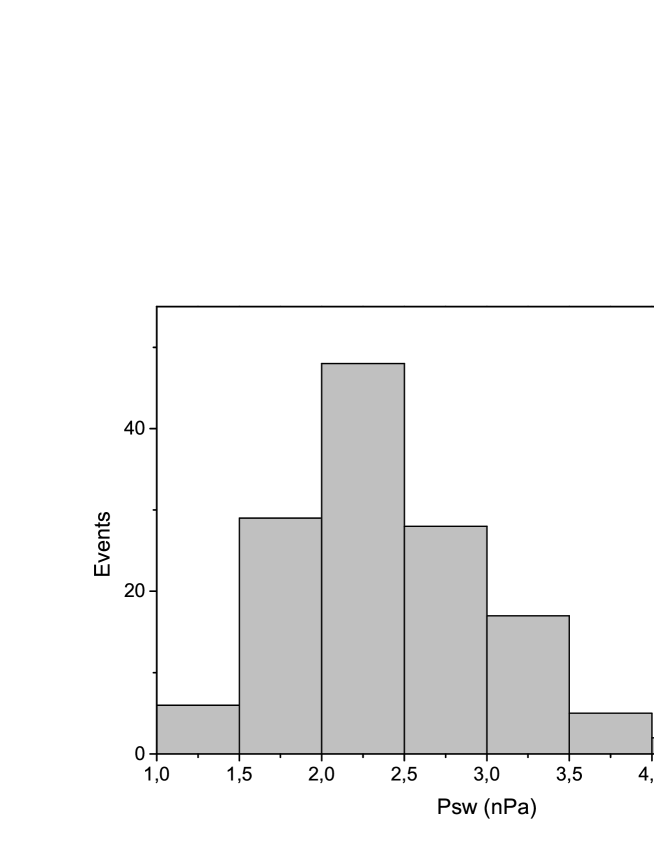
3.1.8 Solar wind dynamic pressure
In the years 1998–2007, during the occurrence of the HILDCAA* events, the dynamic pressure has values between 1.2 nPa and 4.5 nPa, as shown in the Figure 12. This histogram illustrates that the interval with the highest frequency of occurrences is between 1.5 to 3 nPa. The expected value of the solar wind dynamic pressure at Earth’s magnetosphere is about 2.6 nPa at any time of the solar cycle (Kivelson and Russell, 1995).
The dynamic pressure is similar to high-speed solar wind emerging from the coronal holes, and of low speed from streamer belt, which does not differ by more than . Using only this kind of statistical solar wind dynamic pressure analysis, it is not possible to discern any stream structure. This means that both types of wind have the same dynamic pressure in any obstacle, for example, the planetary magnetospheres (Schwenn, 2006). Therefore, there are no significant differences in the distributions of the dynamic pressure during the occurrence of HILDCAA* events.
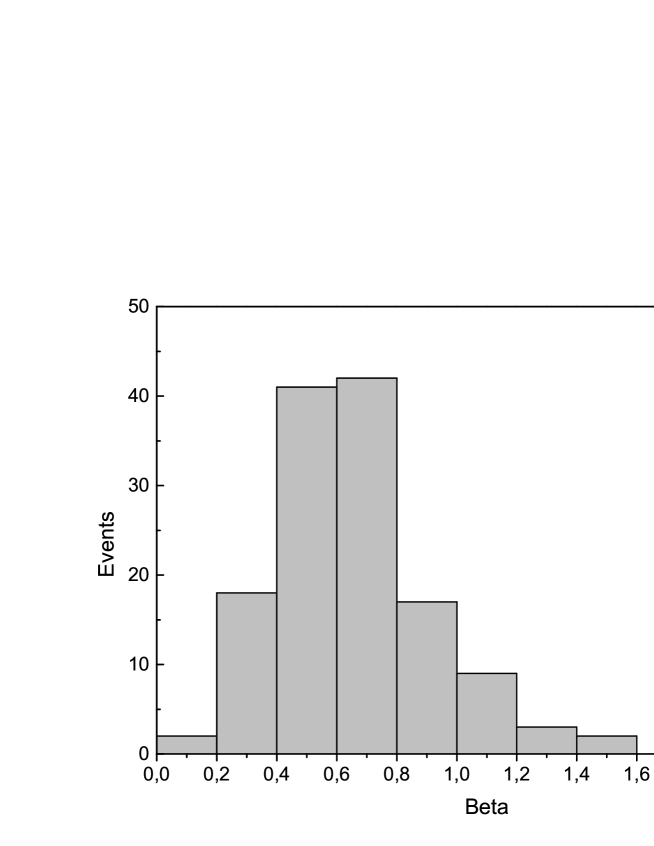
3.1.9 Solar wind plasma beta
The parameter is the ratio of thermal pressure to magnetic pressure in the plasma. Fast streams have values closer to one, while other structures, such as magnetic clouds or CMEs, have the beta value much smaller than one. Plasma values are between 0.15 and 2.08, see Figure 13. However, the values are usually above 0.4 during the HILDCAA* events.
4 Summary and discussions
The distribution of HILDCAA* events throughout the solar cycle follows a distribution similar to that observed in the distribution of low-latitudes coronal holes during solar cycle 21, as found by (Gonzalez et al., 1996, see Figure 2.6). The existence of two peaks is also observed here. One: less intense around the solar maximum, and another: more intense in the descending phase.
The time interval of the all analyzed HILDCAA* events varies approximately from 2 days to two weeks. During the descending phase of the solar cycle, there are an increase of HILDCAA* occurrences, and also, they persisted for longer time (see Table LABEL:grid_mlmmh). The level of auroral activity, measured by the AE index, has a higher value during this phase, possibly due to the presence of long-term fast streams in the solar wind that originate from coronal holes. Peak values of AE index between 1000 and 2852 nT are found among all the 135 events, in the period from 1998 to 2007. The average values observed are between 224 and 545 nT.
Table 3 shows the mean values,with their corresponding standard deviations, for the AE, AU, AL, and Dst indices, density and temperature of the solar wind protons, solar wind speed, Bz component and intensity of the IMF, the dynamic pressure, and beta factor among all the 135 HILDCAA* events. Ahn and Moon (2003) analyzed the variations of the AU, AL, AE indices with an hourly time series from 1966 to 1987. They found average values for AU, AL, AE of 84.6 nT, -135.1 nT, and 213.7 nT (average for all period: both quiet and disturbed), respectively. For AL index, considering only disturbed period, AL -135 nT, they found an average of -295.9 nT. The comparison between the values from Table 3 and values found by Ahn and Moon (2003) shows that AU during HILDCAA* events presents higher values, indicating that the eastward auroral electrojet, from which AU is derived, and it has higher disturbances during the occurrence of HILDCAA* events. The mean value of AL for HILDCAAs* is higher than during quiet periods, and lower than during perturbed periods.
Petrukovich and Rusanov (2005), who studied the dependence of the AL index in relation to various parameters of the solar wind and IMF, found that the variables with most influence are in order of importance: (1) electric field (VBs) and speed through viscous interaction; (2) By component, solar wind density (AL sensitive to low dynamic pressure), and intensity of IMF fluctuations. Here, both auroral electrojets, AU/AL, are disturbed during the occurrence of HILDCAA* events. This suggests that the two indices are modulated by the same mechanism, possibly by the electric field (Ahn et al., 2000; Ahn and Park, 2008).
The mean values of AE (348.1 nT), AU (123.9 nT), and AL (-224.2 nT) during HILDCAA* events reached relatively high levels if compared with a quiet period (with AE 50 nT), and with their historical average values of 213.7 nT, 84.6 nT, and -135.1 nT, respectively (Ahn and Moon, 2003). The AU and AL indices have distributions similar to AE indicating that during HILDCAA* events both are energized. But it has been shown by Rostoker (1972); Baumjohann (1983); Kamide and Kokubun (1996) that the nature of eastward auroral electrojet (described by the AU) is quite different from the westward auroral electrojet (described by the AL). The AE index provides the sum of the maximum current density at two points that are also distant in local time. This sum has no physical meaning.
The parameters in the interplanetary medium during HILDCAA* events with highest average values are solar wind speed (547.1 km/s) and temperature (170976.3 K). Other parameters showed no significant changes, for example B (6.6 nT) and dynamic pressure (2.4 nPa). The Bz component has a negative average value (-0.70 nT). However, the expected value is zero. Therefore, the preferred direction for this component during HILDCAA* events is southward. Remembering that the magnetic reconnection occurs between the southward interplanetary magnetic field component and the geomagnetic field causing greater injection of energy into the magnetosphere (shown by Guarnieri (2005)).
The plasma beta is useful to identify solar wind structures such as magnetic clouds, shocks, and high-speed solar-wind streams, and it presents a relatively high average value of 0.66. Comparing this value to the values related to different structures in the interplanetary medium, the plasma beta is associated to high-speed solar-wind streams when its values are close to or larger than one. Other structures, such as magnetic clouds have a plasma beta values smaller than one. This analysis indicates that most events are associated to high-speed streams flowing from coronal holes. In many cases, these high speed streams are embedded into Alfvénic fluctuations covering a wide frequency bandwidth. The solar wind Alfvénicity has already been indicated by several authors as a possible cause of particle penetration, and particle precipitation (Tsurutani and Gonzalez, 1987; Tsurutani et al., 1995; Tsurutani and Gonzalez, 1997; Guarnieri, 2005).
The distributions of the parameters related to the HILDCAA* events reveals that only 15 () of 135 events had average speeds higher than 650 km/s (see Figure 9). The histogram in Figure 7 shows that of events had an average density smaller than the average () from 1998 to 2007. Therefore, a large compression from the solar wind to the magnetosphere is not observed for most of the events as seen by the low values of the dynamic pressure calculated for all events. However, it did not exceed 6 nPA, as shown in Figure 12. For most HILDCAA* events, the average Bz component of the interplanetary magnetic field has mostly negative values (Bz is south) and a high average speed. Thus, the electric field Ey given by VBs has a component resulting in the dawn to dusk direction. This field configuration describes the energy transfer mechanism of the solar wind into the magnetosphere by magnetic reconnection, which is the most efficient mechanism to transfer energy (Gonzalez et al., 1994).
For a better understanding of results for the HILDCAA* events, we compare them to other periods in different conditions to have a reference between solar wind variations, and their seeding structures in the interplanetary medium.
As discussed by Schwenn (2006), there are two basic types of solar wind: slow wind and fast wind. These two kinds of solar wind differ markedly in their main properties, i.e., in the location and the magnetic topology of their sources in the solar corona, and probably in the acceleration mechanism. Some characteristic values of the slow wind are: Vsw between 250–400 km/s, Nsw 10.7 , Tsw , and their sources are found in the streamer belt in the solar corona. The characteristic values of the fast solar wind are: Vsw between 400–800 km/s, Nsw 3.0 , Tsw , and their sources are in the coronal holes.
According to Richardson et al. (2000), the Earth passes about of its time in solar wind structures related to CMEs at solar minimum phase, and in solar wind structures related to corotating streams. At the solar maximum phase, the Earth passes about of its time in solar wind structures related to CMEs, and in structures related to corotating streams. Thus, the Earth spends most of its time in solar wind structures related to fast streams.
Cane and Richardson (2003) studied 214 interplanetary coronal mass ejections (ICME), which occurred between 1996-2002, and they found average values of 454 6 km/s for velocity and of 9.9 0.3 nT for Bo. The mean speed of these events is less than the average of the HILDCAA* events. In addition, the average value of the interplanetary magnetic field is higher than the values related to HILDCAA* events. Thus, it can be inferred that HILDCAA* events are not associated with ICMEs.
Moreover, Gonzalez et al. (2011) found average values for Dst peak and some interplanetary parameters associated with superstorms. These values were Dst (-324.367.3 nT), Vsw (799.1 160.6 km/s), Bo (41.7 10.8 nT), Bz (34.3 13.5 nT), Ey (23.5 11.6 mV/m), Nsw (24.7 13.7 ), and Psw (25.7 14.8 nPa). As can be seen, all parameters reached high values during superstorms.
The results presented and compared above elucidate that some parameters of magnetic field and of plasma of the interplanetary medium related to HILDCAA* events are intermediate values between periods of low geomagnetic activity (background values) and high geomagnetic activity values (storm values), as summarized in Table 4. Therefore with the parameters of plasma and IMF on hands, it is possible to determine which kind of geomagnetic event will occur.
5 acknowledgments
This research was supported by CNPq and FAPESP: A. Prestes FAPESP - (2009/02907-8) and CNPq (301441/2013-8). V. Klausner wishes to thank CNPq for the financial support for her postdoctoral research (grants 165873/2015-9). Furthermore, the authors would like to thank the WDC-Kyoto and OMNIWeb for the data sets used in this work. The AE and Dst indexes were obtained from the World Data Center for Geomagnetism - Kyoto (http://wdc.kugi.kyoto-u.ac.jp/index.html). The ACE parameters are available through the National Space Science Data Center (OMNIWeb):http://omniweb.gsfc.nasa.gov/form/dx1.html.
References
- Ahn et al. (2000) Ahn, B.H.; Kroehl, H. W.; Kamide, Y.; Kihn, E. A. (2000), Seasonal and solar cycle variations of the auroral electrojet indices, Journal of Atmospheric and Solar-Terrestrial Physics, 62 (14), 1301–1310.
- Ahn and Moon (2003) Ahn, B.H.; Moon, G.H. (2003), Seasonal and Universal Time Variations of the AU, AL and Dst Indices, Journal of the Korean Astronomical Society, 36 (S1), S93–S99.
- Ahn and Park (2008) Ahn, B.H.; Park, Y.K. (2008), Response of the Geomagnetic Activity Indices to the Solar Wind Parameters, Journal Astron. Space Science, 25 (2), 129–138.
- Baumjohann (1983) Baumjohann, W. (1983), Ionospheric and field-aligned current systems in the auroral zone, Advances in Space Research., 2, 55–62.
- Belcher and Leverett (1971) Belcher, J. W.; and D. Leverett (1971), Large-amplitude Alfven waves in the interplanetary medium, 2, Journal of Geophysical Research, 76 (16), 3534–3563.
- Burlaga (1988) Burlaga, L. F. (1988), Magnetic clouds and force-free fields with constant alpha, Journal of Geophysical Research, 93 (7), 7217–7224.
- Cane and Richardson (2003) Cane H. V.; Richardson I. G. (2003), Interplanetary coronal mass ejections in the near-Earth solar wind during 1996–2002, Journal of Geophysical Research, 108 (A4), 6.1–6.13.
- Dungey (1961) Dungey, J. W. (1961), Interplanetary Magnetic Field and the Auroral Zones, Phys. Rev. Lett. 6, 47.
- Echer et al. (2008) Echer, E.; Gonzalez, W. D.; Tsurutani, B. T.; and Gonzalez, A. L. C. (2008), Interplanetary conditions causing intense geomagnetic storms (Dst- 100 nT) during solar cycle 23 (1996–2006), Journal of Geophysical Research: Space Physics, 113 (A5), 2156–2202.
- Ergun et al. (2008) Ergun, R. E., Andersson, L., Main, D., Su, Y.-J., Newman, D. L., Goldman, M. V., Carlson, C. W., Hull, A. J., McFadden, J. P., and Mozer, F. S. (2004), Auroral particle acceleration by strong double layers: The upward current region, Journal of Geophysical Research: Space Physics, 109 (A12), A12220.
- Gonzalez et al. (1992) Gonzalez, W. D.; Clua de Gonzalez, A. L.; Tsurutani, B. T. (1992), Interplanetary magnetosphere coupling during intense geomagnetic storms at solar maximum, Geofísica Internacional, 31 (1), 11–18.
- Gonzalez et al. (1994) Gonzalez, W. D., Joselyn, J. A., Kamide, Y., Kroehl, H. W., Rostoker, G., Tsurutani, B. T., Vasyliunas, V. M. (1994), What is a geomagnetic storm?, Journal of Geophysical Research, 99, 5771–5792.
- Gonzalez et al. (1996) Gonzalez, W. D., Clua de Gonzalez, A. L., Sobral, J. H. A., Dal Lago, A., and Vieira, L. E. (1996), Solar and interplanetary causes of very intense geomagnetic storms, J. Atm. Sol. Phys., 63, 403–412.
- Gonzalez et al. (2011) Gonzalez, W. D., Echer, E., Tsurutani, B. T., Clua de Gonzalez, A. L., and Dal Lago, A. (2011), Interplanetary origin of intense, superintense and extreme geomagnetic storms, Space Sci. Rev., 158, 69–89, doi:10.1007/s11214-010-9715-2.
- Gosling (1993) Gosling, J. T. (1993), Coronal mass ejections: The link between solar and geomagnetic activity, Physics of Fluids B, 5 (7), 2638–2645.
- Guarnieri (2005) Guarnieri, F. L. (2005), The Nature of Auroras During High-Intensity Long-Duration Continuous AE Activity (HILDCAA) Events: 1998 to 2001, American Geophysical Union, 235–243.
- Guarnieri et al. (2006) Guarnieri, F. L., Tsurutani, B. T., Echer, E., Gonzalez, W. D. (2006), Geomagnetic Activity and Auroras Caused by High-Speed Streams: a Review, Advances in Geosciences, 8: Solar Terrestrial (ST) 8, 91–102.
- Hajra et al. (2013) Hajra, R., Echer, E., Tsurutani, B. T., and Gonzalez, W. D. (2013), Solar cycle dependence of High-Intensity Long-Duration Continuous AE Activity (HILDCAA) events, relativistic electron predictors?, Journal of Geophysical Research: Space Physics, 118 (9), 5626–5638.
- Hsiao et al. (1991) Hsiao, G. C., E. P. Stephan, and W. L. Wendland (1991), On the Dirichlet problem in elasticity for a domain exterior to an arc, J. Comput. Appl. Math., 34(1), 1–19.
- Kamide and Kokubun (1996) Kamide. Y.; Kokubun, S. (1996), Two component auroral electrojet: Importance for substorm studies, Journal of Geophysical Research, 101, 13027.
- Kivelson and Russell (1995) Kivelson, M. G., and Russell, C. T. (1995), Introduction to Space Physics.
- Mayaud (1980) Mayaud, P. N. (1980), Derivation, Meaning, and Use of Geomagnetic Indices, Washington DC, American Geophysical Union Geophysical Monograph Series 22, 607.
- Parks (1991) Parks, G. K. (1991), Physics of space plasmas - an introduction.
- Petrukovich and Rusanov (2005) Petrukovich, A.A.; Rusanov, A.A. (2005), AL index dependence on the solar wind input revisited, Advances in Space Research, 36, 2440–2444.
- Prestes et al. (2016) Prestes, A., V. Klausner, and A. O. Gonzalez (2016), Large number of HILDCAA* occurrences and an exceptionally high AE index average during 2003, Submitted to Journal of Geophysical Research, under revision 2016JA023406R (Editor - Michael Liemohn).
- Richardson et al. (2000) Richardson, I. G., Cliver, E. W., and Cane, H. V. (2000), Sources of geomagnetic activity over the solar cycle: Relative importance of coronal mass ejections, high-speed streams, and slow solar wind, Journal of Geophysical Research, 105, 18203.
- Richardson and Cane (2012) Richardson, I. G., and Cane, H. V. (2012), Solar wind drivers of geomagnetic storms during more than four solar cycles, J. Space Weather Space Clim., 2, A01.
- Rostoker (1972) Rostoker, G. (1972), Geomagnetic indices, Reviews of Geophysics and Space Physics, 10 (4), 935–990.
- Russell (2000) Russell, C. (2000), The solar wind interaction with the Earth’s magnetosphere: a tutorial.
- Russell (2001) Russell, C. T. (2001), Solar wind and interplanetary magnetic field: A tutorial, Washington DC American Geophysical Union Geophysical Monograph Series 125, 73–89.
- Schwenn (2006) Schwenn, R. (2006), Solar wind sources and their variations over the solar cycle, Sp. Sc. Rev., 124, 51–76.
- Sheeley et al. (1976) Sheeley, N. R., Jr., J. W. Harvey, and W. C. Feldman (1976), Coronal holes, solar wind streams and recurrent geomagnetic disturbances: 1973-1976, Sol. Phys., 49, 271.
- Sheeley et al. (1977) Sheeley, Jr., N.R., J.S. Asbridge, S.J. Bame, and J.W. Harvey (1977), A pictorial comparison of interplanetary magnetic field polarity, solar wind speed, and geomagnetic disturbance index during the sunspot cycle, Solar Phys., 52, 485.
- Smith and Wolfe (1976) Smith, E. J., and J. H. Wolfe (1976), Observations of interaction regions and corotating shocks between one and 5 AU-PIONEER-10 and PIONEER-11, Geophys. Res. Lett., 3, 137–140, doi:10.1029/GL003i003p00137.
- Shugai et al. (2009) Shugai, Y., Veselovsky, I., Trichtchenko, L. (2009), Studying correlations between the coronal hole area, solar wind velocity, and local magnetic indices in the Canadian region during the decline phase of cycle 23, Geomagnetism and Aeronomy, 49 (4), 415–424.
- Suess and Tsurutani (1998) Suess, S. T., and Tsurutani, B. T. (Eds.) (1998), From the Sun, Auroras, Magnetic Storms, Solar Flares, Cosmic Rays.
- Tsurutani and Gonzalez (1987) Tsurutani, B. T., and Gonzalez, W. D. (1987), The cause of high-intensity long-duration continuous AE activity (HILDCAAS) - Interplanetary Alfven wave trains, Planetary and Space Science 35, 405–412.
- Tsurutani et al. (1988) Tsurutani, B. T., Smith, E. J., Gonzalez, W. D., Tang, F., and Akasofu, S. I. (1988), Origin of interplanetary southward magnetic fields responsible for major magnetic storms near solar maximum (1978-1979), Journal of Geophysical Research, 93, 8519–8531.
- Tsurutani et al. (1995) Tsurutani, B. T., Gonzalez, W. D., Gonzalez, A. L. C., Tang, F., Arballo, J. K. and Okada, M. (1995), Interplanetary origin of geomagnetic activity in the declining phase of the solar cycle, Journal of Geophysical Research: Space Physics, 100 (A11), 2156–2202.
- Tsurutani and Gonzalez (1997) Tsurutani, B. T. and Gonzalez, W. D. (1997), The Interplanetary Causes of Magnetic Storms: A Review, in Magnetic Storms (eds B. T. Tsurutani, W. D. Gonzalez, Y. Kamide and J. K. Arballo), American Geophysical Union, Washington, D. C.. doi: 10.1029/GM098p0077
- Tsurutani et al. (2004) Tsurutani, B. T., Gonzalez, W. D., Guarnieri, F., Kamide, Y., Zhou, X., and Arballo, J. K. (2004), Are high-intensity long-duration continuous AE activity (HILDCAA) events substorm expansion events?, Journal of Atmospheric and Solar-Terrestrial Physics 66, 167–176.
- Tsurutani et al. (2006) Tsurutani, B. T., Gonzalez, W. D., Gonzalez, A. L. C., Guarnieri, F. L., Gopalswamy, N., Grande, M., Kamide, Y., Kasahara, Y., Lu, G., Mann, I., McPherron, R., Soraas, F. and Vasyliunas, V. (2006), Corotating solar wind streams and recurrent geomagnetic activity: A review, Journal of Geophysical Research: Space Physics, 111 (A7), A07S01.
- Vennerstroem (2001) Vennerstroem, S. (2001), Interplanetary sources of magnetic storms: A statistical study, Journal of Geophysical Research 106, 29175–29184.
| EventYear | Start | UT | Stop | UT | Length (min) | Mechanism |
|---|---|---|---|---|---|---|
| 24 Apr | 12:00 | 26 Apr | 13:00 | 2940 | CIR | |
| 26 Apr | 21:00 | 29 Apr | 13:44 | 3884 | ? | |
| 10 May | 05:32 | 13 May | 02:24 | 4132 | ? | |
| 20 Jun | 03:16 | 23 Jun | 08:50 | 4654 | CIR | |
| 03 Jul | 20:00 | 06 Jul | 17:20 | 4160 | CIR | |
| 22 Jul | 20:56 | 25 Jul | 17:36 | 4120 | CIR | |
| 28 Aug | 22:45 | 01 Sep | 05:54 | 4749 | ICME | |
| 22 Sep | 19:23 | 24 Sep | 23:59 | 3156 | ICME | |
| 22 Oct | 01:13 | 25 Oct | 19:01 | 5388 | ICME | |
| 02 Mar | 19:27 | 06 Mar | 02:14 | 4727 | CIR | |
| 13 Mar | 08:34 | 15 Mar | 23:38 | 3785 | ? | |
| 29 Mar | 15:01 | 01 Apr | 13:34 | 4233 | CIR | |
| 03 Apr | 10:17 | 06 Apr | 01:50 | 3813 | ? | |
| 19 Apr | 02:04 | 21 Apr | 07:16 | 3192 | ? | |
| 27 Apr | 07:21 | 04 May | 03:37 | 9856 | CIR | |
| 30 Jun | 19:54 | 03 Jul | 23:23 | 4529 | ICME+CIR | |
| 15 Aug | 22:37 | 20 Aug | 01:59 | 5962 | CIR | |
| 29 Aug | 08:41 | 03 Sep | 08:17 | 7176 | ? | |
| 10 Oct | 23:01 | 18 Oct | 07:57 | 10615 | CIR | |
| 26 Oct | 04:29 | 28 Oct | 09:55 | 3206 | CIR | |
| 23 Nov | 00:54 | 25 Nov | 02:49 | 2995 | CIR+ICME | |
| 03 Dec | 01:57 | 10 Dec | 07:25 | 10408 | CIR | |
| 01 Jan | 04:00 | 03 Jan | 20:46 | 3886 | CIR? | |
| 04 Jan | 05:46 | 07 Jan | 21:18 | 5252 | ? | |
| 27 Jan | 18:06 | 31 Jan | 23:01 | 6056 | CIR | |
| 05 Feb | 15:53 | 08 Feb | 22:16 | 4704 | CIR | |
| 24 Feb | 02:42 | 27 Feb | 21:37 | 5455 | ICME/CIR | |
| 06 Mar | 05:07 | 09 Mar | 01:03 | 4076 | ICME/CIR | |
| 30 Jul | 11:11 | 02 Aug | 12:42 | 4411 | CIR | |
| 04 Aug | 00:16 | 07 Aug | 13:24 | 5108 | ? | |
| 30 Aug | 20:39 | 01 Sep | 22:59 | 3021 | ? | |
| 06 Sep | 15:02 | 09 Sep | 00:18 | 3436 | ICME | |
| 06 Apr | 06:37 | 11 Apr | 12:30 | 7553 | ICME | |
| 10 May | 11:00 | 14 May | 08:47 | 5627 | CIR | |
| 09 Jun | 04:00 | 11 Jun | 05:49 | 2989 | CIR | |
| 15 Jul | 06:19 | 18 Jul | 08:57 | 4478 | CIR | |
| 21 Jul | 23:40 | 26 Jul | 13:56 | 6617 | CIR | |
| 02 Sep | 11:29 | 05 Sep | 03:32 | 3843 | CIR | |
| 27 Sep | 10:17 | 30 Sep | 15:57 | 4660 | ? | |
| 17 Nov | 00:22 | 20 Nov | 08:10 | 4788 | ? | |
| 11 Jan | 10:00 | 14 Jan | 23:11 | 5111 | CIR? | |
| 06 Feb | 11:00 | 09 Feb | 13:09 | 4449 | CIR | |
| 05 Mar | 00:41 | 07 Mar | 01:05 | 2904 | CIR/ICME | |
| 14 May | 13:00 | 17 May | 00:01 | 3542 | ? | |
| 08 Jun | 12:06 | 12 Jun | 05:25 | 5359 | CIR | |
| 22 Jul | 01:35 | 24 Jul | 11:58 | 3503 | CIR+ICME | |
| 24 Jul | 18:49 | 28 Jul | 06:12 | 5004 | CIR+ICME | |
| 13 Aug | 07:00 | 16 Aug | 17:19 | 4939 | ? | |
| 09 Oct | 01:01 | 13 Oct | 13:08 | 6487 | ICME/CIR | |
| 25 Oct | 21:00 | 29 Oct | 15:33 | 3992 | CIR | |
| 29 Oct | 20:30 | 01 Nov | 01:48 | 3198 | ? | |
| 04 Nov | 19:00 | 07 Nov | 20:52 | 4432 | CIR | |
| 27 Nov | 13:00 | 03 Dec | 05:20 | 8180 | CIR | |
| 26 Dec | 08:30 | 28 Dec | 18:25 | 3475 | CIR | |
| 19 Jan | 05:46 | 23 Jan | 05:38 | 5752 | CIR | |
| 23 Jan | 09:44 | 27 Jan | 02:19 | 5315 | ? | |
| 06 Feb | 05:22 | 11 Feb | 18:12 | 7970 | CIR | |
| 16 Feb | 05:24 | 21 Feb | 11:10 | 7546 | CIR/ICME | |
| 04 Mar | 10:00 | 07 Mar | 23:34 | 5134 | CIR | |
| 14 Mar | 03:01 | 19 Mar | 21:34 | 8313 | CIR | |
| 03 Apr | 14:11 | 06 Apr | 10:22 | 4091 | CIR? | |
| 15 Apr | 19:10 | 17 Apr | 21:06 | 2996 | CIR | |
| 20 Apr | 15:45 | 28 Apr | 14:31 | 11447 | ? | |
| 01 May | 09:00 | 04 May | 14:35 | 4655 | ? | |
| 05 May | 08:50 | 09 May | 08:00 | 5710 | CIR/ICME | |
| 10 May | 20:00 | 16 May | 14:23 | 8303 | ICME | |
| 22 May | 09:00 | 29 May | 11:27 | 10227 | CIR? | |
| 02 Jun | 17:00 | 12 Jun | 18:25 | 14485 | ICME/CIR | |
| 13 Jun | 18:58 | 16 Jun | 07:00 | 3602 | ICME/CIR | |
| 20 Jun | 04:53 | 06 Jul | 17:28 | 23795 | ICME/CIR | |
| 12 Jul | 20:00 | 15 Jul | 12:10 | 3850 | CIR | |
| 18 Jul | 16:56 | 21 Jul | 07:51 | 3775 | ? | |
| 27 Jul | 09:00 | 04 Aug | 10:46 | 11628 | CIR | |
| 07 Aug | 23:00 | 14 Aug | 11:09 | 9369 | CIR | |
| 21 Aug | 08:00 | 25 Aug | 18:19 | 6379 | CIR | |
| 10 Sep | 08:02 | 12 Sep | 17:39 | 3457 | CIR | |
| 18 Sep | 00:00 | 22 Sep | 20:02 | 5522 | ? | |
| 24 Sep | 09:00 | 27 Sep | 01:32 | 3872 | ? | |
| 15 Oct | 12:00 | 22 Oct | 18:35 | 10475 | CIR/ICME | |
| 01 Nov | 07:00 | 04 Nov | 06:16 | 4278 | ICME | |
| 09 Nov | 01:41 | 19 Nov | 18:46 | 15425 | ICME/CIR | |
| 07 Dec | 06:32 | 17 Dec | 06:36 | 14404 | CIR | |
| 01 Jan | 04:00 | 06 Jan | 11:11 | 3868 | CIR | |
| 12 Jan | 00:01 | 15 Jan | 05:31 | 3869 | ICME | |
| 15 Jan | 14:06 | 21 Jan | 23:58 | 3057 | CIR | |
| 29 Jan | 09:31 | 31 Jan | 12:28 | 5811 | ICME | |
| 12 Feb | 00:01 | 16 Feb | 00:52 | 3272 | CIR | |
| 28 Feb | 20:10 | 03 Mar | 02:42 | 4287 | ? | |
| 13 Mar | 06:05 | 16 Mar | 05:32 | 4446 | CIR | |
| 06 Apr | 08:00 | 09 Apr | 10:06 | 5445 | ICME+CIR | |
| 02 May | 17:57 | 06 May | 12:42 | 3764 | CIR | |
| 28 May | 08:21 | 31 May | 13:44 | 4644 | CIR | |
| 05 Jun | 10:18 | 10 Jun | 07:08 | 7010 | ? | |
| 20 Aug | 00:51 | 23 Aug | 09:43 | 4852 | ? | |
| 06 Sep | 05:43 | 08 Sep | 14:41 | 3418 | CIR | |
| 13 Sep | 20:04 | 18 Sep | 12:36 | 6753 | ICME | |
| 03 Oct | 05:29 | 05 Oct | 08:40 | 3071 | ? | |
| 12 Oct | 21:56 | 15 Oct | 21:10 | 4275 | CIR | |
| 27 Nov | 05:54 | 01 Dec | 12:00 | 6126 | CIR | |
| 06 Dec | 04:54 | 09 Dec | 01:23 | 4110 | ? | |
| 01 Jan | 19:07 | 06 Jan | 00:00 | 6053 | CIR? | |
| 29 Jan | 06:13 | 01 Feb | 00:56 | 4003 | CIR | |
| 07 Feb | 22:00 | 12 Feb | 05:24 | 6204 | CIR? | |
| 07 Mar | 02:00 | 10 Mar | 18:02 | 5282 | CIR | |
| 05 Apr | 09:00 | 07 Apr | 16:26 | 3326 | CIR | |
| 12 Apr | 07:00 | 16 Apr | 06:16 | 5716 | CIR | |
| 30 Apr | 03:01 | 04 May | 06:31 | 5970 | CIR | |
| 11 May | 06:55 | 13 May | 17:57 | 3542 | ? | |
| 28 Jul | 06:00 | 30 Jul | 09:35 | 4535 | CIR | |
| 05 Aug | 11:52 | 08 Aug | 15:04 | 4512 | CIR | |
| 02 Nov | 22:00 | 05 Nov | 17:12 | 4032 | CIR | |
| 12 Nov | 00:13 | 14 Nov | 22:57 | 4244 | ? | |
| 27 Dec | 15:13 | 30 Dec | 09:55 | 4002 | CIR | |
| 19 Feb | 15:40 | 22 Feb | 20:55 | 4635 | CIR | |
| 19 Mar | 01:24 | 22 Mar | 09:58 | 4834 | CIR | |
| 15 Apr | 00:00 | 17 Apr | 01:48 | 2988 | ICME | |
| 06 Jun | 20:00 | 11 Jun | 17:46 | 7066 | CIR | |
| 14 Jun | 21:47 | 17 Jun | 19:05 | 4158 | CIR | |
| 20 Aug | 15:00 | 22 Aug | 19:20 | 3140 | ICME | |
| 14 Oct | 02:00 | 16 Oct | 23:06 | 4146 | CIR | |
| 10 Nov | 08:00 | 12 Nov | 14:12 | 3252 | CIR | |
| 23 Nov | 16:00 | 27 Nov | 20:25 | 6025 | CIR | |
| 06 Dec | 13:00 | 09 Dec | 04:27 | 3807 | CIR/ICME | |
| 19 Dec | 23:29 | 24 Dec | 00:42 | 5833 | CIR | |
| 01 Jan | 23:03 | 04 Jan | 18:26 | 4043 | CIR | |
| 16 Jan | 09:39 | 20 Jan | 01:58 | 5299 | CIR/ICME? | |
| 29 Jan | 19:00 | 01 Feb | 00:49 | 3229 | CIR | |
| 27 Feb | 08:45 | 01 Mar | 17:07 | 3382 | CIR | |
| 01 Apr | 09:00 | 03 Apr | 11:15 | 3015 | CIR | |
| 27 Apr | 09:48 | 30 Apr | 16:59 | 4751 | CIR | |
| 23 May | 15:00 | 27 May | 20:18 | 6078 | ? | |
| 10 Aug | 07:39 | 12 Aug | 12:19 | 3160 | CIR | |
| 01 Sep | 16:31 | 03 Sep | 17:10 | 2919 | CIR | |
| 05 Sep | 00:21 | 07 Sep | 04:43 | 3142 | CIR | |
| 24 Nov | 07:30 | 26 Nov | 11:17 | 3107 | ? |
| Year | Average (nT) | Sd(nT) | HILDCAA* () |
|---|---|---|---|
| 1998 | 207.55 | 144.72 | 7.1 |
| 1999 | 218.52 | 137.73 | 14.2 |
| 2000 | 235.65 | 150.70 | 8.6 |
| 2001 | 202.84 | 141.98 | 7.7 |
| 2002 | 216.96 | 146.85 | 12.2 |
| 2003 | 328.26 | 175.83 | 42.2 |
| 2004 | 220.73 | 153.03 | 15.6 |
| 2005 | 225.24 | 160.05 | 11.7 |
| 2006 | 151.24 | 120.15 | 9.5 |
| 2007 | 130.40 | 102.26 | 8.0 |
| PARAMETERS | AVERAGE |
|---|---|
| AE (nT) | |
| AU (nT) | |
| AL (nT) | |
| Dst (nT) | |
| Density () | |
| Temperature (K) | |
| (km/s) | |
| Bz (nT) | |
| (nT) | |
| Pressure (nPa) | |
| Beta |
| Higher values during HILDCAA* | |||
|---|---|---|---|
| Background | HILDCAA* | High Activity (geomagnetic Storm) | |
| Tp(K) | |||
| V (km/s) | |||
| Beta | |||
| Intermediates | |||
| Bs (nT) | |||
| Bo (nT) | |||
| Smaller | |||
| Density () | |||