Effect of secondary electron emission on subnanosecond breakdown in high-voltage pulse discharge
Abstract
A subnanosecond breakdown in high-voltage pulse discharge is studied in experiment and in kinetic simulations for mid-high pressure in helium. It is shown that the characteristic time of the current growth can be controlled by the secondary electron emission. We test the influence of secondary electron yield on plasma parameters for three types of cathodes made from titanium, silicon carbide and CuAlMg-alloy. By changing the pulse voltage amplitude and gas pressure, the area of existence of subnanosecond breakdown is identified.
pacs:
52.80.Tn; 52.65.RrI Introduction
Recently serious attention is paid to the study of physical phenomena of subnanosecond current development in discharge plasma in super-high-electric fields at mid- and high-pressures. Practical interest to this type of discharges is related to promising prospects for the development of novel electrophysical devices 1 ; 2 . For example, low- and high-energy electron beam sources can be applied for laser excitation or modification of materials 3 ; 4 ; 5 ; 6 . They also can be used as radiation sources 7 ; 8 , including x-ray radiation 2 , high-pressure discharge pre-ionization devices 5 , high-voltage subnanosecond 1 ; 2 and picosecond pulse generation and commutation devices 9 . Nevertheless a complete model of discharge ignition and operation in super-high-electric fields (E/N104 Td) is still missing because of the lack of understanding of physics and elementary processes proceeding under high field conditions on subnanosecond time scale.
Experimental study of breakdown in high voltage pulse (HVP) discharges in helium were done in Refs.9 ; 10 . There the current exponential growth within a subnanosecond was registered in plasma sustained between two plane cathodes and an mesh-anode between them. Applying 20 kV voltage, the electron beams from the cathodes with the current density of 200 A/cm2 were generated. The current growth rate was 500 A/cm2ns.
The kinetic model of this HVP discharge was developed in Refs. Sch2014 ; Sch2015 ; Sch2016 . The model includes the inelastic and elastic scattering of electrons, ions and energetic atoms with background helium, as well as electron emission due to the photoemission and the bombardment of the cathode surface by electrons, ions and energetic atoms. The kinetic simulations with Particle-in-cell Monte Carlo collision (PIC MCC) method revealed unexpected scenario of the current development in the HVP discharge. Before the electron emission due to ions and energetic atoms bombardment was usually considered as a main process in developing the breakdown in abnormal glow discharge. However the subnanosecond breakdown in the HVP discharge can not be supported by only electron emission with heavy particle bombardment due to their inertia. The electron emission by photons radiated by atoms excited by electron impacts is also unable to maintain the current growth rate observed in the experiments. This type of resonant photons is trapped in plasma due to reabsorption. Thus some additional mechanism of electron emission was required to describe the subnanosecond breakdown.
In Refs. 9 ; Sch2014 , two additional processes participating in electron emission from the cathode such as the photoemission by photons with Doppler shifted (DS) frequency and secondary electron emission (SEE) have been proposed. The photons with DS frequency are produced in discharge plasma in the excitation reactions between the background atoms and ions or energetic atoms as well as in the excitation transfer reactions between excited atoms and energetic atoms. A feature of the DS photons is that they cross the discharge plasma without reabsorption. In contrast, the photons from the impact excitation by electrons remain in the plasma due to multiple reabsorption for the time much larger than the breakdown one. In PIC MCC simulations Sch2014 , the DS photons were shown to be very important during the initial stage of breakdown. The SEE becomes a major process in current growth at the final stage of breakdown when with decreasing voltage the electrons accumulated in plasma during discharge operation sweep over the cathodes.
In this paper, in the experiment and in PIC MCC simulations we study the breakdown development in the HVP discharge with three types of cathodes made from different materials. All these materials have enhanced secondary electron emission yield. Our purpose is to find a way to decrease the discharge breakdown time by testing different cathode materials and changing the gas pressure and voltage.
II Experimental setup
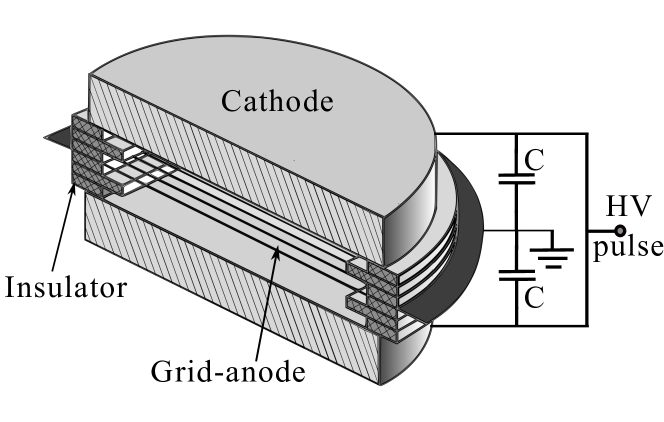
The breakdown in the high-voltage pulse discharge in helium is studied in the experimental cell shown in Fig. 1. Two round cathodes with the total area of 1.6 cm2 are placed 6 mm apart. A mesh-anode with the geometric transparency of 0.7 is placed between the cathodes. All electrodes are isolated with a set of plates made from glass. The pulse voltage is simultaneously applied to both cathodes and two oppositely directed electron beams are generated due to cathode emission. The voltage amplitude ranges from 4 kV to 12 kV. The gas pressure varies from 10 Torr to 35 Torr. The cathodes are symmetrically connected to the external low-inductance circuit and the mesh-anode is grounded. The pulse shape is registered with the low-inductive resistive divider with the rate about 20:1 using oscilloscope Tektronix DPO 70804C with a bandwidth of 8 GHz. The registration circuit and other experimental details were described in Ref.exp_d .
In the experiments, the cathodes made from titanium (Ti), silicon carbide (SiC), and CuAlMg alloy were tested. All these materials have large SEE coefficient , but the dependence of from the electron energy is very different. The as a function of an electron energy is shown in Fig. 2 for three types of cathode materials.
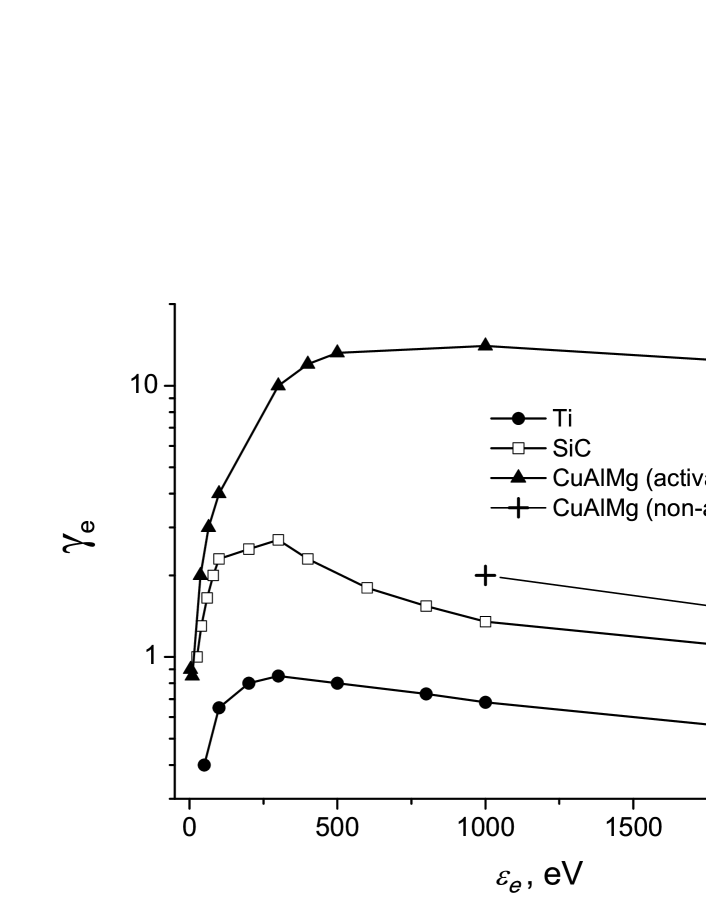
For titanium the varies from 0.4 to 0.9 in the range of from 50 eV to 2 keV, with maximum at 300 eV Ti . For SiC the has similar behavior for =20 eV-400 eV SiC , but it is nearly three times larger, = 0.9- 2.5. The for CuAlMg alloy can be very different depending on the treatment procedure and can be in activated or non-activated states Lep . The activation take places due to diffusion of Mg to the surface and its oxidation during annealing. So, the activated CuAlMg-alloy demonstrates up to 12.5 within the electron energy range from 500 eV to 2 keV. For non-activated CuAlMg alloy the is close to the SiC-.
The comparison of the measured current growth times in the discharge with different cathodes allows us to estimate the contribution of SEE in the electron avalanche development.
III Theoretical model
For accurate modeling of the HVP discharge for our experimental conditions the energy distribution functions should be calculated for charged particles and energetic neutrals. Not only electrons, but also ions and energetic atoms gain the energy sufficient for ionization and excitation reactions with background atoms. The distribution functions for electrons , ions and energetic atoms are calculated with solving the kinetic equations
| (1) |
| (2) |
| (3) |
where , , , , , , , are the velocities, masses and densities of electrons, ions and energetic atoms, respectively, is the electrical field, are the collisional integrals. For electrons the integral includes the elastic (momentum transfer) scattering, impact excitation and ionization with background atoms Alves ; Ralch . After ionization events electrons have the energy and angle distributions proposed in Opal ; 33 . For ions the integral describes the elastic collision Cramer , resonant charge exchange, or backward elastic scattering Cramer , ion impact excitation Okasaka and ionization Gilb . The scattering of ions with the background atoms leads to creation of the energetic atoms. The atoms Hef are removed from simulations if their energy becomes smaller than 1 eV after a collision. For energetic atoms, the integral includes elastic scattering Jordan , impact excitation Kempter , ionization Hayden and collisional excitation transfer (CET). These CET reactions, He∗+HeHe+He, provide a comparable input into the production of excited energetic atoms. The cross section for 11S - 21P excitation transfer in helium was calculated in Ref.Watanabe . In our simulations we took , cm2, where is the energy of energetic atoms measured in eV. In Fig. 3, the cross sections of collisions with the backgound atoms are shown for He+ and Hef.
The Poisson’s equation describes the potential and electrical field distributions
| (4) |
with the following boundary conditions. At the anode , and =0, -100 V, -200 V in different variants. At the cathode
| (5) |
| (6) |
where is the voltage amplitude, =10 ns is the time of increasing from 0 to , is the discharge current, and is the resistivity of external circuit.
In simulation we assume that the ions and energetic atoms passing the mesh-anode are disappeared with the probability =0.3, as in the experiment the transparency of the mesh is 0.7. As known from the experiment the mesh-anode is under floating negative potential, therefore a part of electrons is repelled from the mesh-anode. In simulations we found that the variation of from 0 to -200 V does not influence the breakdown development. Electrons, ions and energetic particles approaching the cathode make a contribution to the electron emission and are subtracted from further simulations. The Boltzmann equations (1)-(3) are solved with PIC MCC algorithm birdsall self-consistently with the Poisson’s equation (4). The time step for electrons is , which is much less than the characteristic times of the system, and , where is the plasma frequency and for our discharge conditions 1012s-1.
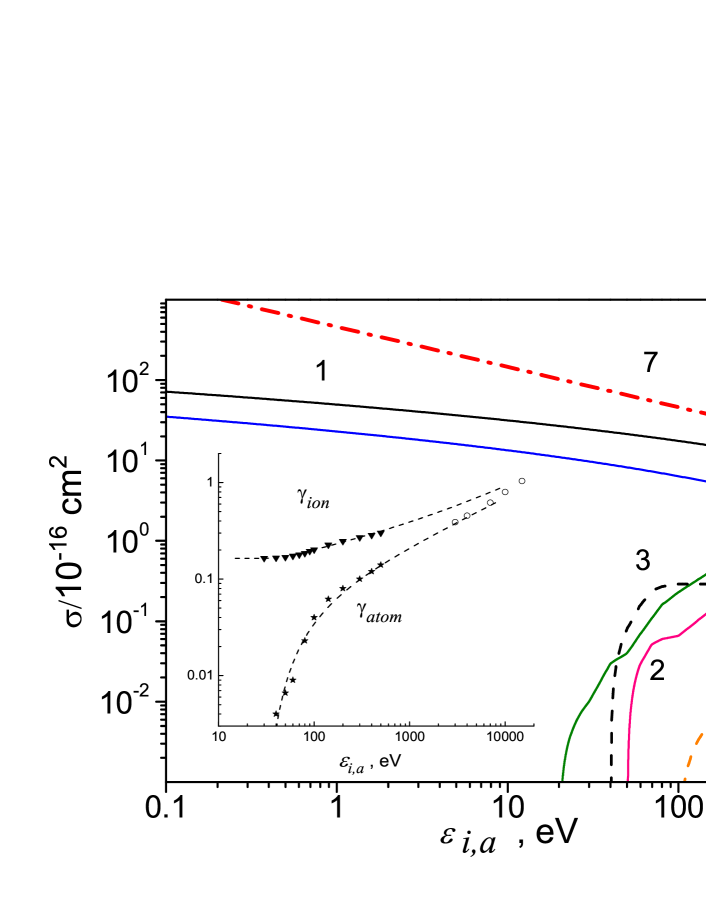
The electron emission is provided by DS photons, electrons, ions and energetic atoms fluxes impinging the cathodes surfaces. The electron yield for ions, energetic atoms shown in Fig. 3 (insert). For simulation of SEE emission we use the data shown in Fig. 2. In particular, for CuAlMg alloy the for activated state was used in calculations.
We assume that the resonant photons with a Doppler-shifted frequency reach the cathode instantly without reabsorption in plasma. These photons are radiated due to atoms excitation by ions or energetic atoms impact. Also the DS photons appear from the excited energetic atoms created in CET reactions. The coefficient of photoemission of =0.3 were taken from Ref. Bokhan2007 in which the similar discharge was studied. More detailed description of our physical model can be found in Refs.Sch2014 ; Sch2015 .
IV Results of experimental and theoretical study
In our previous study Sch2015 ; Sch2016 we have found that the SEE was a major process in electron production in the final stage of the breakdown. From the beginning the high energy electrons are accumulated in the discharge volume. They oscillate between two powered cathodes through the mesh-anode which is practically transparent for them. The characteristic time of the breakdown is much smaller than the electron thermalization time. Therefore since the voltage on the cathodes begins to decrease with the current growth, the high energy electrons overpass the potential drop over the cathode sheath and reach the cathode.
Now let us consider the effect of enhanced secondary electron emission on the voltage waveform during breakdown. In the experiment, the waveform was measured in the discharge cells with different cathodes made from Ti, SiC and CuAlMg-alloy materials. In simulations, using different values of corresponding to Ti, SiC and CuAlMg-alloy materials we mimic the different cathode cases.
In Fig. 4, both measured and calculated waveforms with 10 kV-amplitude of voltage pulse on the discharge gap are shown for different types of cathodes for P=25 Torr.

It is seen that the breakdown takes place earlier for the larger corresponding to CuAlMg-alloy cathode. For the cases of SiC and Ti cathodes the experimental and simulation data well agree showing a steeper voltage drop, and consequently a steeper current growth, for larger . The discharge current density increases up to 300 A/cm2 during breakdown time , which is 0.4 ns for SiC case and 2 ns for Ti cathode.
For the case of CuAlMg-alloy cathode the measured differs from the simulated one. In the experiment, the cathode material was not in activated state and seems has a smaller of the two shown in Fig. 2. The experimental for the SiC and CuAlMg-alloy cases look very similar because their are very close. In contrast, in simulation we choose the larger for activated CuAlMg-alloy to show the promising prospects of this alloy. As was mentioned above the characteristics of this material is very sensitive to a degree of alloy activation due to magnesium diffusion to the surface and its oxidation by heating.
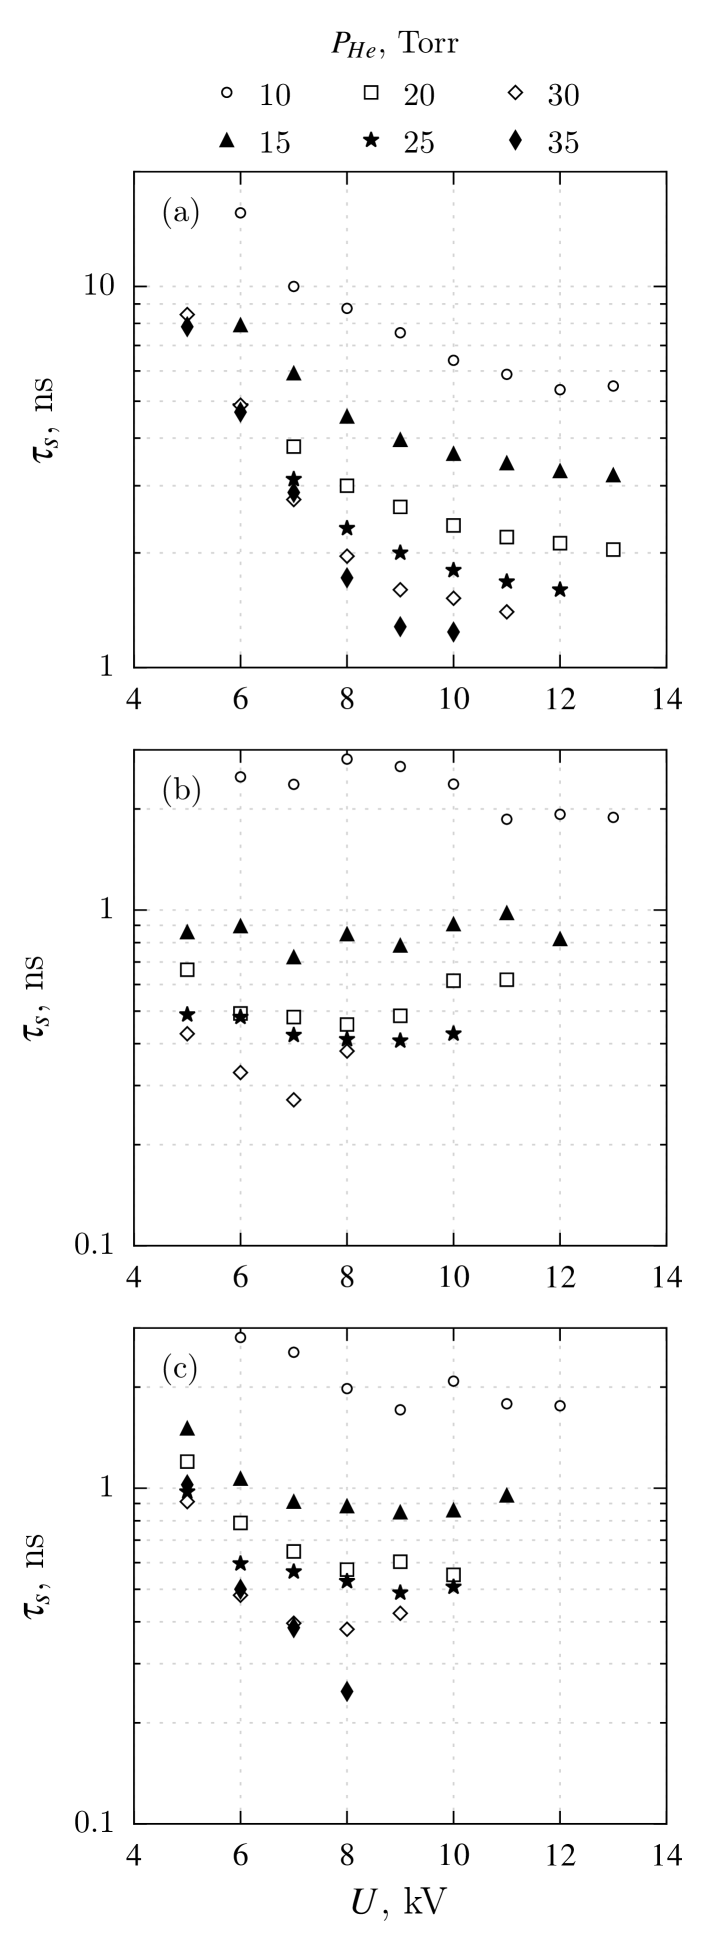
Let us consider the influence of a variation of voltage and gas pressure on the breakdown time. In Fig. 5, the switching time measured in the experiment is shown for different pulse voltages and gas pressures. For the cases with Ti and CuAlMg-alloy cathodes shown in Fig. 5 (a) and (c), an increase of voltage from 5 kV to 7 kV leads to a substantial reduction of , whereas a variation of from 7 kV to 12 kV only slightly affects . For the SiC cathode (see Fig. 5 (b)), the switching time remains practically constant for the voltage range from 5 kV to 12 kV. Only for P=30 Torr, the is a more complex function of with a minimum at =7 kV.
The effect of gas pressure on is the same for all types of cathodes: with increasing P, decreases. The record switching time for SiC and CuAlMg-alloy is 0.4 ns and for Ti-case the is 4-5 times larger.
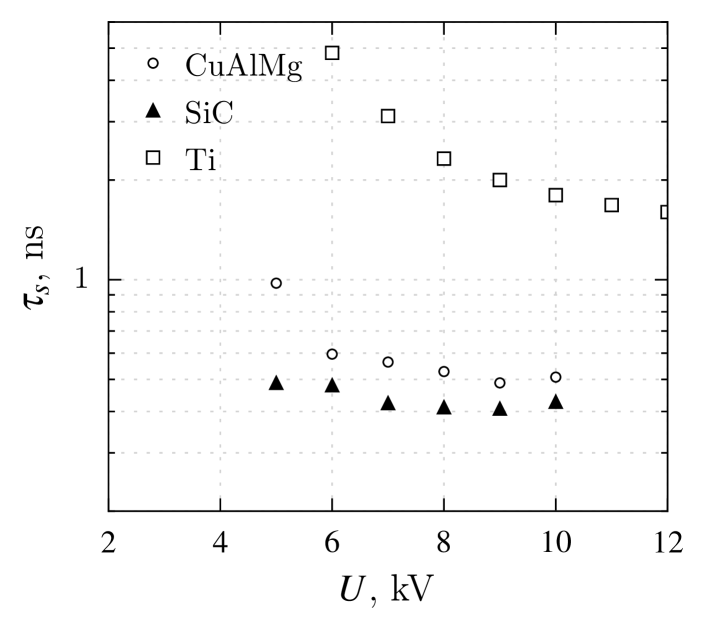
In Fig. 6, the -dependence from pulse voltage amplitude is shown for three types of cathodes at P=25 Torr. It is seen that with for the pulse voltage amplitude less than 5 kV the quickly rises. The calculated voltage profile for various is shown in Fig. 7 for SiC-cathode case. In simulations the voltage begins to increase from t=0 during 10 ns and a delay of breakdown enlarges with a decrease of the pulse voltage amplitude. For the 4 kV voltage the waveform differs qualitatively from the variants with =5 kV, 6 kV and 8 kV and reflects the larger switching time.

In conclusion, in the experiment and PIC MCC simulations we have studied the influence of different e-e emission yields, pulse voltages and gas pressures on the breakdown time in high voltage pulse discharge in helium. Our previous simulations Sch2015 ; Sch2016 have demonstrated that e-e emission makes the main contribution in the current development on the final stage of breakdown. Therefore we have studied the breakdown with of three types of cathodes which have very different electron yield. The cathodes made from Ti, SiC and CuAlMg-alloy were implemented in the experimental sells. The voltage waveforms were measured and calculated for the pulse amplitude ranged of 4 kV-12 kV and gas pressure from 10 Torr to 35 Torr. The record switching time 0.4 ns was registered in the experiment and simulations for the cases with SiC and CuAlMg-alloy cathodes, and for titanium cathode with smaller e-e yield the 2 ns. We also found out that the increase of gas pressure from 10 Torr to 30 Torr helps to decrease switching time. A decrease of pulse amplitude from 10 kV to 5 kV weakly changes , but with further decrease of voltage amplitude ( 5kV), the quickly increases.
Thus there is a specific range of discharge parameters, =5-10 kV and P=15-35 Torr, within that the record switching time 1 ns can be achieved. For 11 kV and P35 Torr the discharge operation transits to filament mode. Additionally to these range of plasma parameters the cathode material should have the secondary electron emission yield not less than of the SiC and CuAlMg-alloy materials.
Acknowledgements.
We are grateful to the Russian Science Foundation for supporting this work, project 14-19-00339. The development of software was partly supported by by grant of Russian Foundation of Basic Research No. 15-02-02536.References
- (1) Mesyats G and Yalandin M 2005 Phys. Usp. 48(3) 211
- (2) Generation of Runaway Electron Beams and X-Rays in High Pressure Gases 2016 1,2 Ed. by Tarasenko V F New York: Nova Science Publ., Inc.
- (3) Bokhan P.A. Pumping of gas lasers by runaway electrons generated in an open discharge. Encyclopedia of Low-Temperature Plasma. 2005 Ed. by Fortov V E XI - 4 316 (in Russian)
- (4) Khomich V Y and Yamschikov V A 2011 Plasma Physics Reports 37 1145
- (5) Shulepov M, Erofeev M, Ivanov Y, Oskomov K and Tarasenko V 2015 J Physical Science and Application 15 33
- (6) Bokhan P A, Gugin P P and Zakrevskii D E 2016 Quantum Electron 46 782
- (7) Efremov A, Koshelev V, Kovalchuk B, Plisko V and Sukhushin K 2011 Instrum. Exp. Tech. 54 70
- (8) Carman R J, Kane D M and Ward B K 2010 J. Phys. D: Appl. Phys. 43 025205
- (9) Bokhan P A, Gugin P P, Lavrukhin M A and Zakrevsky Dm E 2013 Phys. Plasmas 20 033507
- (10) Bokhan P, Gugin P, Zakrevsky Dm and Lavrukhin M 2013 Tech. Phys. Lett. 39 775
- (11) Schweigert I V, Alexandrov A L, Zakrevsky Dm E and Bokhan P A 2014 Phys. Rev. E, 90 051101(R)
- (12) Schweigert I V, Alexandrov F L, Bokhan P A and Zakrevsky Dm E 2015 Plasma Sources Sci. Technol. 24 044005
- (13) Schweigert I V, Alexandrov F L, Bokhan P A and Zakrevsky Dm E 2016 Plasma Phys. Reports 42 666
- (14) Bokhan P A, Gugin P P, Lavrukhin M A, Schweigert I V, Alexandrov A L and Zakrevsky Dm E 2016 Switches Based on the Open Discharge with Counter-Propagating Electron Beams In: Generation of runaway electron beams and x-rays in high pressure gases 1 Techniques and measurements, Ed. by Tarasenko V F (New York: Nova Science Publishers Inc) 221
- (15) Walker C G H, EL-Gomati M M, Assa’d A M D and Zadrazil M 2008 Scanning 30 365
- (16) Viel-Inguimbert V 2003 in Proc. of 28th International Electric Propulsion Conference, Toulouse 1
- (17) Lepeshinskaya B N and Stuchinskiy G B 1960 Fizika Tverdogo Tela (Physics of the Solid State), 2 1328 (in Russian).
- (18) Alves L L, Bartschat K, Biagi S F et al 2013 J. Phys. D: Appl. Phys. 46(33) 334002
- (19) Ralchenko Y, Janev R K, Kato T et al 2008 At. Data Nucl. Data Tables 94(4) 603
- (20) Opal C B, Peterson W K, and Beaty E C 1971 J. Chem. Phys. 55(8) 4100
- (21) Surendra M, Graves D B, and Jellum G M 1990 Phys. Rev. A 41(2) 1112
- (22) Cramer W H and Simons J H 1956 J. Chem. Phys. 26(5) 1272
- (23) Okasaka R, Konishi Y, Sato Y and Fukuda K 1987 J. Phys. B: At. Mol. Phys. 20(15) 3771
- (24) Gilbody H B and Hasted J B 1957 Proc. R. Soc. A 240(1222) 382
- (25) Jordan J E and Amdur I 1967 J. Chem. Phys. 46(1) 165
- (26) Kempter V, Veith F and Zehnle L 1975 J. Phys. B: At. Mol. Phys. 8(7) 1041
- (27) Hayden H C and Utterback N G 1964 Phys. Rev. 135(6A) A1575
- (28) Watanabe T 1965 Phys. Rev. 138(6A) A1573
- (29) Birdsall C K and Langdon A B 1985 Plasma Physics Via Computer Simulation (New York: McGraw-Hill)
- (30) Bokhan P A, Zakrevsky Dm E 2007 Tech. Phys. 52(1) 104
- (31) Baragiola R A, Alonso E V and Oliva Florio A 1979 Phys. Rev. B 19(1) 121