Consensus clustering approach to group brain connectivity matrices
Abstract
A novel approach rooted on the notion of consensus clustering, a strategy developed for community detection in complex networks, is proposed to cope with the heterogeneity that characterizes connectivity matrices in health and disease. The method can be summarized as follows: (i) define, for each node, a distance matrix for the set of subjects by comparing the connectivity pattern of that node in all pairs of subjects (ii) cluster the distance matrix for each node, (iii) build the consensus network from the corresponding partitions and (iv) extract groups of subjects by finding the communities of the consensus network thus obtained. Differently from the previous implementations of consensus clustering, we thus propose to use the consensus strategy to combine the information arising from the connectivity patterns of each node. The proposed approach may be seen either as an exploratory technique or as an unsupervised pre-training step to help the subsequent construction of a supervised classifier. Applications on a toy model and two real data sets, show the effectiveness of the proposed methodology, which represents heterogeneity of a set of subjects in terms of a weighted network, the consensus matrix.
pacs:
42.30.Sy,87.57.-s,87.19.L-,87.19.lfIn the supervised analysis of human connectome data Sporns_2011 ; Craddock_2013 , subjects are usually grouped under a common umbrella corresponding to high-level clinical categories (e.g., patients and controls), and typical approaches aim at deducing a decision function from the labeled training data, see e.g. Fornito_2010 . However, the populations of subjects (healthy as well as patients) is usually highly heterogeneous: clustering algorithms find natural groupings in the data, and therefore constitute a promising technique for disentangling the heterogeneity that is inherent to many conditions, and to the cohort of controls. Such an unsupervised classification may also be used as a preprocessing stage, so that the subsequent supervised analysis might exploit the knowledge of the structure of data. Some studies dealt with similar issues: semi-supervised clustering of imaging data was considered in Filipovych_2011 ; Filipovych_2012 , other recent approaches cope with the heterogeneity of subjects using multiplex biomarkers techniques Steiner2016 and combinations of imaging and genetic patterns Varol_2016 , whilst a strategy to overcome inter-subject variability while predicting behavioral variables from imaging data has been proposed in Takerkart_2014 . Connectivity features have been used in data-driven approaches for analysis and classification of MRI data in Amico_2016 ; Iraji_2016 . The purpose of this work is to introduce a novel approach that is rooted on the notion of consensus clustering Lancichinetti_2012 , a strategy developed for community detection in complex networks Barabasi_2002 .
To introduce our method, let us assume that a connectivity matrix is associated to each item to be classified (usually a subject, but also individual scans for the same subject as in the example illustrated below). The goal of supervised analysis is to mine those features of matrices which provide the best prediction of available environmental and phenotypic factors, such as task performance, psychological traits, and disease states. When it comes to using unsupervised analysis of matrices to find groups of subjects, the most straightforward approach would be to extract a vector of features from each connectivity matrix, and to cluster these vectors using one of the commonly used clustering algorithms. The purpose of the present work is to propose a new strategy for unsupervised clustering of connectivity matrices. In the proposed approach the different features, extracted from connectivity matrices, are not combined in a single vector to feed the clustering algorithm; rather, the information coming from the various features are combined by constructing a consensus network Lancichinetti_2012 . Consensus clustering is commonly used to generate stable results out of a set of partitions delivered by different clustering algorithms (and/or parameters) applied to the same data ISI:000183593700015 ; here, instead, we use the consensus strategy to combine the information about the data structure arising from different features so as to summarize them in a single consensus matrix.
The unsupervised strategy that we propose here to group subjects, without using phenotypic measures, can be summarized as follows, and as depicted in figure (1): (i) define, for each node, of a distance matrix for the set of subjects (ii) cluster the distance matrix for each node, (iii) build the consensus network from the corresponding partitions and (iv) extract groups of subjects by finding the communities of the consensus network thus obtained . We remark that the proposed approach not only provides a partition of subjects in communities, but also the consensus matrix, which is a geometrical representation of the set of subjects. In the next section we describe in detail the method and apply it to a toy model, then we show the application on two real MRI data sets. Finally, some conclusions are drawn.
I Method
Let us consider m subjects whose functional (structural) connectivity matrix Rubinov_2010 , where N is the number of nodes, will be denoted by , and . For each node i, we build a distance matrix for the set of subjects as follows. Consider a pair of subjects and , and consider the corresponding nodal connectivity patterns and ; let r be their Spearman correlation. As the distance between the two subjects, for the node i, we take ; other choices for the distance can be used, like, e.g., where is the Pearson correlation. The distance matrix corresponding to node will be denoted by , with . The set of matrices may be seen as corresponding to layers of a multilayer network Boccaletti_2014 , each brain node providing a layer.
Each distance matrix is then partitioned into groups of subjects using k-medoids method Brito_2007 . Subsequently, an consensus matrix is evaluated: its entry indicates the number of partitions in which subjects and are assigned to the same group, divided by the number of partitions N. The number of clusters may be kept fixed, thus rendering the consensus matrix depending on k; a better strategy, however, is to average the consensus matrix over ranging in an interval, so as to fuse, in the consensus matrix, information about structures at different resolutions.
The consensus matrix, obtained as explained before, is eventually partitioned in communities by modularity maximization, with the consensus matrix being compared against the ensemble of all consensus matrices one may obtain randomly and independently permuting the cluster labels obtained after applying the k-medoids algorithm to each of the set of distance matrices. More precisely, a modularity matrix is evaluated as
where is the expected co-assignment matrix, uniform as a consequence of the null ensemble here chosen, obtained repeating many times the permutation of labels; the modularity matrix is eventually submitted to a modularity optimization algorithm to obtain the output partition by the proposed approach (we used the Community Louvain routine in the Brain Connectivity Toolbox ISI:000280181800027 , which admits modularity matrices instead of connectivity matrices as input).

We remark that the proposed approach has similarities with the one adopted in Shehzad_2014 , where techniques from genome-wide association studies coping with the problem of a huge number of comparisons were applied to connectomes, thus identifying nodes whose whole-brain connectivity patterns vary significantly with a phenotypic variable. The approach in Shehzad_2014 consists in two steps. First, for each node in the connectome, a whole brain functional connectivity map is evaluated, and then the similarity between the connectivity maps of all possible pairings of participants, using spatial correlation, is calculated. Then, in the second stage, a statistics is evaluated for each node, indicating the strength of the relationship between a phenotypic measure and variations in its connectivity patterns across subjects. The main similarity with the proposed approach is that in both methods, for each node in the connectome, the comparison between the connectivity maps yields a distance matrix in the space of subjects.
II A toy model
As a toy model to describe the application of our method, we simulate a set of 100 subjects, divided in four groups of 25 each. The subjects are supposed to be described by 30 nodes. We will compare our proposed approach with a standard procedure such as averaging the distance matrices and then applying the clustering algorithm to the average distance matrix.
The distance matrices corresponding to the first ten nodes are constructed in the following way: the distance for pairs belonging to the same group is sampled uniformly in the interval , whilst the distance for pairs belonging to different groups is sampled uniformly in the interval . The distance matrices corresponding to the twenty remaining nodes have all the entries sampled uniformly in the interval . It follows that in our toy model only 10 nodes, out of 30, carry information about the presence of the four groups.
First of all, we evaluate the distance matrix among subjects, averaged over the 30 nodes, and apply the k-medoids algorithm to this matrix , searching for clusters (thus exploiting the knowledge of the number of classes present in data); this procedure leads to an accuracy of 0.89, measured as follows. Let us call , the four groups in the model and let M be the minimum between 4 and the number of clusters found by modularity maximization clustering; we denote , the largest M clusters found by clustering. The accuracy is then given by
where is the cardinality of the intersection of the two sets, and m=100 is the total number of subjects.
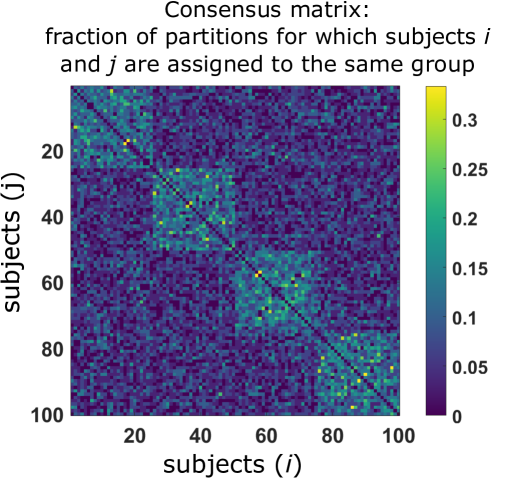
Subsequently, we run the proposed approach by applying separately to each distance matrix for each of the 30 nodes the k-medoids algorithm with varying . We then build the corresponding consensus matrix. For example in figure (2) the consensus matrix among subjects is depicted as obtained applying k-medoids with separately to each of the 30 layers. Then, the communities of the consensus matrices have been estimated as described in the previous Section.
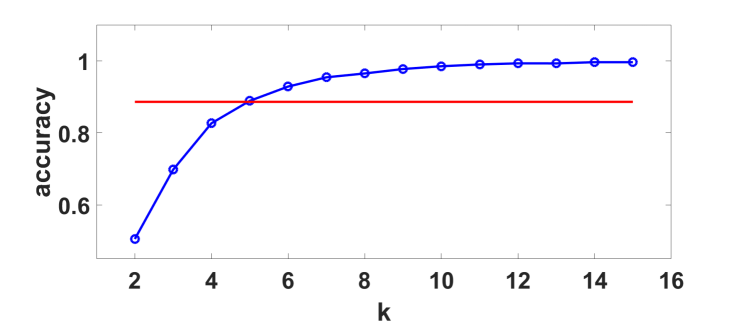
In figure (3) the accuracy of the partition, provided by modularity maximization on the consensus matrix, is depicted versus , in order to show how it varies with : it shows that the proposed method performs better than the partition of the average distance matrix on this example, for large ; we remark that the accuracy 0.89 is reached by k-medoids on the average distance using i.e. exploiting the knowledge of the number of groups present in the data set, whilst the proposed algorithm determines both the number of clusters and the partition. Intuitively, the proposed approach works better in this example for large , because in the distance matrix corresponding to an informative node, due to chance, the block corresponding to a group is seen as fragmented in smaller pieces; those pieces can be retrieved using k-medoids with large . On the other hand when the consensus is made across the different informative nodes, all those pieces merge in the consensus matrix and build the block corresponding to the four groups.
It is also worth noting that the accuracy by clustering the averaged consensus matrix (over the values of ) is one, i.e. perfect group reconstruction. Averaging over the values of appears then to be a convenient strategy. Moreover, averaging over values of parameters is a common strategy for consensus clustering, hence building the consensus matrix while joining several values of is in line with the philosophy of consensus clustering Lancichinetti_2012 .
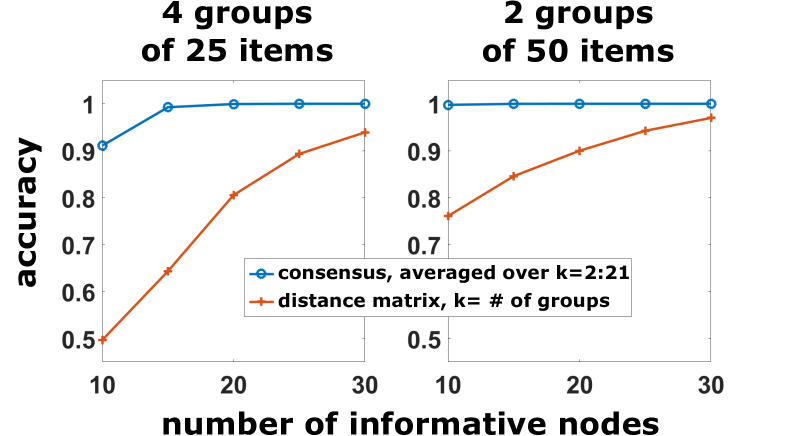
In order to show the effectiveness of the proposed approach under different conditions, we change the toy model by varying the number of informative nodes and the number of groups. We also use different parameters w.r.t. the previous simulations, the distance for pairs belonging to the same group are still sampled uniformly in the interval , whilst the distance for pairs belonging to different groups is sampled uniformly in the interval . The results, displayed in figure (4), show that the proposed approach works better than the application of k-medoids to the average distance matrix.
III Application to real data sets
III.1 Longitudinal data set
Growing interest is devoted to longitudinal phenotyping in cognitive neuroscience: accordingly we consider here data from the MyConnectome project Laumann_2015 ; Poldrack_2015 , where fMRI scans from a single subject were recorded over 18 months. In Shine_2016 the presence of two distinct temporal states has been identified, that fluctuated over the course of time. These temporal states were associated with distinct patterns of time-resolved blood oxygen level dependent (BOLD) connectivity within individual scanning sessions and also related to significant alterations in global efficiency of brain connectivity as well as differences in self-reported attention. This data was obtained from the OpenfMRI database. Its accession number is ds000031. The functional MRI (fMRI) data was preprocessed with FSL (FMRIB Software Library v5.0). The first 10 volumes were discarded for correction of the magnetic saturation effect. The remaining volumes were corrected for motion, after which slice timing correction was applied to correct for temporal alignment. All voxels were spatially smoothed with a 6mm FWHM isotropic Gaussian kernel and after intensity normalization, a band pass filter was applied between 0.01 and 0.08 Hz. In addition, linear and quadratic trends were removed. We next regressed out the motion time courses, the average CSF signal and the average white matter signal. Global signal regression was not performed. Data were transformed to the MNI152 template, such that a given voxel had a volume of 3mm x 3 mm x 3mm. Finally we obtained 268 time series, each corresponding to an anatomical region of interest (ROI), by averaging the voxel signals according to the functional atlas described in Shen_2013 .
Each of the 89 sessions resulted in a 268268 matrix of Pearson correlation coefficients.
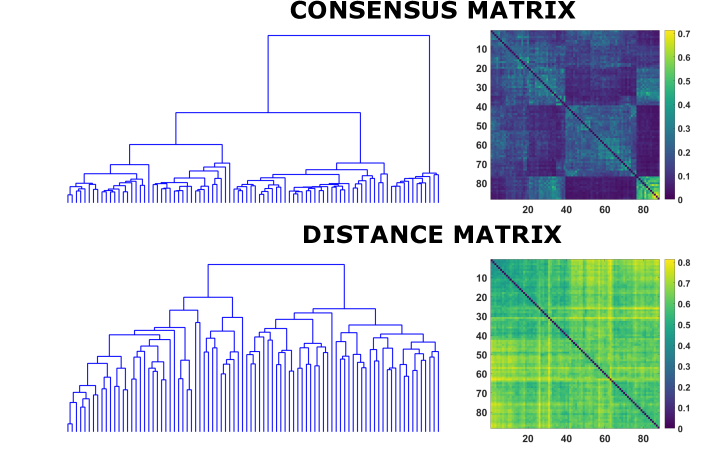
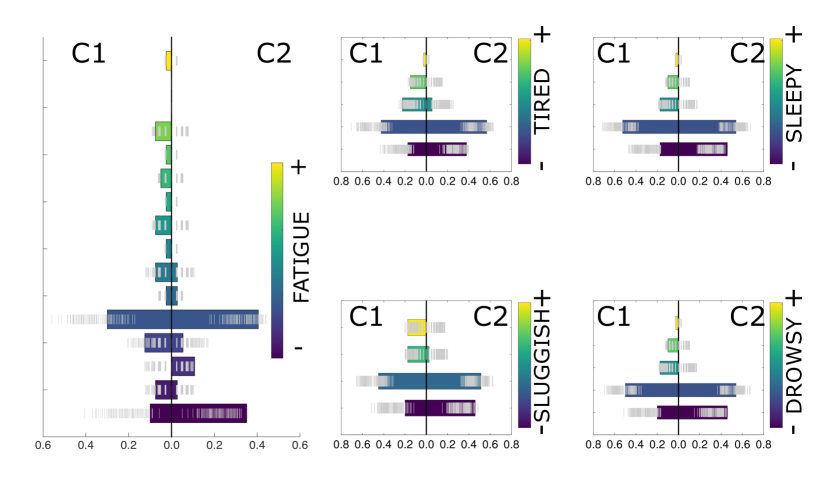
We treated the sessions as if they were connectivity matrices of different subjects, and applied the proposed methodology. In figure (5) we depict the distance matrix, among the different sessions of the same subject, and the consensus matrix, obtained averaging over ten values of . Sessions are ordered, in both cases, according to hierarchical clustering; the corresponding dendrograms are also shown in the figure. It is clear that the consensus matrix shows a hierarchical structure. Maximization of the modularity provides two communities with modularity equal to 0.175. As depicted in figure (6), the two communities are significantly different for several PANAS scores, all associated to tiredness. This is assessed visually using a null distribution obtained by shuffling 500 times the pairing between behavioral variable and connectome matrix and with a nonparametric Wilcoxon rank sum test: drowsy (Bonferroni corrected p-value = ), tired (Bonferroni corrected p-value = ), sluggish (Bonferroni corrected p-value = ), sleepy Bonferroni corrected p-value = ), fatigue (Bonferroni corrected p-value = ). This confirms the presence of two distinct temporal states. However the hierarchical structure of the consensus matrix that we obtained suggests that longer longitudinal recordings are needed to further evidence the richness of distinct functional states for single subjects.
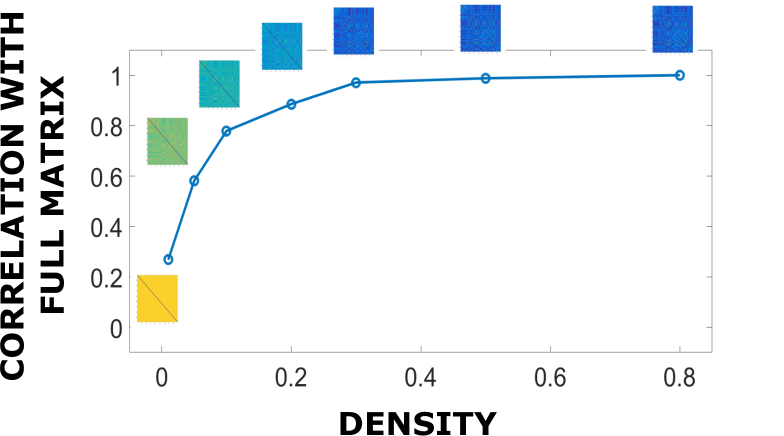
It is also worth considering the effects of network thresholding on the performance of the proposed algorithm: thresholding is a relevant problem in brain connectivity vanw_2010 ; devico_2017 . The functional networks in this data set are thresholded so as to retain a varying fraction (density) of the largest entries. In figure (7) we plot the similarity between the consensus matrices obtained by the proposed algorithm after thresholding and the corresponding consensus matrix in the absence of thresholding, as a function of the density. The similarity between the consensus matrices is evaluated as the Pearson correlation between the entries of the two matrices. On one side the results show the robustness of the proposed approach to moderate thresholding, indeed up to thresholding the consensus matrix is very close to what is obtained using the full matrices. On the other hand, the consensus matrix by the proposed approach is substantially different for sparser networks. This might speak to the fact that the correlation value is a debatable choice of a thresholding criterion for correlation matrices, and that the proposed approach is suited for weighted networks.
III.2 Resting healthy subjects, functional and structural connectivity
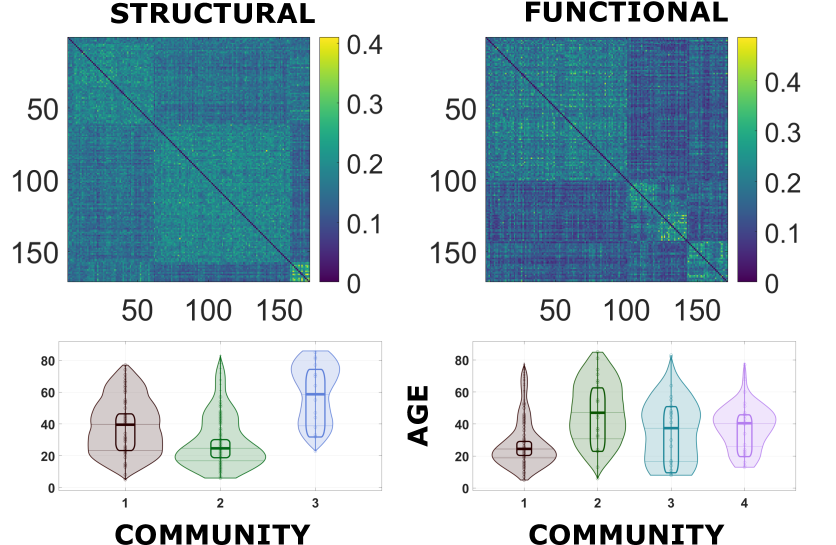
We consider 171 healthy subjects from the NKI Rockland dataset NKI ; for each subject we use both the structural Diffusion Tensor Imaging DTI network and the functional network, already obtained from processed data as described in Brown_2012 . In this case the networks have 118 nodes. In figure (8) we depict the consensus matrix for both DTI and fMRI networks; modularity maximization yields three communities for DTI networks and four communities for fMRI. Concerning DTI, the three communities are significantly characterized by different age, with p-values equal to , and for the group comparisons 1-2, 2-3 and 1-3 respectively (see figure (8)). Considering fMRI data, the first group by the proposed algorithm have a different age than the second, the third and the fourth ones (taken as a whole) with probability . P-values here reported refer to a non-parametric ranksum test, similar significance was found using parametric tests. We remark that our method performs differently from k-medoids over the average distance, where we obtain two groups with different age, t-test with probability using the functional distance, whilst no significant difference in age using the structural connectivity.
Inspired by the results found by our method, we also performed a multivariate distance regression Shehzad_2014 , that allowed us to build a pseudo F-statistics to test whether age correlates with the differences observed in the distance matrix for each node. We have achieved this by comparing the observed F-statistic with the pseudo F-distribution (that is not normal) after data permutations. As expected, for both structural and functional data, we found 124 and 76 nodes statistically related with age respectively, thus suggesting that age is one of the variables responsible of the community structure found by our method.
IV Conclusions
An important issue such as dealing with the heterogeneity that characterizes healthy conditions, as well as diseases, requires the development of effective methods capable to highlight the structure of sets of subjects at varying resolutions. The approach that we propose here is applied to sets of subjects each described by a connectivity matrix; we propose a strategy, rooted in complex networks theory, to obtain a consensus matrix which describes the geometry of the data-set providing at different resolutions groups of similar subjects. Whilst the straightforward application of consensus clustering to a given data set combines the output from different clustering, our proposal, instead, is to apply a clustering algorithm separately to the connectivity map of each node. Hence the consensus strategy is exploited to combine the information arising from the different nodes. Obviously, the choice of k-medoids as the clustering algorithm for the individual layers is not mandatory, other algorithms can be used, as well as the definition of the distance among subjects to be used by this algorithm. Moreover, in the present work the features that we considered are the connectivity maps resulting from the whole brain connectivity pattern of each node, however other subsets of entries of matrices can be taken as well and the same strategy can be applied to fuse the different layers and produce a consensus matrix. Likewise, our framework is not limited to considering the whole brain and therefore it can be applied to analyze specific regions relevant to the problem at hand so as to exploit the benefits of our method. Summarizing, our approach aims at disentangling the heterogeneity of groups corresponding to high-level categories, like healthy and disease, finding natural groups within the cohort of patients (and within the cohort of controls). While dealing with data with both healthy and controls, it can be seen as a preprocessing step, that helps the subsequent construction of a supervised classifier healthy/subject.
Code
The code for the construction of the consensus matrix, out of the set of connectivity matrices, is available at the website https://github.com/jrasero/consensus
Acknowledgements
The authors are grateful to Richard Betzel (University of Pennsylvania) and an anonymous referee for the most valuable suggestions. They also thank Guillaume Rousselet for valuable suggestions on data representation.
JR acknowledges financial support from the Minister of Education, Language Policy and Culture (Basque Government) under Doctoral Research Staff Improvement Programme. We thank Guillaume Rousselet for valuable suggestions on data representation.
References
- (1) O. Sporns, Networks of the Brain. 2011.
- (2) R. C. Craddock, S. Jbabdi, C.-G. Yan, J. T. Vogelstein, F. X. Castellanos, A. D. Martino, C. Kelly, K. Heberlein, S. Colcombe, and M. P. Milham, “Imaging human connectomes at the macroscale,” Nature Methods, vol. 10, pp. 524–539, may 2013.
- (3) A. Fornito and E. T. Bullmore, “What can spontaneous fluctuations of the blood oxygenation-level-dependent signal tell us about psychiatric disorders?,” Current Opinion in Psychiatry, vol. 23, pp. 239–249, may 2010.
- (4) R. Filipovych, S. M. Resnick, and C. Davatzikos, “Semi-supervised cluster analysis of imaging data,” NeuroImage, vol. 54, pp. 2185–2197, feb 2011.
- (5) R. Filipovych, S. M. Resnick, and C. Davatzikos, “JointMMCC: Joint maximum-margin classification and clustering of imaging data,” IEEE Transactions on Medical Imaging, vol. 31, pp. 1124–1140, may 2012.
- (6) J. Steiner, P. Guest, H. Rahmoune, and D. Martins-de Souza, “The application of multiplex biomarker techniques for improved stratification and treatment of schizophrenia patients,” in Multiplex Biomarker Techniques (P. C. Guest, ed.), no. 1546 in Methods in Molecular Biology, pp. 19–35, Springer New York. DOI: 10.1007/978-1-4939-6730-8_2.
- (7) E. Varol, A. Sotiras, and C. Davatzikos, “HYDRA: Revealing heterogeneity of imaging and genetic patterns through a multiple max-margin discriminative analysis framework,” NeuroImage, feb 2016.
- (8) S. Takerkart, G. Auzias, B. Thirion, and L. Ralaivola, “Graph-based inter-subject pattern analysis of fMRI data,” PLoS ONE, vol. 9, p. e104586, aug 2014.
- (9) E. Amico, D. Marinazzo, C. D. Perri, L. Heine, J. Annen, C. Martial, M. Dzemidzic, M. Kirsch, V. Bonhomme, S. Laureys, and J. Goni, “Mapping the functional connectome traits of levels of consciousness,” NeuroImage, pp. –, 2017.
- (10) A. Iraji, V. D. Calhoun, N. M. Wiseman, E. Davoodi-Bojd, M. R. Avanaki, E. M. Haacke, and Z. Kou, “The connectivity domain: Analyzing resting state fMRI data using feature-based data-driven and model-based methods,” NeuroImage, vol. 134, pp. 494–507, jul 2016.
- (11) A. Lancichinetti and S. Fortunato, “Consensus clustering in complex networks,” Scientific Reports, vol. 2:336, mar 2012.
- (12) A.-L. Barabasi and J. Frangos, Linked: The New Science of Networks. Perseus Books Group, 1st ed.
- (13) A. Strehl and J. Ghosh, “Cluster ensembles - A knowledge reuse framework for combining partitionings,” in EIGHTEENTH NATIONAL CONFERENCE ON ARTIFICIAL INTELLIGENCE (AAAI-02)/FOURTEENTH INNOVATIVE APPLICATIONS OF ARTIFICIAL INTELLIGENCE CONFERENCE (IAAI-02), PROCEEDINGS, (FIVE CAMBRIDGE CENTER, CAMBRIDGE, MA 02142 USA), pp. 93–98, Amer Assoc Artificial Intelligence; ACM SIGART; Alberta Informat Circle Res Excellence; DARPA; NASA Ames Res Ctr; Natl Sci Fdn; Naval Res Lab, M I T PRESS, 2002. 18th National Conference on Artificial Intelligence/14th Conference on Innovative Applications of Artificial Intelligence, EDMONTON, CANADA, JUL 28-AUG 01, 2002.
- (14) M. Rubinov and O. Sporns, “Complex network measures of brain connectivity: Uses and interpretations,” NeuroImage, vol. 52, pp. 1059–1069, sep 2010.
- (15) S. Boccaletti, G. Bianconi, R. Criado, C. del Genio, J. Gómez-Gardeñes, M. Romance, I. Sendiña-Nadal, Z. Wang, and M. Zanin, “The structure and dynamics of multilayer networks,” Physics Reports, vol. 544, pp. 1–122, nov 2014.
- (16) P. Brito, P. Bertrand, G. Cucumel, and F. D. Carvalho, Clustering by means of Medoids. Selected Contributions in Data Analysis and Classification. Springer Science & Business Media, 2007.
- (17) M. Rubinov and O. Sporns, “Complex network measures of brain connectivity: Uses and interpretations,” NEUROIMAGE, vol. 52, pp. 1059–1069, SEP 2010.
- (18) Z. Shehzad, C. Kelly, P. T. Reiss, R. C. Craddock, J. W. Emerson, K. McMahon, D. A. Copland, F. X. Castellanos, and M. P. Milham, “A multivariate distance-based analytic framework for connectome-wide association studies,” NeuroImage, vol. 93, pp. 74–94, jun 2014.
- (19) T. O. Laumann, E. M. Gordon, B. Adeyemo, A. Z. Snyder, S. J. Joo, M.-Y. Chen, A. W. Gilmore, K. B. McDermott, S. M. Nelson, N. U. Dosenbach, B. L. Schlaggar, J. A. Mumford, R. A. Poldrack, and S. E. Petersen, “Functional system and areal organization of a highly sampled individual human brain,” Neuron, vol. 87, pp. 657–670, aug 2015.
- (20) R. A. Poldrack, T. O. Laumann, O. Koyejo, B. Gregory, A. Hover, M.-Y. Chen, K. J. Gorgolewski, J. Luci, S. J. Joo, R. L. Boyd, S. Hunicke-Smith, Z. B. Simpson, T. Caven, V. Sochat, J. M. Shine, E. Gordon, A. Z. Snyder, B. Adeyemo, S. E. Petersen, D. C. Glahn, D. Reese Mckay, J. E. Curran, H. H. H. Göring, M. A. Carless, J. Blangero, R. Dougherty, A. Leemans, D. A. Handwerker, L. Frick, E. M. Marcotte, and J. A. Mumford, “Long-term neural and physiological phenotyping of a single human.,” Nature communications, vol. 6, p. 8885, 2015.
- (21) J. M. Shine, O. Koyejo, and R. A. Poldrack, “Temporal metastates are associated with differential patterns of time-resolved connectivity, network topology, and attention,” Proceedings of the National Academy of Sciences, vol. 113, pp. 9888–9891, aug 2016.
- (22) X. Shen, F. Tokoglu, X. Papademetris, and R. T. Constable, “Groupwise whole-brain parcellation from resting-state fMRI data for network node identification.,” NeuroImage, vol. 82, pp. 403–15, nov 2013.
- (23) B. C. M. van Wijk, C. J. Stam, and A. Daffertshofer, “Comparing Brain Networks of Different Size and Connectivity Density Using Graph Theory,” PLOS ONE, vol. 5, OCT 28 2010.
- (24) F. De Vico Fallani, V. Latora, and M. Chavez, “A topological criterion for filtering information in complex brain networks,” PLOS Computational Biology, vol. 13, pp. 1–18, 01 2017.
- (25) http://fcon_1000.projects.nitrc.org/indi/pro/nki.html.
- (26) J. A. Brown, J. D. Rudie, A. Bandrowski, J. D. V. Horn, and S. Y. Bookheimer, “The UCLA multimodal connectivity database: a web-based platform for brain connectivity matrix sharing and analysis,” Frontiers in Neuroinformatics, vol. 6, 2012.