Revisiting Graphene Oxide Chemistry via Spatially-Resolved Electron Energy Loss Spectroscopy
Abstract
The type and distribution of oxygen functional groups in graphene oxide and reduced graphene oxide remain still a subject of great debate. Local analytic techniques are required to access the chemistry of these materials at a nanometric scale. Electron energy loss spectroscopy in a scanning transmission electron microscope can provide the suitable resolution, but GO and RGO are extremely sensitive to electron irradiation. In this work we employ a dedicated experimental setup to reduce electron illumination below damage limit. GO oxygen maps obtained at a few nanometers scale show separated domains with different oxidation levels. The C/O ratio varies from about 4:1 to 1:1, the latter corresponding to a complete functionalization of the graphene flakes. In RGO the residual oxygen concentrates mostly in regions few tens nanometers wide. Specific energy-loss near-edge structures are observed for different oxidation levels. By combining these findings with first-principles simulations we propose a model for the highly oxidized domains where graphene is fully functionalized by hydroxyl groups forming a 2D-sp3 carbon network analogous to that of graphane.
Introduction
In the last years, graphene oxide (GO) has attracted remarkable interest as a precursor for a large-scale and low-cost production of graphene-based materials and as a fundamental constituent in new functional composite materials for optoelectronics, photovoltaics, and nanobiology devices.Eda and Chhowalla (2010); Dreyer et al. (2010); Loh et al. (2010); Mao et al. (2012) GO is obtained by liquid exfoliation of chemically oxidized graphite (graphite oxide);Brodie (1859); Staudenmaier (1898); Hummers and Offeman (1958) at a later stage, a graphene-like material known as reduced graphene oxide (RGO) can be derived from GO, by removing the oxygen functionalities.Dreyer et al. (2010); Pei and Cheng (2012) However, after more than 150 years since its discovery, many questions remain open about the exact chemistry and structure of (R)GO at the atomic scale. Eda and Chhowalla (2010); Dreyer et al. (2010); Loh et al. (2010); Mao et al. (2012)
Currently, the most acknowledged model for GO corresponds to a nonstoichiometric structure with a random arrangement of epoxide (-O- in bridge position) and hydroxyl (-OH) functionalities at both sides of the carbon basal plane, with small residual nonfunctionalized graphitic areas. Lerf et al. (1998) Difficulties in defining the exact relative amount and local arrangement of oxygen groups arise from the strong dependence of GO chemistry and structure on the specific graphite precursor and oxidation parameters.Dreyer et al. (2010); Eda and Chhowalla (2010) Moreover GO turned out to be unstable in air and water, resulting in spontaneous reduction and flakes fragmentation.Kim et al. (2012); Zhou and Bongiorno (2013); Eigler et al. (2012); Dimiev et al. (2013) The uncertainties on GO naturally reflect on RGO, whose chemistry and structure also depend on the particular reduction method and parameters.Eda and Chhowalla (2010); Dreyer et al. (2010); Loh et al. (2010); Mao et al. (2012) This lack of knowledge represents a strong limit for the understanding of (R)GO physical properties and hence for a controlled use of these promising functional materials.
New insights could be provided only through the use of improved characterization techniques. Up to now, several spectroscopic techniques have been used to determine the type and amount of oxygen functional groups. In particular, the oxygen level has been estimated mainly by elemental analysis, XPS and EDX on a variety of samples going from graphite oxide powders to (R)GO films and thin flakes. The oxygen content has been evaluated in a range between about 15 and 35 atomic percent (at.%), i.e. between 5:1 and 2:1 in terms of the C/O atomic ratio. In RGO the oxygen content can be lowered to a limit of 0.4 at.% (250:1 C/O atomic ratio), depending on the particular reduction process.Eda and Chhowalla (2010); Dreyer et al. (2010); Loh et al. (2010); Mao et al. (2012) However, these values can only be considered as spatial average quantifications, that cannot account for the irregular chemistry of GO. Indeed, strong structural inhomogeneities at the nanometer scale have been revealed in both GO and RGO by high resolution transmission electron microscopy (HRTEM).Wilson et al. (2009); Erickson et al. (2010); Gómez-Navarro et al. (2010); Pacilé et al. (2011)
Decisive evidence on GO chemistry could only be derived by spectroscopy at the atomic scale. Electron energy-loss spectroscopy (EELS) in a scanning transmission electron microscope (STEM) could in principle be suitable for such analysis, providing elemental quantification by core EELS mapping and chemical structure analysis through energy-loss near-edge structures (ELNES), down to the atomic scale.Egerton (2011) However, the limited use of STEM-EELS for the study of GO and RGOMkhoyan et al. (2009); D’Angelo et al. (2015) resides in the strong sensitivity of these materials to high energy electron irradiation. For instance, atoms mobility and fast amorphization have been clearly demonstrated by time series of HRTEM images, at 80 kV acceleration voltage.Erickson et al. (2010); Pacilé et al. (2011) Illumination sensitivity is indeed highly expected in the case of GO and RGO, since single or few layer thick specimens and light atoms are intrinsically more affected by radiation damages, such as knock-on of carbon atoms and radiolysis of oxygen functionalities resulting in mass loss. Irradiation effects in a STEM could in principle be strongly reduced by the use of low accelerating voltages, low electron-dose, and sample cooling. Egerton (2013)
In this work, thanks to a dedicated experimental setup combining a liquid nitrogen (LN) cooling system at the sample stage with a low noise LN cooled CCD camera, we investigate few layer GO and RGO by core EELS spectrum imaging in a STEM microscope in low dose acquisition modes. We show that the oxygen content in individual (R)GO flakes is strongly heterogeneous at the nanometric scale and that specific near-edge carbon fine structures could be associated with different oxygen contents and bindings, indicating separated chemical phases. Finally, on the basis of these experimental evidence and complementary DFT-based numerical simulations, we suggest a structural model for the highly oxidized regions in GO where all carbon atoms are functionalized by -OH groups.
Experimental Section
Synthesis.
Graphene oxide has been synthesized by the modified Hummers’ method,Hummers and Offeman (1958); Vallés et al. (2012) and successive reduction has been achieved by hydrazine and thermal treatments. Few layer flakes with an average lateral size of a few micrometers have been obtained by dispersion of the dried material in ethanol and ultrasonication. TEM grids were dried in air, first placed in the STEM microscope air lock ( mbar), and then moved in the microscope column ( mbar) and cooled down to about 150 K. High angle annular dark field (HAADF) images show a nonhomogeneous thickness of the flakes, with thinner regions some hundreds of nanometers wide located at the flakes borders. Elemental investigations through core EELS indicate a clear dominance of carbon and oxygen with only negligible residues of nitrogen (in RGO, deriving from the hydrazine reduction agent Stankovich et al. (2007); Vallés et al. (2012)) at few limited regions of the flakes (about 20 nm wide).
Electron Energy Loss Spectroscopy.
EELS spectra were acquired in a VG 501 Scanning Transmission Electron Microscope, provided with a liquid nitrogen cooling system at the sample stage (150 K). Low temperatures have been proven to reduce the mass loss damage by decreasing the atomic mobility.Egerton (1980) Transmitted electrons were collected on a liquid nitrogen cooled CCD camera with a low read-out noise of three counts r.m.s. and a negligible dark count noise. The energy dispersion of the spectra was 0.27 eV, to allow simultaneous acquisition of carbon and oxygen K-edges. The effective energy resolution, resulting from microscope instabilities and spectrometer aberrations, is estimated to 0.5 eV on the carbon K-edge. The accelerating voltage has been limited to 60 kV, and a low electron dose working mode was set by optimization of the acquiring parameters (beam current, illumination area, and time) on (R)GO few layer flakes. During spectrum imaging the beam focus (i.e., illumination area at the sample stage) has been adjusted to match the pixel size in order to avoid oversampling. The exposure of the material to the electron beam before spectra acquisition has been prevented by a fast blanking system before the sample, following the same procedure as in ref 25. Equally, EELS spectra were acquired prior to the corresponding STEM images.
Elemental quantification was performed considering carbon and oxygen edges, within a 25 eV energy window. Specific cross sections were derived from the Hartree-Slater model. An error of a few percent may be assumed on the quantification results.Bertoni and Verbeeck (2008)
EELS spectra collected in a low electron dose mode are characterized by little intensity of the signals. Oxygen quantification has been performed on denoised spectra. Principal component analysis (PCA) represents a common technique for noise reduction in core EELS elemental mapping. de la Peña et al. (2011) PCA analysis has been performed on spectrum images using the HyperSpy software.de la Peña et al. (2015) After remarking significant changes in carbon fine structure peaks, the number of PCA components (less than 10 in the usual routine) was raised to 15. Fine structure analysis has been performed on the as-acquired spectrum images, not treated with PCA, in order to avoid the introduction of any artifacts. Nevertheless, in order to appreciate fine structure peaks, a far more intense signal with respect to quantification is required. The signal intensity has been improved by summing spectra arising from contiguous areas up to few tens of nanometers wide (pixels in the spectrum image) displaying a uniform oxygen content.
DFT Simulations.
Structural optimizations have been performed within the framework of density functional theory (DFT) under the local density approximation (LDA) as implemented in the AIMPRO code.Jones and Briddon (1998); Rayson and Briddon (2008) Carbon, oxygen and hydrogen pseudopotentials are generated using the Hartwingsen-Goedecker-Hutter scheme.Hartwigsen et al. (1998) Valence orbitals are represented by a set of Cartesian gaussians of s-, p-, and d-type basis functions centered at the atomic sites. We have used a basis set of 22 independent functions for carbon (pdpp Gaussian exponents), 40 functions for oxygen (dddd), and 12 functions for hydrogen (ppp). The optimization of the cell parameter was performed simultaneously with the relaxation of the single atomic positions, using a conjugate gradients algorithm.
Results and Discussion
Optimizing the Dose.
In order to define optimal conditions for gentle illumination with a 60 keV electron beam, we have monitored the evolution of oxygen content and carbon near-edge fine structures in GO as a function of the irradiating electron dose. In Fig.1 we present a time series of core EELS spectra acquired under homogeneous illumination over an extended area of a GO flake ( nm2) with a 4 pA electron beam current and an integration time of 2.4 s, corresponding to an electron dose rate as low as e-Å-2s-1. The illuminated region has an initial oxygen content of about 45% (as derived from the spectrum in Fig.1.a) that progressively reduces as a result of the increasing electron dose, as shown in Fig.1.b. Furthermore, the lowering of the oxygen content is associated with significant changes in C K-edge ELNES fine structures ( Fig.1.c). Variations in the near-edge fine structures are a typical indicator of radiation damages affecting chemical bonding and atomic orbital hybridization.Egerton (2013) On this basis, it has been possible to define an upper limit for the electron dose of about e-Å-2, below which no substantial changes occur neither in the flakes stoichiometry nor in EELS fine structures.

The need of low electron dose imposes constraints on STEM spatial resolution.Egerton (2013) Indeed, the total acquired spectral intensity is proportional to the electron dose (fixed by irradiation conditions), the elemental specific cross section, the surface projected density of atoms i.e. the number of scattering centers (depending on the sample thickness) and the size of the illuminated area. Gentle illumination lowers the intrinsically weak intensity of core EELS signals and high spatial resolution implies that a very low number of scattering centers contribute to the EELS signal. In the specific setup of our microscope, the highly efficient CCD camera and the higher electron dose granted by sample coolingEgerton (2013) allow for improving the EELS signal intensity. The signal/noise (S/N) ratio that is compatible with elemental quantification ultimately defines a 3 nm wide minimal illumination area for the study of GO.
Elemental Quantification.
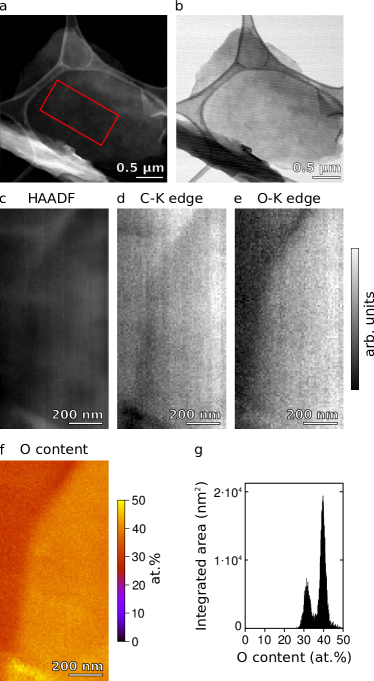
The spatial distribution of oxygen in GO and RGO has been investigated by STEM-EELS spectrum imaging. This acquisition mode consists in collecting simultaneously the HAADF intensity and a complete EELS spectrum at each position of the electron beam during the scan, with a 3 nm minimal beam size and scanning step (no oversampling), to be compatible with the illumination conditions defined above. In Fig.2 we report an example of EELS oxygen quantification on an individual few layer GO flake. The HAADF and bright field (BF) images of the whole flake are presented in Fig.2.a-b, respectively. A spectrum image has been acquired over the wide area marked in Fig.2.a and the resulting HAADF image is shown in Fig.2.c. Acquisition parameters were 10 nm spatial resolution (probe size and scanning step), a 15 pA current and 0.15 s integration time, that correspond to an e-Å-2 total electron dose per spectrum. The HAADF intensity depends on both the amount of matter (thickness and areal density) and the chemical species (atomic number). This information appears separated in the integrated K-shell ionization edges maps derived from the spectrum image ( Fig.2.d-e), that show the spatial variation of the surface projected amount of carbon (hence the number of carbon layers) and oxygen, respectively. In the quantification map of oxygen relative to carbon ( Fig.2.f) two well separated domains with oxidation levels centered at 32 at.% and 40 at.% are visible, as confirmed by the associated image histogram in Fig.2.g. A third less extended domain (bottom left corner in the map) corresponds to 45 at.% with maximum local content of almost 50 at.%. When interpreting these results it must be considered that for each pixel the EELS signal is integrated over the specimen thickness. Hence, a nonhomogeneity in the relative quantification map can result from a spatial variation of the local oxidation level in regions with a constant number of layers or from the local superposition of additional layers with a different oxidation level. In Fig.2.f an increase of the oxygen relative content is visible from the left to the right side of the map forming two well separated regions. The oxygen integrated K-edge map ( Fig.2.e) shows the same trend: the right side area does contain a higher amount of oxygen. On the contrary, the intensity of the carbon integrated K-edge ( Fig.2.d) is almost uniform, indicating that the flake has a constant carbon thickness along the region displaying the oxygen gradient. Therefore these results show a variation of the oxidation level within an individual flake, forming spatially well separated oxidation phases which are not correlated with the flake thickness.
Overall the oxygen content in GO has been observed to vary between 10 at.% and 50 at.% (C/O ratio of 9:1 and 1:1, respectively). The higher oxidation level (30-50 at.%) seems to characterize about one-quarter of the analyzed material, while in extremely rare cases the oxygen content falls below the detection limit (unoxidized flakes), confirming the heterogeneity of GO. Therefore despite the fact that the local oxygen concentration can be extremely high, the average oxygen content in individual flakes is 25 at.%, which is in good agreement with spatially averaged values reported in the literature.Eda and Chhowalla (2010); Dreyer et al. (2010); Loh et al. (2010); Mao et al. (2012) Regions up to a few hundred nanometers wide are characterized by an almost uniform oxidation level (at a 3-10 nm scale), while the transition between two oxidation phases occurs in the space of few tens of nanometers. This observation is compatible with a recently proposed oxidation mechanism where the reaction progresses within graphite flakes in a front-like diffusive-controlled pathway.Dimiev and Tour (2014)
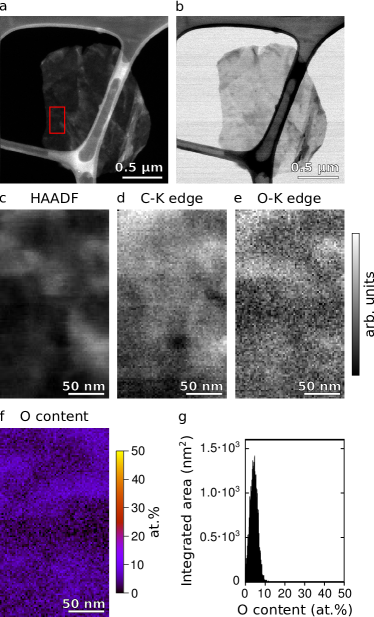
STEM images and spectroscopic analysis from RGO are shown in Fig.3. HAADF and BF images of the whole flake are shown in Fig.3.a-b. A spectrum image has been collected over the region marked in Fig.3.a, over an area of about nm2. Acquisition parameters were as follows: 3 nm spatial resolution, 11 pA current, and 0.04 s integration time, for a total electron dose per spectrum of e-Å-2. Fig.3.c-g shows the associated HAADF image, the integrated K-shell ionization edges maps of carbon and oxygen, the quantification map of oxygen relative to carbon, and its associated image histogram. As in GO, the carbon and oxygen K-edge integrated intensity maps appear mainly noncorrelated. Weak correlations appear occasionally, not systematically, in some limited areas. Namely, in the central region of the spectrum image the carbon K-edge intensity is almost constant, while the oxygen K-edge signal varies and may be responsible for the contrast variation in the HAADF image. The distribution of oxygen forms patches few tens of nanometers wide ( Fig.3.e-f) that correspond to an unimodal distribution centered at about 5 at.% ( Fig.3.g), with a local upper limit of 12 at.% (local residual oxygen up to 20 at.% has been observed in other flakes, over limited regions). These values are situated in the range of spatially averaged oxygen quantifications reported in the literature.Eda and Chhowalla (2010); Dreyer et al. (2010); Loh et al. (2010); Mao et al. (2012)
Core EELS Fine Structures.
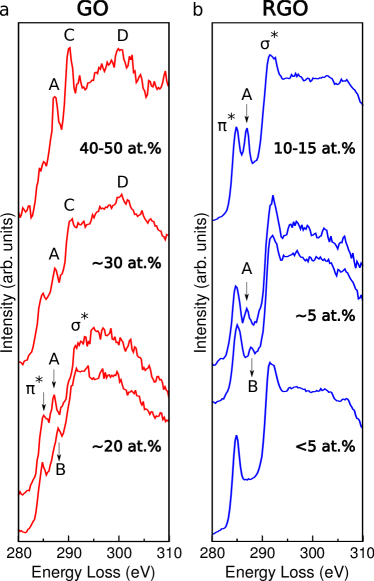
Besides oxygen quantification, coordination states and chemical bonds for different oxidation phases can be extracted from spectrum images through Energy-Loss Near-Edge Structures analysis. The spatial resolution of the spectrum images has been optimized for elemental analysis; the higher S/N ratio required for fine structure investigation can be obtained by integrating the spectrum images over regions few tens of nanometers wide, having a uniform oxygen content. In Fig.4 we present fine structures at the carbon K-edge that are representative of particular ranges of oxygen content. Fig.4.a shows the fine structure signatures observed in GO areas characterized by 10 to 50 oxygen at.%. In both spectra corresponding to low oxygen concentration (20 at.%), the and signatures associated with sp2 carbon are visible respectively at 285.0 eV and 292.7 eV.El-Barbary et al. (2006) Two additional peaks at 287.2 (A) and 288.2 eV (B) could be isolated over two distinct areas of GO (in this particular case showing 20 and 25 oxygen at.%, respectively). These features generally show a feeble intensity and can appear simultaneously in the same spectrum, resulting in mixed features that can hardly be identified. In GO regions containing 30 oxygen at.%, the intensity of the peak lowers, while the 287.2 eV peak (A) remains intense (32 oxygen at.% for the here reported spectrum). An additional feature rises at 290.1 eV (C) followed by a broad triangular-shaped signal at about 300 eV (D). For higher oxidized GO regions (40-50 at.%, the reported spectrum corresponding to 40%), the peak further lowers, while the peaks at 287.2 eV (A) and 290.1 eV (C) get stronger and very well-defined. The 290.1 eV peak appears particularly sensitive to irradiation damages, as shown by Fig.1.c.
After reduction ( Fig.4.b) the sharpness of the and peaks, with a trace of excitonic feature at 291.6 eV Ma et al. (1993); Brühwiler et al. (1995), reveals a very good recovery of the graphitic network. An additional well-defined peak at 287.2 eV (A) is observed (the two spectra shown correspond to 7 oxygen at.% and 12 at.%). Rarely and in some limited regions, other weak fine structure peaks have been distinguished, i.e. peak B (5 oxygen at.%). These A and B spectral features are below the detection limit for lower oxygen concentrations.
These results show that specific near-edge fine structures and thus coordination states of the carbon atoms correspond to different oxidation rates. The energies of EELS peaks in Fig.4 are compatible with previous XANES results which however could not separate the specific near-edge fine structures shown here due to spatial averaging over wide regions with different oxygen levels. Absorption peaks indicated as A-C had been attributed in the literature to C-O symmetry antibonds: lower energy peaks to single bonds and higher energy peaks to double bonds. More precisely, hydroxyl groups had been generally associated with peak A, epoxide groups to peak A or B, and carbonyl and carboxyl groups to peak B or C.Jeong et al. (2008); Ganguly et al. (2011); Zhan et al. (2011); Zhou et al. (2011); Lee et al. (2012, 2013); Chuang et al. (2014) In the region, carbonyl groups have been related to peak D.Ganguly et al. (2011); Pacilé et al. (2011) In a recent STEM-EELS investigation a shallow peak A has been observed at the carbon K-edge and assigned to epoxide, while no peak C has been detected.D’Angelo et al. (2015) These assignments, still largely debated, have been obtained by comparison with reference spectroscopic signatures of aromatic moleculesFrancis and Hitchcock (1992); Christl and Kretzschmar (2007) or spectra simulations on hypothetical GO atomic structures.Hunt et al. (2014); D’Angelo et al. (2015) However, as shown a number of times by numerical simulations, Boukhvalov and Katsnelson (2008); Lahaye et al. (2009); Ghaderi and Peressi (2010); Wang et al. (2010); Lu et al. (2011) the spatial configuration of functional groups within (R)GO deeply affects their orbital associated energies, and these might strongly differ from those of the same groups within molecules. Moreover, the sensitivity of the material suggests the need of caution while comparing spectroscopic results. In particular, the illumination conditions can induce changes in the relative intensity of fine structure peaks by transformation of the functional groups (possibly hydroxyls into epoxides) or selective sputtering of the oxygen groups.
Structural Model.
The structure of GO can be revisited on the basis of the here reported spatially resolved spectroscopic results. Several complex atomic models for GO have been proposed in the last 20 years. Eda and Chhowalla (2010); Dreyer et al. (2010); Loh et al. (2010); Mao et al. (2012) Oxygen adsorption is usually described in terms of the basic functional groups of epoxide, hydroxyl, carbonyl (-CO) and carboxyl (-COOH). The last two groups involve multiple bonding with a single carbon atom, which can occur at edges or at defects within the graphene lattice. On the contrary, a complete and in principle reversible functionalization of a perfect graphene network can be achieved with epoxides and hydroxyls, resulting in a C/O ratio of 2:1 (33 oxygen at.%) for solely epoxides functionalization, 1:1 (50 oxygen at.%) for solely hydroxyls functionalization, and intermediate values for mixed structures. Up to now, the Lerf-Klinowski modelLerf et al. (1998) has been the most referred to. In this representation, different oxygen groups are randomly distributed on both sides of the carbon sheets, with coexisting graphitic and oxidized regions, thus forming a partially functionalized structure. Hydroxyls and epoxides are supposed to be the dominant groups on the basal plane, while carboxyls are expected to fill carbon dangling bonds at the sheet edges and vacancy sites.Lerf et al. (1998) Carbonyl groups as ketones and/or quinones are also generally expected at the plane edges. A high proximity among hydroxyls and epoxides and the presence of five- and six-membered lactols and ester carbonyls have been proposed on the basis of NMR studies.Casabianca et al. (2010); Gao et al. (2009) With respect to our experimental observation, the Lerf-Klinowski model is consistent with GO regions with a 20 oxygen at.% content, but cannot account for the much higher oxygen concentration locally observed by EELS (45 at.%).
The presence of water molecules in the atomic structure of GO is still under debate. Water molecules are expected to form hydrogen bonds with oxygen functional groups on GO.Lerf et al. (1998) We expect reasonably that any possible intercalated water would have been removed from the here observed flakes, during the preparation process. Indeed, differently from the common protocol where GO is directly deposited on a substrate as a water dispersion, in this work we employed dried GO which was successively redispersed in ethanol and ultrasonicated. Moreover observation conditions involve high vacuum levels ( mbar), resulting in evaporation of residual water molecules. On the basis of these considerations we expect a negligible amount of water. This hypothesis is corroborated by our observed EELS fine structures. Indeed, the strong intensity and sharpness of the fine structure peaks at the carbon K-edge correlated with a high oxygen content ( Fig.4.a) suggest that a significant amount of carbon atoms is involved in a specific kind of carbon-oxygen bond. Thus, the 45 oxygen at.% in GO cannot arise from intercalated water and should be ascribed to oxygen directly bound to carbon.
Recently it has also been proposed that the GO surface could be decorated by strongly bound highly oxidized debris coming from the oxidation process. Rourke et al. (2011) In the present work, an important contribution of such debris to the calculated oxygen content is not compatible with our spectroscopic investigations: their presence would result in an increase of intensity in the K-edge maps of both oxygen and carbon (as an additional GO layer) and hence in a correlation between the two maps, which is not observed in Fig.2.d-e. Moreover, the highly oxidized residues could contain at most 50 oxygen at.%, considering a fully functionalized structure (hydroxyls on the basal plane and carbonyls-carboxyls at the edges, as discussed above). In Fig.2.g the local oxygen content reaches almost 50 at.% and represents an integrated measurement over the flake thickness: even assuming the presence of debris, the underlying GO layer(s) has to be necessarily almost 50 at.% oxidized. This experimental evidence reinforces the criticism recently raised against the debris GO model. Dimiev and Polson (2015)
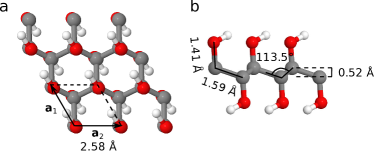
First principle simulations have shown that in GO there is a strong driving force toward a phase separation in fully functionalized regions (epoxides and/or hydroxyls) and pristine graphene regions.Yan et al. (2009); Wang et al. (2010); Ghaderi and Peressi (2010); Zhou and Bongiorno (2013) The limit of 50 at.% local oxygen concentration observed in this work is not consistent with a full functionalization dominated by epoxides, since the oxygen content would tend to 33 at.%. A large presence of carboxyl and carbonyl groups should also be excluded, because such a highly defective structure could hardly be reduced to a highly graphitic arrangement compatible with the carbon K-edge fine structures observed in RGO flakes. GO containing almost 50 at.% of oxygen and converting into a highly graphitic structure when reduced can be explained only by an almost hydroxyl saturated graphene lattice. This limit structure is analogous to graphaneElias et al. (2009) (i.e., hydrogen saturated graphene), and hydroxyl groups should alternate at the two sides of the carbon plane in order to minimize strain.Boukhvalov and Katsnelson (2008); Yan and Chou (2010) This limit configuration is presented in Fig.5 after optimization by DFT-LDA. The graphene network is shown to be strongly distorted, with carbon atoms puckered out of plane by about 0.26 Å leading to a change of their hybridization state from pure sp2 to partial sp3. In contrast with graphane, where the sp3 carbon hybridization reduces the in plane cell parameter (2.42 Å),Elias et al. (2009) we obtain an increased cell parameter of 2.58 Å, (about 5% higher than DFT-LDA optimized graphene) and a C-C bond length higher than diamond (1.59 Å). Oxygen steric hindrance and hydrogen bonding between neighboring groups forming hydroxyl chains are responsible for this in plane expansion as for graphene edges functionalized by hydroxyl groups where the accumulated strain is released via the formation of static out-of-plane ripples.Wagner et al. (2011) It might be challenging to directly observe this lattice expansion through diffraction because uniform and continuous highly functionalized domains are of little extension. Furthermore, the accurate determination of the unit cell parameter by electron diffraction is a nontrivial technique itself, for in 2D materials the reciprocal space of monolayers consists of rods and thus the total intensity of the diffraction spots changes little as a function of the tilt angle, while the spots broadening is important. Meyer et al. (2007)
EELS fine structures for highly oxidized GO (30-50 oxygen at.%, Fig.4.a) can thus be interpreted in the limit of this hydroxyl saturated graphene model. The extremely low intensity of the peak can be ascribed to the loss of sp2 hybridization at carbon atoms. The 287.2 eV peak (A), which is observed also for lower oxygen rates, can be assigned to C-OH antibonds, in agreement with previous XANES works.Lee et al. (2012, 2013); Chuang et al. (2014) The peak at 290.1 eV (C) cannot be associated with C-O antibonds of other oxygen functional groups, because they are expected to be present only in a small amount and this is not compatible with the strong intensity of the peak. Nevertheless, the interpretation of this feature remains unclear.
Fine structures for lower oxidation rates (10-30 oxygen at.%, Fig.4.a) are much less defined. This can be due to a higher variety of functional groups and the high number of possible configurations that they can assume at the graphene network. The presence of the peak and of a weak sp2 peak infers a limited presence of nonfunctionalized carbons. Aside from peak A ascribed to hydroxyl groups, peak B can be attributed to epoxide groups. After reduction the very intense and sharp peak A observed at higher residual oxygen regions ( Fig.4.c, 15 oxygen at.%) would then correspond to the presence of solely hydroxyl groups. This interpretation is compatible with the identification of several simple reaction routes for epoxide reduction by hydrazine, while hydroxyl removal mechanisms are still debated.Stankovich et al. (2007); Gao et al. (2010) Considering the same assignments as in GO, the weak peak B in RGO indicates a small residual amount of epoxides. Again, the difference in the intensity of features A and B can derive from their relative amount (hydroxyl probably remain the dominant species also after reduction) and the different number of configurations that these functional groups can form at the carbon network.
Conclusion
In conclusion we have investigated the oxygen distribution in GO and RGO by core EELS spectroscopy in a STEM microscope. A spatial resolution of 3 nm for spectrum images has been achieved by reducing radiation damage through optimized acquisition conditions and an experimental setup combining a low noise CCD detection camera with a liquid nitrogen cooled sample stage. Previous spectroscopic quantifications have provided only overall oxygen contents, and GO and RGO have been often described as chemically homogeneous materials at a nanometric scale. We have shown that within individual flakes the oxygen content strongly varies, forming homogeneous domains with a lateral side of few tens of nanometers. In GO different oxidation levels have been identified, with a maximum local concentration of almost 50 at.% of oxygen, corresponding to a C/O ratio of 1:1. In RGO the residual oxygen mainly concentrates in domains with about 5 oxygen at.%. Specific fine structures at the carbon K-edge can be clearly associated with different oxidation phases. Highly oxidized GO displays a shallow graphitic signature with extremely intense and sharp additional peaks, not observed before. In RGO the graphitic character is extensively recovered with weakened additional features. The assignment of the spectroscopic peaks is still debated in the literature, and the previously proposed mixed epoxides-hydroxyls atomic model for GO cannot account for the highest oxygen concentrations observed in this work. We propose a limit structural model for these highly oxidized regions, in which all carbon atoms are functionalized with -OH groups, leading to an sp3 carbon 2D material analogous to graphane. A strong signature for -OH antibonds can then be identified in GO carbon near-edge fine structures. In RGO, a sharp -OH antibond peak, localized at highest oxidized regions, infers that this group is the dominant surviving species.
The presence of domains fully covered with hydroxyl groups has critical implications for the engineering of the electronic structure of individual flakes. Indeed, it strongly affects the hydrophilicity of the flakes and the interaction with molecules from the gas and vapor phase.Rezania et al. (2014) Furthermore, the presence of a dense hydroxyl layer on (R)GO sheets has important consequences for the anchoring of metal and ceramic nanoparticles or biomolecules and the assembly of individual flakes into corresponding macroscopic forms.Núñez et al. (2014)
Acknowledgements
A.T., A.Z. and O.S. acknowledge support from the Agence Nationale de la Recherche (ANR), program of future investment TEMPOS-CHROMATEM (No. ANR-10-EQPX-50). The work has also received funding from the European Union in Seventh Framework Programme (No. FP7/2007 -2013) under Grant Agreement No. n312483 (ESTEEM2). A.M.B. and W.K.M. are grateful for financial support from the Spanish Ministry MINECO and the European Regional development Fund (project ENE2013-48816-C5-5-R) and from the Regional Government of Aragon and the European Social Fund (DGA-ESF-T66 Grupo Consolidado). The authors are grateful to P. Launois, S. Rouziere, and C. P. Ewels for useful discussions.
References
- Eda and Chhowalla (2010) G. Eda and M. Chhowalla, Adv. Mater. 22, 2392 (2010).
- Dreyer et al. (2010) D. R. Dreyer, S. Park, C. W. Bielawski, and R. S. Ruoff, Chem. Soc. Rev. 39, 228 (2010).
- Loh et al. (2010) K. P. Loh, Q. Bao, G. Eda, and M. Chhowalla, Nat. Chem. 2, 1015 (2010).
- Mao et al. (2012) S. Mao, H. Pu, and J. Chen, RSC Adv. 2, 2643 (2012).
- Brodie (1859) B. C. Brodie, Philos. T. R. Soc. Lon. 149, 249 (1859).
- Staudenmaier (1898) L. Staudenmaier, Ber. Dtsch. Chem. Ges. 31, 1481 (1898).
- Hummers and Offeman (1958) W. S. Hummers and R. E. Offeman, J. Am. Chem. Soc. 80, 1339 (1958).
- Pei and Cheng (2012) S. Pei and H.-M. Cheng, Carbon 50, 3210 (2012).
- Lerf et al. (1998) A. Lerf, H. He, M. Forster, and J. Klinowski, J. Phys. Chem. B 102, 4477 (1998).
- Kim et al. (2012) S. Kim, S. Zhou, Y. Hu, M. Acik, Y. J. Chabal, C. Berger, W. de Heer, A. Bongiorno, and E. Riedo, Nat. Mater. 11, 544 (2012).
- Zhou and Bongiorno (2013) S. Zhou and A. Bongiorno, Sci. Rep. 3, 2484 (2013).
- Eigler et al. (2012) S. Eigler, C. Dotzer, A. Hirsch, M. Enzelberger, and P. Müller, Chem. Mater. 24, 1276 (2012).
- Dimiev et al. (2013) A. M. Dimiev, L. B. Alemany, and J. M. Tour, ACS Nano 7, 576 (2013).
- Wilson et al. (2009) N. R. Wilson, P. A. Pandey, R. Beanland, R. J. Young, I. A. Kinloch, L. Gong, Z. Liu, K. Suenaga, J. P. Rourke, S. J. York, and J. Sloan, ACS Nano 3, 2547 (2009).
- Erickson et al. (2010) K. Erickson, R. Erni, Z. Lee, N. Alem, W. Gannett, and A. Zettl, Adv. Mater. 22, 4467 (2010).
- Gómez-Navarro et al. (2010) C. Gómez-Navarro, J. C. Meyer, R. S. Sundaram, A. Chuvilin, S. Kurasch, M. Burghard, K. Kern, and U. Kaiser, Nano Lett. 10, 1144 (2010).
- Pacilé et al. (2011) D. Pacilé, J. Meyer, A. Fraile Rodríguez, M. Papagno, C. Gómez-Navarro, R. Sundaram, M. Burghard, K. Kern, C. Carbone, and U. Kaiser, Carbon 49, 966 (2011).
- Egerton (2011) R. F. Egerton, Electron energy-loss spectroscopy in the electron microscope, 3rd ed. (Springer, New York, 2011).
- Mkhoyan et al. (2009) K. A. Mkhoyan, A. W. Contryman, J. Silcox, D. A. Stewart, G. Eda, C. Mattevi, S. Miller, and M. Chhowalla, Nano Lett. 9, 1058 (2009).
- D’Angelo et al. (2015) D. D’Angelo, C. Bongiorno, M. Amato, I. Deretzis, A. La Magna, G. Compagnini, S. F. Spanò, and S. Scalese, Carbon 93, 1034 (2015).
- Egerton (2013) R. Egerton, Ultramicroscopy 127, 100 (2013).
- Vallés et al. (2012) C. Vallés, J. David Núñez, A. M. Benito, and W. K. Maser, Carbon 50, 835 (2012).
- Stankovich et al. (2007) S. Stankovich, D. A. Dikin, R. D. Piner, K. A. Kohlhaas, A. Kleinhammes, Y. Jia, Y. Wu, S. T. Nguyen, and R. S. Ruoff, Carbon 45, 1558 (2007).
- Egerton (1980) R. Egerton, Ultramicroscopy 5, 521 (1980).
- van Schooneveld et al. (2010) M. M. van Schooneveld, A. Gloter, O. Stephan, L. F. Zagonel, R. Koole, A. Meijerink, W. J. M. Mulder, and F. M. F. de Groot, Nat. Nanotechnol. 5, 538 (2010).
- Bertoni and Verbeeck (2008) G. Bertoni and J. Verbeeck, Ultramicroscopy 108, 782 (2008).
- de la Peña et al. (2011) F. de la Peña, M.-H. Berger, J.-F. Hochepied, F. Dynys, O. Stephan, and M. Walls, Ultramicroscopy 111, 169 (2011).
- de la Peña et al. (2015) F. de la Peña, P. Burdet, M. Sarahan, M. Nord, T. Ostasevicius, J. Taillon, A. Eljarrat, S. Mazzucco, V. T. F. G. Donval, L. F. Zagonel, I. Iyengar, and M. Walls, “Hyperspy 0.8,” (2015).
- Jones and Briddon (1998) R. Jones and P. R. Briddon, in Semiconductors and Semimetals, Identification of Defects in Semiconductors, Vol. 51, Part A, edited by M. Stavola (Elsevier, 1998) pp. 287–349.
- Rayson and Briddon (2008) M. Rayson and P. Briddon, Comput. Phys. Commun. 178, 128 (2008).
- Hartwigsen et al. (1998) C. Hartwigsen, S. Goedecker, and J. Hutter, Phys. Rev. B 58, 3641 (1998).
- Dimiev and Tour (2014) A. M. Dimiev and J. M. Tour, ACS Nano 8, 3060 (2014).
- El-Barbary et al. (2006) A. A. El-Barbary, S. Trasobares, C. P. Ewels, O. Stephan, A. V. Okotrub, L. G. Bulusheva, C. J. Fall, and M. I. Heggie, J. Phys. Conf. Ser. 26, 149 (2006).
- Ma et al. (1993) Y. Ma, P. Skytt, N. Wassdahl, P. Glans, J. Guo, and J. Nordgren, Phys. Rev. Lett. 71, 3725 (1993).
- Brühwiler et al. (1995) P. A. Brühwiler, A. J. Maxwell, C. Puglia, A. Nilsson, S. Andersson, and N. Mårtensson, Phys. Rev. Lett. 74, 614 (1995).
- Jeong et al. (2008) H.-K. Jeong, H.-J. Noh, J.-Y. Kim, M. H. Jin, C. Y. Park, and Y. H. Lee, EPL 82, 67004 (2008).
- Ganguly et al. (2011) A. Ganguly, S. Sharma, P. Papakonstantinou, and J. Hamilton, J. Phys. Chem. C 115, 17009 (2011).
- Zhan et al. (2011) D. Zhan, Z. Ni, W. Chen, L. Sun, Z. Luo, L. Lai, T. Yu, A. T. S. Wee, and Z. Shen, Carbon 49, 1362 (2011).
- Zhou et al. (2011) J. G. Zhou, J. Wang, C. L. Sun, J. M. Maley, R. Sammynaiken, T. K. Sham, and W. F. Pong, J. Mater. Chem. 21, 14622 (2011).
- Lee et al. (2012) V. Lee, R. V. Dennis, B. J. Schultz, C. Jaye, D. A. Fischer, and S. Banerjee, J. Phys. Chem. C 116, 20591 (2012).
- Lee et al. (2013) D. Lee, J. Seo, X. Zhu, J. Lee, H.-J. Shin, J. M. Cole, T. Shin, J. Lee, H. Lee, and H. Su, Sci. Rep. 3, 2250 (2013).
- Chuang et al. (2014) C.-H. Chuang, Y.-F. Wang, Y.-C. Shao, Y.-C. Yeh, D.-Y. Wang, C.-W. Chen, J. W. Chiou, S. C. Ray, W. F. Pong, L. Zhang, J. F. Zhu, and J. H. Guo, Sci. Rep. 4, 4525 (2014).
- Francis and Hitchcock (1992) J. T. Francis and A. P. Hitchcock, J. Phys. Chem. 96, 6598 (1992).
- Christl and Kretzschmar (2007) I. Christl and R. Kretzschmar, Environ. Sci. Technol. 41, 1915 (2007).
- Hunt et al. (2014) A. Hunt, E. Z. Kurmaev, and A. Moewes, Adv. Mater. 26, 4870 (2014).
- Boukhvalov and Katsnelson (2008) D. W. Boukhvalov and M. I. Katsnelson, J. Am. Chem. Soc. 130, 10697 (2008).
- Lahaye et al. (2009) R. J. W. E. Lahaye, H. K. Jeong, C. Y. Park, and Y. H. Lee, Phys. Rev. B 79, 125435 (2009).
- Ghaderi and Peressi (2010) N. Ghaderi and M. Peressi, J. Phys. Chem. C 114, 21625 (2010).
- Wang et al. (2010) L. Wang, Y. Y. Sun, K. Lee, D. West, Z. F. Chen, J. J. Zhao, and S. B. Zhang, Phys. Rev. B 82, 161406 (2010).
- Lu et al. (2011) N. Lu, D. Yin, Z. Li, and J. Yang, J. Phys. Chem. C 115, 11991 (2011).
- Casabianca et al. (2010) L. B. Casabianca, M. A. Shaibat, W. W. Cai, S. Park, R. Piner, R. S. Ruoff, and Y. Ishii, J. Am. Chem. Soc. 132, 5672 (2010).
- Gao et al. (2009) W. Gao, L. B. Alemany, L. Ci, and P. M. Ajayan, Nat. Chem. 1, 403 (2009).
- Rourke et al. (2011) J. P. Rourke, P. A. Pandey, J. J. Moore, M. Bates, I. A. Kinloch, R. J. Young, and N. R. Wilson, Angew. Chem., Int. Ed. 50, 3173 (2011).
- Dimiev and Polson (2015) A. M. Dimiev and T. A. Polson, Carbon 93, 544 (2015).
- Yan et al. (2009) J.-A. Yan, L. Xian, and M. Y. Chou, Phys. Rev. Lett. 103, 086802 (2009).
- Elias et al. (2009) D. C. Elias, R. R. Nair, T. M. G. Mohiuddin, S. V. Morozov, P. Blake, M. P. Halsall, A. C. Ferrari, D. W. Boukhvalov, M. I. Katsnelson, A. K. Geim, and K. S. Novoselov, Science 323, 610 (2009).
- Yan and Chou (2010) J.-A. Yan and M. Y. Chou, Phys. Rev. B 82, 125403 (2010).
- Wagner et al. (2011) P. Wagner, C. P. Ewels, V. V. Ivanovskaya, P. R. Briddon, A. Pateau, and B. Humbert, Phys. Rev. B 84, 134110 (2011).
- Meyer et al. (2007) J. C. Meyer, A. K. Geim, M. I. Katsnelson, K. S. Novoselov, T. J. Booth, and S. Roth, Nature 446, 60 (2007).
- Gao et al. (2010) X. Gao, J. Jang, and S. Nagase, J. Phys. Chem. C 114, 832 (2010).
- Rezania et al. (2014) B. Rezania, N. Severin, A. V. Talyzin, and J. P. Rabe, Nano Lett. 14, 3993 (2014).
- Núñez et al. (2014) J. D. Núñez, A. M. Benito, R. González, J. Aragón, R. Arenal, and W. K. Maser, Carbon 79, 590 (2014).