Strong and Anisotropic Third Harmonic Generation in Monolayer and Multilayer ReS2
Abstract
We report observation of strong and anisotropic third harmonic generation (THG) in monolayer and multilayer ReS2. The third-order nonlinear optical susceptibility of monolayer ReS2, is on the order of m2/V2, which is about one order of magnitude higher than reported results for hexagonal-lattice transition metal dichalcogenides such as MoS2. A similar magnitude for the third-order nonlinear optical susceptibility was also obtained for a multilayer sample. The intensity of the THG field was found to be dependent on the direction of the incident light polarization for both monolayer and multilayer samples. A point group symmetry analysis shows that such anisotropy is not expected from a perfect lattice, and must arise from the distortions in the ReS2 lattice. Our results show that THG measurements can be used to characterize lattice distortions of two-dimensional materials, and that lattice distortions are important for the nonlinear optical properties of such materials.
I Introduction
Transition metal dichalcogenides (TMDs) constitute a new generation of semiconducting materials. Their electronic and optical properties have been extensively studied since the discovery of the direct band gap in monolayer MoS2 in 2010 Mak et al. (2010); Splendiani et al. (2010), as understanding light-matter interactions in TMD monolayers is essential for developing applications in electronics, photonics, and optoelectronics. So far, ultrafast excitonic dynamics Wang et al. (2012), coupled spin-valley physics Xiao et al. (2012); Muniz and Sipe (2015), large exciton binding energies Chernikov et al. (2014); He et al. (2014), and nonlinear optical responses Kumar et al. (2013); Wang et al. (2013a); Torres-Torres et al. (2016); Wang et al. (2013b) in TMD monolayers have been well studied. It has been also shown that van der Waals heterostructures with different TMD monolayers can be constructed Geim and Grigorieva (2013) to realize devices with multiple functionalities.
After much effort, ReS2 has been identified as an anomalous member of the TMD family. In 2014, few-layer and bulk samples of ReS2 were reported to display monolayer behavior Tongay et al. (2014). Since then the optical and electrical properties of ReS2 have been intensively investigated. Coherent control of ballistic transport has been realized in bulk ReS2 Cui and Zhao (2015). The in-plane anisotropic optical and electrical properties of monolayer ReS2 have also been experimentally studied Chenet et al. (2015); Cui et al. (2015). A recent work has shown that stacking orders can be resolved by Raman spectroscopy, due to the unique crystal structure of ReS2 He et al. (2016). Based on these novel properties, a wide spectrum of applications using ReS2 has been proposed. Among them are energy storage devices Gao et al. (2016); Zhang et al. (2016), integrated digital converters Liu et al. (2015a), and sensitive photodetectors Yang et al. (2016); Zhang et al. (2015); Najmzadeh et al. (2016); Liu et al. (2015b). Thus ReS2 has not only become a unique platform for novel 2D physics, but also an unusual member of TMDs to construct van der Waals heterostructures.
Unlike the TMD monolayers based on Mo and W, which form in a hexagonal lattice, monolayer ReS2 has a stable distorted crystal lattice Murray et al. (1994). Re atomic chains formed by Re-Re bonding run along the direction of the -axis, enabling the in-plane anisotropy of electrical and optical response. However, to date there have been no reports of the nonlinear optical properties of ReS2. Since nonlinear optical properties are known to be extremely sensitive to the lattice symmetries Moss et al. (1989); Sipe et al. (1987), it is important to determine to what extent the lattice distortions of ReS2 affect its nonlinear optical properties.
In this paper, we report experimental results of third harmonic generation (THG) in monolayer and multilayer ReS2. We determine the third-order susceptibility of monolayer ReS2 and find that its magnitude is about one order of magnitude larger than those of hexagonal TMDs such as MoS2 Wang et al. (2013a). We also find that the third-order nonlinear response has strong in-plane anisotropies incompatible with an undistorted lattice.
The outline of the paper is the following: In Sec. II we describe the experimental setup and samples, and in Sec. III we discuss the expected features in the results for materials with a perfect lattice, and in Sec. IV we show the experimental results obtained for ReS2. We present the conclusions of this study in Sec. V.
II Experimental Setup and Samples
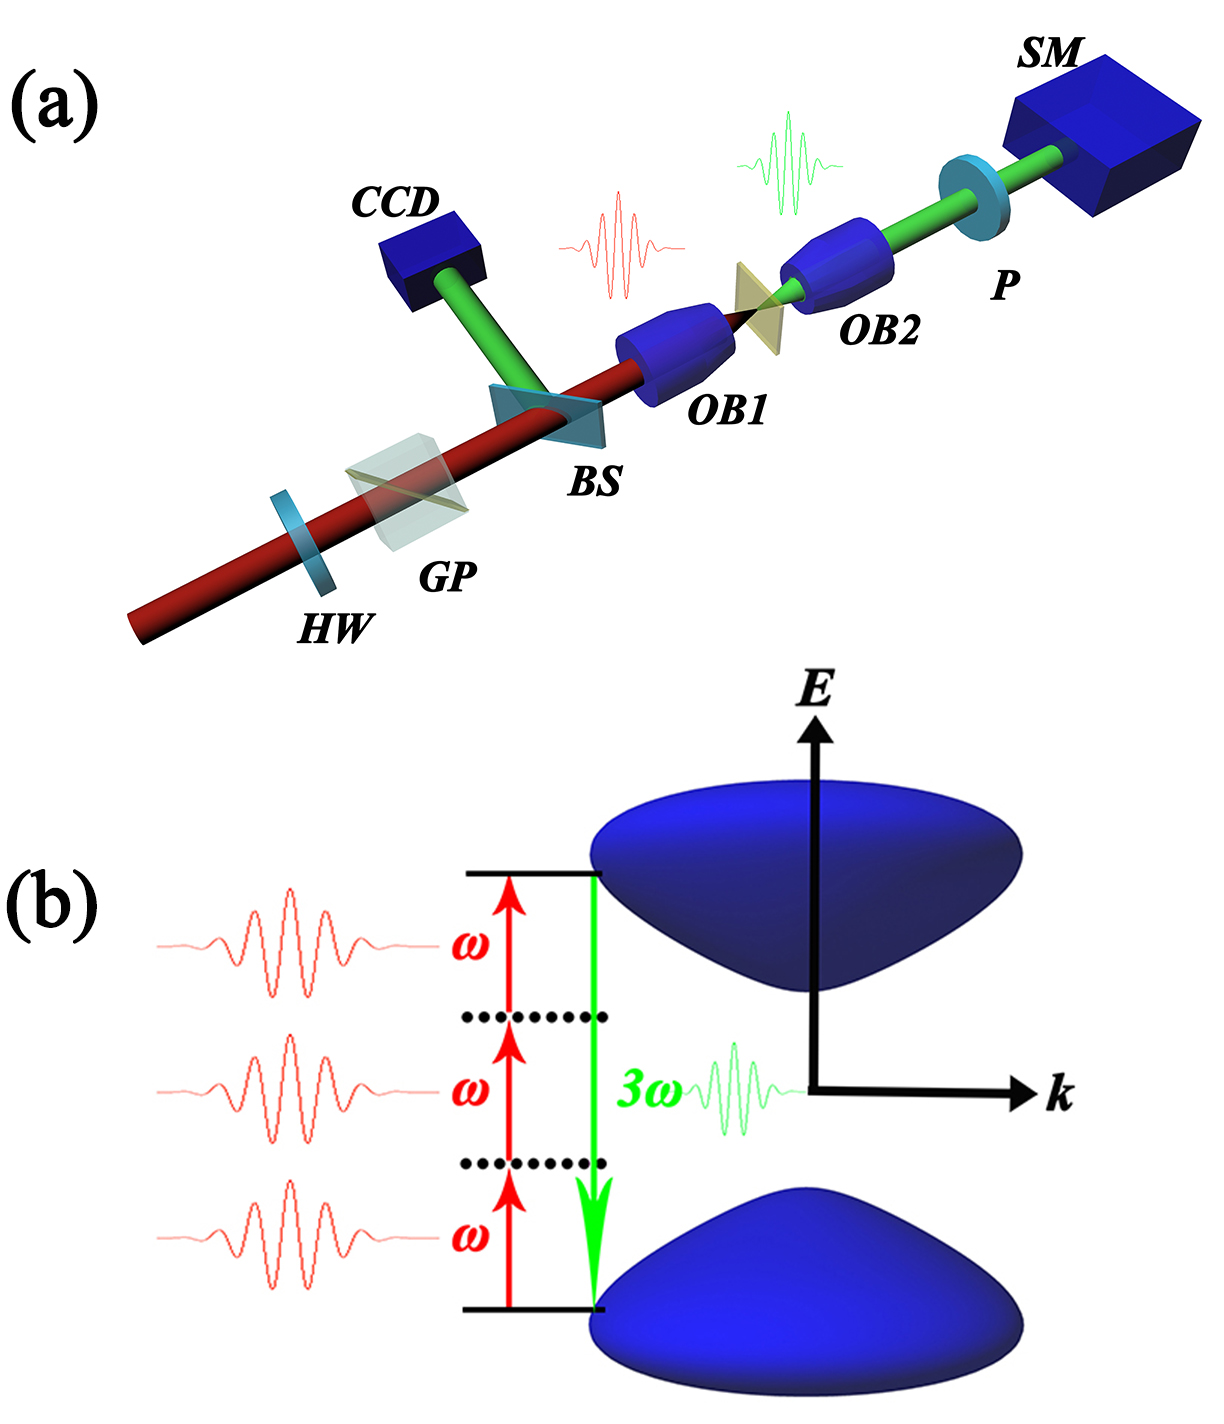
We use fs pulses generated from an optical parametric oscillator pumped by a Ti:sapphire near-infrared laser. As shown in Figure 1(a), a half wave plate (HW) and a Glan prism (GP) are used to adjust the power and the polarization direction of the fundamental pulses. The fundamental pulses at are tightly focused on the sample by an objective lens (OB1) with a numerical aperture (NA) of 0.42. The generated third harmonic pulses are collected by another objective lens (OB2) with the same NA. A spectrometer (SM) is employed to directly measure the power of the third harmonic pulses at , and a polarizer (P) before the spectrometer is used to resolve the horizontal and vertical components of the third harmonic pulses. A charge-coupled device (CCD), a beamsplitter (BS), and the OB1 serve as a microscope to monitor the focusing position on the sample by collecting the reflected light at .
Figure 1(b) shows a diagram of THG in monolayer ReS2 with a simplified band structure, where three photons at generate one photon at . The fundamental photon energy is about eV (1515 nm), while the energy of the generated photons is about eV (505 nm). Since the band gap of monolayer ReS2 is about 1.53 eV (810 nm), the fundamental pulse can not be absorbed by monolayer ReS2 via one-photon absorption. The ReS2 samples are fabricated on the surface of PDMS by mechanical exfoliation and transferred to a BK7 glass substrate about 0.48 mm thick Castellanos-Gomez et al. (2014). All measurements are carried out in ambient conditions.
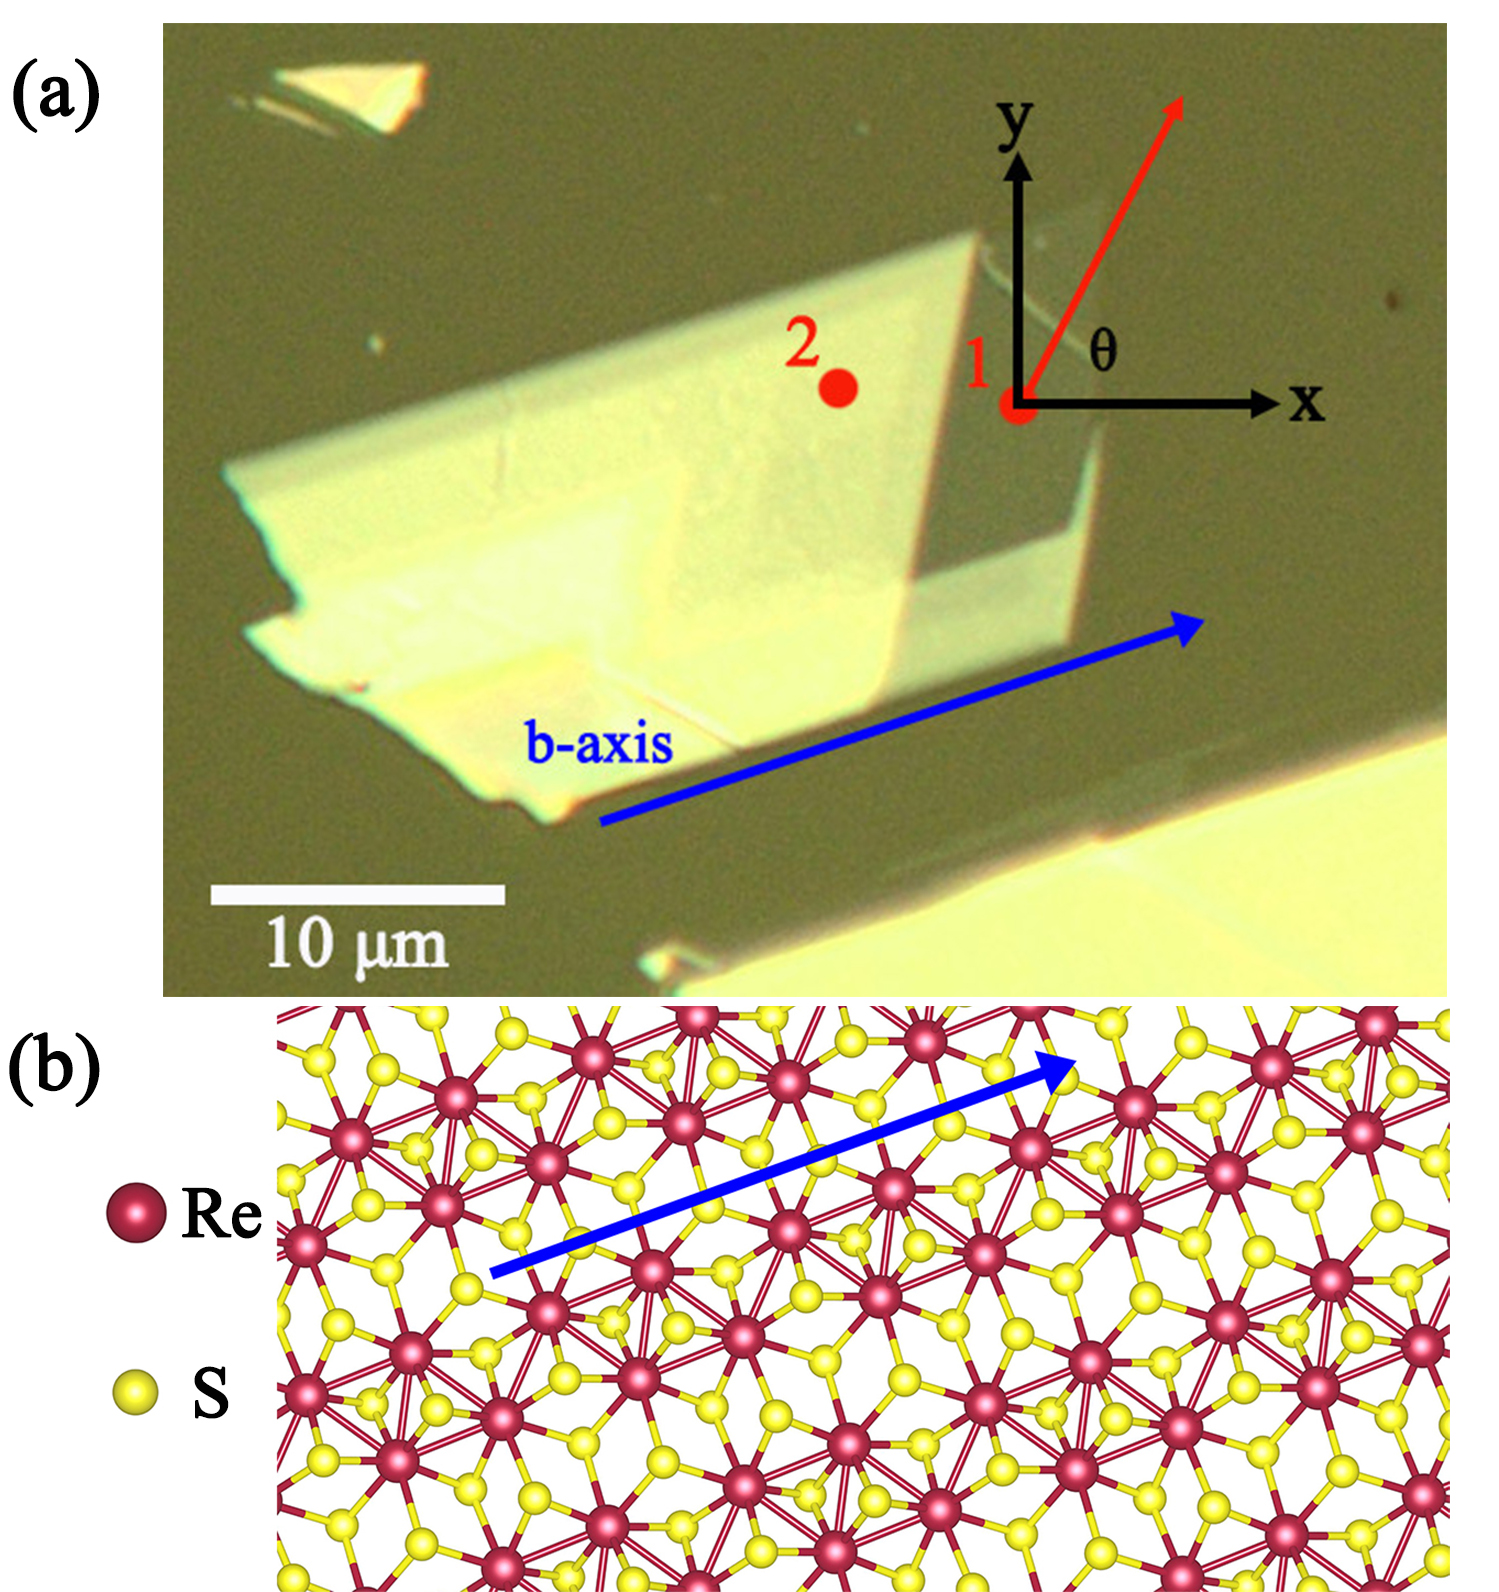
An optical microscope image of the monolayer ReS2 sample is shown in Figure 2(a), where the monolayer flake is attached to a multilayer. The red dots 1 and 2 in the same figure indicate the focused fundamental laser spots on the monolayer and multilayer, respectively. The figure also shows laboratory axes and , as well as the angle between the fundamental pulse polarization and the -axis. The lattice structure of ReS2 monolayer is depicted in Figure 2(b); Re atom chains are formed along the -axis direction, which is depicted by the blue arrow and experimentally determined by transient absorption measurement (see Supplemental Material). As shown in Figure 2(a), the -axis direction is along one of the two cracked edges of the flake.
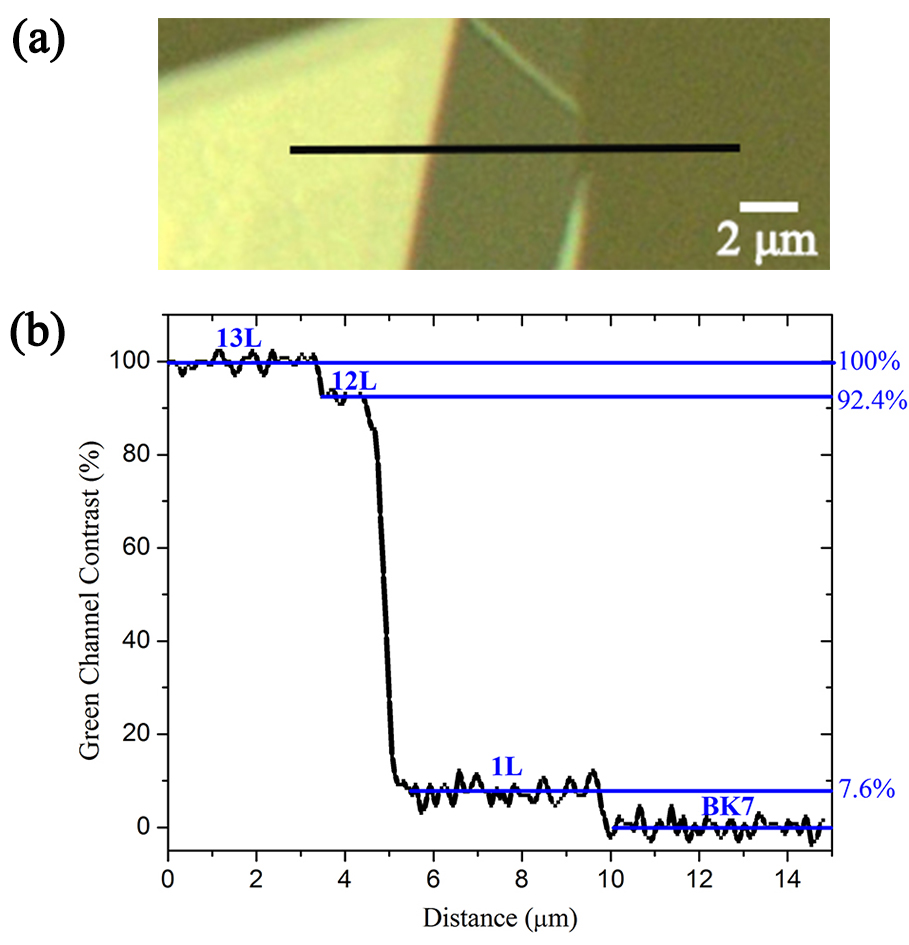
An optical contrast technique Aslan et al. (2015) is employed to determine the thickness of the samples. In Figure 3(a), the black line indicates a cross section of our monolayer and multilayer samples. As shown in Figure 3(b), the normalized optical contrast of the monolayer (1 L, 0.73 nm thick) and multilayer samples in the green channel are about 7.6 % and 100 %, respectively. Since each layer increases the optical contrast by roughly 7.6 %, the multilayer sample is identified as 13 L, which is about 9.5 nm thick. Similarly, the transition region with an optical contrast of is about 1 m wide and identified as 12 L.
III Point group symmetry analysis of THG in layered materials
In this section we carry out a point group symmetry analysis for the THG of undistorted layered materials; we use the lab coordinates shown in Figure 2(a).
The polarization associated with THG is determined by the third order susceptibility , which is a rank-4 tensor that respects the symmetries of the point group of the lattice, and the applied electric field , through
| (1) |
The electric field associated with the generated radiation is proportional to the polarization , so the intensity of the generated radiation is proportional to .
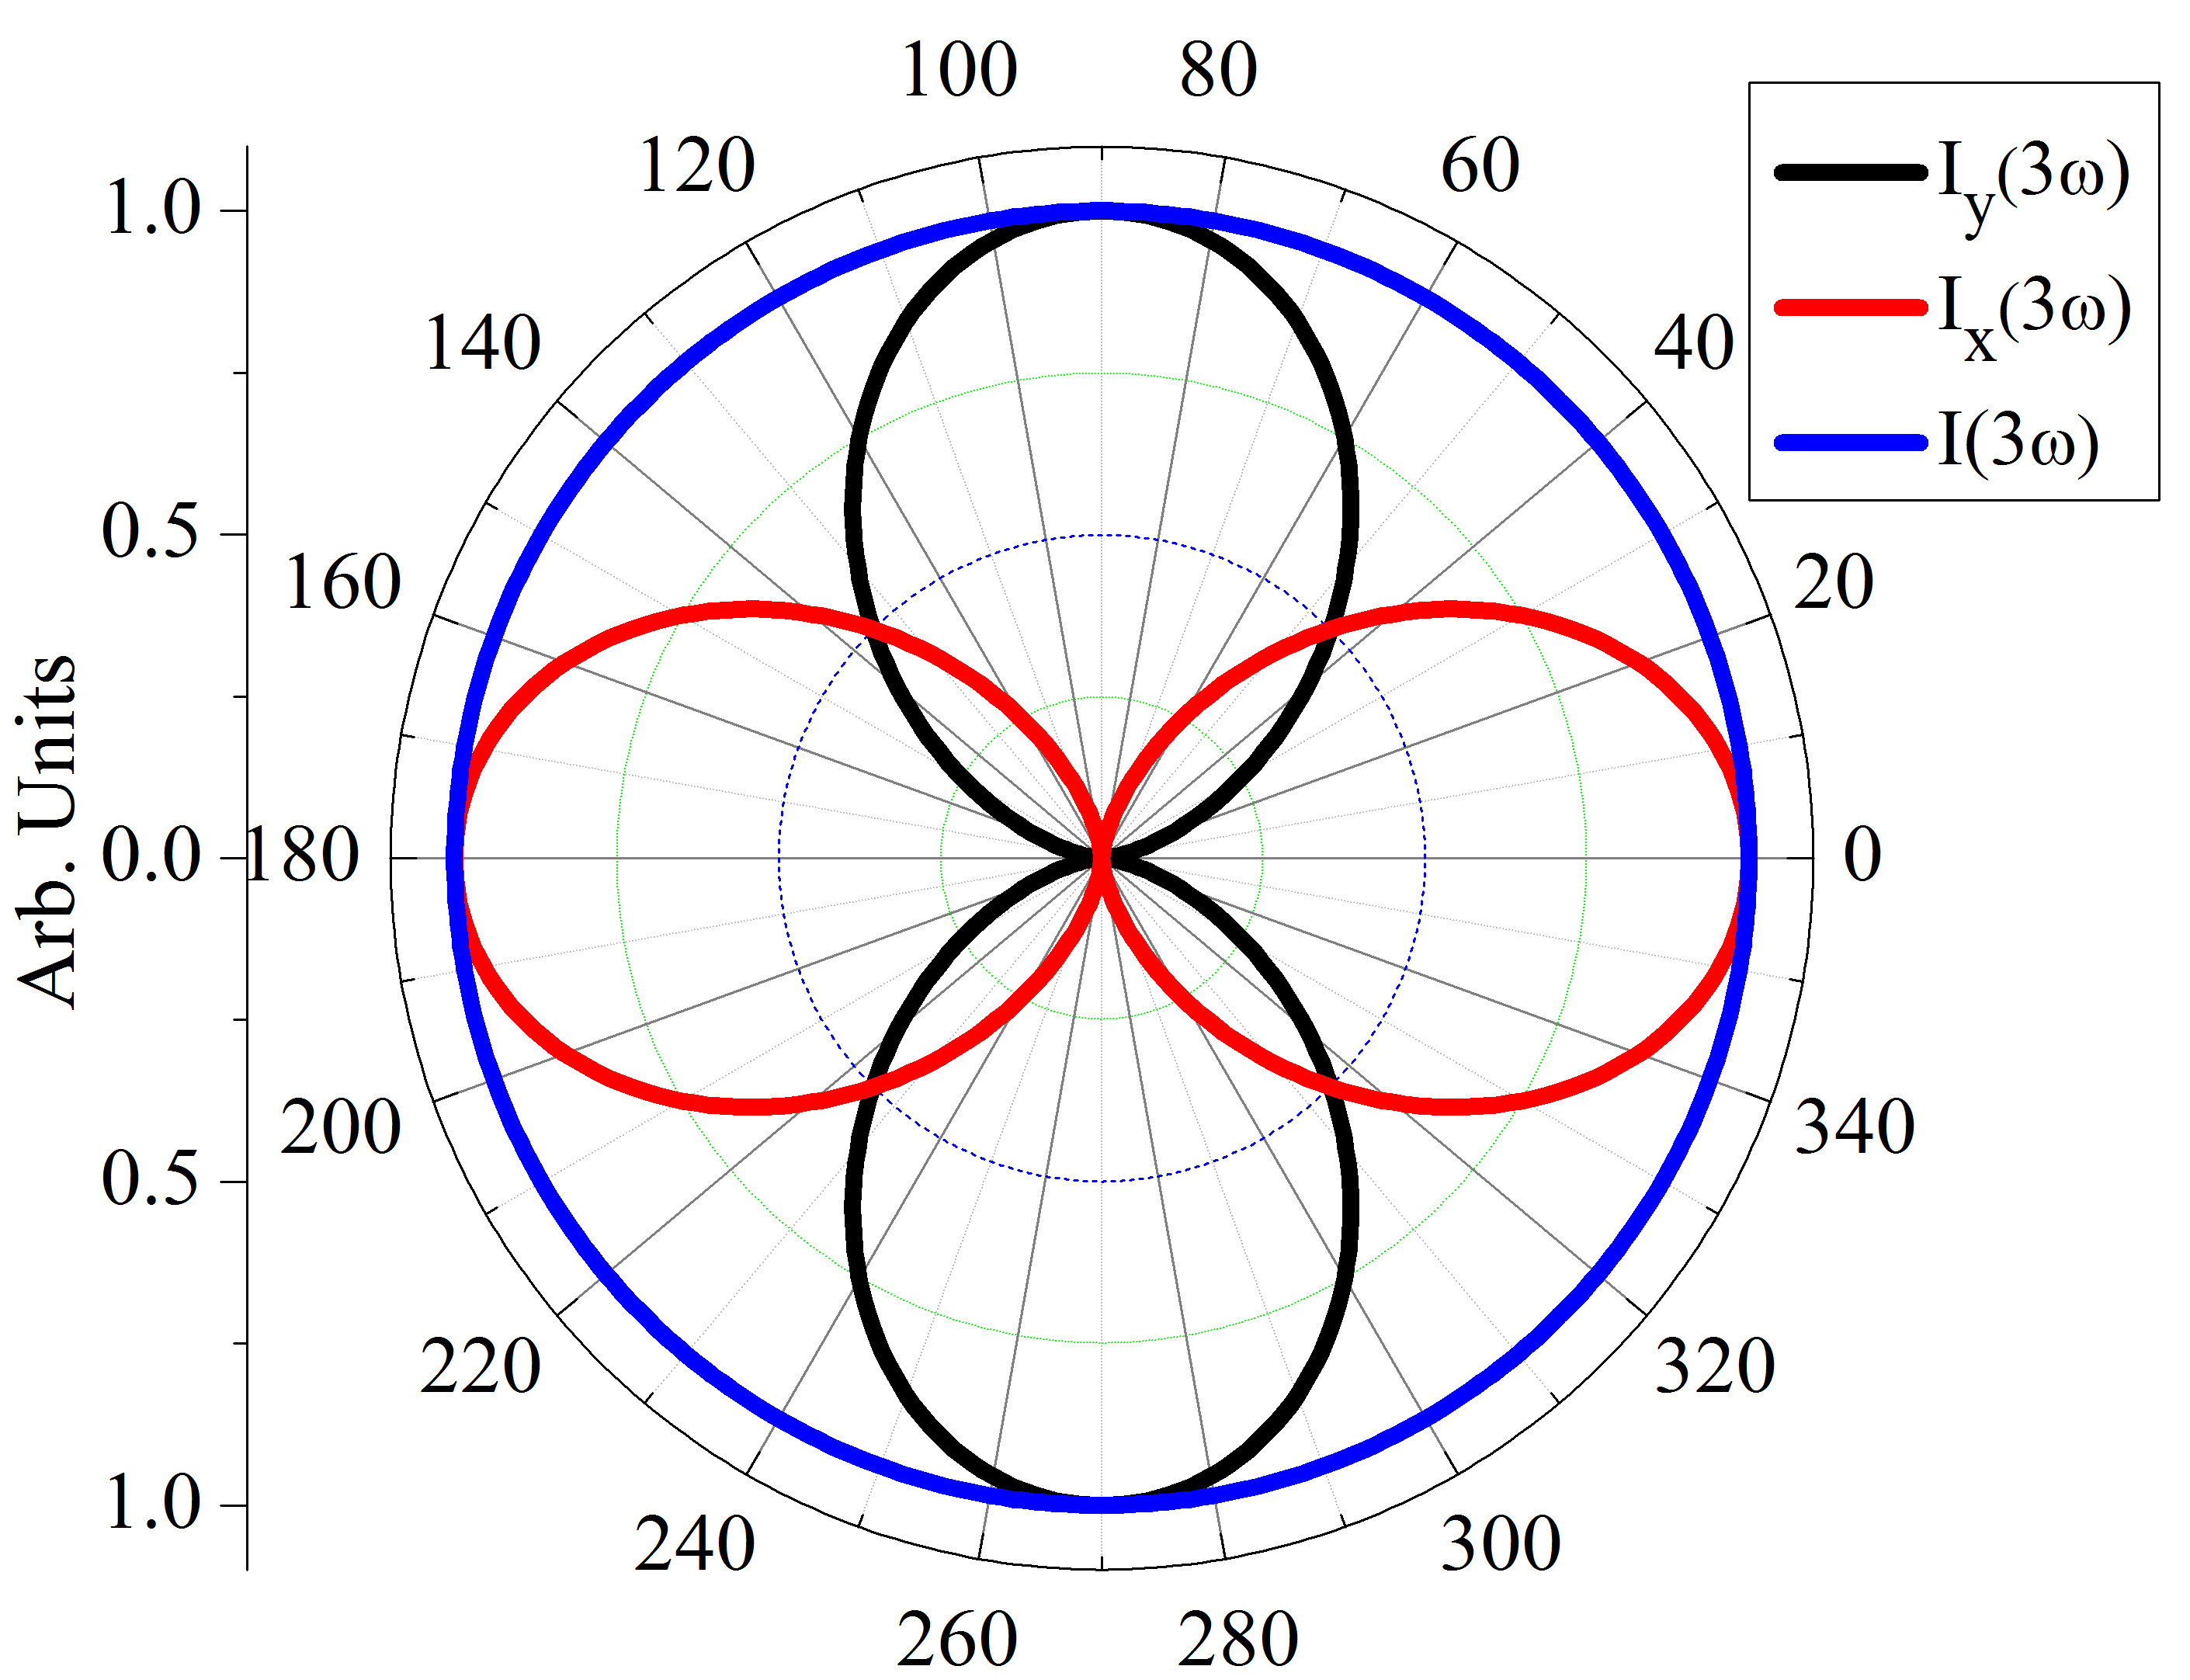
The point group of an undistorted lattice is (), but in the presence of a substrate the symmetry operations that act on the perpendicular axis are broken, and the point group is (). Only the planar components of are relevant for normal incidence, and there are only 3 such independent components for both point groups and , namely , and . Consequently, the THG has the same angular dependence regardless of the presence of the substrate. Describing the incident field as , the polarization associated with the THG field is given by
| (2) |
and the intensities of the THG fields horizontally and vertically polarized are
| (3) |
Thus the total intensity is independent of the polarization direction of the incident fields. The above expressions are plotted in Figure 4, which shows the isotropy of the total intensity of the THG from an undistorted lattice. Thus any anisotropy in the experimental results of the total THG for ReS2 is due to its lattice distortions.
IV Experimental Results and Discussion
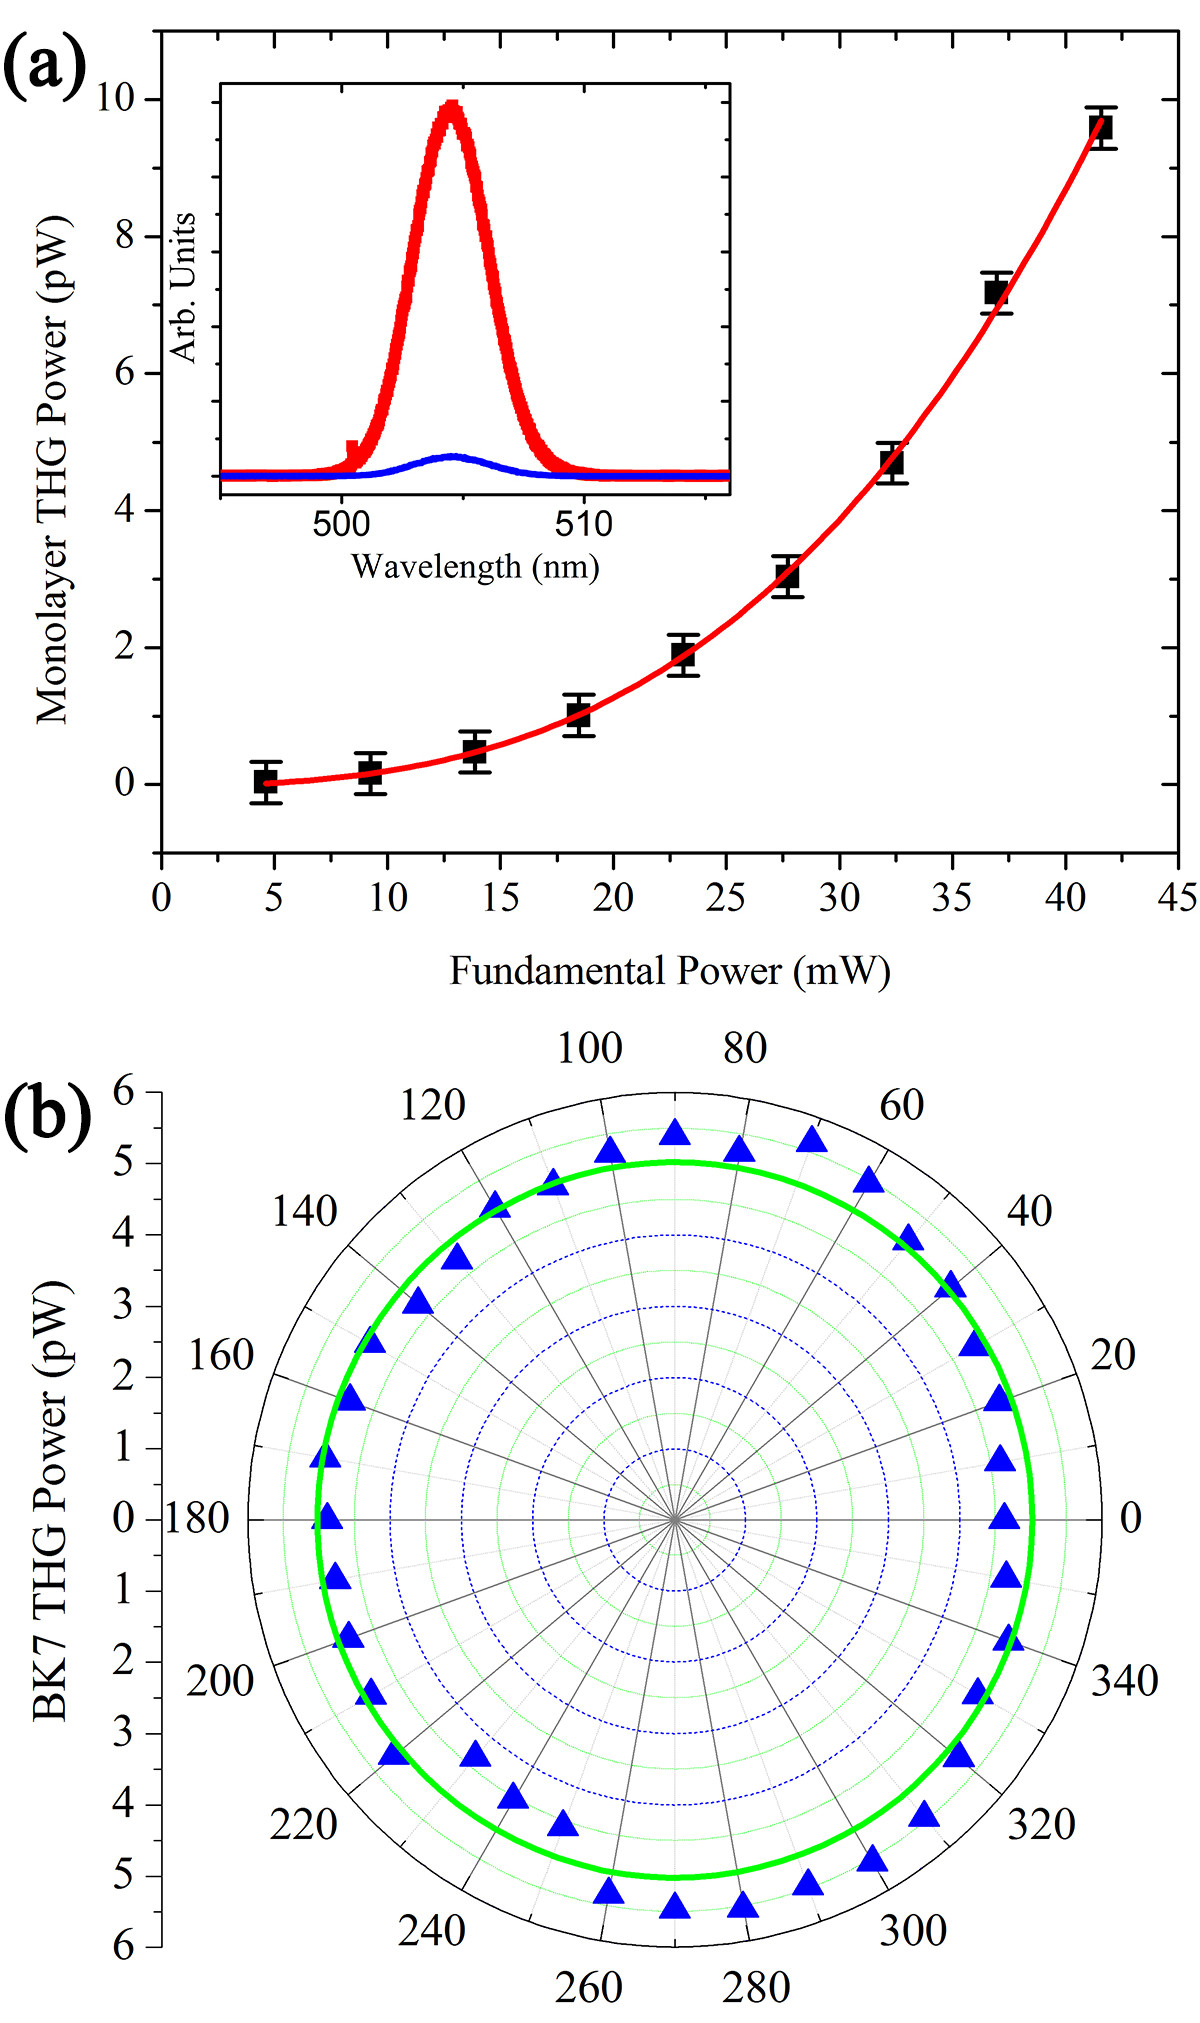
We study THG of monolayer ReS2 by focusing the fundamental field on the red dot 1 as shown in Figure 2(a). The THG spectrum is shown as the red curve in the inset of Figure 5(a), which corresponds to and a fundamental fluence of 12.6 mJ/cm2. In our experiments, third harmonic frequencies can also be generated from the BK7 glass substrate. The blue curve in the inset of Figure 5(a), which is about of the red curve, shows the third harmonic spectrum of the BK7 glass substrate under the same experimental conditions as the monolayer ReS2 sample. In addition, we notice that THG from BK7 glass substrate becomes maximal when moving the beam focus away from the surface and into the BK7 glass substrate. Thus we study THG from the BK7 glass substrate by moving the focus of the fundamental beam into the substrate by a few m. There is no angular dependence of THG power from the BK7 glass substrate when the power of the fundamental beam is fixed at 23 mW, as shown in Figure 5(b), and the contribution from the BK7 glass substrate is much smaller than the THG from ReS2 samples; it has no effect in our analysis. The fundamental power dependence of THG in monolayer ReS2 is shown in Figure 5(a) for . The cubic power fit (red line) matches well with the data (black rectangles), as expected for a THG process.
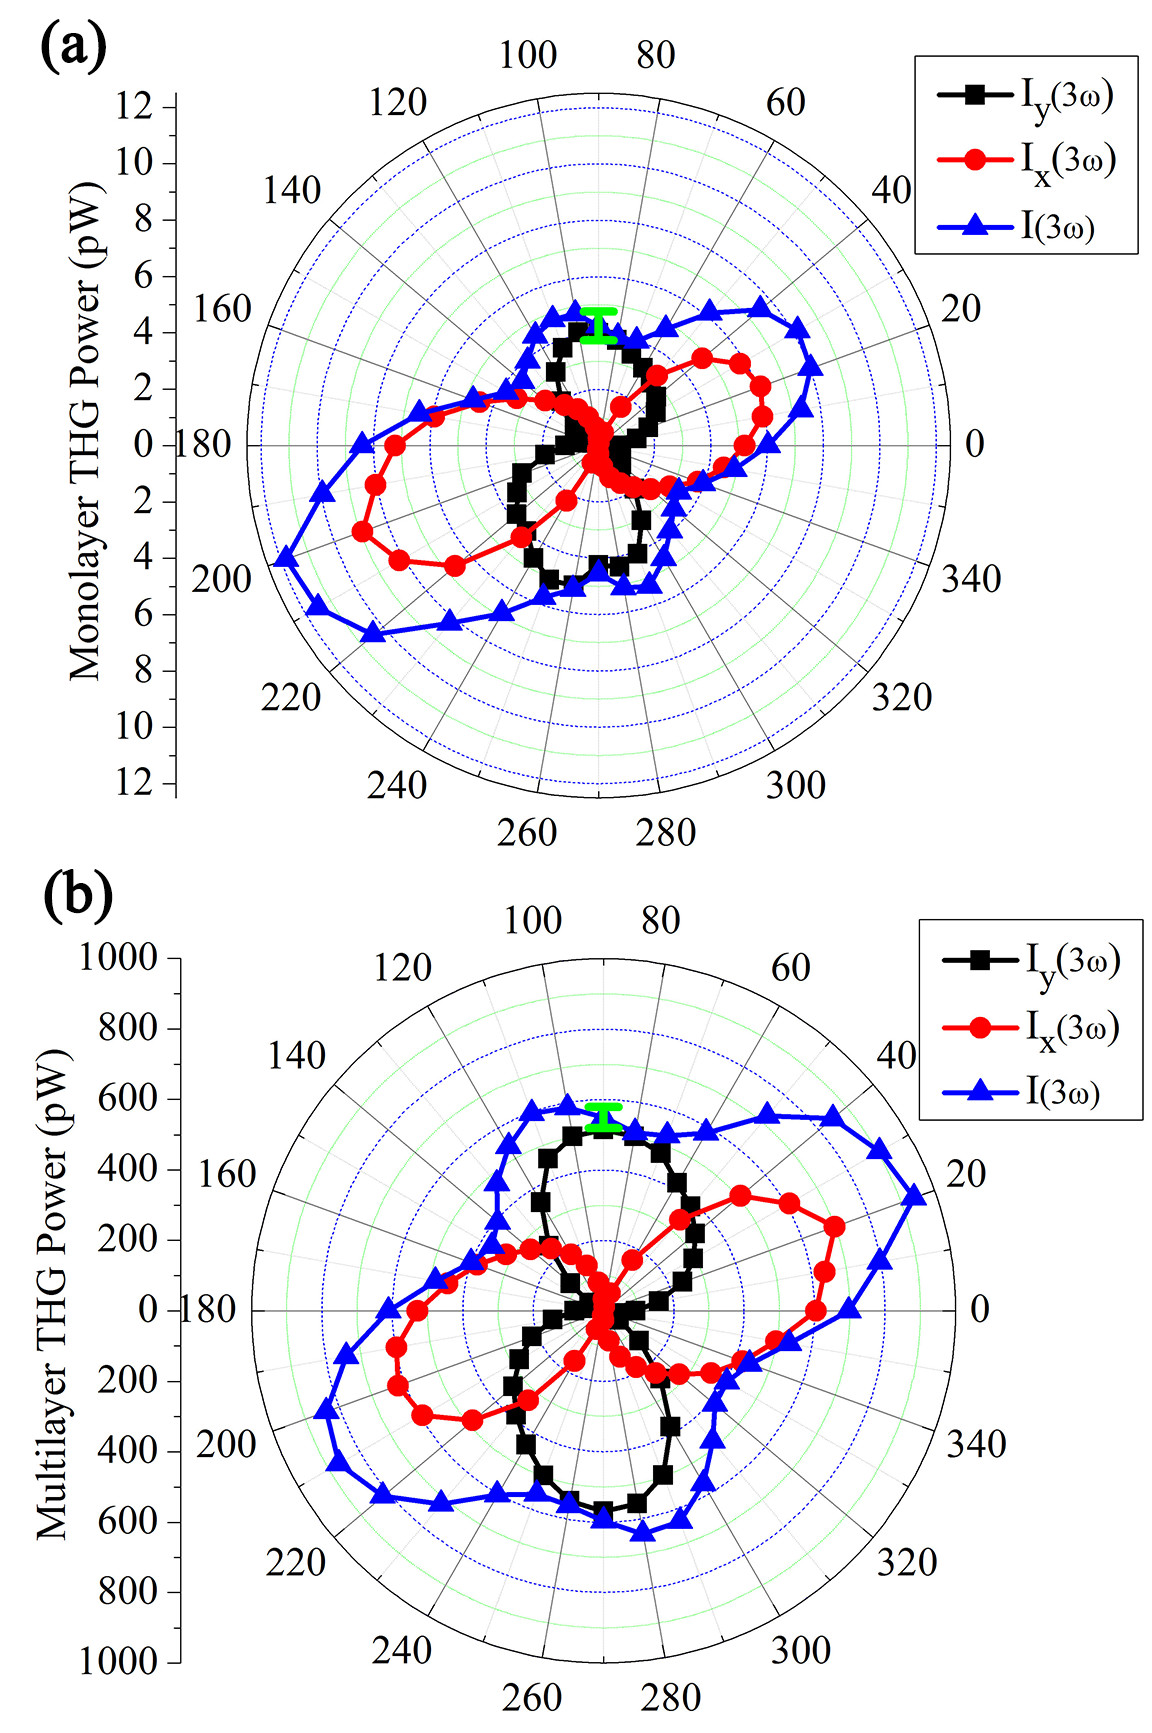
By tuning the HW and the GP we measure THG in monolayer ReS2 as a function of , under the same fundamental fluence of 16.5 mJ/cm2. Horizontal and vertical polarizations of the THG field are resolved by the polarizer before the spectrometer. The results are plotted in Figure 6(a), where the lines corresponding to the horizontal and vertical polarizations have the shape of a twisted dumbbell, and the total power (i.e. the sum of the horizontal and vertical components) of the THG field from monolayer ReS2 is anisotropic as a function of .
In order to quantify the THG in monolayer ReS2, we deduce the magnitude of the third-order susceptibility from the power of the THG field that reaches the detector and that of the fundamental incident field . Here we extract an estimate for the magnitude of the largest component of , which we denote by . The fundamental field at the sample is related to the incident field by Fresnel equations. The induced polarization is related to the fundamental field at the sample by Eq. (2). The THG field at the sample can then be determined from the polarization sipe87 , which in turn determines the field that is transmitted through the glass substrate and collected by the detector. Considering pulses that are Gaussian in both space and time, the final expression is
| (4) |
where is the thickness of the sample, and are respectively the indices of refraction of air and the BK7 glass substrate (which are both independent of the frequencies involved, and ); and are respectively the spot size width and the pulse duration measured at full width at half maximum, and MHz is the laser repetition rate. See the Supplemental Material supplement for details on the derivation of this equation. By using the parameters measured in our experiment ( nm, fs, m, and nm), we extract the maximal value of m2/V2 for . The maximal THG is confirmed to occur when the polarization of the fundamental field is along the -axis, as determined by angular dependent transient absorption. Thus, THG measurements can be also used to determine the lattice orientation of ReS2. When , the THG field power reduces to about one third of the maximal value, so m2/V2 is the minimal value of the susceptibility.
To confirm the procedure used to extract the of the monolayer ReS2 sample, we move the fundamental pulse focus spot to the BK7 glass substrate, which allows us to measure the THG from the BK7 glass substrate under the same conditions. The angular dependence of THG in the BK7 glass substrate is isotropic, as shown in Figure 5(b). We extract a m2/V2 for the BK7 substrate, which is in good agreement with the reported values of m2/V2 for a fundamental wavelength of 1064 nm and m2/V2 for 1907 nm Günter (2012). The power of the THG due to the substrate is more than times smaller than that of the ReS2, as shown in the inset of Fig. 5 (a). Thus, even the heterodyne contribution of the substrate to the total power of the THG is at least times smaller than that due exclusively to the ReS2 sample, which lies within the experimental precision. So the contribution of THG from the BK7 glass substrate is ignored in our analysis.
We also use the method described above to study the THG from multilayer ReS2 by focusing the fundamental laser on the attached multilayer part of the sample, as indicated by the red dot 2 in Fig. 2(a). The observed THG from the attached multilayer (13 L) shows an angular dependence very similar to that of monolayer ReS2. This is a reasonable result, since the attached multilayer should have the same crystal orientation of the monolayer, resulting in the same in-plane symmetry of THG. In addition, the THG signal in the multilayer sample is significantly larger than that from the monolayer. Due to the weak interlayer coupling in ReS2, the THG field from a multilayer sample can be considered as the addition of THG fields generated in each individual layer, and the THG induced power would be simply expected to be proportional to the square of the sample thickness – see Eq. 4. Thus, the THG power from the 13 L sample would be expected to increase by a factor of 169, relative to the monolayer, for each . However, since the photon energy of THG is higher than the band gap of ReS2, the induced THG will be absorbed via one-photon absorption when propagating in the multilayer sample. It has been well-known that linear absorption in ReS2 is in-plane anisotropic. A maximum (minimum) absorption coefficient is expected when light polarization is along (perpendicular to) the -axis, which is clearly revealed by our experimental results: Fig. 6 shows that when compared to the monolayer THG, the multilayer THG is mostly suppressed by absorption when the polarization of the induced THG is along the -axis ().
Finally, the distorted dumbbell shapes for the horizontal and vertical polarizations of the THG field are consistent with the predictions from the point group symmetry analysis. Since we have used BK7 glass substrate as a reference material, we rule out any anisotropic artifact from the measurements, and we can safely attribute the anisotropic THG to the lattice distortions of ReS2.
V Conclusion
In summary, we observed strong and anisotropic third harmonic generation (THG) in monolayer and multilayer ReS2. The third-order susceptibility of monolayer ReS2, was found to be on the order of 10-18 m2/V2, which is about one order of magnitude higher than reported values in hexagonal TMDs, such as MoS2. This large nonlinear optical response suggests potential applications of this material in optoelectronic devices involving third-order nonlinear processes. A point group symmetry analysis indicates that the THG in crystals with a perfect lattice would be isotropic, i.e. the total THG intensity would be independent of the polarization of the incident field. However, we observed significant deviation from this prediction, which can be attributed to the lattice distortions. This illustrates the importance of lattice distortions for the nonlinear optical response of this material, and indicate that they should not be neglected in theoretical models. Our results also show the THG can be used as a diagnostic tool to probe such lattice distortion.
VI Acknowledgement
This material is based upon work supported by the National Science Foundation of USA under Award No. DMR-1505852 and IIA-1430493.
References
- Mak et al. (2010) K. F. Mak, C. Lee, J. Hone, J. Shan, and T. F. Heinz, Phys. Rev. Lett. 105, 136805 (2010).
- Splendiani et al. (2010) A. Splendiani, L. Sun, Y. Zhang, T. Li, J. Kim, C.-Y. Chim, G. Galli, and F. Wang, Nano Lett. 10, 1271 (2010).
- Wang et al. (2012) R. Wang, B. A. Ruzicka, N. Kumar, M. Z. Bellus, H.-Y. Chiu, and H. Zhao, Phys. Rev. B 86, 045406 (2012).
- Xiao et al. (2012) D. Xiao, G.-B. Liu, W. Feng, X. Xu, and W. Yao, Phys. Rev. Lett. 108, 196802 (2012).
- Muniz and Sipe (2015) R. A. Muniz and J. E. Sipe, Phys. Rev. B 91, 085404 (2015).
- Chernikov et al. (2014) A. Chernikov, T. C. Berkelbach, H. M. Hill, A. Rigosi, Y. Li, O. B. Aslan, D. R. Reichman, M. S. Hybertsen, and T. F. Heinz, Phys. Rev. Lett. 113, 076802 (2014).
- He et al. (2014) K. He, N. Kumar, L. Zhao, Z. Wang, K. F. Mak, H. Zhao, and J. Shan, Phys. Rev. Lett. 113, 026803 (2014).
- Kumar et al. (2013) N. Kumar, S. Najmaei, Q. Cui, F. Ceballos, P. M. Ajayan, J. Lou, and H. Zhao, Phy. Rev. B 87, 161403 (2013).
- Wang et al. (2013a) R. Wang, H.-C. Chien, J. Kumar, N. Kumar, H.-Y. Chiu, and H. Zhao, ACS Appl. Mater. Interfaces 6, 314 (2013a).
- Torres-Torres et al. (2016) C. Torres-Torres, N. Perea-López, A. L. Elías, H. R. Gutiérrez, D. A. Cullen, A. Berkdemir, F. López-Urías, H. Terrones, and M. Terrones, 2D Mater. 3, 021005 (2016).
- Wang et al. (2013b) K. Wang, J. Wang, J. Fan, M. Lotya, A. O’Neill, D. Fox, Y. Feng, X. Zhang, B. Jiang, and Q. Zhao, ACS Nano 7, 9260 (2013b).
- Geim and Grigorieva (2013) A. K. Geim and I. V. Grigorieva, Nature 499, 419 (2013).
- Tongay et al. (2014) S. Tongay, H. Sahin, C. Ko, A. Luce, W. Fan, K. Liu, J. Zhou, Y.-S. Huang, C.-H. Ho, and J. Yan, Nat. Commun. 5 (2014).
- Cui and Zhao (2015) Q. Cui and H. Zhao, ACS Nano 9, 3935 (2015).
- Chenet et al. (2015) D. A. Chenet, O. B. Aslan, P. Y. Huang, C. Fan, A. M. van der Zande, T. F. Heinz, and J. C. Hone, Nano Lett. 15, 5667 (2015).
- Cui et al. (2015) Q. Cui, J. He, M. Z. Bellus, M. Mirzokarimov, T. Hofmann, H. Chiu, M. Antonik, D. He, Y. Wang, and H. Zhao, Small 11, 5565 (2015).
- He et al. (2016) R. He, J.-A. Yan, Z. Yin, Z. Ye, G. Ye, J. Cheng, J. Li, and C. H. Lui, Nano Lett. (2016).
- Gao et al. (2016) J. Gao, L. Li, J. Tan, H. Sun, B. Li, J. C. Idrobo, C. V. Singh, T.-M. Lu, and N. Koratkar, Nano Lett. (2016).
- Zhang et al. (2016) Q. Zhang, S. Tan, R. G. Mendes, Z. Sun, Y. Chen, X. Kong, Y. Xue, M. H. Rümmeli, X. Wu, and S. Chen, Adv. Mater. (2016).
- Liu et al. (2015a) E. Liu, Y. Fu, Y. Wang, Y. Feng, H. Liu, X. Wan, W. Zhou, B. Wang, L. Shao, and C.-H. Ho, Nat. Commun. 6 (2015a).
- Yang et al. (2016) S. Yang, J. Kang, Q. Yue, J. Coey, and C. Jiang, Adv. Mater. Interf. 3 (2016).
- Zhang et al. (2015) E. Zhang, Y. Jin, X. Yuan, W. Wang, C. Zhang, L. Tang, S. Liu, P. Zhou, W. Hu, and F. Xiu, Adv. Funct. Mater. 25, 4076 (2015).
- Najmzadeh et al. (2016) M. Najmzadeh, C. Ko, K. Wu, S. Tongay, and J. Wu, Appl. Phys. Express 9, 055201 (2016).
- Liu et al. (2015b) F. Liu, S. Zheng, X. He, A. Chaturvedi, J. He, W. L. Chow, T. R. Mion, X. Wang, J. Zhou, and Q. Fu, Adv. Funct. Mater. 26, 1169 (2015b).
- Murray et al. (1994) H. H. Murray, S. P. Kelty, R. R. Chianelli, and C. S. Day, Inorg. Chem. 33, 4418 (1994).
- Moss et al. (1989) D. J. Moss, H. M. van Driel, and J. E. Sipe, Opt. Lett. 14, 57 (1989).
- Sipe et al. (1987) J. E. Sipe, D. J. Moss, and H. M. Van Driel, Phys. Rev. B 35, 1129 (1987).
- Castellanos-Gomez et al. (2014) A. Castellanos-Gomez, M. Buscema, R. Molenaar, V. Singh, L. Janssen, H. S. van der Zant, and G. A. Steele, 2D Mater. 1, 011002 (2014).
- Aslan et al. (2015) O. B. Aslan, D. A. Chenet, A. M. van der Zande, J. C. Hone, and T. F. Heinz, ACS Photonics 3, 96 (2015).
- (30) J. E. Sipe, J. Opt. Soc. Am. B 4, 481-489 (1987).
- (31) See Supplemental Material at http://link.aps.org/supplemental for details of the derivation of Eq. 4.
- Günter (2012) P. Günter, Nonlinear optical effects and materials, vol. 72 (Springer, 2012).