Modeling Single Molecule Junction Mechanics as a Probe of Interface Bonding
Abstract
Using the atomic force microscope based break junction approach, applicable to metal point contacts and single molecule junctions, measurements can be repeated thousands of times resulting in rich data sets characterizing the properties of an ensemble of nanoscale junction structures. This paper focuses on the relationship between the measured force extension characteristics including bond rupture and the properties of the interface bonds in the junction. A set of exemplary model junction structures have been analyzed using density functional theory based calculations to simulate the adiabatic potential surface that governs the junction elongation. The junction structures include representative molecules that bond to the electrodes through amine, methylsulfide and pyridine links. The force extension characteristics are shown to be most effectively analyzed in a scaled form with maximum sustainable force and the distance between the force zero and force maximum as scale factors. Widely used, two parameter models for chemical bond potential energy versus bond length are found to be nearly identical in scaled form. Furthermore, they fit well to the present calculations of N-Au and S-Au donor-acceptor bonds, provided no other degrees of freedom are allowed to relax. Examination of the reduced problem of a single interface, but including relaxation of atoms proximal to the interface bond, shows that a single-bond potential form renormalized by an effective harmonic potential in series fits well to the calculated results. This allows relatively accurate extraction of the interface bond energy. Analysis of full junction models show cooperative effects that go beyond the mechanical series inclusion of the second bond in the junction, the spectator bond that does not rupture. Calculations for a series of diaminoalkanes as a function of molecule length indicate that the most important cooperative effect is due to the interactions between the dipoles induced by the donor-acceptor bond formation at the junction interfaces. The force extension characteristic of longer molecules such as diaminooctane, where the dipole interaction effects drop to a negligible level, accurately fit to the renormalized single-bond potential form. The results suggest that measured force extension characteristics for single molecule junctions could be analyzed with a modified potential form that accounts for the energy stored in deformable mechanical components in series.
I Introduction
Mapping the potential surface that describes an individual chemical bond represents a fundamental challenge, all the more so when the bond in question is formed at a metal-organic interface in a nanostructured system. Nanostructured, heterogeneos materials are ubiquitious in applications, such as catalysis. In that context, understanding the diversity of binding sites for molecules on the exposed surfaces of such materials and the relative stability of key bonds is of central importance. However, quantitative measurement of individual, interface bonding characteristics presents significant challenges.
Several approaches, based on the atomic force microscope (AFM) Giessibl (2003), have emerged to provide different and complimentary measurements probing the potential surface in bond formation, or the inverse process, bond rupture. These studies can fall under the broader umbrella of mechanochemistry in which mechanical forces are utilized to drive chemical processes. Beyer and Clausen-Schaumann (2005) Recent research in this field has been reanimated by the discovery that specific chemical moieties can be introduced into the system to direct the energy supplied by mechanical means to perform controlled chemical bond changes. Hickenboth et al. (2007); Davis et al. (2009)
The AFM is a highly versatile scanned probe technique to measure surface topography. Recent research based on controlled tip functionalization and more extensive mapping of the force versus distance from the surface, but generally in non-contact mode, can reveal chemically specific information Lantz et al. (2001); Sugimoto et al. (2007); Albers et al. (2009); Welker and Giessibl (2012); de Oteyza et al. (2013). In a different mode, the AFM is extensively used as a molecular force probe to study soft and biological molecules Muller and Dufrene (2008); Neuman and Nagy (2008). Through contact with a sample surface, the probe tip adheres to a target species on the surface. As the probe tip is withdrawn, a one-dimensional force versus elongation characteristic is measured. The mechanical response of soft and biological molecules can be complex and details are outside the scope of this study. However, early experiments along these lines were also able to isolate features specifically attributable to rupture of covalent chemical bonds, assigning a distinctive rupture force (of order nN) to different bonds Grandbois et al. (1999). In a different realization of this concept, scanned and molecular force probe capabilities were combined; the adhesion of a 3,4,9,10-perylene-teracarboxylic-dianhydride to the Au(111) surface was measured through selective contact to a single molecule and measuring the force-extension characteristic as it was lifted off the surface Wagner et al. (2012).
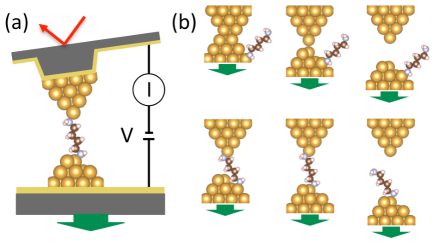
Nanoscale junctions represent a different category of systems in which the AFM is used as a molecular force probe. Soon after the initial observation of conductance quantization in metal atomic-scale junctions Olesen et al. (1994), mechanical characteristics of Au junctions were measured simultaneously with electrical characteristics as the junction was elongated under stress Rubio, Agrait, and Vieira (1996). Sketches illustrate the method in Fig. 1. A series of elastic and plastic deformations where observed with correlation between the jumps in force and the changes in junction conductance. The junctions consistently ruptured at a specific applied force, . Interestingly, the same characteristic rupture force was also observed in the regime, achieved at low temperature and vacuum conditions, in which a mono-atomic gold wire was formed during elongation, extending to more than 1 nm prior to rupture Rubio-Bollinger et al. (2001). The details of the atomic structure in these measurements are generally not known. The atomic-scale junction is formed in situ as the Au contact area necks down under stress, a process that generally follows a distinct path for each realization. The quoted force in this experiment was the most probable from a histogram formed from order 200 individual measurements.
At the point when the metal point contact ruptures, there is a sub-nm scale space that opens at a controlled rate as the tip is systematically withdrawn. In the presence of target molecules terminated by appropriate link groups, either previously deposited on the electrodes or disolved in a solvent surrounding the tips, small molecule bridges between these electrodes can form single or few molecule circuit elements (Fig. 1). This approach to a mechanical break junction allows repeated formation of target, single molecule junctions and characterization of their specific conducting characteristics Xu and Tao (2003). Harnessing selective chemistry, e.g., link groups such as amines that selectively bond to undercoordinated Au atoms on the tips, results in highly reproducible conductance signatures Venkataraman et al. (2006a) and enables the direct correlation of conductance characteristics with molecular structure Venkataraman et al. (2006b). This technique, among others, has led to significant progress in understanding electronic transport through nanoscale molecular junctions, including conductance phenomena with no classical analogue McCreery and Bergren (2009); Aradhya and Venkataraman (2013); Nichols and Higgins (2015); Hybertsen and Venkataraman (2016).
When this mechanical break junction approach is combined with an AFM set-up (AFM-BJ), as it was in prior work on metal point contacts and illustrated in Fig. 1, the electronic and mechanical characteristics of the single molecule junctions can be simultaneously measured as function of elongation Xu, Xiao, and Tao (2003); Frei et al. (2011). In particular, the rupture force associated to the organo-metallic interface bond breaking can be quantitatively correlated with changes in the bond characteristics, as dictated by the molecular structure, e.g., distinguishing amine terminated alkanes, diaminobenzene and 4,4’-bipyridine Frei et al. (2011). In the measurement protocol where each iteration of the measurement includes the fresh rupture of the electrode metal contact, a new pair of metal tips naturally emerge with a nominally different atomic-scale structure each time. For each molecule measured, a database of thousands of individual junction measurements is stored, i.e., conductance and force versus elongation. The reduction of these large data sets to histograms of target, measured quantities, such as linear response conductance and rupture force, support robust, quantitative analysis of trends and comparisons to theory or simulation of representative examples. However, as recently emphasized Hybertsen and Venkataraman (2016), the large database of individual junction data represents an opportunity. In particular, behind the histograms, there is a wealth of data probing the way changes in structure at the atomic scale in these nanoscale systems affects such fundamental quantitities as the interface organo-metallic bond strength.
In the analysis of force extension characteristics, theory and simulation has contributed a great deal of insight. Ribas-Arino and Marx (2012) Early simulations of metal-metal interactions during tip indentation, adhesion and subsequent withdrawal and rupture of the contact, based on molecular dynamics, highlighted a sequence of key plastic (inelastic) processes, particularly the necking down of the contact area to the atomic scale Landman et al. (1990). The subsequent initial measurement of conductance quantization in metal point contacts was accompanied by constructive simulations Olesen et al. (1994). Atomic-scale processes occuring during elongation of metal contacts under stress has now been widely studied with force-field based methods, Sorensen, Brandbyge, and Jacobsen (1998); Rubio-Bollinger et al. (2001); Bahn and Jacobsen (2001); Dreher et al. (2005); Pauly et al. (2006); Pu et al. (2010); French, Iacovella, and Cummings (2011); Wang and Leng (2011); Sabater et al. (2012); French et al. (2013) using Density Functional Theory (DFT) to calculate the energy Jelinek et al. (2008); Thiess et al. (2008); Tavazza, Levine, and Chaka (2009) or a combination of both methods da Silva, da Silva, and Fazzio (2001); da Silva et al. (2004). Two distinct approaches have typically been used: Driven molecular dynamics or calculation of an adiabatic potential surface to describe the evolution of the system. The molecular dynamics approach has the advantage of including inelastic events in a natural way, albeit with significant limitations on the time scales and for rates of junction evolution that are many orders of magnitude faster than experiments. Also, constructive calculation of the force generally requires substantial extra effort, although simpler, approximate approaches have been employed Finbow, McDonald, and I (1997). On the other hand, the force is trivially obtained from the adiabatic energy surface, but the scope of structures and processes that can be explored is more limited. Turning to the case of organo-metallic interfaces, a key, early insight to the complexity of the thiolate-Au system emerged from DFT-based molecular dynamics simulations of the evolution under stress of a small organic molecule bonded to a model for the Au(111) surface via a thiolate linkage Kruger et al. (2002). Instead of simply observing the stretching and rupture of the S-Au surface bond, a much more complex sequence of inelastic events resulted in a chain of Au atoms being pulled from the surface prior to a rupture event in which the Au atomic chain broke, leaving three Au atoms bonded to the ethylthiolate. For the single molecule junctions, empirical force field Wang and Leng (2015) and DFT-based Paulsson et al. (2009); Strange, Lopez-Acevedo, and Häkkinen (2010) molecular dynamics simulations have been used, as well as DFT-based calculations of the adiabatic potential landscape. Stadler, Thygesen, and Jacobsen (2005); Romaner et al. (2006); Batista et al. (2007); Li and Kosov (2007); Hoft et al. (2008); Qi et al. (2009)
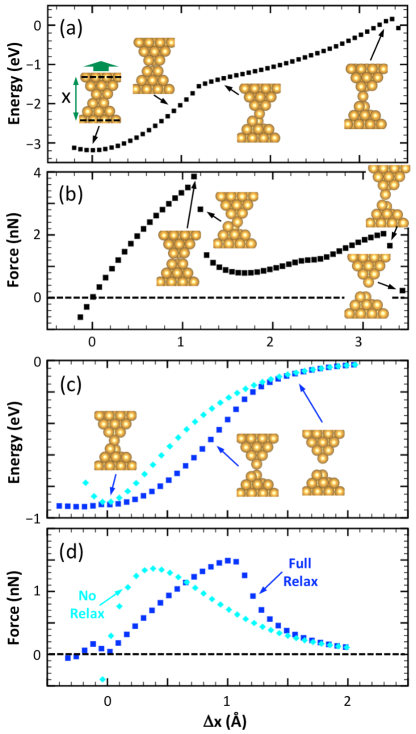
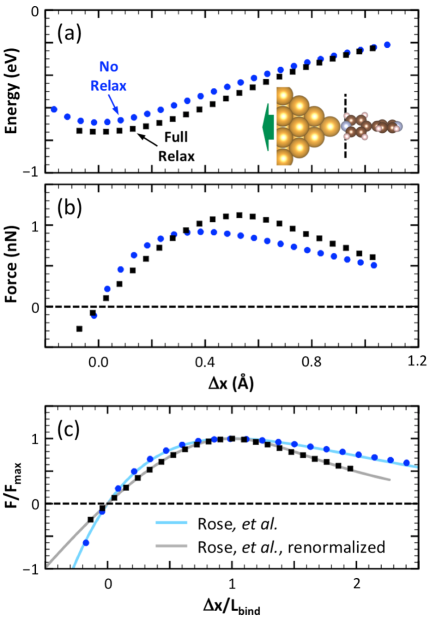
In prior research, I developed and implemented approaches to simulate junction force extension characteristics using a DFT-based approach to compute an adiabatic potential surface Kamenetska et al. (2009); Frei et al. (2011, 2012); Aradhya et al. (2012, 2014); Hybertsen and Venkataraman (2016). As an example in Fig. 2, consider the basic features of an Au point contact evolution under stress, here modeled with finite Au clusters to represent each tip of the electrodes. Details of the methods used here are described in the body of this paper. In general, as the junction is elongated, there are portions of the junction extension that are nominally elastic (e.g., from 0 to 1 in Figs. 2a and b). Then the atoms near the contact region rearrange in a plastic event (near 1.2 ). and the system enters into a new, relatively stable structure that stretches elastically (from 1.4 to 3.4 ). Both events involve a discontinuity in the structure where the system jumps from one potential surface to another. Before and after snapshots are visualized in Fig. 2b. With a slightly different alignment of the gold tips to form an atomic scale contact, that segment of the potential surface exhibits a single, smooth evolution under stress (Figs. 2c, d). The force passes through a point of maximum sustainable force (about 1.5 nN) and smoothly goes to zero as the gap between the two tips opens up.
The observed evolution of the junciton is not solely determined by the elongation of the local bonds that bridge the contact point. To isolate the role of stretching the Au-Au distance specifically at the contact from the deformation of the structure nearby, further constraints were applied. Referring to the insets in Fig. 2c, the entire structure of each model tip was held rigid. As the relative distance between the tip structures was varied, no atomic relaxation was allowed. Thus, the only bond distance that was allowed to change was the Au-Au separation at the contact point. Relative to the unconstrained case, the slope (stiffness) is larger, the maximum sustainable force is slightly lower and the distance traversed to that maximum is smaller. Beyond the point of elongation where the force is maximum, the force drops more slowly as a function of elongation. Thus, in the fully relaxed calculation, representative of the realistic case where the tips are deformable, stress-induced changes of the near-by tip structure during initial elongation store energy that is then released as the force drops beyond the maximum.
A critical issue when interpreting measurements of bond rupture force is how it correlates with the maximum sustainable force of a specific bond. As discussed in detail in a recent review, Ribas-Arino and Marx (2012) the full mechanical system of the measurement must be considered, including the boundary conditions determined by the way the measurements are executed. For example, in the case of force spectroscopy in soft materials, the system is subject to a constant force boundary condition. That force is then ramped up at a specific loading rate. The constant applied force corresponds to a linear potential that must be combined with the potential representing a specific bond to model the total mechanical system. In this case, the system is inherently unstable along the direction of applied force. The system always has a lower total energy with the bond ruptured. A barrier separates the system configuration with the bond intact from that with the bond ruptured, but that barrier reduces to zero as the applied force approaches the maximum sustainable force for the bond. Closely related to the Kramers model for rate of escape from a bound state in an applied field, Kramers (1940); Hanggi, Talkner, and Borkovec (1990) the resulting distribution of measured rupture forces reflects stochastic processes that carry the system over the barrier, including dependence on the rate of loading. Evans (2001) In the case of the AFM-BJ measurements that are the focus of this study, the system is subject to elongation at a constant rate; separation is the control variable and force is measured. At least for analysis purposes, the balance of the system, including the AFM cantilever, can be represented by a harmonic potential. In this case, the inherent stability of the system along the direction of pulling is contingent on a stiffness criterion. Friddle et al. (2008) As discussed elsewhere, Aradhya et al. (2014); Hybertsen and Venkataraman (2016) the AFM-BJ experiments can be carried out with a stiff cantilever such that bistability in the one-dimensional potential surface along the stretching direction is avoided. In that case, the full force extension characteristic, illustrated in the example in Figs. 2c and d, could be accessible, including the region beyond the force maximum. Of course, as the bond is elongated, the energy of the system is raised and barriers for fluctuations of other degrees of freedom such as rotation of the molecular backbone away from the direction of elongation become smaller. Detailed models of the bond rupture processes that occur in the AFM-BJ measurements remain to be understood.
In this paper, I focus on understanding the essential factors that describe the interplay between the characteristics of the individual organo-metallic link bonds at the junction interfaces and the overall junction evolution under stress. I will not consider further the stochastic processes that govern bond rupture in the AFM-BJ set-up, although I will briefly analyze the conditions for inherent stability along pulling direction. For the purpose of elucidating the force extension characteristics, I use the data generated from a series of DFT-based simulations, such as those illustrated in Fig. 2 for the special case of an Au point contact. The long-term goal is to support quantitative analysis of individual, measured force extension data to extract link bond energy. The results presented here extend prior, initial work towards this goal in which a simple model form was developed to fit data and scaling behavior of junction force extension characteristics was introduced Aradhya et al. (2014); Hybertsen and Venkataraman (2016). My approach here starts with an assessment of widely used, simple models to describe individual bonds. I then systematically include the relaxation of the near-by atoms and finally cooperative effects that affect the full junction evolution. It will emerge that detailed information near and beyond the force maximum are important for disentangling the individual bond characteristics from those of the junction as a whole. Also, determining the bond energy requires capturing the essential characteristics from the force maximum through the asymptotic region, at least as represented by the form of the model and the deduced parameterization of it.
In the next section, analytical models used in this work are discussed. In Sect. III, the DFT-based methods are described. The main results and discussion appear in Sect. IV, followed by concluding remarks in Sect. V.
II Analytical Models
A minimal model for the bond length dependence of the potential surface describing a chemical bond requires an energy scale and a distance scale . One popular choice for solids is the so-called ‘universal’ model proposed by Rose, Ferrante and Smith Rose, Ferrante, and Smith (1981), here displayed as a function of the change in bond length relative to that at the minimum energy ():
| (1) |
The mechanical force required to stretch or compress the bond is given by the first derivative and the corresponding bond stiffness by the second derivative:
| (2) | |||||
| (3) |
Here, a positive force will correspond to the physical system under tension and I will resolve any ambiguity regarding how the force is applied in context. For the example of a single N-Au bond illustrated in the inset to Fig. 3a, that isolated bond under tension () corresponds to a force applied to the Au atom to the right and an equal and opposite force to the N atom to the left. Equation (2) implies that for . The force and potential also go to zero at large separation. The force is nonlinear outside the region near and there is a maximum sustainable force for this bond defined by the inflection in the potential or the point at which the stiffness in Eq. (3) is zero. This occurs for and for which .
| Lennard-Jones | |||||
|---|---|---|---|---|---|
| Morse | |||||
| Rose, et al. |
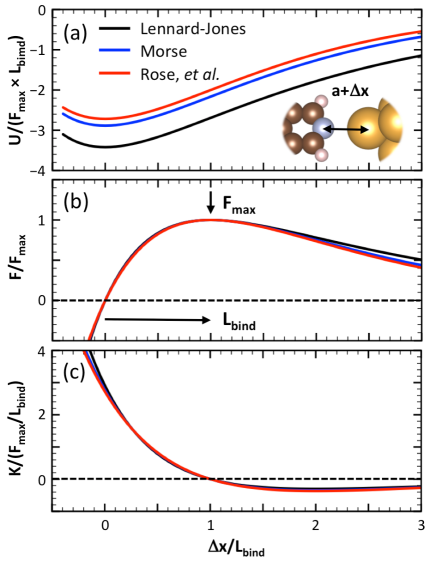
The primary focus here will be to understand force-extension characteristics. The parameters and are natural choices to characterize the system. Furthermore, in prior work, it was found that these parameters can be used to rescale and collapse a substantial amount of experimental data Aradhya et al. (2014); Hybertsen and Venkataraman (2016). The corresponding measure for energy is of course and in those units . The scaled potential, force extension, and stiffness for the universal potential of Rose, et al., are plotted in Fig. 3. In the same plot, two other widely used models are also shown: the Morse potential Morse (1929)
| (4) |
and the Lennard-Jones potential Jones (1924)
| (5) |
Both expressions have been formulated in terms of nominally the same variables used for the universal potential. Straightforward analysis yields the expressions for , as well as scaled values for the stiffness and potential. The results are collected in Table 1.
Of course, the simplest model potential with a force maximum would be a cubic polynomial. While it is a useful fit near the force maximum, it does not serve the present purpose as a global form since it diverges for large distance. Also it has a linear stiffness, quite different in detail from the models shown in Fig. 3c.
From the expressions for the parameter characterizing the distance from the potential minimum to the maximum sustainable force point (inflection in the potential), it is clear that the distance parameter has a different physical meaning among the different models. In particular, in the Lennard-Jones model, the parameter is the equilibrium bond length, while in the models of Rose, et al., and Morse, the equilibrium bond length does not explicitly enter. However, once the models are constrained to give the same and , arguably conditions that should then indicate a very similar chemical bond, then the other physical characteristics align more closely. In particular, the bond stiffness near the equilibrium bond length only varies in a range of about . Correspondingly, the rescaled force-extension curves for the three models are nearly indistinguishable from modest compression right through the maximum sustainable force (Fig. 3b). They only become distinguishable beyond about . There, the Lennard-Jones model in particular starts to deviate. Correspondingly, the potential curves in Fig. 3a show the slower decay with distance that must follow from the power law in that case, as compared to the exponential dependence for the other two models. Of course, the power law reflects dispersion interactions between separated atoms. While this has a relatively small influence over the range of , the integrated impact does lead to a deeper binding energy for the same and . All the models are designed to reference zero at large distance, so this is reflected in the normalized potential at zero extension shown in Table 1. One may assess the difference between the Lennard-Jones model and the other two in this regard as on estimate for the impact of dispersion interactions in this context ().
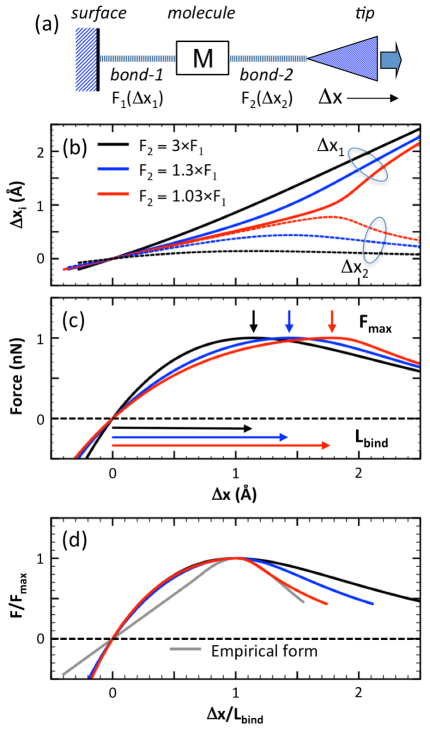
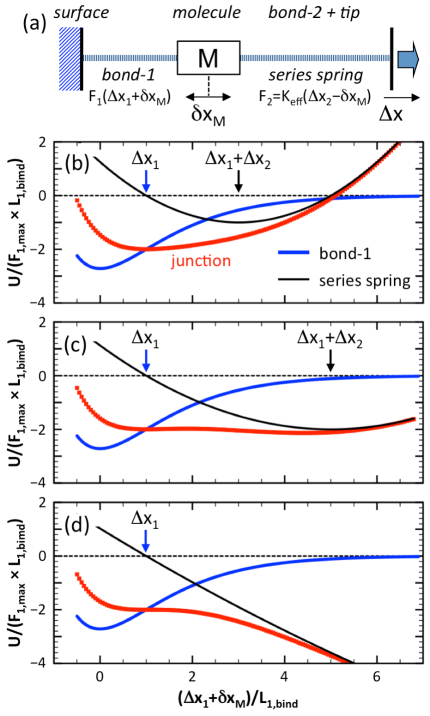
Now consider a simplified model for a single molecule junction formed and elongated in an AFM-BJ set-up, illustrated in Fig. 4a. For the experimental conditions envisioned here, the AFM cantilever is substantially stiffer than the microscopic junction. The additional extension due to cantilever deflection can be safely neglected. Turning to the microscopic junction, consider the case where the metal-organic links form a donor-acceptor bond (e.g., amine N-Au). These will be the softest structural components in the junction. Then the model consists of two independent link bonds, each one characterized by a force extension characteristic. In static equilibrium, elongation of each of these bonds must result in equal and oppositely directed forces on the central, static molecular backbone. In turn, the magnitude of this force must equal that registered by the external cantilever deflection.
Each link bond is characterized by a maximum sustainable force. Overall, assuming an adiabatic extension of the junction, the smallest maximum sustainable force must control the force-extension characteristic of the whole junction. To be definite, assume . Then bond 1 controls the junction evolution and the junction force extension curve can be determined using as the independent variable:
| (6) | |||||
| (7) | |||||
| (8) |
Note that Eq. (8) denotes two bonds under the same degree of tension or compression and the second equality determines the response of bond 2: . Then the potential energy for the junction is given by Eq. (7) and it follows that gives in Eq. (8). The stiffness of the junction follows:
| (9) |
Since bond 2 will never extend to its maximum sustainable force, will always be greater than zero. Once bond 1 extends beyond , the stiffness will be negative. In this one-dimensional model, the junction stability requires in this region. Bistability occurs when this condition is violated. For illustration, consider the case where bond-1 is represented by one of the model forms illustrated in Fig. 3. Then the stability criterion compares to the most negative stiffness seen in Fig. 3c near . From this picture, it is natural to define a critical stiffness for any potential model: . For the models considered here, quantitatively = -0.368 (-0.346, -0.302) for the Rose, et al., (Morse, Lennard-Jones) potential. The critical stiffness is much smaller than the stiffness near equilibrium (Table 1).
Figure 4b displays numerical results for the bond extension in three cases where the bonds are represented by the universal potential of Rose, et al., with equal but different ratios of . As the two link bonds become more similar, the second, stiffer bond extends further, storing more energy prior to the maximum sustainable force. As shown in Fig. 4c, the junction force extension curve exhibits lower stiffness and larger effective . For extension beyond , the stiffer bond relaxes, returning energy and the relative rate of extension is slower. As seen, this results in a force-extension characteristic that is asymmetric around the maximum sustainable force. Scaled results, shown in Fig. 4d, emphasize this point. In all of these examples, , the stability criterion just introduced. However, as approaches , the drop in the model junction force extension after becomes steeper and there is a different instability in the limit of a symmetric junction where both and are approaching zero together. Such symmetric junctions are unlikely in experiments, but examples have been encountered in simulations described in Section IV that behave this way.
In prior work, analyzing both experimental data and DFT-based simulations, it was found that junction force-extension characteristics remained harmonic over a substantially larger fraction of the distance up to Aradhya et al. (2014); Hybertsen and Venkataraman (2016). A simplified, two-parameter form was developed to fit that data. The model potential consisted of a parabolic segment and a logistic segment , with appropriate boundary conditions described previously Aradhya et al. (2014). This form fit a large body of experimental data from individual junction force extension traces, although that data had a limited representation in the region of extension beyond . The fits to DFT-based simulations showed more deviation in that region beyond Hybertsen and Venkataraman (2016). For reference, the empirical form is plotted in Fig. 4d.
Physically, the more harmonic response observed in experiment suggests consideration of the mechanical components of the junction in series with the bond that ruptures. In what is likely the more typical case where the two metal-organic link bonds have different bond strength, assume that is sufficiently larger than so that bond-2 does not appreciably depart from a harmonic response. Then Eq. 8 can be solved assuming a constant and Eq. 6 yields:
| (10) |
The deformation of each of the metal electrode tip structures in response to the applied stress will also be sources of elongation in series. In addition there is the displacement of the AFM cantilever. Assuming the response of each is elastic, then the mechanical analysis of the junction can be envisioned as a series of springs. Maintaining the focus on the bond-1 that ruptures, the net result is a simple generalization where is replaced by
| (11) |
leading to a simplified mechanical model for the junction, illustrated in Fig. 5a. Characterizing the composite junction, flows through, assuming static equilibrium, but is expanded, naturally:
| (12) |
For applications below, it is simplest to express in dimensionless units that reference the parameters for the bond, .
Finally, returning to the question of inherent stability, the junction model illustrated in Fig. 5a captures all the deformable components of the junction, outside bond-1 that will rupture, as a composite, harmonic potential:
| (13) |
These include the other bond, electrode deformation and the AFM cantilever. This model to analyze stability, adapted here, has been used previously. Friddle et al. (2008) The measured elongation is the total as before and the internal position of the molecule backbone (assumed rigid) is determined from static equilibrium, expressed through and . Stability is then framed in terms of the potential energy surface that governs the internal deviations of the molecule away from its equilibrium position, :
| (14) |
Instability is signaled by the appearance of two minima for the position of the molecule in this potential. A maximum (or an inflection) must appear between these, indicated by a zero in the derived force and a negative (zero) value of the stiffness at that position. Focusing on the stiffness,
| (15) |
The stability criterion is the same as that discussed below Eq. 9. For an inherent instability to appear along the direction of elongation in this model, the value of must be smaller than .
Stability in this model is further illustrated for several cases in Fig. 5. Stability is probed for the conditions of elongation that place bond-1 at its maximum sustainable force. First = is considered, a stiffness that exceeds the stability criterion. Then the corresponding equilibrium value of = . To make visualizing the relationship between the system potential and the bond-1 potential easy, is chosen so that when . Then for this value of , = . As shown in Fig. 5b, the molecule is inherently stable at , despite being poised at the maximum sustainable force for bond-1. There is no inherent instability in this case. However, choosing = , below the stability requirement, gives a different result. In this case = and = is chosen. Now bistability appears, as illustrated in Fig. 5c. In fact, the system enery is minimized if the molecule jumps to , with only a small barrier to overcome. Under these conditions, the system becomes inherently unstable as the elongation approaches the conditions of maximum sustainable force on bond-1. Bond rupture is determined by kinetic process that carry the system over the barrier. Finally, the case with a very soft effective spring constant, = , is shown in Fig. 5d. Now = far exceeds the scale of the single bond. The potential due to the applied force is now approaching linear (the limit of a constant force typical of force spectroscopy experiments). Not only is the system inherently bistable, but the barrier is approaching zero.
As discussed elsewhere, Aradhya et al. (2014); Hybertsen and Venkataraman (2016) through the choice of a stiff cantilever and the characteristics of the balance of the junction, it is entirely feasible for to be maintained at a value larger than the inherent instability criterion in AFM-BJ experiments. Thus, in principle, it is possible to probe the intrinsic force extension characteristic of interface bonds through the point of maximum sustainable force and beyond. In practice, stochastic events, involving other degrees of freedom, can and will intervene to limit the scope of the segment of the force extension characteristic probed, but these are not tied to the force maximum as such.
III Numerical Methods
The results presented here build on and extend prior work Kamenetska et al. (2009); Frei et al. (2011, 2012); Aradhya et al. (2012, 2014); Hybertsen and Venkataraman (2016). For completeness, the technical details are described here.
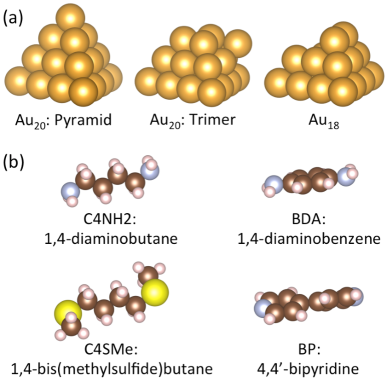
Since the junctions formed in the AFM-BJ method are known to bridge local asperities on the electrodes, these are modeled by tip-like structures. Specifically, each electrode is modeled by a pyramidal structure consisting of 20 atoms, with 10 atoms in the base layer and exposing three (111) facets on the sides. Periodic slab models for electrodes, used in some prior work, will not be further discussed here. As illustrated in Fig. 6a, one electrode is modeled by an ideal pyramid and the other by one in which the top-most atom is displaced to a pyramid side. A third model with 18 atoms is also shown. It was used as the second electrode for the metal point contact simulations illustrated in Fig. 2. The base layer of these tip structures is held fixed with atom separations taken from the optimized, bulk metal DFT calculations. Most of the junctions considered here involved Au contacts, but some examples with Ag electrodes were also considered. The molecules considered included amine, methylsulfide and pyridine link groups. Exemplary molecular structures are visualized in Fig. 6b. The use of two distinct electrode structures for the two junction contacts is by design. In the experiments, a highly symmetric junction should be an exceptional case. Furthermore, as illustrated by the model calculations in Fig. 4, junctions in which the individual bond force extension characteristics are identical can lead to a singularity in the junction behavior near the force maximum.
The DFT-based total energy and structure optimization calculations were performed with the Vienna ab initio simulation package (VASP) Kresse and Furthmuller (1996). VESTA was used to visualize structures. Momma and Izumi (2011) In VASP, the projector augmented wave approach was used Blöchl (1994); Kresse and Joubert (1999). This naturally includes scalar relativistic effects for heavy elements such as Au. For the exchange-correlation functional, the generalized gradient approximation (GGA) developed by Perdew, Burke and Ernzerhof (PBE) was employed Perdew, Burke, and Ernzerhof (1996). Although dispersion interactions were approximately included in one prior study Aradhya et al. (2012), the force extension characteristics of specific chemical bonds is the primary focus here. These are quantitatively affected by dispersion interactions, but to a minor extent. The Kohn-Sham equations were solved with a basis set determined by a 400 eV cutoff. The junction models were finite-size with the elongation direction chosen to be along the z-axis. The models were placed in a hexagonal supercell with and chosen to ensure that periodic replicas remained separated by a minimum of . The Brillouin zone sample was restricted to k=0 ( only). Constrained optimization was performed to meet a minimum force criterion of 0.005 to 0.01 .
Several constrained approaches were employed in this study. In the most restrictive, all degrees of freedom were constrained and the elongation of a specific bond was considered without other relaxation. To simulate the response of one link bond, including relaxation, a model consisting of one electrode and a molecule was constructed. The back-plane of the model electrode and the specific link bond contact atom (e.g., N for an amine link group) were constrained while all other atoms were allowed to relax. Finally, for the full junction simulations, the back-planes of the two electrode structures were constrained, but all other atoms were relaxed. In each case, the potential surface was mapped by taking finite steps in the separation defined by the constraints, with the force criterion for relaxation being satisfied at each step. For full junction simulations, was the typical step size, while for single interface simulations was used. In selected cases, smaller steps were used to explore regions of the potential surface where abrupt jumps in structure were encountered. The external force required to maintain the constrained system was calculated using a centered, finite difference approximation. For the examples where this could be easily compared to the internally computed forces on constrained atoms, the accuracy was found to be better than 0.05 nN, with 0.01-0.02 nN being more typical.
Application of this GGA approach to bulk Ag and Au yielded lattice parameters (4.155 and 4.173 ) larger than experiment (4.09 and 4.08 ), typical of the accuracy reported for PBE Klimes, Bowler, and Michaelides (2011). To probe the accuracy of the metal-organic donor acceptor bond energy, results for the molecular complex were compared to those from carefully converged coupled-cluster calculations Lambropoulos, Reimers, and Hush (2002). The GGA bond energy was too small by 0.11-0.13 eV. Previous analyses of the binding of ammonia and pyridine adsorption energies on Au(111) suggested at least 0.1 eV underestimate as well Bilic et al. (2002); Bilic, Reimers, and Hush (2002).
The donor-acceptor organo-metallic bonds in this study induce a local dipole near the bond. For example, C8NH2 (1,8-diaminooctane) bonded to the pyramid tip induces a dipole of nearly 10 D. The dipole for bonds to the trimer tip is less, but still significant. As the bond is elongated, the induced dipole gets smaller. The consequences for junction force-extension characteristics will be discussed in the next section. Selected tests with larger supercells (up to twice as large) showed that artifacts due to interactions with periodic replicas were small for the chosen supercell size, namely less than 0.02 eV for junction formation energy and 0.02 nN for .
IV Results and Discussion
Consider first the Au-N bond at the Au pyramid BP interface. As illustrated in Fig. 7, The proximal N position (dashed line) and the pyramid back-plane are held fixed. The vertical BP remains vertical as these are systematically separated, to probe the potential landscape of the bond. In this geometry, the lone pair on the N should have maximal overlap with the state on the apical Au atom, which is vertical in this case. This should optimize the strength of the donor-acceptor bond, calculated to be 0.75 eV. Allowing for relaxation, = 1.12 nN occurs at = 0.53 .
To remove the impact of other relaxation, while maintaining a common reference at large separation, the BP molecule was moved in steps from beyond 1 separation in towards the Au pyramid. Both components were frozen in their structures computed in isolation. The resulting bond energy is calculated to be 0.69 eV, smaller than before because the proximal structure near the energy minimum is not optimized. Relative to the minimum energy position, the initial stiffness is larger. At = 0.39 , = 0.92 nN. As illustrated in the scaled force extension plot in Fig. 7c, the potential is well fit by the universal form of Rose, et. al. Furthermore, with reference to Table 1, the corresponding predicted gives a bond energy of 0.61 eV; the same calculation for the Morse potential yields 0.65 eV. Both are in reasonable agreement with the actual value from DFT.
Now return to the full calculation with relaxation. The scaled force-extension plot makes it clear that this can not be fit by any of the simple, analytical models as such. However, it is natural to try the combination of a bond model and a series harmonic term (Eqs. (10 - 12)). Specifically, choosing in units of that reference the bond and recomputing a normalized force extension curve from the universal model of Rose, et. al, gives a good fit to the DFT-calculated data (Fig. 7c). From Eq. (12), the value implies . Using the calculated values noted above then gives and = 1.12 nN. This value of agrees well with the N-Au bond expansion found in the DFT calculations between equilibrium and maximum sustainable force, namely . From this, a bond energy is inferred from to be 0.68 eV; the same calculation for the Morse potential yields 0.73 eV. Both agree reasonably well with the original DFT calculated value of 0.75 eV. The fit to the renormalized model, one that accounts for an effective harmonic potential component in series with the bond, covers a finite section of the force extension curve including the force maximum and some distance beyond. These results suggest that this approach may be sufficient to extract the bond energy to a good approximation.
| DFT | Renormalized Rose, et al. | |||||
|---|---|---|---|---|---|---|
| Interface Bond | ||||||
| Au-C4NH2 | 0.79 | 1.10 | 0.54 | 2.90 | 0.40 | 0.75 |
| Ag-C4NH2 | 0.59 | 0.79 | 0.58 | 2.24 | 0.40 | 0.54 |
| Au-BDA | 0.63 | 0.83 | 0.52 | 4.31 | 0.42 | 0.59 |
| Au-BP | 0.75 | 1.11 | 0.53 | 2.15 | 0.36 | 0.68 |
| Au-C4SMe | 0.81 | 1.10 | 0.54 | 3.02 | 0.40 | 0.75 |
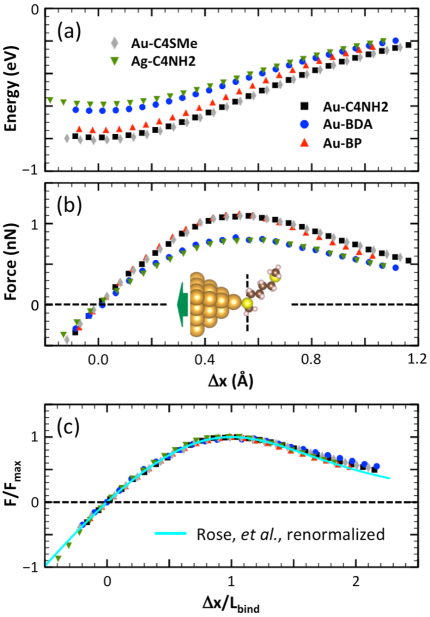
To probe the generality of this picture, DFT-calculated force extension characteristics for five different cases are collected in Fig. 8, all with full relaxation. These cases cover the range of molecules and link groups covered in prior research and include the BP case previously discussed. These model cases were all constructed so as to optimize the donor-acceptor bond, along the lines discussed for the BP case. However, in the cases of BDA, C4NH2 and C4SMe, the lone pair is at an obtuse angle relative to the main backbone of the molecule. Therefore, as illustrated previously for BDA Frei et al. (2011), the optimized orientation of the molecule in this calculation, as shown in the inset to Fig. 8b for Au-C4SMe, may differ from what would pertain in a full junction. Key parameters characterizing the potential energy and force extension of these five interface bonds are gathered in Table 2. The data for the bond energies and maximum sustainable forces track and form two close groupings. The values for all fall in the range . As the scaled force extension plot (Fig. 8c) shows, the bond model renormalized by a single effective harmonic potential accounts reasonably well for the data, based on the value that fit the Au-BP case.
While the deviations that are most apparant beyond the force maximum appear minor, they raise the natural question of whether the renormalized model can be fit to each individual trace and the extent to to which the correponding effective stiffness will vary. The fit parameter is the value of . Since static equilibium implies that the magnitude of the force associated to each component of the mechanical model in series is the same, it is easiest to use the force, derived from the DFT calculations for each value of , as the fixed part of the data set and the as the data to be fit by the model, through Eq. 10. The value of that here refers specifically to the local bond is obtained by inverting the analytical Rose, et al., model for that force, Eq. 2. Then the value of is determined by least squares fitting to the error in the modeled versus actual values of , all carried out in terms of scaled variables. The net result of this procedure was already illustrated for Au-BP in Fig. 7.
The results of this fitting procedure are shown in Table 2. Clearly, the variation in the value of is of some significance. Correspondingly, the ratio varies from 68% to 81%. Physically, some of the inferred variations in tip stiffness can be rationalized. For the N-Au bond in Au-BDA, this interface bond is relatively weak and correspondingly, there is less extension within the tip, thus probing a stiffer part of the Au-Au potential on average. On the other hand, Au-BP and Au-C4NH2 have the same maximum sustainable force, but induce a different stiffness response in the Au tip. This may indicate the impact of different degrees of charge transfer to the Au. But overall, the main conclusion is that fitting to a renormalized single bond model does a generally very good job of predicting the interface bond energy.
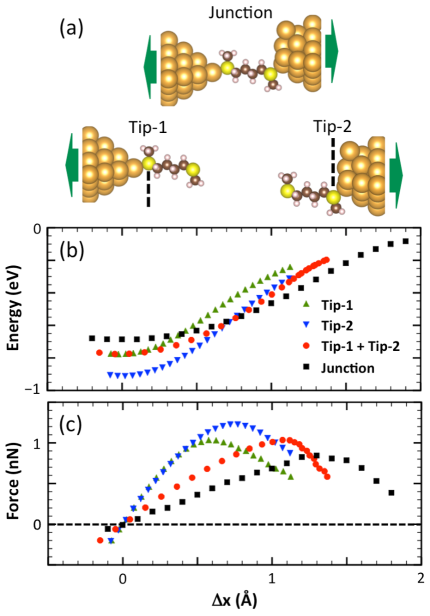
Next I consider the junction response as a whole and how it might differ from that predicted from the force extension characteristics of the two link bonds computed separately. To probe this, the Au-C4SMe junction was deconstructed. The structure and the potential surface calculated for the full junction are shown in Fig. 9. From the junction structure near its equilibrium, two model interface bonds are formed, as illustrated, holding the orientation of the molecular backbone fixed. Then the potential surface for each tip separately is computed in the same way as previously described. The proximal S atom is fixed (dashed line) while the outer S atom is only constrained perpendicular to the axis of elongation to maintain backbone orientation. Then the distance between the fixed S atom and the tip base layer are separated in steps. Both potential surfaces are different from the one reported in Fig. 8. The overlap between the S lone pair orbital and the contact Au d-orbitals depends on both the angle and the local Au atomic structure near by. As shown in Fig. 9, Tip-1 (the pyramid electrode) has a smaller bond energy and maximum sustainable force than Tip-2 (the trimer electrode). The S-Au bond for Tip-1 is the bond that breaks in the full junction, so the potential surface of Tip-1 aligns with that of the full junction near equilbrium.
From the data for the potential surface and force extension for Tip-1 and Tip-2 separately, a mechanical model with the two components in series was constructed based on static equilibrium, without any assumption about either component being harmonic. This model shows the same as Tip-1, as required, but a significantly larger and correspondingly a smaller stiffness. This reflects the storage of energy in the stretching of Tip-2, similar to the simple model in Fig. 4. However, this physical effect by itself is not sufficient to explain the full junction results.
First, as compared to the model based on Tip-1 and Tip-2, the full junction exhibits a smaller (0.85 nN versus 1.04 nN) and a larger ( versus ). Interestingly, the energy scale from the product is nearly the same (within 3 %). As the full junction is elongated, all the internal degrees of freedom can fully relax. For example, the molecule backbone does rotate a few degrees which alters the pathway through the individual interface bond potential surfaces. If this type of effect were the sole difference, it is conservative and indeed the energy parameter would be the same.
However, the second difference is in the equilbrium junction energy itself, which is not as deep as implied by the Tip-1 bond dissociation energy by itself. Since the Tip-1 and Tip-2 structures were specifically chosen from the junction structure near equilibrium, this implies that there are other interactions in play in the full junction. I have already discussed the dipole that is induced when the interface donor-acceptor bond is formed, e.g., N-Au in Sect. III. This will result in a long-range dipole-dipole interaction across the junction that is beyond what is captured in the Tip-1 and Tip-2 characteristics separately. In addition, there is tunnel coupling across the junction, which in general should lower the energy. Both effects should be junction separation dependent.
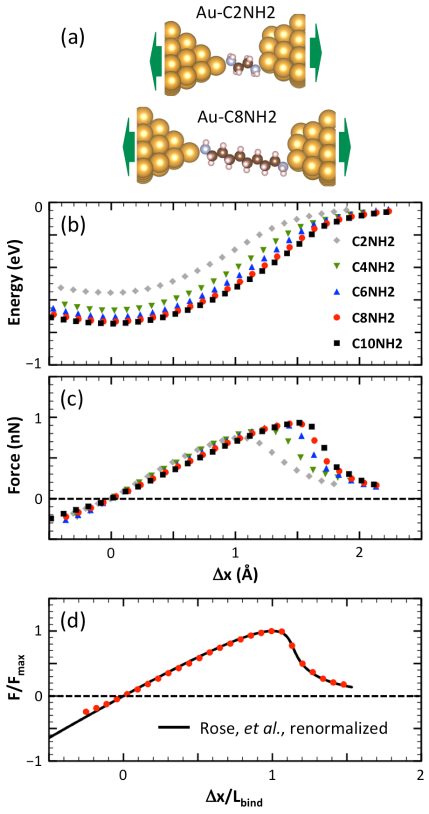
To probe junction separation dependence, I consider the series of diaminoalkane junctions C2NH2 to C10NH2. This keeps the chemical characteristics of the interface bond as fixed as possible. The initial, relative orientation of the alkane backbone and the alignment of the N lone pair orbital to the proximal Au atom to which the donor-acceptor bond forms are both kept approximately fixed in the construction of the series of junctions, also in an effort to make comparisons across the series as reliable as possible. Two of the junction structures are illustrated in Fig. 10a. The potential surface and force extension characteristic are shown in Figs. 10b and c respectively. The energy zero is taken from separated fragments following rupture of the weaker of the two interface bonds (namely the bond to the pyramid tip).
Several trends emerge. First, the shorter alkanes clearly result in junctions with a smaller net bond energy. Second, the differences are systematically getting smaller for longer alkanes. Third, these differences are also reflected in the stiffness of the junction near equilibrium, with longer alkanes having a softer response. Correspondingly, the and the are larger for the longer alkanes. For C2NH2, and , while is and , and is 0.92 nN and 0.93 nN, for C8NH2 and C10NH2 respectively. Fourth, the shape of the force extension characteristic is clearly affected, with the shorter alkanes exhibiting a more symmetrical response around the force maximum. However, an overall shape with a sharper drop-off after the maximum appears to be the limit for the longer alkanes.
To probe this more quantitatively, I consider a metric for the cooperative junction effect on the binding energy. First, define as the energy cost to remove the molecule completely from the junction, relative to the three resultant fragments. This is the net binding energy of the molecule in the junction, including cooperative effects. Second, define and as the energy cost to break the bond to Au tip-1 in the absence of Au tip-2 relative to the two resultant fragments, and the opposite. These are the binding energies associated with each interface separately, with no cooperative effects. Then the net cooperative effect is:
| (16) |
Correspondingly, the junction separation is measured by the distance between the individual Au atom on each tip to which the respective amine link group binds. This calculation was performed starting from the junction structure near its equilibrium separation. It can be done with all fragments frozen, or they can be relaxed in a way that constrains remaining bonds to be representative of the junction structure. The final results do not depend significantly on this choice The results, including relaxation of the fragments, for the alkane series from C2NH2 to C10NH2 are shown in Fig. 11. As already implied by Fig. 10b, the net cooperative effect on binding in the junction is to destabilize the narrower junctions.
The impact of tunnel coupling is hard to estimate for these models specifically. Qualitatively, it should be attractive (not repulsive) and it should depend exponentially on the molecule backbone length. On the scale of interest here, it should be neglibable for the longer alkanes studied here.
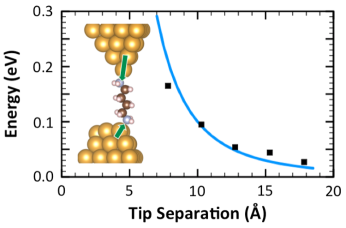
As noted in Sect. III for the Au-C8NH2 junction model specifically, the N-Au bond to the pyramid tip induces a dipole of or about 10 D with sign that corresponds to electron transfer to the Au tip. The bond to the trimer induces a dipole of , also corresponding to electron transfer to the Au tip. These dipoles are predominantly aligned to the axis of the junction, as the green arrows in the inset to Fig. 11 indicate, and oppositely directed. Estimates of the dipole for Au-C4NH2 are similar. Using the approximation that the dipoles are specifically on a common axis and oppositely directed, the interaction energy is and repulsive. With the values mentioned for the dipoles, this energy correction is plotted versus junction separation in Fig. 11. Both the magnitude and the separation dependence agree with the DFT-based data reasonably well, particularly considering that the definition of the dipole separation is somewhat arbitrary.
The induced dipole-dipole interactions also affect the shape of the force extension characteristic. Stretching the donor-acceptor bond reduces the dipole. Therefore, there are two contributions to the force:
| (17) |
Since the induced dipole is reduced as junction separation is increased, the first term is also negative. Calculations show that drop by about 25% from the equilibrium separation to for Au-C8NH2, so the first term is quantatively important. For C2NH2, the estimated affect on the junction force is about . Furthermore, because it drops off with junction extension, it will tend to lower the force extension characteristic more near zero and less beyond the force maximum. This will reduce and , as well as make the characteristic more symmetric around the maximum. Both effects are observed in the force extension characteristics for the short alkane cases (C2NH2 and C4NH2) relative to those for the longer ones (C8NH2 and C10NH2). All together, the energy estimates and the force estimates indicate that induced dipole-dipole interactions account for much of the variation with length seen among the alkane series in Fig. 10. Furthermore, most of the effect will be negligable for C8, C10 and longer molecules.
This suggests testing the renormalized Rose, et al., potential for one of the longer molecular examples. Figure 10d shows the fit that results with . This is much softer than the fits for the single interface data. However, there are now two bonds in series, the N-Au bonds, and both deformable electrodes. From = 0.92 nN and = 1.45 Å, the fit implies = 0.47 Å. This is somewhat larger than the value inferred for an optimized N-Au bond from the interface bond calculation with C4NH2 (see Table 2). However, as I noted in the analysis of Fig. 9, there is more flexibility for relaxation in the full junction and the pathway followed locally as the N-Au bond is elongated may be different due to the junction constraints. Thus, a softer bond here (lower and long may be expected. Interestingly, bond energy inferred is 0.73 eV, essentially identical to the DFT result for breaking the junction into two fragments.
Previously, I presented a comparison of the scaled force extension characteristic for the series of molecular junctions Au-C4NH2, Au-BDA, Au-BP and Au-C4SMe, as well as models for the Au-Au and Ag-Ag point contact Hybertsen and Venkataraman (2016). The data scaled remarkably well up to the force maximum. However, after the maximum, there were significant deviations, attributed in part to the stored energy in the more stable of the two bonds. The results presented here suggest that for several of those cases, there are also cooperative effects such as induced dipole-dipole interactions that affect the shape of the force extension characteristic. For cases where those cooperative effects are negligable, the present analysis of C8NH2 with a renormalized bond potential is encouraging of the idea that a tractable fitting form may be achieved. However, it will require an additional parameter, such as to incorporate the physical effects of stored energy in the other, deformable parts of the junction, a step beyond the two parameter function used previously Aradhya et al. (2014); Hybertsen and Venkataraman (2016).
There is another factor that needs further analysis, as illustrated by the Au-BP case. It showed the sharpest drop-off after the force maximum. Although the molecule is long enough that cooperative effects may be minimal, it turns out that the two Au-N bonds have very similar force maxima in that Au-BP case. That junction is an example of one I have explored numerically in which the instability due to nearly equal extension of the two bonds up to the point of rupture was essentially realized. While I was able to execute fits to the renormalized Rose, et al., potential model, those fits were not robust. This example points to two important factors. First adequate data after the force maximum likely controls the fit. Second, there is a class of nearly symmetric junction structures in which the details of the elongation near the maximum depend not just on the generic storage of energy, but on the more specific, non-linear form of those deformable components.
V Concluding Remarks
I have used a series of DFT-based simulations of exemplary single molecule junctions to dissect the contributions to the overall mechanical response of such junctions to external stress up through and beyond the extension corresponding to the maximum sustainable force. I have focused on link bond motifs for which there is extensive experimental data. In this study, dispersion interactions have not been explicitly considered, but likely will play an important role in further research. The presentation of the force extension characteristic in scaled form, force scale and , the distance from the equilibrium bond length to the extension corresponding to maximum sustainable force for length, reveals qualitative changes in those characteristics.
When the response of the interface to strain is restricted to just the extension of the link bond itself, say N-Au, then the force-extension characteristic closely fits the universal form proposed by Rose, et al. Interestingly, when the Morse potential or the Lennard-Jones potential are scaled in the same way, their shape is almost indistinguishable over the range of extension from near equilibrium well through the point of maximum sustainable force. Only at larger extension does the Lennard-Jones potential appreciably depart in form. This corresponds to the power-law decay chosen to follow the asymptotic form for dispersion interactions. While not considered here explicitly, dispersion interactions can have a number of important impacts, both in quantitative analysis of the bond strength and in the contribution of proximal, non-specific interface interactions.
Still focusing on one interface, when the other atoms proximal to the link bond are allowed to relax, the shape of the force extension characteristic changes. The stiffness is reduced and the shape in the region following the point of maximum sustainable force changes. Physically, this can be understood in terms of additional deformable structures in series with the link bond. During the initial extension, up to the point of maximum sustainable force (dictated by the link bond itself here), some of the work is stored in those other distortions. This stretches the characteristic in this region. After the point of the force maximum is passed, this energy is released, slowing the net extension of the overall system. The region beyond the force maximum is compressed. For a practical model, this is at least approximately captured by putting a model such as the universal model of Rose, et al., in series with harmonic elements. Analysis shows that the harmonic elements can be represented by an effective spring constant and the best fit to the data presented here requires a stiffness for the series harmonic term that is smaller than the bond stiffness itself near the equilibrium bond length.
The force extension characteristics for the full junctions studied here show further effects of multiple deformable structures in series. The weakest bond controls the maximum sustainable force of the junction as a whole, assuming basic, static equilibrium at each point of extension. The simplest model, e.g., combining two bonds represented by the universal model of Rose, et al., shows the basic physical effects of stored energy in the stiffer bond, but the resulting shape of such a model force extension does not fit well to that of the full calculations. The additional deformation of the electrode tips alters the shape of the force extension characteristic.
To probe cooperative effects in the junctions, I have taken exemplary cases and isolated the DFT-based predictions for the force extension of each of the interface bonds separately, including local relaxation effects. When these are combined to model the full junction, again relying on static equilibrium, the results qualitatively show the reduced stiffness and increased observed for the junction as a whole. However, the full junction shows a larger and a smaller . This can be understood qualitatively. The interior junction degrees of freedom can fully respond to the externally applied stress. The link bonds can extend following a trajectory that is locally more optimal than that captured by the constrained trajectories of the individual interface bonds when extended separately. Furthermore, in terms of estimating the bond energy, the product is very similar between the two calculations.
The other key difference is a smaller net binding energy in the junction, indicating cooperative effects in the total energy of the junction. A systematic study of the amine-linked alkane junction series C2NH2 to C10NH2 clearly revealed a strong length dependence of this energy difference. To a first approximation, interactions between the dipoles induced by each link bond accounted for this energy. Furthermore, these effects were negligible for the longer molecules, e.g., octane and decane.
One of the objectives of this analysis has been to identify key factors that will support accurate modeling of individual, measured force-extension characteristics. While more research is clearly needed, the present work does point to some useful directions. First, cooperative effects influence the mechanical characteristics of short molecules. These may be smaller than found here when the screening of the rest of the experimental environment is included (extended metal electrodes and solvent). However, even in the extreme conditions here of minimal screening, the dipole derived effects are minimal for modest length molecules (tip separations beyond about ). Second, the impact of stored energy in the second junction bond and other deformable parts of the junction which enter in series, need to be considered in further modeling. In experiments, part of this problem can be minimized by study of asymmetrical molecular systems in which one side will bond more strongly to the electrode, minimizing the contribution of that bond. The other promising avenue will be further analysis of simple forms modified by an effective harmonic representation of the other series contributions. This does involve a third parameter in fitting and analysis. Experience with fitting the simulation results suggests that the information contained in the region of the force extension characteristic near the force maximum and to some distance beyond will be important. While the target single molecule junction structures should generally be mechanically stable along the pulling axis, in practice, measured junctions will exhibit bond rupture due to other fluctuations and instabilities. This will naturally limit the scope of the force extension characteristic segment available for fitting. It may be challenging to capture more data in the measured force extension characteristics beyond the point of maximum sustainable force.
Acknowledgements
I gratefully acknowledge close collaboration with L. Venkataraman throughout the work described here as well as with several members of her research group who have been coauthors on prior, joint publications. This work was done using resources from the Center for Functional Nanomaterials, which is a U.S. DOE Office of Science User Facility at Brookhaven National Laboratory under Contract No. DE-SC0012704.
References
- Giessibl (2003) F. J. Giessibl, Rev. Mod. Phys. 75, 949 (2003).
- Beyer and Clausen-Schaumann (2005) M. K. Beyer and H. Clausen-Schaumann, Chem. Rev. 105, 2921 (2005).
- Hickenboth et al. (2007) C. R. Hickenboth, J. S. Moore, S. R. White, N. R. Sottos, J. Baudry, and S. R. Wilson, Nature 446, 423 (2007).
- Davis et al. (2009) D. A. Davis, A. Hamilton, J. Yang, L. D. Cremar, D. Van Gough, S. L. Potisek, M. T. Ong, P. V. Braun, T. J. Martinez, S. R. White, J. S. Moore, and N. R. Sottos, Nature 459, 68 (2009), 10.1038/nature07970.
- Lantz et al. (2001) M. A. Lantz, H. J. Hug, R. Hoffmann, P. J. van Schendel, P. Kappenberger, S. Martin, A. Baratoff, and H. J. Guntherodt, Science 291, 2580 (2001).
- Sugimoto et al. (2007) Y. Sugimoto, P. Pou, M. Abe, P. Jelinek, R. Perez, S. Morita, and O. Custance, Nature 446, 64 (2007).
- Albers et al. (2009) B. J. Albers, T. C. Schwendemann, M. Z. Baykara, N. Pilet, M. Liebmann, E. I. Altman, and U. D. Schwarz, Nature Nanotech. 4, 307 (2009).
- Welker and Giessibl (2012) J. Welker and F. J. Giessibl, Science 336, 444 (2012).
- de Oteyza et al. (2013) D. G. de Oteyza, P. Gorman, Y.-C. Chen, S. Wickenburg, A. Riss, D. J. Mowbray, G. Etkin, Z. Pedramrazi, H.-Z. Tsai, A. Rubio, M. F. Crommie, and F. R. Fischer, Science 340, 1434 (2013).
- Muller and Dufrene (2008) D. J. Muller and Y. F. Dufrene, Nature Nanotech. 3, 261 (2008), 10.1038/nnano.2008.100.
- Neuman and Nagy (2008) K. C. Neuman and A. Nagy, Nat Meth 5, 491 (2008).
- Grandbois et al. (1999) M. Grandbois, M. Beyer, M. Rief, H. Clausen-Schaumann, and H. E. Gaub, Science 283, 1727 (1999).
- Wagner et al. (2012) C. Wagner, N. Fournier, F. S. Tautz, and R. Temirov, Phys. Rev. Lett. 109, 076102 (2012).
- Frei et al. (2011) M. Frei, S. V. Aradhya, M. Koentopp, M. S. Hybertsen, and L. Venkataraman, Nano Lett. 11, 1518 (2011).
- Aradhya et al. (2012) S. V. Aradhya, M. Frei, M. S. Hybertsen, and L. Venkataraman, Nature Mat. 11, 872 (2012).
- Aradhya et al. (2014) S. V. Aradhya, A. Nielsen, M. S. Hybertsen, and L. Venkataraman, ACS Nano 8, 7522 (2014).
- Hybertsen and Venkataraman (2016) M. S. Hybertsen and L. Venkataraman, Acc. Chem. Res. 49, 452 (2016).
- Olesen et al. (1994) L. Olesen, E. Laegsgaard, I. Stensgaard, F. Besenbacher, J. Schiotz, P. Stoltze, K. W. Jacobsen, and J. K. Norskov, Phys. Rev. Lett. 72, 2251 (1994).
- Rubio, Agrait, and Vieira (1996) G. Rubio, N. Agrait, and S. Vieira, Phys. Rev. Lett. 76, 2302 (1996).
- Rubio-Bollinger et al. (2001) G. Rubio-Bollinger, S. R. Bahn, N. Agrait, K. W. Jacobsen, and S. Vieira, Phys. Rev. Lett. 8702, 026101 (2001).
- Xu and Tao (2003) B. Q. Xu and N. J. Tao, Science 301, 1221 (2003).
- Venkataraman et al. (2006a) L. Venkataraman, J. E. Klare, I. W. Tam, C. Nuckolls, M. S. Hybertsen, and M. L. Steigerwald, Nano Lett. 6, 458 (2006a).
- Venkataraman et al. (2006b) L. Venkataraman, J. E. Klare, C. Nuckolls, M. S. Hybertsen, and M. L. Steigerwald, Nature 442, 904 (2006b).
- McCreery and Bergren (2009) R. L. McCreery and A. J. Bergren, Advanced Materials 21, 4303 (2009).
- Aradhya and Venkataraman (2013) S. V. Aradhya and L. Venkataraman, Nature Nanotech. 8, 399 (2013).
- Nichols and Higgins (2015) R. J. Nichols and S. J. Higgins, Annual Review of Analytical Chemistry 8, 389 (2015).
- Xu, Xiao, and Tao (2003) B. Q. Xu, X. Y. Xiao, and N. J. Tao, J. Am. Chem. Soc. 125, 16164 (2003).
- Ribas-Arino and Marx (2012) J. Ribas-Arino and D. Marx, Chem. Rev. 112, 5412 (2012).
- Landman et al. (1990) U. Landman, W. D. Luedtke, N. A. Burnham, and R. J. Colton, Science 248, 454 (1990).
- Sorensen, Brandbyge, and Jacobsen (1998) M. R. Sorensen, M. Brandbyge, and K. W. Jacobsen, Phys. Rev. B 57, 3283 (1998).
- Bahn and Jacobsen (2001) S. R. Bahn and K. W. Jacobsen, Phys. Rev. Lett. 87, 266101 (2001).
- Dreher et al. (2005) M. Dreher, F. Pauly, J. Heurich, J. C. Cuevas, E. Scheer, and P. Nielaba, Phys. Rev. B 72, 075435 (2005).
- Pauly et al. (2006) F. Pauly, M. Dreher, J. K. Viljas, M. Hafner, J. C. Cuevas, and P. Nielaba, Phys. Rev. B 74, 235106 (2006).
- Pu et al. (2010) Q. Pu, Y. Leng, X. Zhao, and P. T. Cummings, J. Phys. Chem. C 114, 10365 (2010).
- French, Iacovella, and Cummings (2011) W. R. French, C. R. Iacovella, and P. T. Cummings, J. Phys. Chem. C 115, 18422 (2011).
- Wang and Leng (2011) H. Wang and Y. Leng, Phys. Rev. B 84, 245422 (2011), pRB.
- Sabater et al. (2012) C. Sabater, C. Untiedt, J. J. Palacios, and M. J. Caturla, Phys. Rev. Lett. 108, 205502 (2012).
- French et al. (2013) W. R. French, C. R. Iacovella, I. Rungger, A. M. Souza, S. Sanvito, and P. T. Cummings, J. Phys. Chem. Lett. 4, 887 (2013).
- Jelinek et al. (2008) P. Jelinek, R. Perez, J. Ortega, and F. Flores, Phys. Rev. B 77, 115447 (2008).
- Thiess et al. (2008) A. Thiess, Y. Mokrousov, S. Blügel, and S. Heinze, Nano Lett. 8, 2144 (2008).
- Tavazza, Levine, and Chaka (2009) F. Tavazza, L. E. Levine, and A. M. Chaka, J. Appl. Phys. 106, 043522 (2009).
- da Silva, da Silva, and Fazzio (2001) E. Z. da Silva, A. J. R. da Silva, and A. Fazzio, Phys. Rev. Lett. 87, 256102 (2001).
- da Silva et al. (2004) E. Z. da Silva, F. D. Novaes, A. J. R. da Silva, and A. Fazzio, Phys. Rev. B 69, 115411 (2004).
- Finbow, McDonald, and I (1997) B. G. M. Finbow, R. M. L.-B. McDonald, and R. I, Molecular Physics 92, 705 (1997).
- Kruger et al. (2002) D. Kruger, H. Fuchs, R. Rousseau, D. Marx, and M. Parrinello, Phys. Rev. Lett. 89, 186402 (2002).
- Wang and Leng (2015) H. Wang and Y. Leng, J. Phys. Chem. C 119, 15216 (2015).
- Paulsson et al. (2009) M. Paulsson, C. Krag, T. Frederiksen, and M. Brandbyge, Nano Lett. 9, 117 (2009).
- Strange, Lopez-Acevedo, and Häkkinen (2010) M. Strange, O. Lopez-Acevedo, and H. Häkkinen, J. Phys. Chem. Lett. 1, 1528 (2010).
- Stadler, Thygesen, and Jacobsen (2005) R. Stadler, K. S. Thygesen, and K. W. Jacobsen, Phys. Rev. B 72, 241401 (2005).
- Romaner et al. (2006) L. Romaner, G. Heimel, M. Gruber, J.-L. Brédas, and E. Zojer, Small 2, 1468 (2006).
- Batista et al. (2007) R. J. C. Batista, P. Ordejón, H. Chacham, and E. Artacho, Phys. Rev. B 75, 041402 (2007), pRB.
- Li and Kosov (2007) Z. Li and D. Kosov, Phys. Rev. B 76, 035415 (2007).
- Hoft et al. (2008) R. C. Hoft, M. J. Ford, V. M. García-Suárez, C. J. Lambert, and M. B. Cortie, J. Phys.: Condens. Matter 20, 025207 (2008).
- Qi et al. (2009) Y. H. Qi, J. Y. Qin, G. L. Zhang, and T. Zhang, J. Am. Chem. Soc. 131, 16418 (2009).
- Kamenetska et al. (2009) M. Kamenetska, M. Koentopp, A. Whalley, Y. S. Park, M. Steigerwald, C. Nuckolls, M. Hybertsen, and L. Venkataraman, Phys. Rev. Lett. 102, 126803 (2009).
- Frei et al. (2012) M. Frei, S. V. Aradhya, M. S. Hybertsen, and L. Venkataraman, J. Am. Chem. Soc. 134, 4003 (2012).
- Kramers (1940) H. A. Kramers, Physica 7, 283 (1940).
- Hanggi, Talkner, and Borkovec (1990) P. Hanggi, P. Talkner, and M. Borkovec, Rev. Mod. Phys. 62, 251 (1990).
- Evans (2001) E. Evans, Annu. Rev. Biophys. Biomol. Struct. 30, 105 (2001).
- Friddle et al. (2008) R. W. Friddle, P. Podsiadlo, A. B. Artyukhin, and A. Noy, J. Phys. Chem. C 112, 4986 (2008).
- Rose, Ferrante, and Smith (1981) J. H. Rose, J. Ferrante, and J. R. Smith, Phys. Rev. Lett. 47, 675 (1981).
- Morse (1929) P. M. Morse, Phys. Rev. 34, 57 (1929).
- Jones (1924) J. E. Jones, Proc. R. Soc. London, Ser. A 106, 463 (1924).
- Kresse and Furthmuller (1996) G. Kresse and J. Furthmuller, Phys. Rev. B 54, 11169 (1996).
- Momma and Izumi (2011) K. Momma and F. Izumi, J. Appl. Crystallogr. 44, 1272 (2011).
- Blöchl (1994) P. E. Blöchl, Phys. Rev. B 50, 17953 (1994).
- Kresse and Joubert (1999) G. Kresse and D. Joubert, Phys. Rev. B 59, 1758 (1999).
- Perdew, Burke, and Ernzerhof (1996) J. P. Perdew, K. Burke, and M. Ernzerhof, Phys. Rev. Lett. 77, 3865 (1996).
- Klimes, Bowler, and Michaelides (2011) J. Klimes, D. R. Bowler, and A. Michaelides, Phys. Rev. B 83, 195131 (2011).
- Lambropoulos, Reimers, and Hush (2002) N. A. Lambropoulos, J. R. Reimers, and N. S. Hush, J. Chem. Phys. 116, 10277 (2002).
- Bilic et al. (2002) A. Bilic, J. R. Reimers, N. S. Hush, and J. Hafner, J. Chem. Phys. 116, 8981 (2002).
- Bilic, Reimers, and Hush (2002) A. Bilic, J. R. Reimers, and N. S. Hush, J. Phys. Chem. B 106, 6740 (2002).