Uncertainties in Atmospheric Muon-Neutrino Fluxes Arising from Cosmic-Ray Primaries
Abstract
We present an updated calculation of the uncertainties on the atmospheric muon-neutrino flux arising from cosmic-ray primaries. For the first time, we include recent measurements of the cosmic-ray primaries collected since 2005. We apply a statistical technique that allows the determination of correlations between the parameters of the GSHL primary-flux parametrisation and the incorporation of these correlations into the uncertainty on the muon-neutrino flux. We obtain an uncertainty related to the primary cosmic rays of around , depending on energy, which is about a factor of two smaller than the previously determined uncertainty. The hadron production uncertainty is added in quadrature to obtain the total uncertainty on the neutrino flux, which is reduced by . To take into account an unexpected hardening of the spectrum of primaries above energies of 100 GeV observed in recent measurements, we propose an alternative parametrisation and discuss its impact on the neutrino flux uncertainties.
pacs:
13.85.Tp, 14.60.Pq, 96.50.sbI Introduction
Interactions of primary cosmic rays with nuclei in the atmosphere produce neutrinos. The broad ranges covered in neutrino energy and path length allow experiments to investigate a wide range of the ratio and, by extension, to measure the larger neutrino mass-squared difference, , with great precision Abe et al. (2011a); Aartsen et al. (2015). The aim of several proposed detectors, such as PINGU Aartsen et al. (2014, 2016), ORCA Adrian-Martinez et al. (2016), and Hyper-Kamiokande Abe et al. (2011b), is the determination of the neutrino mass ordering (NMO) by detecting atmospheric neutrinos that have traversed the Earth. To obtain a robust estimate of the significance of such an NMO determination, the uncertainties on the neutrino flux must be properly estimated.
The largest sources of uncertainty on the atmospheric neutrino flux stem from the uncertainties on the flux of cosmic-ray primaries and on the hadron production mechanisms occurring in the atmosphere. Barr et al. Barr et al. (2006) studied both effects and evaluated the resulting uncertainty on the estimated atmospheric neutrino flux. Since 2005, new data on cosmic-ray primaries have been published that are not included in their analysis. Here, we therefore use an updated technique to incorporate recent data and to obtain a new, more robust estimate of the uncertainties on the atmospheric muon-neutrino flux arising from cosmic-ray primaries. We also determine the possible improvement coming from using an alternative parametrization of the neutrino flux.
II Primary Spectrum
The measured flux of primary cosmic rays covers up to 12 orders of magnitude in particle energy, ranging from eV to eV, which necessitates the use of different experimental techniques for their detection Fedynitch et al. (2013). Measurements below about GeV are possible with magnetic spectrometers, installed either on balloons (BESS Shikaze et al. (2007); Wang et al. (2002); Seo et al. (2000); Abe et al. (2016), CAPRICE Boezio et al. (1999, 2003)) or spacecraft (AMS Alcaraz et al. (2000a, b), AMS-02 Aguilar et al. (2015a, b), PAMELA Adriani et al. (2013a, 2011)). Measurements at higher energies are made with balloon-borne (ATIC Panov et al. (2009), CREAM Yoon et al. (2011)) and spacecraft mounted calorimeters (SOKOL Ivanenko et al. (1993), PAMELA Adriani et al. (2013b)). Previously, emulsion chambers have also been used (JACEE Christ et al. (1998), RUNJOB Derbina et al. (2005)). See, e.g., Ref. Zatsepin and Sokolskaya (2006) for more discussions of the different data sets. Since these emulsion and calorimeter detectors do not capture all the energy of the primary, their energy measurements are not as accurate as that of spectrometers Gaisser and Honda (2002). Above an energy of GeV the primary flux becomes extremely low, and indirect techniques must be employed using extensive ground-based air shower arrays Fedynitch et al. (2013).
Different parametrisations of the primary cosmic-ray flux have been proposed. A description of these parametrisations can be found in Fedynitch et al. Fedynitch et al. (2013). Several parametrisations, like Hillas-Gaisser Gaisser (2012), Zatsepin-Sokolskaya Zatsepin and Sokolskaya (2006) and poly-gonato Ter-Antonyan and Haroyan (2000); Hoerandel (2003) aim at reproducing the features of the primary spectrum at higher energies, such as the knee at GeV and the ankle at GeV.
When performing a fit to cosmic-ray data including energies below GeV/n (energy per nucleon), the effect of the solar wind cannot be neglected. It causes low energy cosmic rays to be decelerated and thus changes their flux as measured on Earth, leading to a significant anti-correlation between solar activity and the low energy flux of cosmic rays Gaisser and Stanev (2000).
The GSHL parametrisation Gaisser et al. (2001); Gaisser and Honda (2002) is derived using low-energy data (below GeV/n) and is parametrised in conditions of solar minimum. A variant of the GSHL parametrisation has also been developed by Honda et al. Honda et al. (2007), where a function depending on the neutron monitor count accounts for variations of the modulation in the solar cycle.
| Data Set | Acceptability | Mutual Compatibility | ||||||
| Proton | ||||||||
| 1 | CREAMI | 10 | 57.0 | 47.0 | 4.5 | 883.8 | 876.6 | 7.2 |
| 2 | AMS01 | 26 | 23.1 | 2.9 | 7.2 | 917.7 | 916.2 | 1.5 |
| 3 | AMS02 | 49 | 151.2 | 102.2 | 9.9 | 789.5 | 713.9 | 75.7 |
| 4 | PAMELACALO | 8 | 28.8 | 20.8 | 4.0 | 912.0 | 911.9 | 0.1 |
| 5 | RUNJOB | 6 | 1.7 | 4.3 | 3.5 | 939.0 | 939.0 | 0.0 |
| 6 | PAMELA | 142 | 157.3 | 15.3 | 16.9 | 783.5 | 762.6 | 20.9 |
| 7 | SOKOL | 13 | 111.0 | 98.0 | 5.1 | 829.8 | 828.0 | 1.7 |
| 8 | BESS | 57 | 67.2 | 10.2 | 10.7 | 873.6 | 872.0 | 1.6 |
| 9 | ATIC02 | 15 | 324.7 | 309.7 | 5.5 | 616.0 | 556.9 | 59.1 |
| 10 | JACEE | 5 | 18.7 | 13.7 | 3.2 | 922.1 | 921.9 | 0.2 |
| Helium | ||||||||
| 1 | CREAMI | 10 | 38.6 | 28.6 | 4.5 | 3910.2 | 3908.7 | 1.5 |
| 2 | AMS01 | 26 | 233.6 | 207.6 | 7.2 | 3715.2 | 3691.0 | 24.2 |
| 3 | AMS02 | 42 | 1116.7 | 1074.7 | 9.2 | 2832.1 | 2243.6 | 588.5 |
| 4 | PAMELACALO | 6 | 16.9 | 10.9 | 3.5 | 3932.0 | 3932.0 | 0.0 |
| 5 | RUNJOB | 6 | 125.8 | 119.8 | 3.5 | 3823.1 | 3819.9 | 3.1 |
| 6 | PAMELA | 66 | 207.3 | 141.3 | 11.5 | 3741.5 | 3679.1 | 62.4 |
| 7 | SOKOL | 8 | 30.6 | 22.6 | 4.0 | 3918.2 | 3917.9 | 0.3 |
| 8 | BESS | 117 | 551.0 | 434.0 | 15.3 | 3397.8 | 3367.9 | 29.9 |
| 9 | ATIC02 | 15 | 1616.5 | 1601.5 | 5.5 | 2332.3 | 1217.7 | 1114.6 |
| 10 | JACEE | 6 | 11.8 | 5.8 | 3.5 | 3937.0 | 3937.0 | 0.0 |
In this article, we use the original GSHL parametrisation proposed in Ref. Gaisser et al. (2001); Gaisser and Honda (2002), which was also used by Barr et al. Barr et al. (2006) to determine the uncertainties associated with the atmospheric muon-neutrino flux. It is given by
| (1) |
where is the primary kinetic energy in units of GeV (GeV/nucleon for nuclear cosmic rays) and is the differential spectral index. This parametrisation is an extension to the power-law spectrum
| (2) |
where is a normalization factor and the spectral index. The parameters and govern the effects of solar modulation on the primary flux and are relevant only at energies GeV/n.
III Data sets and Fitting Techniques
Barr et al. Barr et al. (2006) use data published by the AMS, BESS, CAPRICE, JACEE, RUNJOB, and SOKOL Collaborations. In addition, we also include the recent cosmic-ray measurements performed by the AMS-02, ATIC, CREAM, and PAMELA Collaborations. These new data sets will change the results of the global fit of the neutrino flux and the associated uncertainties. We perform a global fit to the spectrum using the GSHL parametrisation (Eq. (1)). The uncertainties on the parameters , , , and determined from the fit are then propagated to estimate how each parameter affects the total uncertainty on the atmospheric neutrino flux.
The time period during which each data set is measured can be used to assign a solar modulation potential Usoskin et al. (2011), which presents a series of reconstructed monthly values of modulation potential determined from neutron monitor data. The effects of the solar wind becomes small above an energy of GeV/n Gaisser and Stanev (2000). Below this energy we only retain data points belonging to data sets with similar values of the solar modulation potential. The ranges are MV and MV for the proton and helium fluxes, respectively. They are chosen to include data from all different low-energy, low-solar modulation experiments (AMS, BESS, PAMELA) while keeping the inclusion range as small as possible. The ranges are also consistent with the initial assumption that the GSHL formula can be parametrised in conditions of a solar minimum. An estimate of the effects of different solar modulation values on the atmospheric neutrino flux is reported in Ref. Gaisser and Honda (2002). The difference between conditions of solar minimum and maximum amounts to an effect of on the atmospheric neutrino flux at Kamioka, and at the high latitude sites, Soudan and Sudbury.
We do not include the CAPRICE data points Boezio et al. (1999, 2003), previously used in Ref. Barr et al. (2006), because of the disagreement in the mid-energy corridor (– GeV/n) between the CAPRICE data and the remaining data sets in this range, which agree well with each other. The /d.o.f. for the CAPRICE data set has a value of , which is to be compared with the values for AMS (), PAMELA () and BESS ().
We use a function for the global fit,
| (3) |
where labels the data sets used in the fit, is the value of the data point from data set , with uncertainty , and is the value expected from the GSHL parametrisation for that specific data point.
Minimizing yields the set of GSHL parameters that fit best all the data sets. To determine uncertainties corresponding to one standard deviation (), the neighbourhood of the minimum in parameter space is scanned. For uncorrelated uncertainties, the range corresponds to
| (4) |
where is the minimum of the function (see, e.g. Appendix A of Ref. Stump et al. (2001)). If correlations are fully known and properly incorporated in the covariance matrix used to calculate , the criterion remains valid. If correlations are not known, the value of necessary to properly estimate the uncertainties can be significantly larger than . Point-to-point correlations within each data set are not known for all experiments Alcaraz et al. (2000a, b); Aguilar et al. (2015a, b); Panov et al. (2009); Shikaze et al. (2007); Wang et al. (2002); Seo et al. (2000); Abe et al. (2016); Boezio et al. (1999, 2003); Yoon et al. (2011); Christ et al. (1998); Adriani et al. (2013a, 2011, b); Derbina et al. (2005); Ivanenko et al. (1993). Correlation between different data sets (experiment-to-experiment) are also unknown. The criterion would thus lead to a large underestimation of the uncertainties associated with the GSHL parameters and consequently of the uncertainties associated with the atmospheric neutrino flux.
A similar problem arises when fitting a large number of data sets to extract parton distribution functions of the proton. We thus use an approach based on methods developed for fitting such data sets Stump et al. (2001); Pumplin et al. (2001), with
| (5) |
where is a tolerance parameter that is determined by considerations of self-consistency. In this article, we follow two different methods to assign a value to , based on the two assumptions that the data sets used in the global fit are acceptable and mutually compatible. These methods take into account deviations from ideal statistical expectations observed for some data sets and indications of inconsistency between data sets if uncertainties are interpreted applying purely statistical rules Pumplin et al. (2001).
| Parameter | Proton | Helium |
|---|---|---|
| ( 200 GeV/n) | ||
| ( 200 GeV/n) |
The first criterion, acceptability, assigns a value to based on how well each individual experiment agrees with the best-fit GSHL function. We perform a global fit, yielding , to all data sets to determine the best set of parameters . For each individual data set, is then calculated. The parameters are fixed to the parameter set . The subscript is used to indicate that is not minimised, but is calculated leaving the parameters fixed to the best set obtained from the global fit. If the uncertainties were ideal, we would expect each to be within the range , where is the number of data points in the data set labelled . Large deviations of from the expected value can be attributed to unknown systematic uncertainties or unexpected large fluctuations. To take these factors in account, we must anticipate a tolerance for that is larger than that for an “ideal” function.
The second criterion, mutual compatibility, determines a value for based on the degree of consistency between an individual data set and the remaining data sets. This is done by removing each of the data sets in turn from the analysis and calculating . The set of parameters is then adjusted to minimise and obtain . The difference between the two values is calculated as
| (6) |
This is equivalent to asking how large should be to accommodate the return of the removed data set.
| Proton | ||||
|---|---|---|---|---|
| Parameter | ||||
| Helium | ||||
The tolerance is a global factor that applies to all the individual (i.e., there are no weights associated with the data sets). Finding the value for the tolerance factor allows for the determination of the uncertainties associated with the parameters , , , and . In Ref. Barr et al. (2006) these uncertainties are propagated into the atmospheric neutrino flux by performing several Monte Carlo simulations of the atmospheric neutrino flux and altering each time the values of the four parameters by to obtain the variation in neutrino flux as a function of energy. The deviations obtained for each parameter are then added in quadrature, without taking correlations between primary flux parameters into account.
A change in primary flux across the relevant regions of parameter space directly translates into an identical change in neutrino flux Barr et al. (2006). We therefore use the uncertainties as a function of energy obtained in Ref. Barr et al. (2006) to determine new uncertainties on the muon atmospheric neutrino flux by scaling the uncertainty functions according to the results obtained using the method from Ref. Stump et al. (2001); Pumplin et al. (2001).
An advantage of this method is that the parameters and their uncertainties are determined with a fit. It thus provides a more robust procedure for the determination of the uncertainties associated with the atmospheric neutrino flux. Future updates to cosmic-ray data can easily be incorporated into the analysis, thus making the response to new data more rapid. Furthermore, the covariance matrix for the four parameters can be extracted from the fit, thus allowing the determination of the correlations between the parameters , , , and . The results, discussed in Sec. IV, show that the parameters are highly correlated, and a proper treatment of the correlations is thus necessary. We provide the code used for fitting the cosmic-ray data at Ref. 111https://sdporzio.github.io/CRFitter/.
IV Results
(a)
 (b)
(b)
Combining the acceptability and mutual compatibility methods enables us to estimate a value for . Summing all the contributions from the two tolerance methods in Table 1, we obtain for proton and for helium fluxes. We determine the uncertainties on the GSHL parameters with these values of by scaling the contour in -parameter space. The /d.o.f. values determined from the fit are for protons and for helium. Best-fit values and relative uncertainties for the GSHL parameters are shown in Table 2 and their correlation matrix in Table 3.
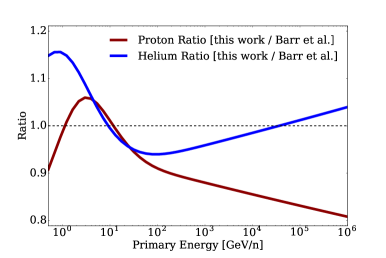
The four parameters are strongly correlated among each other. The parameters and , which govern the normalization and spectral index, respectively, have a correlation coefficient of . Since these two parameters contribute most to the total atmospheric neutrino uncertainties, their correlation cannot be neglected.
| Parameter | |||
|---|---|---|---|
| This work | Barr et al. | ||
(a)
 (b)
(b)
(a)
 (b)
(b)
We increase the uncertainty on the parameter in the energy range above GeV/n by a factor of 3 for proton and a factor of for helium fluxes. This maintains consistency with the results of Ref. Barr et al. (2006), where these uncertainties are inflated to take into account that measurements above GeV/n were obtained with calorimeter detectors as opposed to spectrometers measuring the energy region below GeV/n. The inflated uncertainty is carried over into the generation of the uncertainties on the atmospheric neutrino fluxes. We need to adopt the same approach so that we can perform a rescaling of the uncertainty functions from a direct comparison with the results of Ref. Barr et al. (2006).
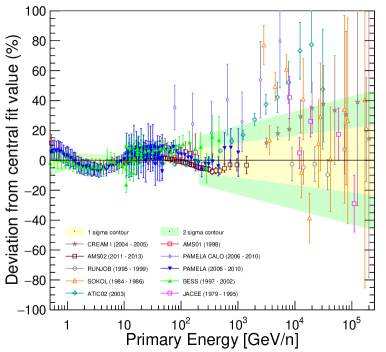
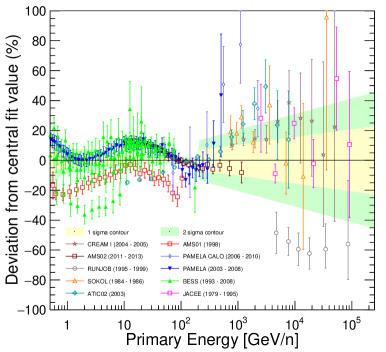
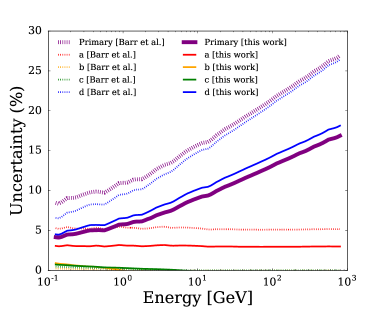
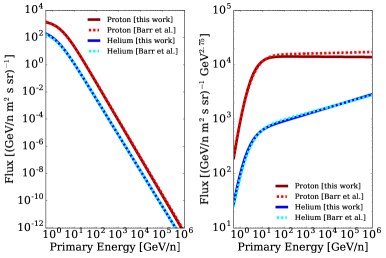
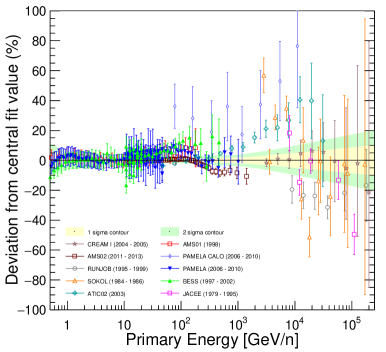
The residuals between data and the fitted GSHL parametrisations are shown in Fig. 1 against cosmic-ray energy for protons and helium. As Table 1 shows, the AMS02 and ATIC data points dominate and cannot be fitted consistently. The relative uncertainties on the four parameters obtained from the fit can be compared with the relative uncertainties obtained in Ref. Barr et al. (2006) to determine a scaling factor that can be applied to the uncertainty functions (see Table 4). The rescaled uncertainties are shown in Fig. 2. Figure 3 shows a comparison between the GSHL function using the parameter values extracted by Barr et al. Barr et al. (2006) and our global fit. Our results for protons yield a softer spectrum whereas the helium spectrum is harder.
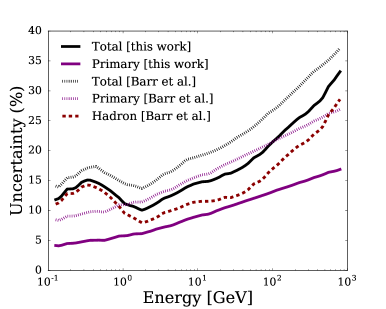
Barr et al. Barr et al. (2006) sum the four uncertainty functions in quadrature to obtain a total primary uncertainty for the atmospheric flux. Here, we also take into account the correlations given in Table 3. This updated primary uncertainty is summed in quadrature with the hadron production uncertainty determined in Ref. Barr et al. (2006) to obtain a total muon atmospheric neutrino flux uncertainty. The updated total muon-neutrino uncertainties are compared to the previous uncertainties in Fig. 2. We obtain an uncertainty on the muon-neutrino flux related to the primary cosmic rays of , depending on energy, which is about a factor of two smaller than the previously determined uncertainty. After adding the hadronic component, the total atmospheric muon-neutrino uncertainty is lower.
V Alternative Parametrisation
Recent measurements of cosmic-ray spectra for protons and helium nuclei using the AMS-02 detector Aguilar et al. (2015a, b) deviate significantly from a single power-law behaviour, exhibiting a harder spectrum above primary energies of GeV/n. This trend is also observed in the most recent ATIC Panov et al. (2009) and PAMELA-CALO Adriani et al. (2013b) measurements. We therefore propose a modification to the GSHL parametrisation, labeled GSHL+, that includes a shift in the spectral index using a multi-spectrum parametrisation of the form Ter-Antonyan (2014)
| (7) | |||||
where , , , and are the parameters used in Eq. 1, is the energy per nucleon where the shift in spectral index occurs, is a sharpness parameter, correlated to the rate of change of the spectral slope, and is the new spectral index characterising the spectrum at energies above .
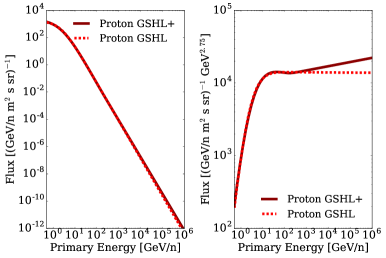
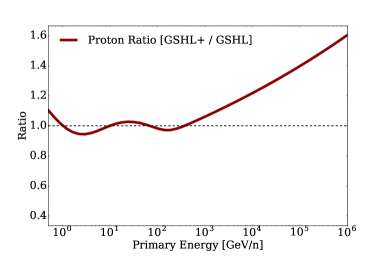
The results of the fit are shown in Table 5, and the deviation versus energy in Fig. 4. The fit yields for protons, an improvement compared to for the GSHL parametrisation. In Fig. 5 we compare the GSHL function using the parameters of Barr et al. Barr et al. (2006) and our global fit using Eq. 7. The results for protons now yield a harder spectrum, which is consistent with the recent observations by the AMS-02, ATIC and PAMELA-CALO Collaborations. However, fitting the GSHL+ parametrisation for helium returns parameter values that make the extra term disappear (the two spectral indices and take approximately the same value) since the helium data is not constraining enough, i.e., there is no benefit to be gained from using the GSHL+ parametrisation.
| Parameter | Proton |
|---|---|
| Parameter | |||||||
|---|---|---|---|---|---|---|---|
(a)
 (b)
(b)
VI Discussion
We show in Sec. IV that the GSHL parameters are highly correlated and that a correct treatment of correlations is necessary to obtain a realistic estimate of the total uncertainty. The largest contributions to the total uncertainty from the parameters and exhibit a lower value than the ones presented in Ref. Barr et al. (2006) with different factors. The overall total atmospheric muon-neutrino uncertainty is generally lower than the one previously determined in Ref. Barr et al. (2006).
The features shown by the most recent high-energy measurements (AMS-02, ATIC, PAMELA-CALO) indicate a harder spectrum above an energy of GeV/n than the one predicted by a single power-law spectrum fit. Introducing extra terms for the spectral index shifting results in a lower for proton with going from 2.9 to 1.7. Due to the action of the extra parameters it is not possible to determine the total flux uncertainty with the rescaling method used for GSHL parametrisation and a full Monte Carlo simulation would be required. However, the results from the fit suggest that a possible estimate of the uncertainty based on the flux generation could benefit from the introduction of the alternative parametrisation. A full treatment of the total atmospheric neutrino uncertainty should also consider updates on the uncertainty from hadron production, which is beyond the scope of this paper.
In summary, the procedure presented in this work employs a more robust method for the determination of the uncertainties associated with the atmospheric neutrino flux, which will facilitate future updates. We also study an alternative parametrisation, which improves the description for energies GeV/n. Including recent data sets and taking correlations into account reduces the primary-flux related uncertainty by about a factor of two, yielding an uncertainty of . Adding the hadron production uncertainties gives a total uncertainty in the range .
Acknowledgements
We would like to thank Giles Barr (Oxford) for important discussions and input. We acknowledges support by the Science and Technology Facilities Council (STFC) and the Royal Society.
References
- Abe et al. (2011a) K. Abe et al. (Super-Kamiokande Collaboration), Phys. Rev. Lett. 107, 241801 (2011a).
- Aartsen et al. (2015) M. Aartsen et al. (IceCube Collaboration), Phys. Rev. D 91, 072004 (2015).
- Aartsen et al. (2014) M. G. Aartsen et al. (IceCube/PINGU Collaboration), (2014), arXiv:1401.2046 [physics.ins-det] .
- Aartsen et al. (2016) M. G. Aartsen et al. (IceCube Collaboration), (2016), arXiv:1607.02671 [hep-ex] .
- Adrian-Martinez et al. (2016) S. Adrian-Martinez et al. (KM3Net Collaboration), J. Phys. G43, 084001 (2016), arXiv:1601.07459 [astro-ph.IM] .
- Abe et al. (2011b) K. Abe et al. (Hyper-Kamiokande Collaboration), (2011b), arXiv:1109.3262 [hep-ex] .
- Barr et al. (2006) G. D. Barr, S. Robbins, T. K. Gaisser, and T. Stanev, Phys. Rev. D 74, 094009 (2006).
- Fedynitch et al. (2013) A. Fedynitch, J. Becker Tjus, and P. Desiati, Proc. 17th Int. Symposium on Very High Energy Cosmic Ray Interactions (ISVHECRI 2012), Berlin, Germany, August 10-15, 2012, Eur. Phys. J. Web Conf. 52, 09003 (2013).
- Shikaze et al. (2007) Y. Shikaze et al., Astropart. Phys. 28, 154 (2007), arXiv:astro-ph/0611388 [astro-ph] .
- Wang et al. (2002) J. Z. Wang et al., Astrophys. J. 564, 244 (2002).
- Seo et al. (2000) E. S. Seo et al., Advances in Space Research 26, 1831 (2000).
- Abe et al. (2016) K. Abe et al., Astrophys. J. 822, 65 (2016), arXiv:1506.01267 [astro-ph.HE] .
- Boezio et al. (1999) M. Boezio et al. (CAPRICE Collaboration), Astrophys. J. 518, 457 (1999).
- Boezio et al. (2003) M. Boezio et al., Astropart. Phys. 19, 583 (2003), arXiv:astro-ph/0212253 [astro-ph] .
- Alcaraz et al. (2000a) J. Alcaraz et al. (AMS Collaboration), Phys. Lett. B490, 27 (2000a).
- Alcaraz et al. (2000b) J. Alcaraz et al. (AMS Collaboration), Phys. Lett. B494, 193 (2000b).
- Aguilar et al. (2015a) M. Aguilar et al. (AMS Collaboration), Phys. Rev. Lett. 114, 171103 (2015a).
- Aguilar et al. (2015b) M. Aguilar et al. (AMS Collaboration), Phys. Rev. Lett. 115, 211101 (2015b).
- Adriani et al. (2013a) O. Adriani et al., Astrophys. J. 765, 91 (2013a), arXiv:1301.4108 [astro-ph.HE] .
- Adriani et al. (2011) O. Adriani et al. (PAMELA Collaboration), Science 332, 69 (2011), arXiv:1103.4055 [astro-ph.HE] .
- Panov et al. (2009) A. D. Panov et al., Bull. Russ. Acad. Sci. Phys. 73, 564 (2009), arXiv:1101.3246 [astro-ph.HE] .
- Yoon et al. (2011) Y. S. Yoon et al., Astrophys. J. 728, 122 (2011), arXiv:1102.2575 [astro-ph.HE] .
- Ivanenko et al. (1993) I. P. Ivanenko et al., Bull. Russ. Acad. Sci. Phys. 57, 1180 (1993).
- Adriani et al. (2013b) O. Adriani et al. (PAMELA Collaboration), 38th COSPAR Scientific Assembly Bremen, Germany, July 18-25, 2010, Adv. Space Res. 51, 219 (2013b).
- Christ et al. (1998) M. J. Christ et al., Astrophys. J. 502, 278 (1998).
- Derbina et al. (2005) V. A. Derbina et al. (RUNJOB Collaboration), Astrophys. J. 628, L41 (2005).
- Zatsepin and Sokolskaya (2006) V. I. Zatsepin and N. V. Sokolskaya, Astron. Astrophys. 458, 1 (2006), arXiv:astro-ph/0601475 [astro-ph] .
- Gaisser and Honda (2002) T. K. Gaisser and M. Honda, Ann. Rev. Nucl. Part. Sci. 52, 153 (2002), arXiv:hep-ph/0203272 [hep-ph] .
- Gaisser (2012) T. K. Gaisser, Astropart. Phys. 35, 801 (2012), arXiv:1111.6675 [astro-ph.HE] .
- Ter-Antonyan and Haroyan (2000) S. V. Ter-Antonyan and L. S. Haroyan, (2000), arXiv:hep-ex/0003006 [hep-ex] .
- Hoerandel (2003) J. R. Hoerandel, Astropart. Phys. 19, 193 (2003).
- Gaisser and Stanev (2000) T. K. Gaisser and T. Stanev, Eur. Phys. J. C15, 150 (2000).
- Gaisser et al. (2001) T. K. Gaisser, T. Stanev, M. Honda, and P. Lipari, in 27th International Cosmic Ray Conference (ICRC 2001) Hamburg, Germany, August 7-15, 2001 (2001) pp. 1643–1646.
- Honda et al. (2007) M. Honda, T. Kajita, K. Kasahara, S. Midorikawa, S. Tomoyuki, J. Nishimura, and A. Okada, in Proc. 30th Int. Cosmic Ray Conference (ICRC 2007), Merida, Yucatan, Mexico, July 3-11, 2007, Vol. 5 (2007) pp. 1491–1494.
- Usoskin et al. (2011) I. G. Usoskin, G. A. Bazilevskaya, and G. A. Kovaltsov, Journal of Geophysical Research: Space Physics 116 (2011).
- Stump et al. (2001) D. Stump et al., Phys. Rev. D65, 014012 (2001), arXiv:hep-ph/0101051 [hep-ph] .
- Pumplin et al. (2001) J. Pumplin et al., Phys. Rev. D65, 014013 (2001), arXiv:hep-ph/0101032 [hep-ph] .
- Note (1) https://sdporzio.github.io/CRFitter/.
- Ter-Antonyan (2014) S. Ter-Antonyan, Phys. Rev. D89, 123003 (2014), arXiv:1405.5472 [astro-ph.HE] .