Modulation of mechanical resonance by chemical potential oscillation in graphene
Abstract
The classical picture of the force on a capacitor assumes a large density of electronic states, such that the electrochemical potential of charges added to the capacitor is given by the external electrostatic potential and the capacitance is determined purely by geometry. Here we consider capacitively driven motion of a nano-mechanical resonator with a low density of states, in which these assumptions can break down. We find three leading-order corrections to the classical picture: the first of is a modulation in the static force due to variation in the internal chemical potential; the second and third are change in static force and dynamic spring constant due to the rate of change of chemical potential, expressed as the quantum (density of states) capacitance. As a demonstration, we study a capacitively driven graphene mechanical resonators, where the chemical potential is modulated independently of the gate voltage using an applied magnetic field to manipulate the energy of electrons residing in discrete Landau levels. In these devices, we observe large periodic frequency shifts consistent with the three corrections to the classical picture. In devices with extremely low strain and disorder, the first correction term dominates and the resonant frequency closely follows the chemical potential. The theoretical model fits the data with only one adjustable parameter representing disorder-broadening of the Landau levels. The underlying electromechanical coupling mechanism is not limited the particular choice of material, geometry, or mechanism for variation in chemical potential, and can thus be extended to other low-dimensional systems.
The calculation of the force between plates of a parallel-plate capacitor by energy methods is a classic problem that illustrates the importance of correct definition of the system’s free energy: considering only the energy stored in the capacitor incorrectly predicts a repulsive force of , where is the capacitance, is its spatial derivative, and is the electrostatic potential difference. The correct result (an attractive force ) is only obtained when the work done by the battery to maintain constant voltage is taken into accountFeynman_lecture . This result assumes a simple system of metallic capacitors with large density of states (DOS), such that the chemical potential is constant and the electrostatic potential is identical to the voltage applied by the battery. This assumption breaks down in nanoscale systems, in which the DOS can be much smaller and is no longer fixed, an effect widely studied in electronic devicesKlitzing_prl_1980 ; Fulton_prl_1987 ; Luryi_apl_1988 ; Park_nature_2002 ; Ilani_nphys_2006 ; Xia_nnano_2009 . However, the role of finite DOS in the force between capacitor plates has not been rigorously investigated. Understanding the corrections to the classical model is of fundamental interest and important for modeling of nano-mechanical systems in the atomically thin limitSteele_science_2009 ; Lassagne_science_2009 . Here we examine the case of a resonant nano-mechanical device, and show that the first-order correction to the resonant frequency consists of three terms, one proportional to and two proportional to its derivative , with the latter represented through the inverse quantum capacitance ( is the sample size and is the electron charge). The phenomenon is explored experimentally by examining the behavior of a graphene resonator, in which is tuned by a perpendicular magnetic field at fixed electrochemical potential. We observe strong frequency shifts that are periodic in 1/, and can be quantitatively described by the theoretical model. We further find that, in the limit of an ultra-clean device with low tension, the first term can provide the dominant tuning effect, demonstrating that a nano-mechanical device can be used to track its own chemical potential.
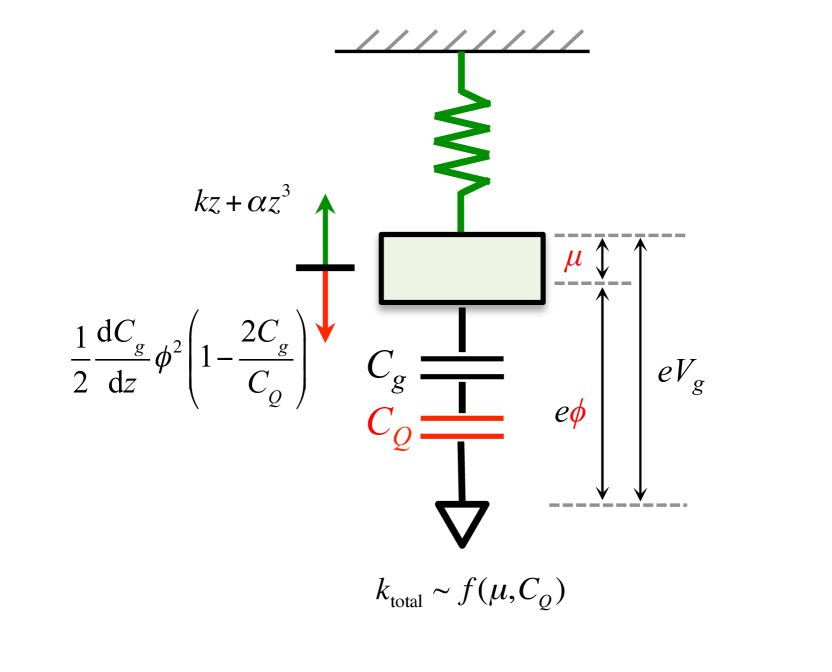
We model a generic mechanical resonator as a mass on a nonlinear spring, capacitively actuated by a nearby gate electrode, as shown in fig. 1. A direct current (DC) voltage applied to the gate can both increase the resonant frequency by exerting a static force to change the equilibrium deflection , and decrease the frequency due to the nonlinear electrostatic potential, an effect known as electrostatic spring softeningLifshitz_2009 . The two effects provide an effective spring constant given by:
| (1) |
where is the linear spring constant, is the elastic nonlinear coefficient, and is the geometric coefficient that depends on the exact form of static deflection (see Supplementary Information, section 2). In rigid microelectromechanical devices (MEMS), the last capacitive softening term provides the dominant tuning effect, whereas in atomically thin materials under low tension, the second mechanical stiffening term can dominate.
The role of the finite density of states is modeled by considering the variation in with carrier density , such that the electrostatic potential is given by , and by including in series with . In this case, we first find that the static capacitive force is given by (Supplementary Information, section 3):
| (2) |
When is kept constant and and are modulated, the change in static force is approximated as:
| (3) |
The change in static force shifts the equilibrium deflection , thus the resonant frequency, and alters the curvature of the potential energy at the equilibrium position, as determined from the spatial derivative of . The leading term in the latter is given by:
| (4) |
Combining the effects from eq. (2) and (3), we arrive at the total frequency shift as:
| (5) |
where indicates how easily the resonant frequency can be tuned by electrostatic potential, is the unmodulated spring constant, is change in chemical potential, and represents the change in inverse quantum capacitance. The three terms in eq. (5) are referred to below as , , and , respectively. Importantly is a direct measure of variation in the chemical potential, whereas and depend on the change in quantum capacitance. We also note that these terms are closely related to experiments with nanotube quantum dot mechanical resonatorsSteele_science_2009 ; Lassagne_science_2009 , in which are analogous to the diverging charge susceptibility of the quantum dot that produces dips in the nanotube mechanical frequency at charge transitions, and plays a similar role that changes the static tension and the mechanical frequency from discretely charging the quantum dot.
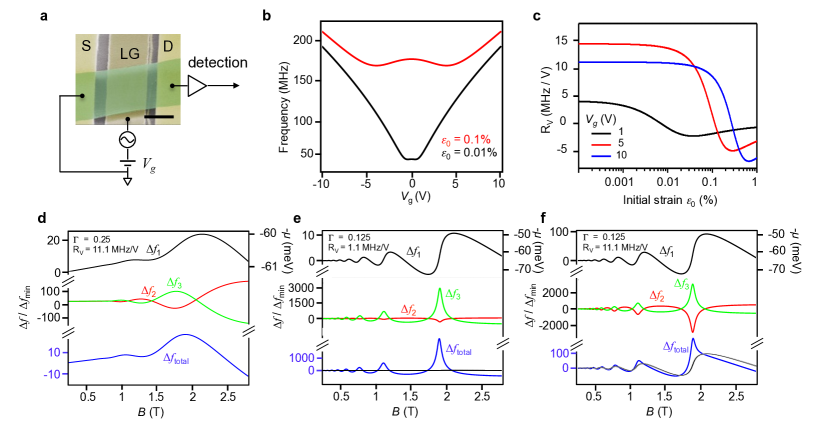
We examine this phenomenon experimentally using graphene mechanical resonatorsBunch_Science_2007 ; chen_nnano_2009 , where a transverse magnetic field is used to tune and independently of . The samples are in a three-terminal configuration (fig. 2a) with a local gate (LG) placed few hundred nanometers away from the suspended graphene. The graphene is assumed to have built-in strain from the fabrication process, with additional strain induced by the DC gate voltage . We use a continuum mechanical model for calculation of at different levels of (fig. 2b, also Supplementary Information, section 3). Fig. 2c shows as a function of , at three different values of , for a 2 by 2 m single layer graphene resonator. Thus, in devices with low , can be large and are maximized whereas in devices with large , is substantially smaller and should be minimized relative to . We note that previous studies of graphene resonators in high magnetic fieldsSingh_apl_2012 utilized samples with high tension and therefore observed only the effects of ; in the experimental work below, we focus on samples with ultralow tension to directly observe the effects of chemical potential variation.
In a transverse magnetic field, electronic states of graphene form discrete Landau levels (LLs), and oscillates in a sawtooth pattern with increasing . The oscillation in is reflected in the longitudinal electrical resistivityZhang_nature_2005 ; Novoselov_nature_2005 ; Neto_rmp_2009 (Shubnikov-de Haas oscillations), and in the magnetization (de Haas-van Alphen oscillations, typically detected by torque magnetometryEisenstein_prl_1985 ), but can also be studied explicitly using a sensitive single-electron transistor electrometerZhitenev_nature_2000 ; Feldman_science_2012 . In a single particle picture, the dependence of and on is determined by the filling fraction ( is the reduced Planck’s constant), and disorder. We construct a simple modelKoshino_prb_2007 consisting of up to 20 Gaussian-broadened LLs with disorder-induced width (in units of , where = 106 m/s is the Fermi velocity). The DOS is given by , where is center of the LL. Within each LL, of single-layer graphene evolves with as . Here is assigned as the highest filled energy level, and is defined as , where is the sample area. Figures 2d, 2e and 2f show the simulated as a function of and accompanying frequency shifts calculated from each of the terms in eq. (5) for three different combinations of high/low tension and disorder. In the case of low tension but large disorder (fig. 2d), are all reflected in the total frequency shift, but LL broadening largely obscures the variation in . In the case of high tension and small disorder (fig. 2e), we found that as expected, leading to sharp spikes in frequency at LL transitions. Finally, in the case of both low tension and low disorder, the frequency shift closely (but not completely) follows the contribution of and the sawtooth variation of , with spikes at the transitions between LLs due to .
This simulation motivates the use of graphene samples with very low built-in strain and disorder, in order to directly observe variation in . To prevent contamination, we prepare samples by direct exfoliation of graphite over pre-patterned electrodesxu_apl_2010 , and further clean the graphene by Joule heating in vacuum at low temperatureMoser_apl_2007 ; Bolotin_ssc_2008 . The electronic quality is examined through separate measurements (Supplementary Information, section 1), and can yield charged impurity density as low as cm-2. For mechanical resonance measurements, the graphene is actuated electrostatically by adding a small radiofrequency drive voltage to the gate, and the gate-drain current at the same frequency is read out by a vector network analyzer; on resonance, the changing capacitance due to mechanical motion causes a measurable peak in the currentxu_apl_2010 ; Chen_phd_2013 . The absence of DC bias avoids Joule heating and possible Lorentz forces. We scan up to 10 V at zero magnetic field to determine and use the continuum mechanical model to extract . The use of substrate-fixed electrodes eliminates tensioning due to thermal contraction of the metalchen_nnano_2009 ; Singh_nano_2010 , and we are able to achieve as large as 10 MHz/V, with .
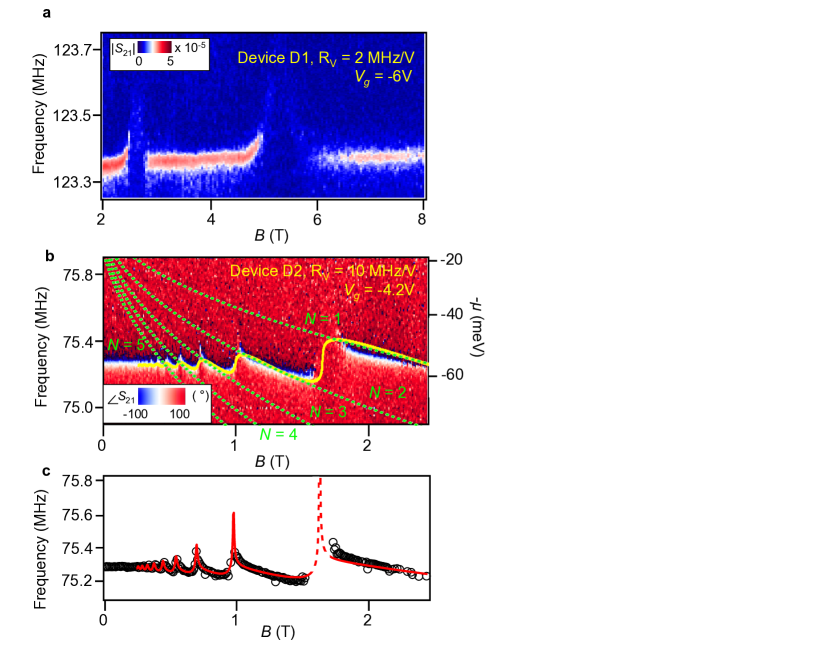
Figure 3a shows the response of mechanical resonance to applied magnetic filed , for device D1 with of 2 MHz/V. There is no obvious frequency shift with , except for regimes between LLs, where sharp spikes are evident but the signal becomes weak. Such observations agree well with the predictions for small and experimental results reported by Singh Singh_apl_2012 . Fig. 3b shows the same measurements on device D2 (length 2.4 m, width 3.2 m), with of 10 MHz/V. The data reveals a repeated pattern of oscillations that are periodic in (Supplementary Information, section 4), allowing us to directly extract the carrier density of 2.41011 cm-2. We use the measured value of at 5 different values of , combined with finite element simulation (COMSOL Multiphysics) to obtain the effective displacement and as as a function of . Therefore, the only free parameter left to fit eq. (5) is the disorder level , which will determine and . We found that a of 0.1 gives satisfactory result. The corresponding , that gives rise to , is overlaid as a yellow curve in fig. 3b. For comparison, we also plot for the first five LLs as dotted green lines. We found that traces closely in each LL, confirming that the frequency can closely track in high quality samples. The detailed fit between the model and the data is shown in fig. 3c. Here, the solid points represent the resonant frequency exctracted at each value of from the data in fig. 3b, and the line represents the prediction of eq. (5) with . The fit is excellent and validates the model presented above.
We briefly consider the region between LLs, where the frequency shift should be primarily sensitive to . At high magnetic fields, when the sample enters the well-developed quantum Hall regime, its bulk becomes insulating and the edges host dissipationless one-dimensional edge states. This will not change the static charge on the sample and the static force due to , and therefore first two terms of eq. (5) should be unaffected. However, when the bulk becomes sufficiently insulating such that its RC charging time is greater than the mechanical resonance period, the dynamic charging should be determined by the geometric capacitance between the gate and the edge channels, which can be an order of magnitude smaller than (see Supplementary Information, section 5). This has two consequences. First, both the third term in eq. (5) and the classical electrostatic softening term in eq. (1) should decrease with the decreasing dynamic capacitance; in general, the classical term will dominate and the frequency spike will be larger than predicted by eq. (5). Second, both the radiofrequency drive and capacitive displacement current will also decrease, leading to substantial loss of signal. As a consequence, we can use the loss of signal to directly determine the onset of the bulk insulating behavior. In fig. 3b,c (also see fig. S11), this is seen to occur for the final spike, at the transition between = 2 and = 1, indicated by the dashed line in fig. 3c. For this transition, we expect that the model will not fit the data well, and indeed, the magnitude and width of the frequency spike, where observable, seem to exceed the prediction. Nevertheless, the best fit of the limited data in the region between LLs yields with values similar to previous measurements of high quality graphene samplesMartin_nphys_2009 ; Yu_pnas_2013 . More detailed modeling and alternative transduction techniques ( optical detection) may allow better study of the detailed behavior between LLs.
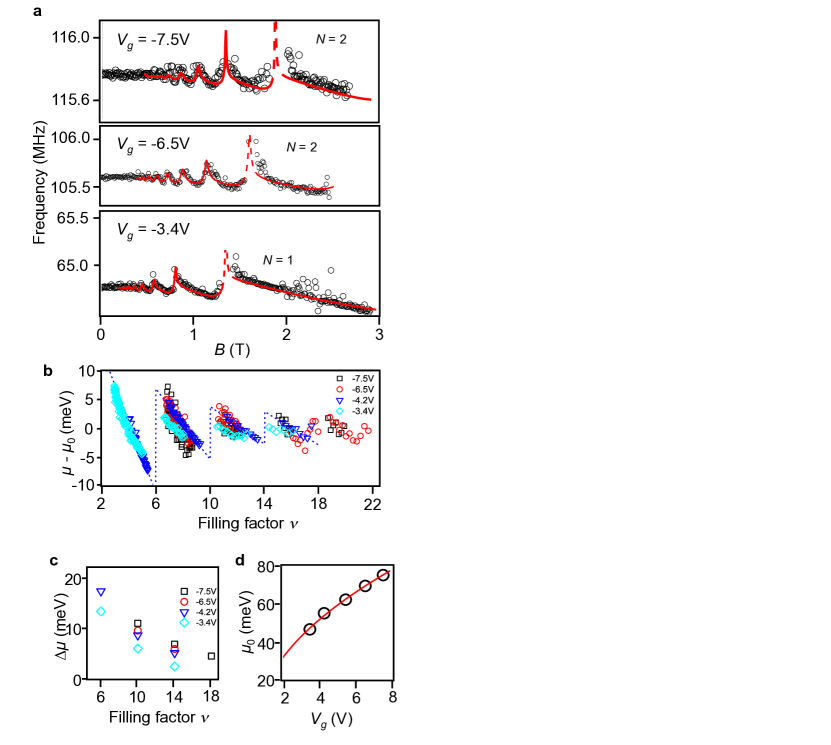
Figure 4a shows similar data at different values of , with fits using values within 10%. Since we are able to “read off” chemical potential variation directly through mechanical resonance shifts, we can then track the chemical potential as a function of the filling fraction . Fig. 4b shows at four different values of : there are distinct jumps of at = 4( + 1/2), which represent the energy gaps between neighboring LLs. We linearly extrapolate to extract the energy gaps, as plotted in fig 4c. In addition, the same analysis allows extrapolation to determine the chemical potential at zero magnetic field . As shown in fig. 4d, this follows as expected. Therefore the mechanical measurements can, under appropriate conditions, provide a direct means to monitor the chemical potential evolution of the underlying system, in a straightforward manner. We expect to extend our measurements into extreme quantum regimes at larger , where additional chemical potential jumps would suggest the formation of many-body incompressible states.
Our nanomechanical technique thus provides access to a key thermodynamic quantity (chemical potential) in a self-contained manner. Specifically, our system allows measurements of both the energy gaps, and the gradual energy transition between gaps, which would otherwise require specialized instrumentationZhitenev_nature_2000 ; Feldman_science_2012 . In the future, measurements of other correlation effects like negative compressibilityEfros_ssc_1988 ; Kravchenko_prb_1990 , fractional quantum Hall effectsbolotin_nature_2009 ; du_nature_2009 ; Dean_nphys_2011 ; Feldman_science_2012 ; Dean_nature_2013 ; Ponomarenko_nature_2013 and Wigner crystallizationPhysRevB.34.2681 , all of which have thermodynamic signatures, should be possible using this technique. Finally, we emphasize that the electromechanical mechanism identified in the present work is not specific to graphene. Indeed, any atomically thin mechanical resonator with a quasi-2D electronic structure will demonstrate this sensitive response to external fields via an electrostatically controlled mechanism.
The authors thank Nigel Cooper, Igor Aleiner, Brian Skinner, Gary Steele for helpful discussions; David Heinz and Andrea Young for help in building the measurement setup; Noah Clay for fabrication support; Kin-Chung Fong, Tony Heinz, Andrea Young and Arend van der Zande for helpful comments. P.K. and J.H. acknowledge Air Force Office of Scientific Research Grant No. MURI FA955009-1-0705. P.K. acknowledges FENA.
[Author Contributions] C.C. and V.V.D. fabricated and characterized the samples, developed the measurement technique and performed the experiments, data analysis and theoretical modeling. M.K. performed disorder-broadened calculations. S.L. and A. G. helped in sample fabrication. A. H. M. provided theoretical support. P.K. and J.H. oversaw the project. C.C., V.V.D., P.K. and J.H. co-wrote the paper. All authors discussed and commented on the manuscript.
[Author Information] The authors declare no competing financial interests. Correspondence and requests for materials should be addressed to J.H. (email: jh2228@columbia.edu).
.1 Device Fabrication
High resistivity silicon wafers (20,000 cm) are used in the experiments described in the main text, in order to minimize the parasitic capacitance in the radio frequency (RF) range. 290 nm of thermal oxide is then grown to have best optical contrast for identifying single layer graphene in later studies.
Source and drain electrodes (1 nm Cr, 15 nm Au) are first patterned by DUV photo-lithography (ASML 300C DUV stepper, Cornell Nanofabrication Facility). Next, a dry etch (CF4) creates 200 nm deep trenches between source and drain electrodes, and finally local gate electrodes (1 nm Cr, 20 nm Au) are deposited in the trenches with careful alignment. The detail of the fabrication is described elsewhereChen_phd_2013 .
Graphene samples are prepared by mechanical exfoliation of Kish graphite. The color contrast of the substrate-supported region aids in identification of thin flakes crossing the electrodes. The precise number of layers is subsequently confirmed by Raman spectroscopy.
.2 Device Characterization
Suspended graphene samples are electrically tested at room temperature under vacuum before cool-down. Only samples that possess reasonable transconductance ( with in 10 V change of gate voltage) are chosen for further investigation.
For low temperature measurements in a magnetic field, samples are wire-bonded and loaded into a home-built insert for the Quantum Design Physical Properties Measurement System (PPMS, 1.8 K base temperature) with 8 semi-rigid coaxial cables to transmit both DC and RF signals. Most suspended graphene samples show improved quality (narrower Dirac peak) upon cooling. Sample quality is further improved by gentle current annealingBolotin_ssc_2008 . After such treatments, the smallest full-width at half-maximum (FWHM) of the Dirac peak is about 0.2 V, corresponding to a disorder density of cm-2. To avoid collapsing the graphene due to electrostatic force, we only apply gate voltage within 10 V.
References
- (1) Feynman, R. P., Leighton, R. B. & Sands, M. The Feynman Lectures on Physics, vol. 2 (Basic Books, 2013).
- (2) Klitzing, K. v., Dorda, G. & Pepper, M. New method for high-accuracy determination of the fine-structure constant based on quantized hall resistance. Phys. Rev. Lett. 45, 494–497 (1980).
- (3) Fulton, T. A. & Dolan, G. J. Observation of single-electron charging effects in small tunnel junctions. Phys. Rev. Lett. 59, 109–112 (1987).
- (4) Luryi, S. Quantum capacitance devices. Applied Physics Letters 52, 501–503 (1988).
- (5) Park, J. et al. Coulomb blockade and the kondo effect in single-atom transistors. Nature 417, 722–725 (2002).
- (6) Ilani, S., Donev, L. A., Kindermann, M. & McEuen, P. L. Measurement of the quantum capacitance of interacting electrons in carbon nanotubes. Nature Physics 2, 687–691 (2006).
- (7) Xia, J., Chen, F., Li, J. & Tao, N. Measurement of the quantum capacitance of graphene. Nature Nanotech. 4, 505–509 (2009).
- (8) Steele, G. A. et al. Strong coupling between single-electron tunneling and nanomechanical motion. Science 325, 1103–1107 (2009).
- (9) Lassagne, B., Tarakanov, Y., Kinaret, J., Garcia-Sanchez, D. & Bachtold, A. Coupling mechanics to charge transport in carbon nanotube mechanical resonators. Science 325, 1107–1110 (2009).
- (10) Lifshitz, R. & Cross, M. C. Nonlinear dynamics of nanomechanical and micromechanical resonators. In Reviews of Nonlinear Dynamics and Complexity, 1–52 (Wiley-VCH Verlag GmbH & Co. KGaA, 2009).
- (11) Bunch, J. S. et al. Electromechanical resonators from graphene sheets. Science 315, 490–493 (2007).
- (12) Chen, C. et al. Performance of monolayer graphene nanomechanical resonators with electrical readout. Nature Nanotechnol. 4, 861–867 (2009).
- (13) Singh, V. et al. Coupling between quantum hall state and electromechanics in suspended graphene resonator. Applied Physics Letters 100, 233103 (2012).
- (14) Zhang, Y. B., Tan, Y. W., Stormer, H. L. & Kim, P. Experimental observation of the quantum hall effect and berry’s phase in graphene. Nature 438, 201–204 (2005).
- (15) Novoselov, K. S. et al. Two-dimensional gas of massless dirac fermions in graphene. Nature 438, 197–200 (2005).
- (16) Castro Neto, A. H., Guinea, F., Peres, N. M. R., Novoselov, K. S. & Geim, A. K. The electronic properties of graphene. Rev. Mod. Phys. 81, 109–162 (2009).
- (17) Eisenstein, J. P. et al. Density of states and de haas—van alphen effect in two-dimensional electron systems. Phys. Rev. Lett. 55, 875–878 (1985).
- (18) Zhitenev, N. B. et al. Imaging of localized electronic states in the quantum hall regime. Nature 404, 473–476 (2000).
- (19) Feldman, B. E., Krauss, B., Smet, J. H. & Yacoby, A. Unconventional sequence of fractional quantum hall states in suspended graphene. Science 337, 1196–1199 (2012).
- (20) Koshino, M. & Ando, T. Diamagnetism in disordered graphene. Phys. Rev. B 75, 235333 (2007).
- (21) Xu, Y. et al. Radio frequency electrical transduction of graphene mechanical resonators. Appl. Phys. Lett. 97, 243111 (2010).
- (22) Moser, J., Barreiro, A. & Bachtold, A. Current-induced cleaning of graphene. Appl. Phys. Lett. 91, 163513–163513–3 (2007).
- (23) Bolotin, K. et al. Ultrahigh electron mobility in suspended graphene. Solid State Communications 146, 351–355 (2008).
- (24) Chen, C. Graphene NanoElectroMechanical Resonators and Oscillators. Ph.D. thesis, Columbia University (2013).
- (25) Singh, V. et al. Probing thermal expansion of graphene and modal dispersion at low-temperature using graphene nanoelectromechanical systems resonators. Nanotechnology 21, 165204–165204 (2010).
- (26) Williams, J. R., Abanin, D. A., DiCarlo, L., Levitov, L. S. & Marcus, C. M. Quantum hall conductance of two-terminal graphene devices. Phys Rev B 80, 045408 (2009).
- (27) Martin, J. et al. The nature of localization in graphene under quantum hall conditions. Nature Physics 5, 669–674 (2009).
- (28) Yu, G. et al. Interaction phenomena in graphene seen through quantum capacitance. Proceedings of the National Academy of Sciences 110, 3282–3286 (2013).
- (29) Efros, A. Density of states of 2d electron gas and width of the plateau of iqhe. Solid State Communications 65, 1281–1284 (1988).
- (30) Kravchenko, S. V., Rinberg, D. A., Semenchinsky, S. G. & Pudalov, V. M. Evidence for the influence of electron-electron interaction on the chemical potential of the two-dimensional electron gas. Phys. Rev. B 42, 3741–3744 (1990).
- (31) Bolotin, K. I., Ghahari, F., Shulman, M. D., Stormer, H. L. & Kim, P. Observation of the fractional quantum hall effect in graphene. Nature 462, 196–199 (2009).
- (32) Du, X., Skachko, I., Duerr, F., Luican, A. & Andrei, E. Y. Fractional quantum hall effect and insulating phase of dirac electrons in graphene. Nature 462, 192–195 (2009).
- (33) Dean, C. R. et al. Multicomponent fractional quantum hall effect in graphene. Nature Physics 7, 693–696 (2011).
- (34) Dean, C. et al. Hofstadter/’s butterfly and the fractal quantum hall effect in moire superlattices. Nature 497, 598–602 (2013).
- (35) Ponomarenko, L. et al. Cloning of dirac fermions in graphene superlattices. Nature 497, 594–597 (2013).
- (36) MacDonald, A. H., Oji, H. C. A. & Liu, K. L. Thermodynamic properties of an interacting two-dimensional electron gas in a strong magnetic field. Phys. Rev. B 34, 2681–2689 (1986).