Gaps in Protoplanetary Disks as Signatures of Planets: III. Polarization
Abstract
Polarimetric observations of T Tauri and Herbig Ae/Be stars are a powerful way to image protoplanetary disks. However, interpretation of these images is difficult because the degree of polarization is highly sensitive to the angle of scattering of stellar light off the disk surface. We examine how disks with and without gaps created by planets appear in scattered polarized light as a function of inclination angle. Isophotes of inclined disks without gaps are distorted in polarized light, giving the appearance that the disks are more eccentric or more highly inclined than they truly are. Apparent gap locations are unaffected by polarization, but the gap contrast changes. In face-on disks with gaps, we find that the brightened far edge of the gap scatters less polarized light than the rest of the disk, resulting in slightly decreased contrast between the gap trough and the brightened far edge. In inclined disks, gaps can take on the appearance of being localized “holes” in brightness rather than full axisymmetric structures. Photocenter offsets along the minor axis of the disk in both total intensity and polarized intensity images can be readily explained by the finite thickness of the disk. Alone, polarized scattered light images of disks do not necessarily reveal intrinsic disk structure. However, when combined with total intensity images, the orientation of the disk can be deduced and much can be learned about disk structure and dust properties.
1 Introduction
Polarized light imaging is being increasingly used as a method to obtain high contrast images of the protoplanetary disks of young T Tauri and Herbig Ae/Be stars. This is because the light from the star is expected to be unpolarized, while light scattered from the disk should be preferentially polarized. Polarimetric observations are therefore able to image disks to small inner working angles because total intensity imaging requires much more sophisticated PSF subtraction. Techniques for starlight subtraction in total intensity images such as angular differential imaging (ADI) work well for point sources, but end up self-subtracting axisymmetric features such as disks.
Several facilities are producing high-quality images of young circumstellar disks using the polarized differential imaging technique. The Gemini Planet Imager (GPI) has demonstrated success with imaging nearby bright debris disks in both total scattered light and linearly polarized scattered light (e.g. Perrin et al., 2015; Wolff et al., 2016; Kalas et al., 2015). The SPHERE (Spectro-Polarimetric High-contrast Exoplanet REsearch) instrument on ESO’s VLT (Very Large Telescope) has begun producing high contrast images of exoplanets and disks in polarized light as well (Garufi et al., 2016; Olofsson et al., 2016). The Strategic Explorations of Exoplanets and Disks with Subaru (SEEDS) survey team has produced a number of high contrast images of young protoplanetary disks in T Tauri and Herbig Ae/Be objects (e.g. Grady et al., 2015; Akiyama et al., 2015; Thalmann et al., 2010; Hashimoto et al., 2011; Mayama et al., 2012; Follette et al., 2013).
Both debris disks and protoplanetary disks represent important but different stages of planet formation. Protoplanetary disks, often observationally categorized as T Tauri or Herbig Ae/Be stars, are younger, optically thick, and consist primarily of gas. They represent the stage of active giant planet formation, since these planets must form while a large reservoir of gas still exists from which they can accrete their massive envelopes. Debris disks are older, optically thin, and depleted in gas. Because protoplanetary disks are so young ( Myr), they are associated with star-forming regions, which tend to be distant ( pc) from the Earth. It is often easier to observe and image debris disks because they occur in older stars and are not constrained to star formation regions.
The focus of this paper is protoplanetary disks. Because they are optically thick, radiative transfer modeling of them is more complicated than in optically thin debris disks. As seen in the case of HR 4796A (Perrin et al., 2015), even a moderate optical depth can complicate the interpretation of observations. The most satisfactory explanation for near side/far side anisotropies observed in the disk of HR 4796A that reconciles both the total intensity and polarized intensity images is that there is a small amount of optical depth that attenuates the emission from the near side of the disk. This paper focuses on younger gas-rich optically-thick protoplanetary disks rather than older gas-poor optically thin debris disks such as HR 4796A. However, it is an excellent example of confusion resulting from simplistic interpretations of polarized scattered light images
Stellar irradiation is the primary heat source in protoplanetary disks. Thus, in order to accurately model the disk structure, it is important to properly model the illumination of the disk surface and carry out detailed radiative transfer calculations for the heating of the disk interior. Further radiative transfer calculations are needed to model observable properties of protoplanetary disks. As in the case of HR 4796A, while polarimetric observations of disks can produce very high contrast images, taken alone without properly accounting for the disk orientation and optical depth, they can lead to misinterpretation of disk structure. Since the degree of polarization of scattered light depends on the angle of scattering, the appearance of the disk is highly sensitive to the precise geometry of the disk, including the angle of inclination and features such as gaps. Therefore, apparent structures seen in scattered polarized light must be treated with caution.
As a case in point, some of the first observations of AB Aurigae in polarized scattered light showed what appeared to be a dark spot, possibly caused by the presence of a planet (Oppenheimer et al., 2008; Jang-Condell, 2009). Follow-up efforts showed that the lack of emission was real, but that it was not indicative of a local perturbation to the disk structure, but rather caused by the inclination of the disk decreasing the polarization fraction along the disk minor axis (Jang-Condell & Kuchner, 2010; Perrin et al., 2009). Further observations of AB Aurigae in scattered polarized light were achieved at a small inner working angle, revealing still more complex morphology in the inner disk (Hashimoto et al., 2011). The apparent gaps, holes, and spiral arms were attributed to planet formation, but little effort has been made to produce a model for the disk morphology that accounts for the difference between total and polarized scattered light intensity. Because such small inner working angles are difficult to achieve with total intensity images, it is difficult to confirm whether these features represent real structure in the disk.
In light of the capabilities of new instruments and the growing use of polarimetry to detect and characterize disks, it is important to fully understand how polarized light images differ from total intensity images. In this paper, we model scattered light imaging of protoplanetary disks with and without gap clearing by growing planets. We examine how polarized intensity and total intensity image of the same disks differ and how that varies with disk inclination.
In previous work, we examined the thermal effects of gap creation by planets in protoplanetary disks (Jang-Condell & Turner, 2012, henceforth Paper I) and observable signatures of such planets (Jang-Condell & Turner, 2013, henceforth Paper II). In this paper, we examine the appearance of the same set of disk models in polarized scattered light. We focus this study on the polarization of scattered light in the near-IR (1 micron), although these methods can apply to polarization by scattering at any wavelength, provided that a Rayleigh-like polarization law applies. We do not consider polarization of thermal emission as might occur with grains aligned with magnetic fields which might be observed with ALMA.
2 Methods
2.1 Disk Models
The parameters for the disk models examined in this paper are described in detail in Paper I (see also Jang-Condell, 2008, 2009). In particular, the stellar mass is 1 , the stellar radius is 2.6 , the stellar effective temperature is 4280 K, consistent with a 1 Myr old protostar Siess et al. (2000). The accretion rate of the disk is yr-1, and the viscosity parameter is , fairly typical of values for T Tauri stars. The dust is well-mixed with a composition consistent with Pollack et al. (1994), a maximum grain size of 1 mm, a minimum grain size of 0.005 m, and a collisional grain size distribution, (Dohnanyi, 1969).
As described in Paper I, the disks are calculated with self-consistent radiative transfer to determine the density and temperature structure using the methods of Jang-Condell (2008, 2009). The strategy used for calculating radiative transfer involves spatially decomposing the disk surface into discrete planar surfaces, each of which can be treated locally as plane-parallel. Using an analytic solution to the one-dimensional radiative transfer problem, the amount of radiative heating at any given point in the disk is then calculated as the summation of contributions to the heating from the individual discrete surface elements.
We impose gaps in the disk consistent with planets on circular orbits at a semi-major axis of 10 AU and masses of 70 and 200 , as discussed in Paper I. The adopted gap parameters are shown in Table 1 and are calculated based on viscous gap opening simulations by Bate et al. (2003) and Crida et al. (2006). The gaps are partially cleared, in that the vertically integrated surface density of the disk is decreased by no more than 60% for the most massive planet modeled. The gaps are modeled as Gaussian perturbations of the form
| (1) |
where is the unperturbed surface density profile, is the depth of the gap, is the gap position, and is the gap width. For a full discussion of the relationship between planet mass, disk properties, and gap parameters, see Paper I.
| Planet mass11Actual masses used for this work. In the text, the masses have been rounded to 70 and 200 for convenience. | gap width () | gap depth () |
|---|---|---|
| 72 (0.23 ) | 0.11 | 0.56 |
| 210 (0.65 ) | 0.17 | 0.84 |
2.2 Polarized Scattered Light
As shown in Paper II, the scattered light brightness of the disk surface, assuming single isotropic scattering, is
| (2) |
where is the cosine of the angle of incidence of stellar light on the surface, is the wavelength-dependent albedo, is the distance between the surface and the star, is the angle of scattering to the observer with respect to the surface normal, and is the stellar brightness at , evaluated as the Planck function.
However, multiple scattering cannot be ignored, especially for grains with high albedo. For photons scattered two or more times, the contribution to disk brightness is
where and isotropic scattering is assumed. The total scattered light intensity is then
To calculate the amount of linear polarization of scattered light, we make the assumption that photons scattered more than once become randomly polarized, resulting in net zero polarization. Thus, we need only consider the polarization signal from the singly scattered photons. This reduces the polarization fraction overall, since multiple scattering contributes significantly to the disk brightness in total intensity scattered light, as shown in above and in Paper II.
The Rayleigh law for linear polarization states that the fractional polarization is given by
| (5) |
where is the angle of deflection, and , , and are the canonical Stokes parameters. The Rayleigh regime is valid when the wavelength of light is large compared to the size of the scattering particles, or . For real grains, the polarization phase function depends on grain shape and composition in addition to grain size. In general, the shape of the polarization phase function is qualitatively similar to the Rayleigh law. For simplicity, we assume a Rayleigh law for this work. This is in part justified by the fact that although the assumed dust composition spans a large range of dust sizes, the scattering is dominated by the smallest grains because their collective cross-section is larger than that of the largest particles.
The polarization of singly scattered photons obeys the Rayleigh law. If photons are multiply scattered, we assume that their scattering angles are randomly reoriented, with the net effect being random polarizations, so that the polarization of the ensemble of multiply scattered photons is zero. Then the polarized intensity or image is given by
| (6) |
where is the intensity of singly scattered photons, given in Eq. (2). The total fractional polarization is given by where is the intensity of multiply scattered photons, given in Eq. (2.2), and
3 Results
We apply the models for scattered polarized light to the disk models presented in Papers I & II: namely, a disk without planets, a disk with a 70 planet at 10 AU, and a disk with a 200 planet at 10 AU. The disk is assumed to be a steady-state passively accreting -disk model, orbiting a 1 star. We assume that the planet opens a gap in the disk, which we model as an ad hoc axisymmetric perturbation on the disk structure. For details of the disk models and analysis of their structure, see Papers I & II.
We calculate the brightness of total scattered light and polarized light at 1 m from the surface of the three disk models described. Simulated images generated at J, H, and K bands produce qualitatively identical results, with slight differences arising from the variation of extinction coefficients and albedos across wavelengths. Compositional and grain size variations can also result in variations in extinction and albedo, which suggest that the overall results presented here apply to a wide range of grain properties as well. The opacities used to generate the models here correspond to a well-mixed Pollack et al. (1994) dust composition with a Dohnanyi (1969) collisional size distribution with minimum/maximum grain size of and gas-to-dust ratio of 0.138 (see also Jang-Condell (2009)). For the record, the extinction opacities at 1 m is 10.86 cm2 per gram of gas, with an albedo of 0.9099.
3.1 Face-on Disks in Polarized Scattered Light
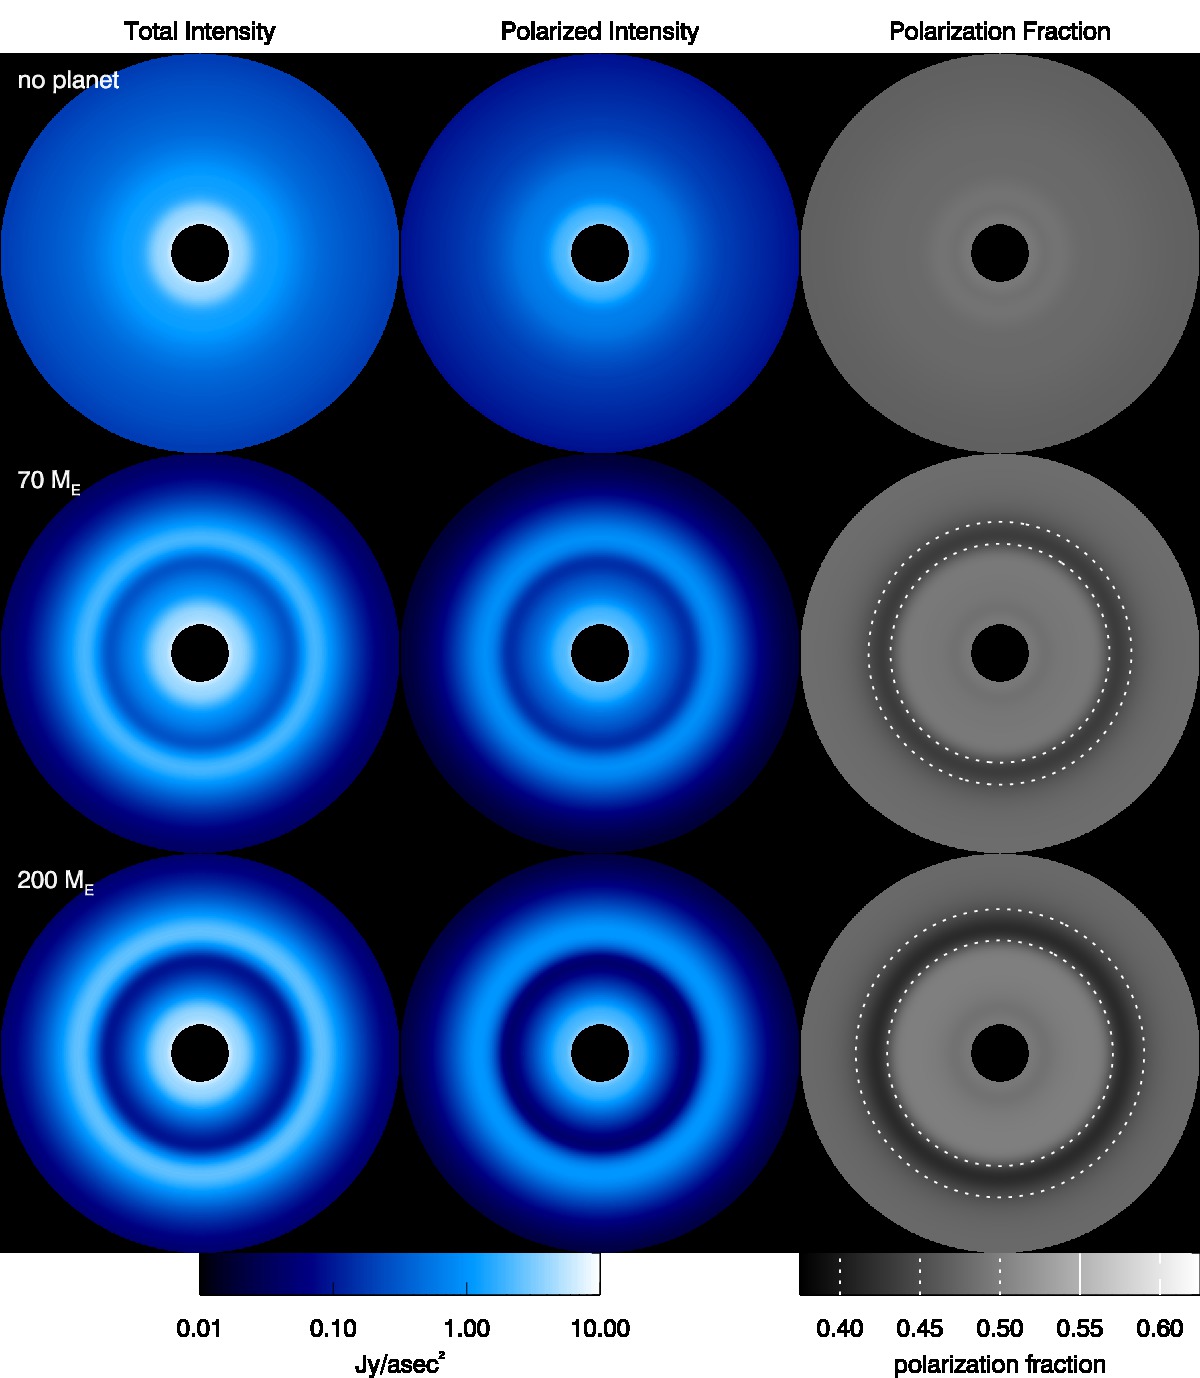
In Figure 1 we show simulated images at 1 micron of our fiducial disk model, with and without planets, at an inclination of 0°(face-on orientation). Three sets of images are shown for each disk: total scattered intensity (), polarized intensity (), and polarization fraction (). The brightness profiles are also plotted in Figure 2 to show greater detail.
The polarization fraction is nearly constant across the face of the disk without any gap, with a slight downward trend toward increasing radial distance. This is to be expected for a typical flared protoplantary disk structure. If the scattering surface of the disk () were flat so that were constant, then the polarization fraction would be exactly constant over the face of the disk. Because the disk is flared so that is steadily increasing with , the scattering angle increases and so the Rayleigh law gives smaller polarization fraction.
Both the total intensity and polarized intensity images clearly show the gaps for both the 70 and 200 , with a dark shadow in the gap trough and a brightened outer gap edge. Considering only the polarized fraction, there is a region of decreased polarization in an annulus centered not on the planet position or gap trough but rather the brightened outer gap edge. This can be explained not from the differences in scattering angle, but rather in the proportion of total intensity from singly- versus multiply-scattered photons. In essence, while the viewed intensity of both singly- and multiply-scattered photons increases with the cosine of the angle of incidence at the disk surface (), the intensity of multiply-scattered photons increases at a faster rate. On the exposed outer gap edge, the angle of incidence is closer to 0, so is larger, the total brightness increases, and the fractional polarization goes down. This can be seen be examining equations (2)-(2.2). From Equation (2), we see that . On the other hand, to first order in for . The albedo of the assumed grain composition is is , so this is a reasonable assumption. For a thin disk, and . When the disk surface tilts up, the angle sum stays roughly the same. However, increases approximately linearly while decreases more slowly. Thus, while both and both increase as increases, increases more slowly.
Specifically, is greater on the brightened outer gap edge than elsewhere in the disk, meaning that a greater proportion of scattered light comes from multiply-scattered photons as compared to elsewhere in the disk. Similarly, there is a slight increase in polarization fraction within the gap trough. This results in a lowered gap contrast in scattered polarized light imaging. The gap contrast, expressed as the ratio of maximum brightness of the outer gap edge to the minimum brightness in the gap trough, is 7.0 and 28 for the 70 and 200 models, respectively, in the total intensity images. These values are reduced to 6.2 (12% reduction) and 23 (16% redection), respectively, in polarized scattered light.
This can also be expressed in terms of the fractional polarization (Figure 2, lower plot). The fractional polariation stays relatively constant in the disk with no planet, with a slight decrease toward larger radii. In the disks with gaps, there is a slight increase in fractional polarization at the trough of the gap and a decrease from about to () for the 70 (200) case. GPI has demonstrated the ability to measure fractional polarizations to within a few percent (Perrin et al., 2015), so this subtle effect may be measureable.
These results suggest that while the locations of gaps in face-on disks can be determined from either total intensity or polarized intensity images, the gap contrast might be slightly underestimated from polarized intensity images alone. On the other hand, if total intensity images are also available, dark and bright lanes in disks caused by shadowing and illumination of exposed surfaces may be confirmed by the increased/reduction in polarization fraction in shadowed/illuminated regions.
3.2 Inclined Disks in Polarized Scattered Light
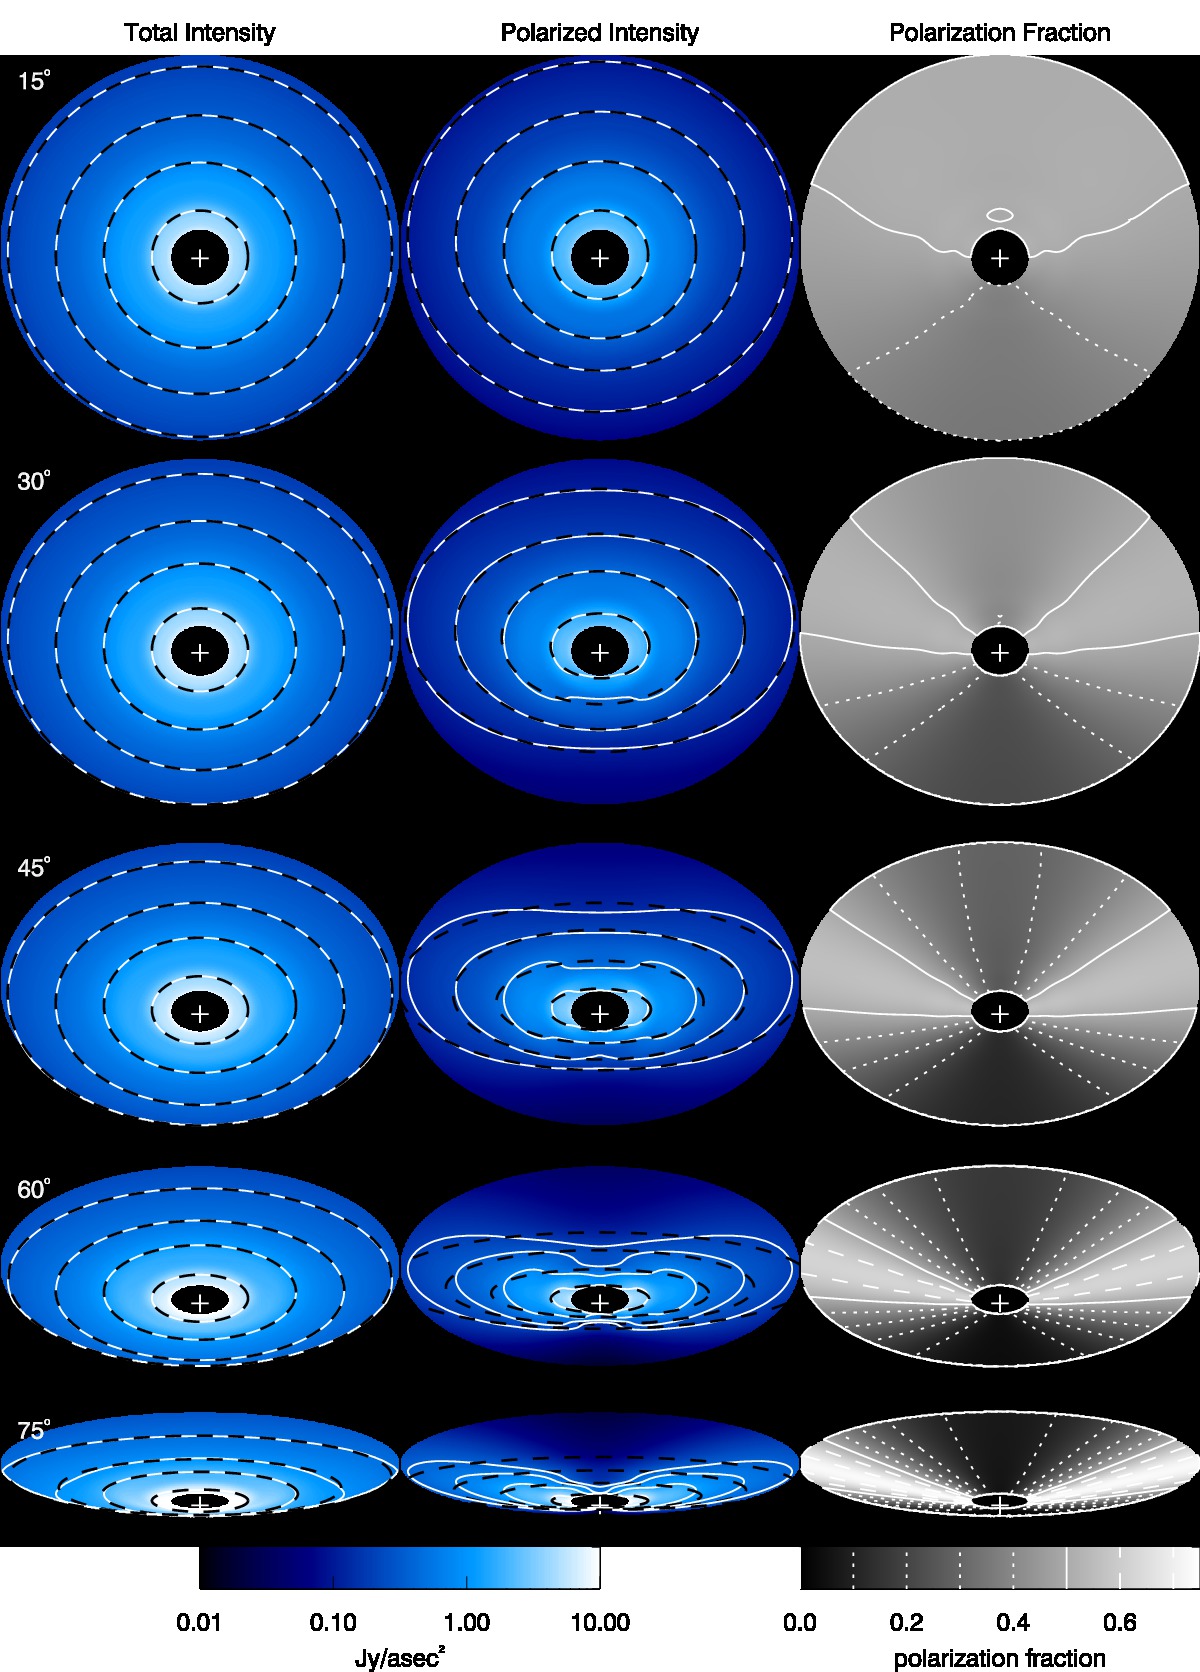
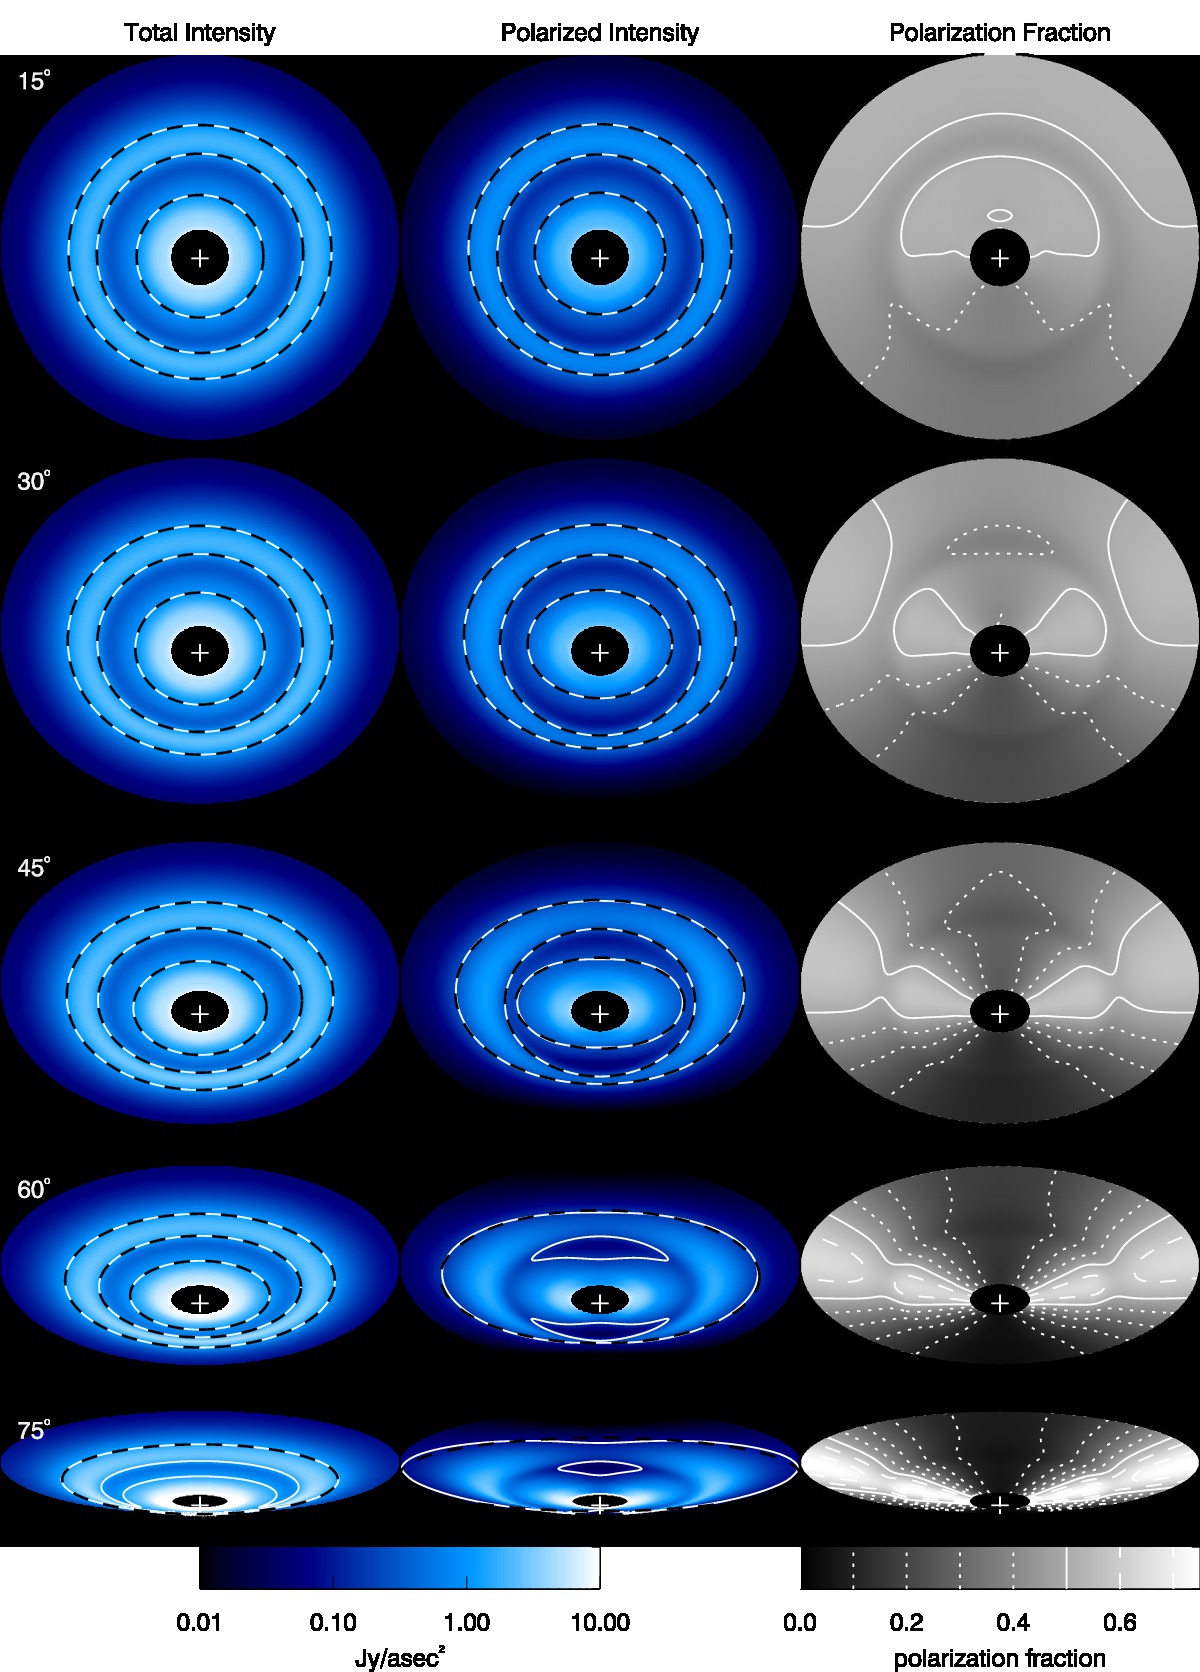
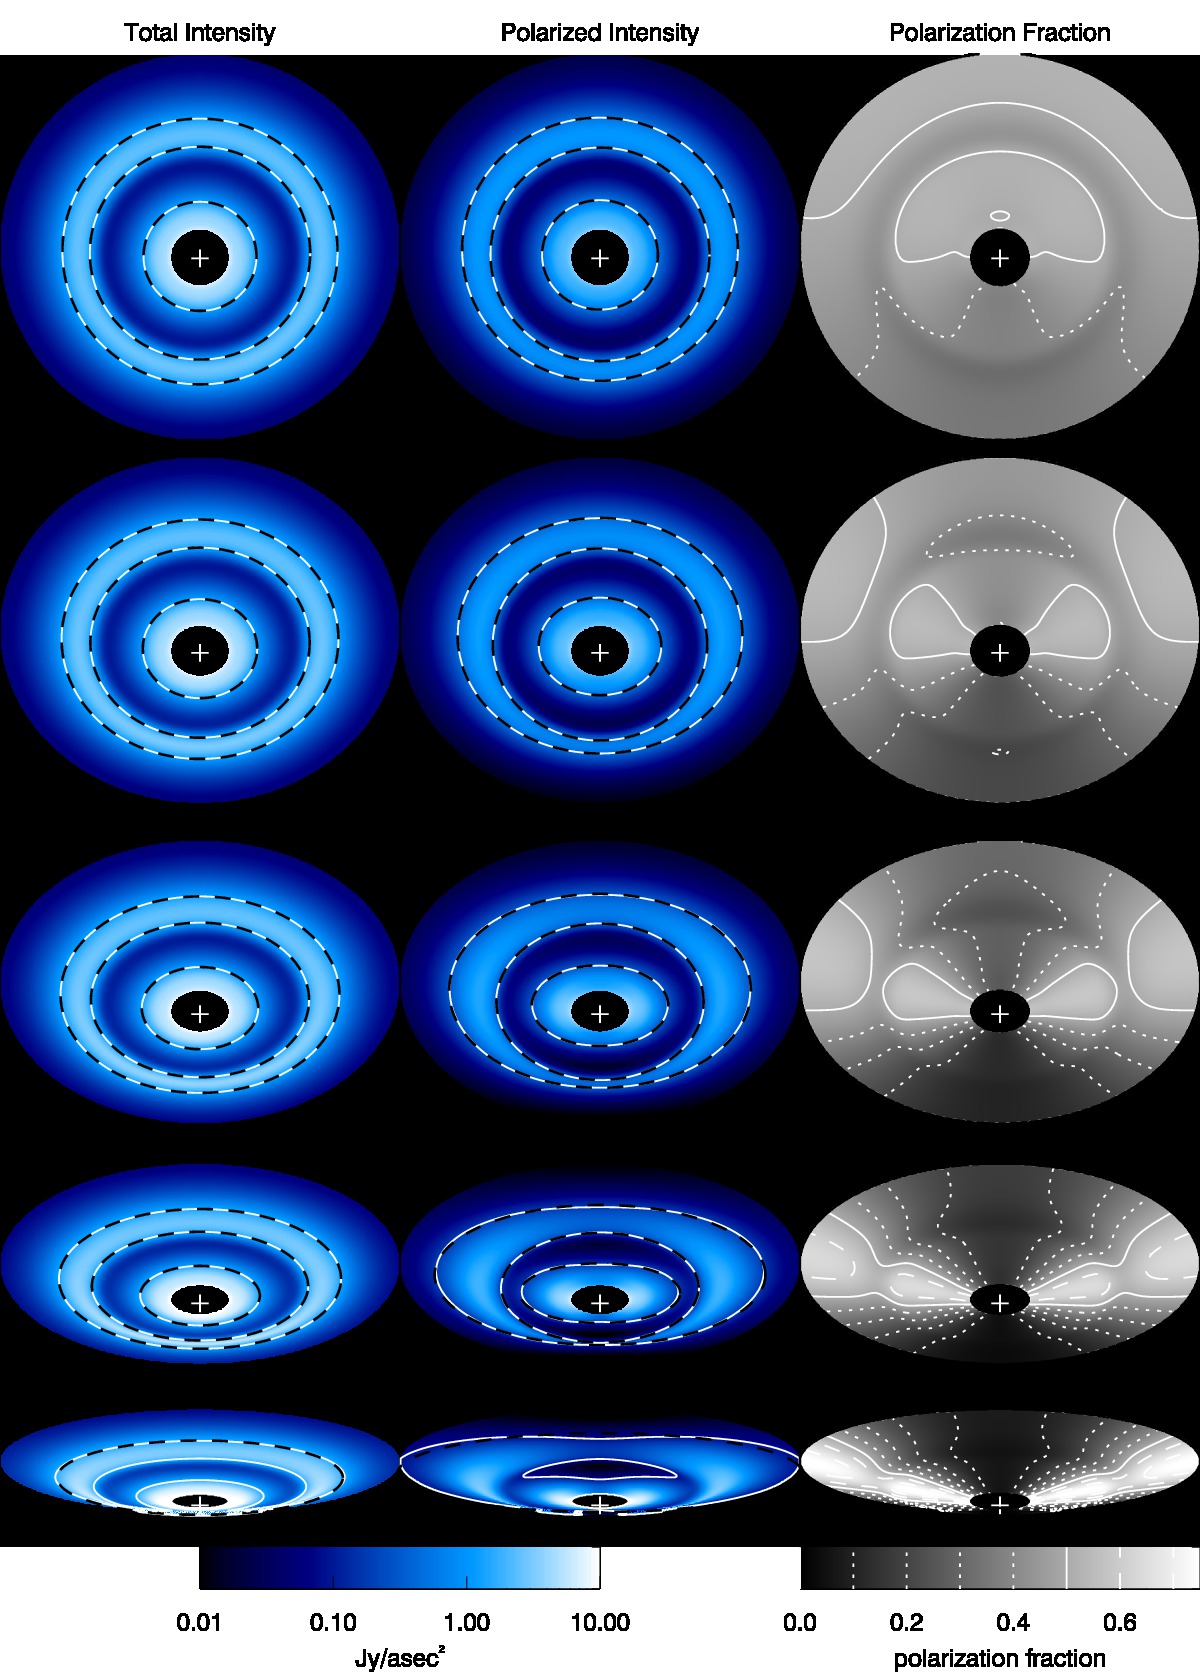
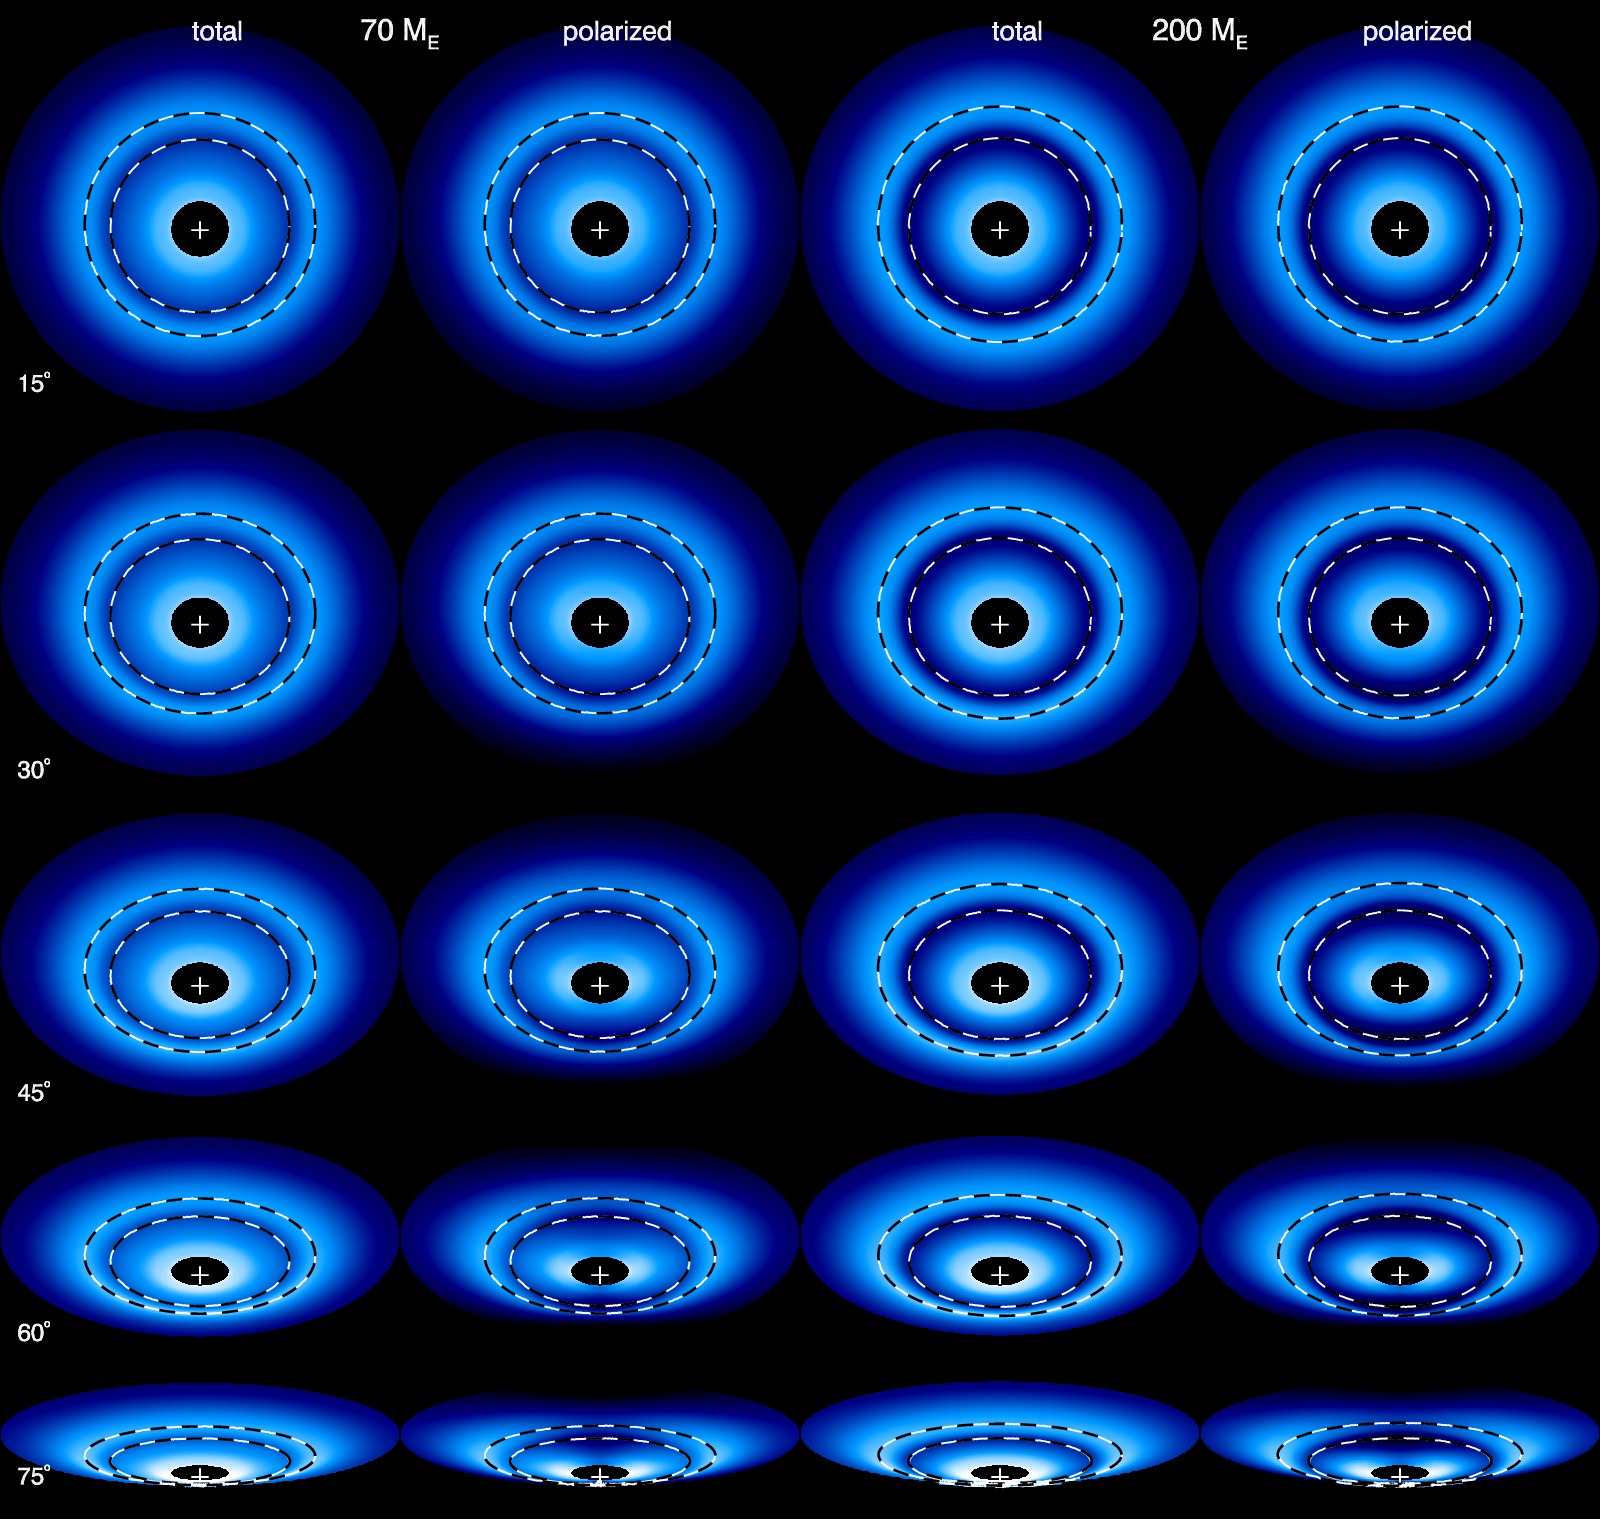
In Figures 3, 4, and 5, we demonstrate the effect of inclination on the appearance of disks in 1 m scattered light. Images for a gapless disk are shown in Figure 3, and disks with gaps created by 70 and 200 planets are shown in Figures 4 and 5, respectively. Each figure shows the predicted appearance of the disk with changing inclination angle when observed in total intensity and polarized scattered light. For reference, we also show the polarization fraction in the right column. The morphology of the image in each realization is significantly different from the image because of the spatial variation in polarization fraction.
Figure 3 shows simulated images of the disk with no gap. In the total intensity images (left column), the isophotes (white solid lines) are well-fitted by ellipses (black dashed lines) with eccentricity equal to , which is the apparent eccentricity of a circle inclined by angle , as shown in Figure 6. However, the centers of the elliptical fits to the isophotes (photocenters) are offset from the stellar position, as shown in Figure 7 (left panel). This is due both to the thickness of the disk as well as due to anisotropies in brightness in scattered light from the near and far sides of the disks, an effect discussed in detail in Paper II.
Figure 8 demonstrates how the thickness of an inclined disk creates a photocenter offset. The fact that the disk scattering surface is above the midplane of the disk means that an isotropically scattering surface should have a photocenter offset of where is the height of the scattering surface above the midplane and is the inclination. This effect is modified somewhat because the near side should be somewhat brighter than the far side, as shown in Paper II. In Figure 7, the offsets are scaled by so that if the photocenter offset is dominated by the geometric effect, the lines plotted on it should be horizontal, with a value equal to the height of the scattering surface. This appears to be the case for the total intensity images in the gapless disk (Figure 7 left, open points), with the height of the scattering surface increasing with distance in the disk, as expected for a flared disk structure.
The near and far sides of the disk appear dimmer in the images in Figure 3 (center column), with the amount of dimming increasing with inclination. This is as expected, since the scattering angles from the near and far sides of the disk are furthest from As shown in the plots of fractional polarization (right column), the fractional polarization is smallest along the minor axis of the disk because the near and far sides of the disk are most inclined with respect to the observer. Thus, the disk appears more elliptical in images versus images, as illustrated from the shapes of the isophotes. The eccentricity of these isophotes, as calculated from the best-fit ellipses, are plotted in Figure 6. As inclination increases, the isophotes deviate from ellipical shapes, tracing apparent “divots” in the image of the disk, caused purely by the inclination geometry of the disk. The implication is that disk inclination should not be inferred from images alone, unless the disk structure is sufficiently well-understood to deduce the polarization fraction.
The polarization fraction is lower on the near side than the far side due to the geometry of scattering off the surface of a disk with finite thickness. This is because the scattering angle is farther from on the near side than the far side, as illustrated in Figure 9. If the scattering angles off the far side () and near side () were supplementary so that , then the fractional polarization as predicted from the Rayleigh law in Equation (5) should be the same on both sides. This would be true if the opening angle of the disk () were zero, in which case and . However, because the disk has a finite height, , and and are no longer supplementary. In particular, is closer to than , so the fractional polarization is lower on the near side of the disk.
At high inclinations (60°and 75°), the near and far sides of the disk dim so much that apparent ansae form in the images of the disk. This phenomenon is different from the ansae often seen in images of optically thin debris disks. In the debris disks, the ansae are caused by an increase in column density of scattering grains along the lines of sight through the disk along the apparent major axis. The disks modeled here are optically thick, so changes in column density through the disk are unimportant. Rather, the light scatters off the disk surface, so the brightness depends on the angle of illumination at the disk surface and the scattering angles along with the optical properties of the dust itself.
In addition to distortion to the shapes of the isophotes, at low inclination angles the photocenter offset is higher in polarized intensity as compared to total intensity, as seen in Figure 7 (left panel), While the photocenter offsets scale roughly with in total intensity (open points), this is not at all the case in polarized light (filled points). The reason for this is because of the anisotropy in polarization fraction. Since the near side of the disk has a smaller polarization fraction than the far side, this has the effect of shifting the photocenter toward the far side of the disk, increasing the amount of offset. At high inclination angles, the effect becomes muted because the disk’s near edge becomes foreshortened as it tips up toward the observer.
Figures 4 and 5 show the effect of a gap caused by a planet on the disk images. To a large extent, the images are a superposition of the tilted disk images seen in Figure 3 with the decreased polarization fraction on the brightened outer gap edge seen in Figure 1. Because the polarized intensity images appear darker along the minor axis of the disk than in total intensity, this leads to an interesting effect where the width of the apparent gap varies azimuthally in the images. This is evident in the shapes of the isophotes overplotted in the images in Figures 4 and 5. The isophotes in each total intensity and polarized intensity image are set to half the brightness of the brightened gap wall on the far side of the disk (upper part of the image). Whereas the apparent gap width is narrowest along the image minor axis in the images, in the images the opposite is true. The gap widths as measured by the distance between the isophotes plotted in Figures 4 and 5 are shown in Figure 10 to explicitly show this relation. The gap widths in total intensity images peak close to the major axis of the disk (position angles 0°and 180°), but in the polarized intensity images they peak at the minor axis of the disk (position angles 90°and 270°).
This causes the inner disk to appear to be “warped” in comparison to the outer disk, since the ellipticity of the inner edge of the gap is higher than the outer edge in the images. If viewed with low angular resolution, the darkest portions of the gap in the image might appear to be dark “spots” rather than part of a full ring. We plot the eccentricities of the isophotes of the gapped disk images in Figure 6 for the gapped disks in the middle and right panels. In total intensity images, the eccentricities closely follow , as expected for a simple inclined disk. However, the innermost isophote, tracing the inner edge of the gap shadow, is consistently more ecccentric than , while the middle isophote, tracing the outer edge of the gap shadow, is consistently less eccentric than . A naive interpretation of the polarized images would lead to the conclusion that the inner disk is tilted with respect to the outer disk, suggesting a “warp” in the disk where none truly exists. We also note that the outermost isophote is also consistently more eccentric than , showing the difficulty of extracting disk inclination solely from polarized intensity images.
The offsets of the isophote centers from the stellar position as measured from the elliptical fits are plotted in Figure 7 (right). As compared to the isophote offsets in the disks without planets, the center offsets are more well-behaved in disks with gaps in both total and polarized intensity images, as if the gaps help to anchor the isophote position. They scale roughly with , with the scale factor increasing from the inner to the outer isophote, as expected from the relation (see caption of Figure 7).
Rather than relying on true isophotes to interpret disk inclination, we can use the locations of the gaps as determined from the brightness minima and maxima as measured radially. These are not true isophotes because the brightness is not azimuthally uniform, but it is convenient to refer to them as such. These dark and bright isophotes are shown as white lines in Figure 11, with black dashed lines as the elliptical fits. The sets of lines are coincident, indicating that these isophotes are very well described as ellipses. The eccentricity of the ellipses is very well matched by , and are not plotted in Figure 6. The isophote center offsets scale very well with also, as seen in the right panel of Figure 7, consistent with an offset solely due to inclination of a thick disk. The positions of the bright and dark isophotes are unaffected by polarization, showing that the existence and locations of gaps in disks can be deduced from either or and images alone. Moreover, the offsets for the 70 and 200 planets are very well matched, indicating that using the radial brightness minimum is an excellent way to determine the position of the gap trough. The positions of the bright far gap edge is different between the two planet masses, most likely because the gap is wider for the higher mass case, thus pushing the location of the bright isophote further out.
To further illustrate how polarization affects images of gapped disks, we plot the azimuthal brightness profiles along the bright and dark isophotes in Figure 12. In total intensity, the near side of the disk is always brighter than the far side because the angle of scattering to the observer () is larger. This effect was noted in Paper II and can be deduced from Equation (2.2). However, the fractional polarization is lower on the near side of the disk compared to the far side, which causes the near side to actually appear slightly dimmer than the far side. Thus, the images retain a great deal of symmetry along the minor axis of the disk image. This suggests that images alone are not a good method of resolving the near/far side degeneracy of disks. The fractional polarization () is a better test of near/far side asymmetry.
Since images result from a combination of both fractional polarization and total intensity, the interpretation of an observed image in the absence of a total intensity image may lead to the incorrect interpretation of density structure in a disk, when it may, in fact be solely a geometric effect. On the other hand, polarization information together with total intensity imaging may be a valuable tool for resolving the near-far degeneracy in inclination angle.
4 Discussion: Applications to Observations
Polarized scattered light images of transitional disks can be interpreted in light of the results presented here by treating the inner clearing as a large gap. Here, we discuss a few pertinent examples.
TW Hya is a well-studied nearly face-on disk that has been imaged to high resolution in total intensity images (Debes et al., 2013, 2016) and polarized intensity (Akiyama et al., 2015; van Boekel et al., 2016). Both the total and polarized intensity reveal gaps in the disk at 20 and 80 AU, and the shapes of the radial profiles are roughly consistent with each other (Debes et al., 2016), as we expect for face-on images. (Andrews et al., 2016). The gap at 20 AU is also consistent with ALMA imaging of the disk (Andrews et al., 2016), suggesting that the concentric ring structure seen in the disk in scattered light traces the underlying structure of the disk as a whole.
The bright “arcs” seen in Oph IRS 48 (Follette et al., 2015) could be the apparent ansae seen along the major axes of the gapped inclined disks shown in Figures 4 and 5. The lack of emission seen along the minor axis in this disk could be simply due to the low fractional polarization caused by the inclination of the disk.
LkCa 15 is an excellent example of how photocenter offsets can be caused by finite disk thickness. The gap imaged in LkCa 15 in scattered polarized light (Thalmann et al., 2015) traces an ellipse with the same eccentricity as seen in 7 mm emission (Isella et al., 2014), but offset along the minor axis. This fits with our prediction that the eccentricity of the bright gap edge matches the underlying shape of the disk, but offset because of the disk thickness. In this interpretation, the northern edge of the disk is tilted toward the observer, and assuming an inclination of 45°and an apparent offset of 11.1 AU in projection, the height of the disk at the gap edge is 16 AU. If the radius of the inner hole is 50 AU, this gives . Given that the height of the light scattering surface () can be several times the thermal scale height of the disk, this is not an unreasonable finding.
PDS 66 shows a strong brightness asymmetry along the minor axis of the ring seen at AU (in projection) in total intensity images (Schneider et al., 2014). However, this asymmetry is less strong in polarized intensity (Wolff et al., 2016). The brighter eastern edge (in total intensity) could be the side tilted away from the observer, resulting in a smaller polarization fraction on that side than the other. This would also explain the positional offset of the inner bright arc seen at AU. The eastern edge still appears to be the azimuthal brightness maximum in the polarized image, which could be due to some kind of highly back-scattering grains or real anisotropies in the disk. Given other azimuthal anisotropies seen in the disk, a true structural anisotropy could be the best explanation.
5 Conclusions
Scattered polarized light is a promising way to detect and characterize protoplanetary disks because of the increased contrast, but interpreting these images for structure must be undertaken with caution. The changing scattering angle and polarization fraction across the disk can introduce spurious structure in the disk. If polarized light is the only method used to image a protoplanetary disk, then any observed morphology must be treated very carefully before inferring any actual disk structure.
Face-on disks with gaps have show slightly less contrast across the gap in polarized intensity than in scattered intensity because the brightened far edge is less polarizing than elsewhere in the disk. This is primarily due to the fact that light scattered from the brightened far edge has a higher fraction of multiply scattered photons.
Inclined disks without gaps appear to be more eccentric when viewed in polarized intensity as opposed to total intensity, as measured by the eccentricity of isophotes. Measuring the eccentricity of isophotes in total intensity robustly recovers the inclination of the disk. However, the thickness of the disk results in a photocenter offset from the central star. Any photocenter offset measured along the minor axis of a disk image can therefore be interpreted as a measure of disk thickness rather than an indication of intrinsic eccentricity. Isophotes in polarized intensity images are more eccentric than those measured in total intensity. At low inclination angles, the photocenter offset is larger when viewed in polarized intensity. At high inclinations, isophotes are no longer well-described as ellipses. This can create the appearance of apparent structure in the disk when none is truly there.
Partially cleared gaps in inclined disks, such as those created by sub-Jovian-mass planets, can give the appearance of local holes or voids of emission where no such structural features exist. On the other hand, since the apparent position of a gap, as measured by the radial brightness minima and maxima, is unaffected by polarization, the presence of a gap can be inferred in either total or polarized intensity, so long as the entire gap can be resolved. In total intensity images, the near side of the disk will appear brighter than the far side within the gap. However, in polarized light, the brightness of the gap will appear more symmetric because the near side of the gap scattered less polarized than the far side.
In principle, if both the polarized and total intensity of a disk image are known along with the scattering angles deduced from the disk inclination, then the scattering phase function can also be determined. This would constrain the properties of the dust itself, leading to a better understanding of the composition of protoplanetary disks. Thus, polarized scattered light can be a useful probe of the dust properties in planet-forming disks.
When interpreting disk structure from polarized scattered light images alone, one must account for the effects of disk inclination and changing fractional polarization across the surface before deducing structure in the disk. When these factors are properly accounted for, imaging of disks in polarized light can become a powerful tool for understanding protoplanetary disks.
References
- Akiyama et al. (2015) Akiyama, E., Muto, T., Kusakabe, N., et al. 2015, ApJ, 802, L17
- Andrews et al. (2016) Andrews, S. M., Wilner, D. J., Zhu, Z., et al. 2016, ApJ, 820, L40
- Bate et al. (2003) Bate, M. R., Lubow, S. H., Ogilvie, G. I., & Miller, K. A. 2003, MNRAS, 341, 213
- Crida et al. (2006) Crida, A., Morbidelli, A., & Masset, F. 2006, Icarus, 181, 587
- Debes et al. (2016) Debes, J. H., Jang-Condell, H., & Schneider, G. 2016, ApJ, 819, L1
- Debes et al. (2013) Debes, J. H., Jang-Condell, H., Weinberger, A. J., Roberge, A., & Schneider, G. 2013, ApJ, 771, 45
- Dohnanyi (1969) Dohnanyi, J. S. 1969, J. Geophys. Res., 74, 2531
- Follette et al. (2013) Follette, K. B., Tamura, M., Hashimoto, J., et al. 2013, ApJ, 767, 10
- Follette et al. (2015) Follette, K. B., Grady, C. A., Swearingen, J. R., et al. 2015, ApJ, 798, 132
- Garufi et al. (2016) Garufi, A., Quanz, S. P., Schmid, H. M., et al. 2016, A&A, 588, A8
- Grady et al. (2015) Grady, C., Fukagawa, M., Maruta, Y., et al. 2015, Ap&SS, 355, 253
- Hashimoto et al. (2011) Hashimoto, J., Tamura, M., Muto, T., et al. 2011, ApJ, 729, L17
- Isella et al. (2014) Isella, A., Chandler, C. J., Carpenter, J. M., Pérez, L. M., & Ricci, L. 2014, ApJ, 788, 129
- Jang-Condell (2008) Jang-Condell, H. 2008, ApJ, 679, 797
- Jang-Condell (2009) —. 2009, ApJ, 700, 820
- Jang-Condell & Kuchner (2010) Jang-Condell, H., & Kuchner, M. J. 2010, ApJ, 714, L142
- Jang-Condell & Turner (2012) Jang-Condell, H., & Turner, N. J. 2012, ApJ, 749, 153
- Jang-Condell & Turner (2013) —. 2013, ApJ, 772, 34
- Kalas et al. (2015) Kalas, P. G., Rajan, A., Wang, J. J., et al. 2015, ApJ, 814, 32
- Mayama et al. (2012) Mayama, S., Hashimoto, J., Muto, T., et al. 2012, ApJ, 760, L26
- Olofsson et al. (2016) Olofsson, J., Samland, M., Avenhaus, H., et al. 2016, A&A, 591, A108
- Oppenheimer et al. (2008) Oppenheimer, B. R., Brenner, D., Hinkley, S., et al. 2008, ApJ, 679, 1574
- Perrin et al. (2009) Perrin, M. D., Schneider, G., Duchene, G., et al. 2009, ApJ, 707, L132
- Perrin et al. (2015) Perrin, M. D., Duchene, G., Millar-Blanchaer, M., et al. 2015, ApJ, 799, 182
- Pollack et al. (1994) Pollack, J. B., Hollenbach, D., Beckwith, S., et al. 1994, ApJ, 421, 615
- Schneider et al. (2014) Schneider, G., Grady, C. A., Hines, D. C., et al. 2014, AJ, 148, 59
- Siess et al. (2000) Siess, L., Dufour, E., & Forestini, M. 2000, A&A, 358, 593
- Thalmann et al. (2010) Thalmann, C., Grady, C. A., Goto, M., et al. 2010, ApJ, 718, L87
- Thalmann et al. (2015) Thalmann, C., Mulders, G. D., Janson, M., et al. 2015, ApJ, 808, L41
- van Boekel et al. (2016) van Boekel, R., Henning, T., Menu, J., et al. 2016, ArXiv e-prints, arXiv:1610.08939
- Wolff et al. (2016) Wolff, S. G., Perrin, M., Millar-Blanchaer, M. A., et al. 2016, ApJ, 818, L15