X-ray flux variability of active galactic nuclei observed using NuSTAR
Abstract
We present results on a systematic study of flux variability on hourly time-scales in a large sample of active galactic nuclei (AGN) in the 379 keV band using data from Nuclear Spectroscopic Telescope Array. Our sample consists of 4 BL Lac objects (BL Lacs), 3 flat spectrum radio quasars (FSRQs) 24 Seyfert 1, 42 Seyfert 2 and 8 narrow line Seyfert 1 (NLSy1) galaxies. We find that in the 379 keV band, about 65% of the sources in our sample show significant variations on hourly time scales. Using Mann-Whitney U-test and Kolmogorov-Smirnov test, we find no difference in the variability behaviour between Seyfert 1 and 2 galaxies. The blazar sources (FSRQs and BL Lacs) in our sample, are more variable than Seyfert galaxies that include Seyfert 1 and Seyfert 2 in the soft (310 keV), hard (1079 keV) and total (379 keV) bands. NLSy1 galaxies show the highest duty cycle of variability (87%), followed by BL Lacs (82%), Seyfert galaxies (56%) and FSRQs (23%). We obtained flux doubling/halving time in the hard X-ray band less than 10 min in 11 sources. The flux variations between the hard and soft bands in all the sources in our sample are consistent with zero lag.
keywords:
galaxies: activegalaxies: nucleigalaxies: Seyfertgalaxies: jetsBL Lacertae objects: generalX-rays: galaxies1 Introduction
There is convincing evidence that accretion onto super-massive black holes powers active galactic nuclei (AGN; Rees 1984). A vast majority of about 85% of them emit little or no radio emission, these AGN are termed radio-quiet AGN and a minority of about 15% called radio-loud AGN have large scale relativistic jets and emit copiously in the radio band. It is still not known what triggers relativistic jets in only a small fraction of AGN and thereby giving rise to the apparent radio-loud radio-quiet dichotomy (Ivezić et al., 2002; Cirasuolo et al., 2003). Both radio-loud and radio-quiet AGN may be categorized into several sub-classes such as Seyfert galaxies (Seyfert 1 and 2), radio galaxies, blazars comprising flat spectrum radio quasars (FSRQs) and BL Lac objects (BL Lacs) etc., According to the unification model, the observed differences between the different types of AGN are in part due to orientation effects (Antonucci, 1993; Urry & Padovani, 1995). One of the defining characteristics of AGN is that they show flux variations across the entire accessible electromagnetic spectrum (Wagner & Witzel, 1995; Ulrich et al., 1997) over a wide range of timescales ranging from minutes to months and years. Though flux variations in AGN are known since their discovery, we still do not completely understand the physical processes that cause such variations (McHardy et al., 2006). Also, it is not unambiguously known if the same physical processes are responsible for the observed flux variations in different types of AGN. In spite of our lack of a clear knowledge on the cause of flux variations, this characteristic of AGN when probed particularly in the X-ray band can give important constraints on the physical properties in the innermost regions of AGN and can even provide clues on the observed radio-loud and radio-quiet dichotomy (Gliozzi et al., 2002).
Among the X-ray band, hard X-ray (with energies greater than 15 keV) variability in particular can provide clues about the physics of the central regions of AGN and kinematics of the jet as it is less affected by absorption than soft X-rays, when the line of sight hydrogen column density is less than 1023 cm-2 (Soldi et al., 2014). Hard X-rays can thus serve as an effective wavelength range to probe the intrinsic properties of the different classes of AGN. Therefore, the study of hard X-ray properties of the various types of AGN in general and hard X-ray flux variability in particular can be used to test the validity of the unification model of AGN (Ghisellini et al., 1994; Urry & Padovani, 1995; Beckmann & Shrader, 2012). Various models are available in the literature on the physical processes that cause hard X-ray emission in AGN. According to Haardt & Maraschi (1993), the hard X-ray emission in radio-quiet AGN is due to the Comptonization of the soft accretion disk photons by a plasma of hot electrons situated above the disk. In the case of radio-loud AGN, in addition to the process that produces hard X-ray emission in radio-quiet AGN, there are additional contributions through inverse Compton (IC) processes from relativistic electrons in the jet.
In any given X-ray band, the observed characteristics of different types of AGN depend on the physical processes that contribute to the observed spectral energy distribution (SED) in that band. In blazars, the broad band SED shows two broad emission peaks: the low energy peak is produced by synchrotron emission and the high energy peak is produced by IC emission process. The seed photons for IC can be from various sources such as the synchrotron photons themselves (Konigl, 1981), accretion disk (Dermer & Schlickeiser, 1993; Boettcher et al., 1997), the broad line region (BLR, Sikora et al. 1994; Ghisellini & Madau 1996) or the torus (Błażejowski et al., 2000). These external photon fields contribute differently in individual blazars and this can explain the varied nature of the high energy component in the SED of blazars. Depending on the location of the synchrotron peak in their SEDs, blazars are further subdivided (Padovani & Giommi, 1995; Abdo et al., 2010) into high synchroton peaked blazars (HSP, with synchrotron emission peaking at X-ray energies with Hz), intermediate synchrotron peaked blazars (ISP, 1014 Hz and low synchrotron peaked blazars (LSP, with synchrotron emission peaking in the IR; Hz). In HSPs, the X-ray spectrum falls in the synchrotron region, thereby showing large amplitude X-ray variations at long as well as short time scales (Sembay et al., 1993; Tanihata et al., 2000; Zhang et al., 2002; Zhang et al., 2005), however, less variable in the optical (Heidt, 1996). On the other hand, LSPs are more variable in the optical (Heidt, 1996) compared to the X-ray (Gupta et al., 2016) band which falls in the IC region of their SED. Nonetheless, it is not always the case and there are instances where the X-ray spectrum is found to have contribution both from the high energy tail of the synchrotron component and the IC component. This has been noticed in several LSP blazars (Tagliaferri et al., 2000; Tanihata et al., 2003; Wierzcholska & Wagner, 2016) and in one HSP blazar (Kataoka & Stawarz, 2016) namely Mrk 421.
Blazars are known to show fast variability. Detection of such fast variability time scales can set an upper limit on the size of the emission region as c tvar, via light travel time arguments. Here, is the Doppler factor, and tvar is the variability time scale. Such fast time scale of variations (in the order of minutes) characterised by the flux doubling/halving time scale are often seen in high energy -rays (Gaidos et al., 1996; Aharonian et al., 2007). Also, in HSP blazars correlated X-ray and -ray variations are found (Aleksić et al., 2015; Baloković et al., 2016) which is very well expected in the one zone leptoinc model of blazar emission, wherein, both hard X-rays and -rays are produced by the same population of relativistic electrons in the jet. Detection of such short time scale X-ray flares with/without a high energy -ray counterpart will constrain the radiative processes operating in the sub-parsec scales of AGN. Detection of very small flux doubling/halving time scale is thus an important addition to the knowledge of AGN flux variability. Previous efforts to search for flux doubling/halving time scale 15 minutes in the X-ray band were negative (Pryal et al., 2015). Therefore, any evidences for the presence of minute scale flux doubling/halving time scale is more important.
In the soft X-ray band, with X-rays having energies 10 keV, numerous results on the flux variability nature of AGN on time scales ranging from hours to months and years are available mainly based on observations from Rossi X-ray Timing Explorer (RXTE) and XMM-Newton (Nandra et al., 1997; Fiore et al., 1998; Turner et al., 1999; Uttley et al., 2002; Markowitz et al., 2003; Soldi et al., 2008; McHardy, 2010). On the other hand, studies on the hard X-ray variability of AGN are very limited. They include hard X-ray spectral variability based on observations from BeppoSAX (Petrucci et al., 2000), INTEGRAL (Petrucci et al., 2013) and Suzaku (Reis et al., 2012). Long term hard X-ray monitoring observations have been recently possible owing to the observations by the Burst Alert Telescope (BAT; Barthelmy et al. 2005) instrument on board the Swift satellite (Gehrels et al., 2004). Because of Swift/BAT’s observing capability in survey mode and its large field of view of 1.4 sr, we have long term monitoring data on a large sample of bright AGN from BAT. Using this data set, AGN have been studied for long term variability on time scale of days to years (Gehrels et al., 2004; Caballero-Garcia et al., 2012; Soldi et al., 2014). However, studies on the hard X-ray variations on time scales of the order of hours are available only on few individual objects such as Mrk 421 (Paliya et al., 2015) using the focusing hard X-ray telescope Nuclear Spectroscopic Telescope Array (NuSTAR; Harrison et al. 2013), sources such as BL Lac (Ravasio et al., 2003), ON 231 (Tagliaferri et al., 2000), Mrk 421 (Maraschi et al., 1999), Mrk 501 (Pian et al., 1998) etc. from BeppoSAX as well as observations from RXTE (Fossati et al., 2008). These observations pertaining to sources in different brightness states indicate different variability behaviour between hard and soft bands, which point to different physical processes contributing to the soft and hard X-ray emission.
Observations using NuSTAR with its high sensitivity and wide spectral coverage between 3 79 keV is ideal to constrain the X-ray emission processes that contribute to the X-ray emission over a wide spectral range in AGN. We investigate here for the first time the hard X-ray flux variations on hourly time scales in the largest sample of AGN that includes both radio-loud and radio-quiet sources. The main motivation here is to understand (i) the similarities and differences in the flux variability nature of different types of AGN over a wide waveband of 3 79 keV, (ii) the differences if any between flux variations in soft and hard X-ray bands and (iii) the presence of fast variations with flux doubling/halving time scale of few minutes. For this we use the publicly available data from observations by NuSTAR. The structure of the paper is as follows. In section 2, we describe the sample used and data reduction. In Section 3 we describe the various analysis carried out on the data set. We discuss our results in Section 4 and summarize the results in Section 5. We adopt a cosmology with km s-1 Mpc-1, and .
2 Sample and Data Reduction
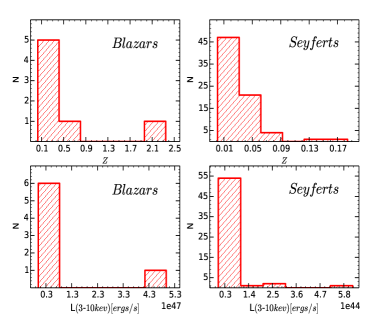
The goal of this work is to find the hard X-ray flux variations in different types of AGN. For this we have used the data from NuSTAR. NuSTAR (Harrison et al. 2013) launched in June 2012, is the first focusing hard X-ray telescope. It has a field of view 13′ x 13′. It consists of two co-aligned X-ray detector pairs with corresponding focal plane modules FPMA and FPMB111https://heasarc.gsfc.nasa.gov/docs/nustar/. NuSTAR observations of all AGN that have become public before March 2015 have been used in this work. Our sample thus consists of 81 AGN, among these 4 are BL Lacs, 3 are FSRQs, 24 are Seyfert 1 galaxies, 42 are Seyfert 2 galaxies and 8 are narrow line Seyfert 1 (NLSy1) galaxies. The details of the sources used in this study are given in Table 1. The distribution of redshifts and the 310 keV luminosity of the sources studied are shown in Figure 1 separately for radio-quiet sources and blazars.
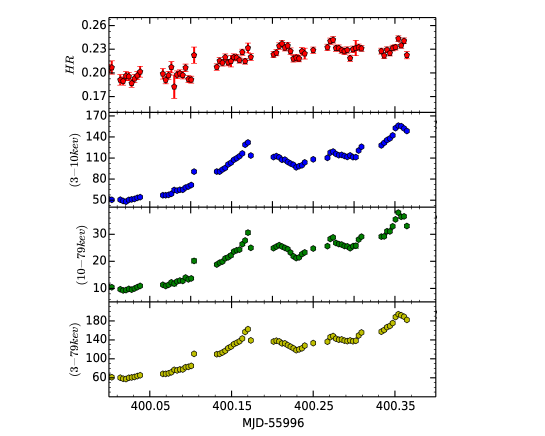
Reduction of the NuSTAR data was done using the data analysis software NuSTARDAS v.1.4.1 distributed by the High Energy Astrophysics Archive Research Center (HEASARC). The calibrated, cleaned and screened event files were generated using the nupipeline task and using CALDB 20141107. A circular region of radius was taken to extract the source and background counts on the same detector. We extracted the 5 min binned light curves in the energy range of 379 keV in each focal plane module FPMA and FPMB using the nuproducts package available in NuSTARDAS. Further, these light curves were divided into two bands: 310 keV and 1079 keV. To generate light curves, the count rates of the two modules FPMA and FPMB are combined using ‘lcmath’ task included in FTOOLS V.4.0. Sample light curves of the BL Lac object Mrk 421 are shown in Figure 2.
| Name | (2000) | (2000) | V | Type | Name | (2000) | (2000) | V | Type | ||
|---|---|---|---|---|---|---|---|---|---|---|---|
| (mag) | (mag) | ||||||||||
| Mrk 335 | 00:06:19.5 | 20:12:11 | 13.85 | 0.026 | Sy1 | 3C 273 | 12:29:06.7 | 02:03:08 | 12.85 | 0.158 | FSRQ |
| NGC 424 | 01:11:27.7 | 38:05:10 | 14.12 | 0.011 | Sy2 | 3C 279 | 12:56:11.1 | 05:47:22 | 17.75 | 0.538 | FSRQ |
| NGC 513 | 01:24:26.8 | 33:47:58 | 13.40 | 0.019 | Sy2 | Mrk 231 | 12:56:14.2 | 56:52:25 | 13.84 | 0.041 | Sy1 |
| NGC 612 | 01:33:57.8 | 36:29:36 | 13.20 | 0.030 | Sy2 | Mrk 248 | 13:15:17.2 | 44:24:26 | 15.10 | 0.036 | Sy2 |
| MCG 0105047 | 01:52:49.0 | 03:26:49 | 14.24 | 0.017 | Sy2 | MCG 063015 | 13:35:53.4 | 34:17:48 | 13.61 | 0.008 | Sy1 |
| NGC 788 | 02:01:06.5 | 06:48:56 | 12.76 | 0.013 | Sy2 | NGC 5252 | 13:38:15.9 | 04:32:33 | 14.21 | 0.022 | Sy2 |
| NGC 985 | 02:34:37.8 | 08:47:15 | 14.28 | 0.043 | Sy1 | NGC 5273 | 13:42:08.3 | 35:39:15 | 13.12 | 0.003 | Sy2 |
| NGC 1068 | 02:42:40.7 | 00:00:47 | 10.83 | 0.003 | Sy2 | Mrk 273 | 13:44:42.1 | 55:53:13 | 14.91 | 0.037 | Sy2 |
| 1H 0323342 | 03:24:41.2 | 34:10:45 | 15.72 | 0.061 | NLSy1 | IC 4329A | 13:49:19.3 | 30:18:34 | 13.66 | 0.016 | Sy1 |
| NGC 1320 | 03:24:48.7 | 03:02:32 | 14.00 | 0.009 | Sy2 | PKS 1409651 | 14:13:09.8 | 65:20:17 | 12.10 | 0.001 | Sy2 |
| NGC 1365 | 03:33:36.4 | 36:08:24 | 12.95 | 0.006 | Sy2 | NGC 5506 | 14:13:14.8 | 03:12:26 | 14.38 | 0.007 | Sy1 |
| 3C 120 | 04:33:11.1 | 05:21:15 | 15.05 | 0.033 | Sy1 | NGC 5548 | 14:17:59.6 | 25:08:13 | 13.73 | 0.017 | Sy1 |
| MCG 031301 | 04:46:29.7 | 18:27:40 | 15.00 | 0.016 | Sy2 | NGC 5674 | 14:33:52.3 | 05:27:30 | 13.70 | 0.025 | Sy2 |
| IRAS 045070358 | 04:53:25.7 | 04:03:42 | 15.00 | 0.030 | Sy2 | Mrk 477 | 14:40:38.1 | 53:30:16 | 15.03 | 0.038 | Sy2 |
| XSS J050542348 | 05:05:45.7 | 23:51:14 | 17.00 | 0.035 | Sy2 | NGC 5728 | 14:42:23.9 | 17:15:11 | 13.40 | 0.009 | Sy2 |
| ZW 468.002 | 05:08:19.7 | 17:21:47 | 13.50 | 0.017 | Sy2 | IGR J145525133 | 14:55:17.8 | 51:34:17 | 17.10 | 0.016 | NLSy1 |
| ARK 120 | 05:16:11.4 | 00:09:00 | 13.92 | 0.033 | Sy1 | IC 4518A | 14:57:41.2 | 43:07:56 | 15.00 | 0.016 | Sy2 |
| IRAS 051892524 | 05:21:01.4 | 25:21:45 | 14.75 | 0.042 | Sy2 | SWIFT J1514.5-8123 | 15:14:42.0 | 81:23:38 | 17.3 | 0.068 | Sy1 |
| NGC 2110 | 05:52:11.4 | 07:27:23 | 13.51 | 0.007 | Sy2 | Mrk 290 | 15:35:52.3 | 57:54:09 | 15.30 | 0.030 | Sy1 |
| NGC 2273 | 06:50:08.7 | 60:50:45 | 13.54 | 0.006 | Sy2 | Mrk 501 | 16:53:52.2 | 39:45:36 | 13.78 | 0.033 | BL Lac |
| 1H 0707495 | 07:08:41.5 | 49:33:06 | 15.70 | 0.041 | NLSy1 | MCG 0540026 | 17:01:07.8 | 29:24:25 | 15.78 | 0.036 | NLSy1 |
| IRAS 072453548 | 07:26:26.3 | 35:54:22 | 16.80 | 0.029 | Sy2 | NGC 6300 | 17:16:59.2 | 62:49:05 | 13.08 | 0.003 | Sy2 |
| Mrk 9 | 07:36:57.0 | 58:46:13 | 14.37 | 0.039 | Sy1 | PDS 456 | 17:28:19.9 | 14:15:56 | 14.03 | 0.184 | NLSy1 |
| IRAS 073783136 | 07:39:44.7 | 31:43:02 | 16.8 | 0.025 | Sy2 | IGR J182445622 | 18:24:19.4 | 56:22:09 | 14.40 | 0.017 | Sy2 |
| Mrk 1210 | 08:04:05.9 | 05:06:50 | 13.70 | 0.013 | Sy2 | LEDA 3097193 | 18:26:32.4 | 32:51:30 | 0.022 | Sy2 | |
| FAIRALL 0272 | 08:23:01.1 | 04:56:05 | 16.00 | 0.021 | Sy2 | 3C 382 | 18:35:03.4 | 32:41:47 | 15.39 | 0.058 | Sy1 |
| FAIRALL 1146 | 08:38:30.8 | 35:59:33 | 16.10 | 0.031 | Sy1 | H 1834653 | 18:38:20.5 | 65:25:39 | 14.53 | 0.013 | Sy2 |
| SWIFT J0845.03531 | 08:45:21.4 | 35:30:24 | 0.137 | Sy1 | 3C 390.3 | 18:42:09.0 | 79:46:17 | 15.38 | 0.057 | Sy1 | |
| MCG 0124012 | 09:20:46.2 | 08:03:21 | 13.70 | 0.020 | Sy2 | 2E 1849.27832 | 18:57:07.7 | 78:28:21 | 14.5 | 0.042 | Sy1 |
| MCG 0422042 | 09:23:43.1 | 22:54:33 | 14.80 | 0.033 | NLSy1 | IGR J194734452 | 19:47:19.4 | 44:49:42 | 15.70 | 0.053 | Sy2 |
| MCG 052316 | 09:47:40.2 | 30:56:54 | 13.69 | 0.008 | Sy1 | 3C 403 | 19:52:15.9 | 02:30:24 | 16.50 | 0.059 | Sy2 |
| 3C 227 | 09:47:45.1 | 07:25:20 | 16.97 | 0.086 | Sy1 | MCG 0741003 | 19:59:28.3 | 40:44:02 | 15.10 | 0.056 | Sy2 |
| NGC 3079 | 10:01:58.5 | 55:40:50 | 12.18 | 0.004 | Sy2 | IGR J201874041 | 20:18:38.7 | 40:41:00 | 0.014 | Sy2 | |
| Mrk 728 | 11:01:01.8 | 11:02:50 | 16.93 | 0.036 | Sy2 | IC 5063 | 20:52:02.2 | 57:04:08 | 13.60 | 0.011 | Sy2 |
| Mrk 421 | 11:04:27.2 | 38:12:32 | 12.90 | 0.031 | BL Lac | IGR J212775656 | 21:27:44.9 | 56:56:40 | 18.79 | 0.014 | NLSy1 |
| NGC 3516 | 11:06:47.4 | 72:34:07 | 12.40 | 0.009 | Sy1 | IRAS F213182739 | 21:34:45.1 | 27:25:55 | 16.36 | 0.067 | Sy1 |
| Mrk 732 | 11:13:49.8 | 09:35:10 | 14.17 | 0.030 | Sy1 | PKS 2149306 | 21:51:55.4 | 30:27:54 | 17.90 | 2.345 | FSRQ |
| NGC 4051 | 12:03:09.6 | 44:31:53 | 12.92 | 0.002 | NLSy1 | PKS 2155304 | 21:58:52.0 | 30:13:32 | 13.09 | 0.116 | BL Lac |
| NGC 4151 | 12:10:32.5 | 39:24:21 | 11.85 | 0.003 | Sy1 | BL Lac | 22:02:43.3 | 42:16:39 | 14.72 | 0.069 | BL Lac |
| WAS 49b | 12:14:17.8 | 29:31:43 | 15.40 | 0.064 | Sy2 | NGC 7582 | 23:18:23.5 | 42:22:14 | 13.57 | 0.005 | Sy1 |
| NGC 4395 | 12:25:48.9 | 33:32:48 | 10.27 | 0.001 | Sy2 |
3 Analysis
3.1 Variability Amplitude
To characterize the flux variations we used the fractional root mean square (rms) variability amplitude (Edelson et al., 2002; Vaughan et al., 2003). This gives an estimate of the intrinsic variability amplitude relative to the mean count rate exceeding the measurement noise in the light curves. is defined as
| (1) |
where is the sample variance, is the arithmetic mean of and represents the mean square error, given by
| (2) |
| (3) |
The uncertainty in is given by
| (4) |
and were calculated for each binned light curve. Variability analysis of the sample was carried out in soft (310 keV), hard (1079 keV) and total (379 keV) bands. An object is considered variable if (significant at 1 ) is greater than zero. Calculated values of for sources that are found to be variable are given in Tables 2, 3 , 4, 5 and 6 for BL Lacs, FSRQs, Seyfert 1 galaxies, Seyfert 2 galaxies and NLSy1 galaxies respectively. About 65% of the sources in our sample are found to be variable.
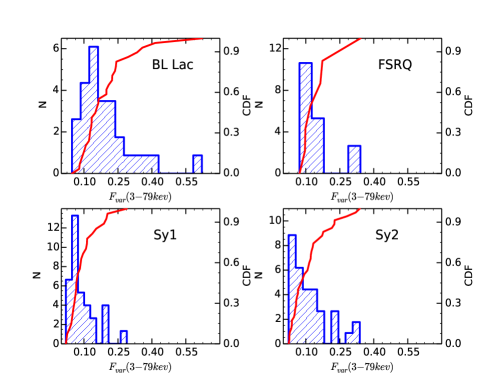
The number of BL Lacs, FSRQs and NLSy1 galaxies studied here is small (compared to Seyfert 1 and 2 galaxies) to consider the variability shown by these objects as a representation of their class as a whole. Nevertheless, we calculated the weighted mean variability of the different classes of AGN in different X-ray bands namely soft, hard and total bands and the results are presented in Table 7. In the total NuSTAR band we find an average of 0.310 0.138 and 0.078 0.028 for BL Lacs and FSRQs respectively. In the radio-quiet category, the average values for Seyfert 1 and Seyfert 2 galaxies are 0.092 0.061 and 0.149 0.108 respectively. The histogram and cumulative distribution of in the total band for different classes of AGN are shown in Figure 3.
| Name | Type | OBS ID | Obs. date | Exposure | |||
|---|---|---|---|---|---|---|---|
| (secs) | 310 keV | 1079 keV | 379 keV | ||||
| Mrk 421 | BL Lac | 10002015001 | 2012-07-07 | 42034 | 0.2090.003 | 0.2470.008 | 0.2250.004 |
| 10002016001 | 2012-07-08 | 24885 | 0.3050.003 | 0.4300.009 | 0.3580.004 | ||
| 60002023002 | 2013-01-02 | 9152 | 0.0680.010 | 0.1680.027 | 0.0880.013 | ||
| 60002023004 | 2013-01-10 | 22633 | 0.1190.008 | 0.1460.021 | 0.1320.010 | ||
| 60002023006 | 2013-01-15 | 24182 | 0.1990.004 | 0.3020.012 | 0.2430.005 | ||
| 60002023008 | 2013-01-20 | 24968 | 0.0840.007 | 0.1590.020 | 0.0950.009 | ||
| 60002023010 | 2013-02-06 | 19307 | 0.0970.005 | 0.0950.014 | 0.1080.006 | ||
| 60002023012 | 2013-02-12 | 14780 | 0.2040.005 | 0.2800.012 | 0.2410.006 | ||
| 60002023014 | 2013-02-16 | 17359 | 0.2310.013 | 0.2200.034 | 0.2370.020 | ||
| 60002023016 | 2013-03-04 | 17252 | 0.1220.005 | 0.1150.016 | 0.1220.007 | ||
| 60002023018 | 2013-03-11 | 17474 | 0.1440.005 | 0.1120.014 | 0.1250.006 | ||
| 60002023020 | 2013-03-17 | 16558 | 0.0880.004 | 0.1250.012 | 0.1020.006 | ||
| 60002023022 | 2013-04-02 | 24772 | 0.2230.004 | 0.3780.011 | 0.2950.006 | ||
| 60002023024 | 2013-04-10 | 5758 | 0.1460.005 | 0.1640.013 | 0.1650.006 | ||
| 60002023025 | 2013-04-11 | 57509 | 0.5990.001 | 0.6380.004 | 0.6210.002 | ||
| 60002023027 | 2013-04-12 | 7630 | 0.1340.002 | 0.1720.005 | 0.1500.002 | ||
| 60002023029 | 2013-04-13 | 16510 | 0.2210.002 | 0.2260.005 | 0.2240.002 | ||
| 60002023031 | 2013-04-14 | 15606 | 0.3120.001 | 0.3610.002 | 0.3350.001 | ||
| 60002023033 | 2013-04-15 | 17278 | 0.1920.006 | 0.2480.005 | 0.1990.008 | ||
| 60002023035 | 2013-04-16 | 20279 | 0.3910.002 | 0.4410.004 | 0.4140.002 | ||
| 60002023037 | 2013-04-18 | 17795 | 0.1810.005 | 0.2120.013 | 0.1990.006 | ||
| 60002023039 | 2013-04-19 | 15958 | 0.1200.005 | 0.1490.013 | 0.1340.006 | ||
| Mrk 501 | BL Lac | 60002024004 | 2013-05-08 | 26141 | 0.1380.007 | 0.2380.019 | 0.1630.008 |
| 60002024006 | 2013-07-12 | 10857 | 0.0430.004 | 0.0590.008 | 0.0470.005 | ||
| 60002024008 | 2013-07-13 | 10343 | 0.0690.007 | 0.0940.012 | 0.0810.007 | ||
| PKS 2155304 | BL Lac | 10002010001 | 2012-07-08 | 33838 | 0.1080.008 | 0.2700.020 | 0.1270.010 |
| 60002022004 | 2013-07-16 | 13856 | 0.1240.020 | 0.2230.046 | 0.1340.022 | ||
| 60002022008 | 2013-08-08 | 13496 | 0.1100.040 | 0.0930.054 | 0.1560.054 | ||
| 60002022012 | 2013-08-26 | 11356 | 0.1980.013 | 0.1970.030 | 0.2090.015 | ||
| 60002022014 | 2013-09-04 | 12282 | 0.1510.019 | 0.0740.043 | 0.0790.024 | ||
| Name | Type | OBS ID | Obs.date | Exposure | |||
|---|---|---|---|---|---|---|---|
| (secs) | 310 keV | 1079 keV | 379 keV | ||||
| 3C 273 | FSRQ | 00015013001 | 2012-07-02 | 2573 | 0.3410.013 | 0.3440.019 | 0.3410.012 |
| 00015016001 | 2012-07-02 | 2990 | 0.1400.018 | 0.1810.028 | 0.1640.017 | ||
| 10002020001 | 2012-07-14 | 244003 | 0.0680.002 | 0.0750.002 | 0.0720.001 | ||
| 10012007001 | 2012-07-13 | 4530 | 0.0900.013 | 0.0990.021 | 0.0960.013 | ||
| 3C 279 | FSRQ | 60002020002 | 2013-12-16 | 39594 | 0.1040.009 | 0.1020.014 | 0.0980.009 |
| 60002020004 | 2013-12-31 | 42810 | 0.1640.007 | 0.1740.010 | 0.1730.006 | ||
| PKS 2149306 | FSRQ | 60001099004 | 2014-04-18 | 44167 | 0.0920.008 | 0.0550.011 | 0.1200.007 |
To check for the robustness of the differences in the weighted mean values of different classes of AGN, we carried out two non-parametric statistical tests, namely the Mann-Whitney U test (hereafter referred to as the U test) and the Kolmogorov-Smirnov test (hereafter referred to as the KS test). The U-test is based on the rank of observations rather than the observations themselves. It allows two groups or conditions to be compared without making the assumption that the values are normally distributed. The null hypothesis that is tested in U-test is that the distribution of values of any two classes of AGN (or between different energy bands in a particular class of AGN) that is compared is identical. The null hypothesis is rejected (at a particular level of confidence) if the U-statistics is less than the critical U-value (). The KS test similar to the U-test is also a non-parametric test that can determine if two data sets differ significantly. In this statistics the cumulative distribution of the two data sets that is to be tested are plotted and KS test uses the maximum vertical deviation between the two curves to give the statistics D. The null hypothesis here is that the two data sets that are compared are from the same distribution. This null hypothesis is rejected if D is greater than the critical D value (). The critical values and are evaluated at the 5% confidence level. In Table 8 we give the results of the two test statistics along with their corresponding P values for the various comparisons that are studied for the different classes of AGN. From Table 8 it is evident that both U and KS tests reject the null hypothesis of any differences in the variability properties between FSRQs-BL Lacs and Sy1-Sy2 galaxies in soft, hard and total energy bands. However, comparing Seyfert galaxies (including Seyfert 1 and 2) and blazars (that include FSRQs and BL Lacs), statistical tests clearly indicate that the blazar sources in our sample are more variable than Seyfert galaxies, in all the three energy bands investigated here, namely soft, hard and the full NuSTAR band.
3.2 Flux variations between soft and hard bands
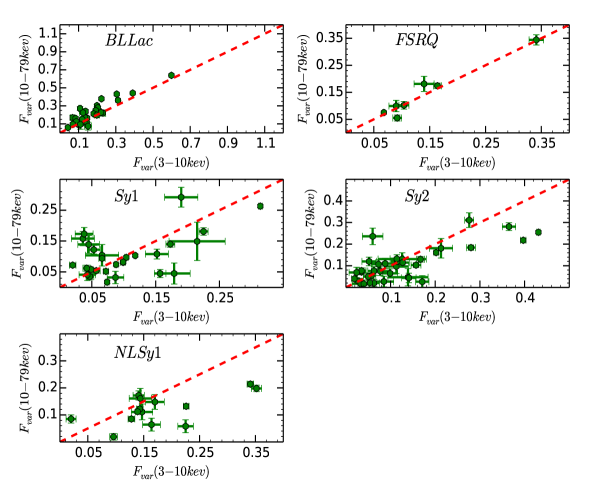
To compare the relation between flux variations in the soft (310 keV) and hard (1079 keV) X-ray bands, was evaluated for the variable sources in the soft and hard bands. In general, for the different types of AGN studied in this work, the derived values of do not show an one to one correspondence between the two energy bands as evident from Figure 4. In the case of BL Lac objects, we have a total of 30 sets of observations on 3 objects. Considering these observations in total, we find that for 90% of the observations, the amplitude of variations in the hard band is larger than the variations in the soft band. The weighted mean for BL Lac objects in the hard and soft bands are 0.338 0.140 and 0.342 0.177 respectively. Statistical analysis by both U and KS tests provides no evidence to suggest the variability pattern between soft and hard bands in BL Lacs are different. FSRQs too show similar amplitude of variations within the errors between hard and soft bands and have weighted mean of 0.082 0.033 and 0.083 0.044 in hard and soft bands respectively. Among the 28 sets of observations on 17 Seyfert 1 galaxies, in about 36% of observations the amplitude of flux variations in the hard band are larger than those in the soft band. Similarly, in Seyfert 2 galaxies in 13/36 sets of observations, the hard band shows a higher variability amplitude compared to the soft band. However, based on statistical analysis (Table 8) we find no difference in the variability characteristics between soft and hard bands in Seyfert 1 and 2 galaxies. For NLSy1 galaxies, we have 14 sets of observations on 7 objects. Considering all the 7 objects together, both U and KS tests show that there is no significant difference in the values between soft and hard bands. Of these, we find that in 3 sets of observations ( 20%) the variability amplitude is larger in the hard band than in the soft band pertaining to the sources 1H0323342, MCG 0422042 and PDS 456.
| Name | Type | OBS ID | Obs.date | Exposure | |||
|---|---|---|---|---|---|---|---|
| (secs) | 310 keV | 1079 keV | 379 keV | ||||
| Mrk 335 | Sy1 | 60001041002 | 2013-06-13 | 21299 | 0.1900.026 | 0.2920.032 | 0.2040.022 |
| 60001041003 | 2013-06-13 | 21525 | 0.1790.025 | 0.0450.034 | 0.1880.023 | ||
| 60001041005 | 2013-06-25 | 93028 | 0.1570.009 | 0.0450.013 | 0.1140.008 | ||
| 3C 120 | Sy1 | 60001042002 | 2013-02-06 | 21606 | 0.0470.006 | 0.0350.010 | 0.0360.006 |
| 60001042003 | 2013-02-06 | 127731 | 0.0740.003 | 0.0170.005 | 0.0440.003 | ||
| Mrk 9 | Sy1 | 60061326002 | 2013-10-29 | 23310 | 0.0660.026 | 0.1040.035 | 0.1130.024 |
| MCG 052316 | Sy1 | 10002019001 | 2012-07-16 | 33927 | 0.0880.003 | 0.0740.005 | 0.0820.003 |
| 60001046002 | 2013-06-03 | 160478 | 0.1040.003 | 0.0970.005 | 0.0960.003 | ||
| 3C 227 | Sy1 | 60061329004 | 2014-02-26 | 12064 | 0.0360.018 | 0.1580.023 | 0.0660.016 |
| NGC 3516 | Sy1 | 60002042004 | 2014-07-11 | 72089 | 0.0530.010 | 0.1220.014 | 0.0600.009 |
| Mrk 732 | Sy1 | 60061208002 | 2013-06-11 | 26359 | 0.0430.013 | 0.0410.019 | 0.0850.013 |
| NGC 4151 | Sy1 | 60001111002 | 2012-11-12 | 21864 | 0.0490.003 | 0.0580.004 | 0.0500.002 |
| 60001111003 | 2012-11-12 | 57036 | 0.0990.004 | 0.0810.003 | 0.0690.003 | ||
| 60001111005 | 2012-11-14 | 61531 | 0.0990.002 | 0.0820.003 | 0.0880.002 | ||
| Mrk 231 | Sy1 | 60002025004 | 2013-05-09 | 28557 | 0.2150.044 | 0.1490.062 | 0.0470.041 |
| MCG 063015 | Sy1 | 60001047002 | 2013-01-29 | 23270 | 0.2250.007 | 0.1810.012 | 0.1990.007 |
| 60001047003 | 2013-01-30 | 127232 | 0.3140.003 | 0.2630.005 | 0.2890.003 | ||
| 60001047005 | 2013-02-02 | 29646 | 0.1730.007 | 0.1400.010 | 0.1540.006 | ||
| NGC 5506 | Sy1 | 60061323002 | 2014-04-01 | 56585 | 0.0720.004 | 0.0520.006 | 0.0630.004 |
| NGC 5548 | Sy1 | 60002044006 | 2013-09-10 | 51460 | 0.0660.005 | 0.0940.007 | 0.0660.005 |
| 60002044008 | 2013-12-20 | 50103 | 0.0570.006 | 0.0540.008 | 0.0730.006 | ||
| Mrk 290 | Sy1 | 60061266002 | 2013-11-14 | 25012 | 0.0870.013 | 0.0320.020 | 0.0230.013 |
| 60061266004 | 2013-11-27 | 26348 | 0.0380.014 | 0.1730.021 | 0.0570.013 | ||
| 3C 390.3 | Sy1 | 60001082002 | 2013-05-24 | 23643 | 0.0420.006 | 0.0620.010 | 0.0530.006 |
| 60001082003 | 2013-05-24 | 47559 | 0.0200.005 | 0.0720.007 | 0.0200.005 | ||
| IRAS F213182739 | Sy1 | 60061306002 | 2013-10-22 | 19809 | 0.0450.017 | 0.1390.029 | 0.0260.017 |
| NGC 7582 | Sy1 | 60061318002 | 2012-08-31 | 16463 | 0.1520.018 | 0.1080.016 | 0.1370.013 |
| IC 4329A | Sy1 | 60001045002 | 2012-08-12 | 162399 | 0.1180.002 | 0.1030.004 | 0.1090.002 |
| Name | Type | OBS ID | Obs.date | Exposure | |||
|---|---|---|---|---|---|---|---|
| (secs) | 310 keV | 1079 keV | 379 keV | ||||
| NGC 513 | Sy2 | 60061012002 | 2013-02-16 | 16040 | 0.1130.027 | 0.0970.033 | 0.1150.023 |
| NGC 788 | Sy2 | 60061018002 | 2013-01-28 | 15411 | 0.0880.031 | 0.1100.024 | 0.0930.020 |
| NGC 1068 | Sy2 | 60002030002 | 2012-12-18 | 57851 | 0.0570.010 | 0.0540.013 | 0.0270.008 |
| 60002030004 | 2012-12-20 | 48560 | 0.0350.010 | 0.0710.013 | 0.0650.009 | ||
| 60002030006 | 2012-12-21 | 19461 | 0.0520.016 | 0.1200.020 | 0.0870.013 | ||
| NGC 1365 | Sy2 | 60002046002 | 2012-07-25 | 36258 | 0.2760.010 | 0.3110.034 | 0.2150.019 |
| 60002046003 | 2012-07-26 | 40588 | 0.1570.011 | 0.1030.011 | 0.1300.008 | ||
| 60002046005 | 2012-12-24 | 66297 | 0.2020.005 | 0.1610.007 | 0.1720.004 | ||
| 60002046007 | 2013-01-23 | 73650 | 0.4310.004 | 0.2550.007 | 0.3380.004 | ||
| 60002046009 | 2013-02-12 | 69877 | 0.3970.006 | 0.2180.009 | 0.2800.006 | ||
| MCG 031301 | Sy2 | 60061051002 | 2014-03-18 | 20088 | 0.1390.045 | 0.0470.040 | 0.1220.031 |
| XSS J050542348 | Sy2 | 60061056002 | 2013-08-21 | 21161 | 0.0350.010 | 0.0770.013 | 0.0600.009 |
| IRAS 051892524 | Sy2 | 60002027002 | 2013-02-20 | 23141 | 0.0600.023 | 0.2360.038 | 0.1770.023 |
| 60002027004 | 2013-10-02 | 25370 | 0.2130.026 | 0.1810.045 | 0.2270.025 | ||
| NGC 2110 | Sy2 | 60061061004 | 2013-02-14 | 12019 | 0.0280.008 | 0.0280.011 | 0.0730.007 |
| IRAS 073783136 | Sy2 | 60061351002 | 2014-04-20 | 23952 | 0.0770.020 | 0.0750.020 | 0.0380.015 |
| Mrk 1210 | Sy2 | 60061078002 | 2012-10-05 | 15447 | 0.1150.014 | 0.1200.015 | 0.1210.011 |
| MCG 0124012 | Sy2 | 60061091002 | 2013-04-03 | 12376 | 0.0630.014 | 0.0760.020 | 0.0480.013 |
| 60061091004 | 2013-04-10 | 9386 | 0.1410.016 | 0.0440.022 | 0.1110.014 | ||
| 60061091006 | 2013-04-18 | 12178 | 0.1710.015 | 0.0260.028 | 0.0530.016 | ||
| 60061091010 | 2013-05-12 | 15334 | 0.0500.011 | 0.0500.016 | 0.0240.010 | ||
| 60061091012 | 2013-05-22 | 12289 | 0.0630.012 | 0.0200.017 | 0.0380.011 | ||
| NGC 3079 | Sy2 | 60061097002 | 2013-11-12 | 21542 | 0.1260.054 | 0.1310.029 | 0.1250.026 |
| NGC 4395 | Sy2 | 60061322002 | 2013-05-10 | 19249 | 0.3650.015 | 0.2810.018 | 0.3200.013 |
| Mrk 248 | Sy2 | 60061241002 | 2013-04-21 | 12901 | 0.0330.019 | 0.0170.025 | 0.0360.017 |
| 60061241004 | 2013-11-17 | 28909 | 0.0400.013 | 0.0160.018 | 0.0650.011 | ||
| 60061241006 | 2013-11-23 | 23056 | 0.1270.015 | 0.1150.022 | 0.1070.014 | ||
| NGC 5273 | Sy2 | 60061350002 | 2014-07-14 | 21119 | 0.1670.009 | 0.1300.013 | 0.1530.009 |
| NGC 5674 | Sy2 | 60061337002 | 2014-07-10 | 20671 | 0.0730.014 | 0.1070.021 | 0.0510.013 |
| Mrk 477 | Sy2 | 60061255002 | 2014-05-15 | 18076 | 0.0850.022 | 0.0270.025 | 0.0270.018 |
| NGC 6300 | Sy2 | 60061277002 | 2013-02-25 | 17706 | 0.2800.010 | 0.1840.012 | 0.2260.008 |
| LEDA 3097193 | Sy2 | 60061354002 | 2014-05-19 | 15645 | 0.1140.015 | 0.1320.019 | 0.1330.013 |
| H 1834653 | Sy2 | 60061288002 | 2013-02-24 | 27391 | 0.0540.007 | 0.0210.009 | 0.0570.006 |
| IGR J194734452 | Sy2 | 60061292002 | 2012-11-06 | 18214 | 0.0240.017 | 0.0690.024 | 0.0570.015 |
| MCG 0741003 | Sy2 | 60001083004 | 2013-03-01 | 20715 | 0.0190.006 | 0.0400.009 | 0.0290.006 |
| IGR J201874041 | Sy2 | 60061297002 | 2013-12-21 | 20967 | 0.0990.017 | 0.0650.021 | 0.0800.014 |
3.3 Flux variability time scale
Knowledge of the time scales on which the X-ray flux varies is very important as it can put constraints on the size of the emission region. For sources that have shown flux variations, we scan their light curves in the energy range 310 keV and 1079 keV to find the time scale of flux variations. For this we calculated the flux doubling time/halving time defined as
| (5) |
here, is the characteristic flux doubling/halving time scale and and are values of the fluxes at time and respectively. This time scale is evaluated by imposing the condition that the difference between the fluxes at times and is greater than (Foschini et al., 2011). The best fit values obtained on fitting Equation 5 to the data are given in Table 9. The quoted uncertainties in are the 1 errors. A total of 11 sources are found to have flux doubling/halving time scale less than 10 min. Such behaviour is not restricted to one AGN type and is seen in all types of AGN. Among the Seyfert 2 galaxies NGC 1365 has shown flux doubling/halving time less than 10 min in all three epochs it has been observed.
| Name | Type | OBS ID | Obs.date | Exposure | |||
|---|---|---|---|---|---|---|---|
| (secs) | 310 keV | 1079 keV | 379 keV | ||||
| 1H 0323342 | NLSy1 | 60061360002 | 2014-03-15 | 101633 | 0.1410.010 | 0.1720.017 | 0.1380.010 |
| MCG 0422042 | NLSy1 | 60061092002 | 2012-12-26 | 18845 | 0.0200.009 | 0.0850.015 | 0.0810.009 |
| NGC 4051 | NLSy1 | 60001050002 | 2013-06-17 | 9434 | 0.2250.014 | 0.0580.024 | 0.1680.014 |
| 60001050003 | 2013-06-17 | 45737 | 0.3410.006 | 0.2140.010 | 0.2770.006 | ||
| 60001050005 | 2013-10-09 | 10202 | 0.1640.016 | 0.0640.024 | 0.1280.015 | ||
| 60001050006 | 2013-10-09 | 49621 | 0.3520.009 | 0.1980.012 | 0.2730.008 | ||
| 60001050008 | 2014-02-16 | 56683 | 0.2260.005 | 0.1320.009 | 0.1800.005 | ||
| IGR J145525133 | NLSy1 | 60061259002 | 2013-09-19 | 21943 | 0.1700.017 | 0.1480.027 | 0.1600.017 |
| MCG 0540026 | NLSy1 | 60061276002 | 2013-12-19 | 20999 | 0.1470.019 | 0.1110.029 | 0.0730.018 |
| PDS 456 | NLSy1 | 60002032010 | 2014-02-26 | 109717 | 0.1440.020 | 0.1610.037 | 0.1800.022 |
| IGR J212775656 | NLSy1 | 60001110002 | 2012-11-04 | 49202 | 0.1430.006 | 0.1220.010 | 0.1380.006 |
| 60001110003 | 2012-11-05 | 28765 | 0.0960.007 | 0.0190.012 | 0.0540.007 | ||
| 60001110005 | 2012-11-06 | 74583 | 0.1390.004 | 0.1120.007 | 0.1240.004 | ||
| 60001110007 | 2012-11-08 | 42110 | 0.1280.006 | 0.0850.009 | 0.1010.006 | ||
3.4 Time delay between flux variations in hard and soft bands
To quantify the degree of correlation between flux variations in soft and hard bands we used a model based approach using the code JAVELIN 222http://www.astronomy.ohio-state.edu/ yingzu/codes.html, a Python based implementation of SPEAR (Stochastic Process Estimation for AGN Reverberation; Zu et al. 2011; Zu et al. 2013). JAVELIN has been designed to improve lag measurements between continuum and line variations in AGN by modelling the light curves using a damped random walk process (DRWP; Kelly et al. 2009; MacLeod et al. 2010). It then compares the simulated light curves with the observed ones to find the lag and this has been found to work well (Pancoast et al., 2014). We applied the JAVELIN method to all the sources in our sample. For all the sources the variations between soft and hard bands are consistent with zero lag. Several studies do exist in the literature on time lags between flux variations in different X-ray bands. For blazars in general using data in the 0.3 10 keV band, soft lags (lower energy variations lagging the higher energy variations), hard lags (higher energy variations lagging the lower energy variation) and zero lags have been observed (Brinkmann et al., 2003; Falcone et al., 2004; Ravasio et al., 2004; Zhang et al., 2006; Abeysekara et al., 2017). This indicates the complex spectral and temporal characteristics of blazars that show different behaviour at different times. Observations of few Seyfert galaxies in the hard X-ray band by SWIFT/BAT in 2 days binned light curve did not show any delay between 2050 and 50100 keV bands (Caballero-Garcia et al., 2012).
| Type | N1 | N2 | avg | ||
|---|---|---|---|---|---|
| 310 keV | 1079 keV | 379 keV | |||
| BL_Lac | 3 | 30 | 0.3420.177 | 0.3380.140 | 0.3100.138 |
| FSRQ | 3 | 7 | 0.0830.044 | 0.0820.033 | 0.0780.028 |
| Sy1 | 17 | 28 | 0.1080.068 | 0.0890.052 | 0.0920.061 |
| Sy2 | 23 | 36 | 0.1910.156 | 0.1200.082 | 0.1490.108 |
| NLSy1 | 7 | 14 | 0.1770.085 | 0.1220.052 | 0.1510.065 |
| LSP | 3 | 7 | 0.0830.044 | 0.0820.033 | 0.0780.028 |
| HSP | 3 | 30 | 0.3420.177 | 0.3380.140 | 0.3100.138 |
| Blazars | 6 | 37 | 0.3210.184 | 0.2580.167 | 0.2410.158 |
| Seyferts | 40 | 64 | 0.1240.098 | 0.0950.061 | 0.1040.076 |
3.5 Duty cycle of flux variations
To characterize the incidence of observability of X-ray variations in different classes of AGN, we have calculated the duty cycle of X-ray flux variations using the definition of Romero et al. (1999). Since only about 65% of the sources in our sample has shown variations exceeding the measurement noise characterised by , duty cycles are estimated not as a fraction of the variable objects within a given class, but as the ratio of the time over which the objects of a given class are found to vary to the total time of observations carried out on each objects in the class. An approach of this kind will take into account the fact that all AGN do not show variations at all times. Also, as the duration of observation is not the same for all the objects, the contribution to the duty cycle has been weighted by the number of times, as well as the duration each source was observed. Duty cycle is defined as
| (6) |
Here, , is the duration corrected for cosmological redshift of the source observed and equals 1 if the object is variable during the period of observations and 0 otherwise. We find NLSy1 galaxies show the highest DC of 87.14% followed by BL Lacs (82.44 %), Seyfert galaxies (Seyfert 1 and 2 galaxies show similar DC of variability of 55.87 % and 56.47% respectively) and FSRQs (22.79%). Most of the BL Lacs belong to the HSP category of AGN and FSRQs are in general LSP sources. In the X-ray band, HSPs are known to be more variable in the X-ray band than LSPs, because, in the former the X-ray spectrum falls in the synchrotron region of the SED, while in the latter, it falls in the IC region. Therefore, the difference in the DC of variability between BL Las and FSRQs is due to the differences in the physical processes that contribute to the X-ray emission in the NuSTAR band in these two classes of AGN.
| Parameters | Mann-Whitney U test | Kolmogorov-Smirnov test | ||||||
|---|---|---|---|---|---|---|---|---|
| Null hypothesis | P | D | Null hypothesis | P | ||||
| Sy1 & Sy2 (soft band) | 471.5 | 358.7 | No | 0.66 | 0.1508 | 0.3427 | No | 0.836 |
| Sy1 & Sy2 (hard band) | 492.5 | 358.7 | No | 0.88 | 0.1587 | 0.3427 | No | 0.787 |
| Sy1 & Sy2 (full band) | 446.0 | 358.7 | No | 0.43 | 0.2024 | 0.3427 | No | 0.491 |
| BL & FSRQ (soft band) | 76.5 | 54 | No | 0.28 | ||||
| BL & FSRQ (hard band) | 65 | 54 | No | 0.13 | ||||
| BL & FSRQ (full band) | 78 | 54 | No | 0.30 | ||||
| Sy & blazars (soft band) | 708 | 905 | Yes | 0.0008 | 0.3792 | 0.2809 | Yes | 0.002 |
| Sy & blazars (hard band) | 521.5 | 905 | Yes | 0.0001 | 0.4569 | 0.2809 | Yes | 0.000 |
| Sy & blazars (full band) | 553.5 | 905 | Yes | 0.0001 | 0.4430 | 0.2809 | Yes | 0.000 |
| NLSy1 (hard v/s soft)∗ | 59 | 55 | No | 0.0767 | 0.4286 | 0.5140 | No | 0.111 |
| NLSy1 (hard v/s soft)† | 33 | 37.6 | Yes | 0.0264 | 0.5000 | 0.5552 | No | 0.026 |
| FSRQ (hard v/s soft) | 23 | 8 | No | 0.8966 | ||||
| BL (hard v/s soft) | 339 | 316 | No | 0.1031 | 0.2667 | 0.3511 | No | 0.200 |
| Sy1 (hard v/s soft) | 387 | 271.8 | No | 0.9442 | 0.1071 | 0.3635 | No | 0.995 |
| Sy2 (hard v/s soft) | 473.5 | 0.5157 | 0.1111 | 0.3206 | No | 0.971 | ||
| NLSy1 & BLSy1 (soft) | 102 | 122.0 | Yes | 0.0128 | 0.5714 | 0.4452 | Yes | 0.002 |
| NLSy1 & BLSy1 (hard) | 145 | 122.0 | No | 0.177 | 0.3214 | 0.4452 | No | 0.237 |
| NLSy1 & blazars (soft) | 220.5 | 165.6 | No | 0.4237 | 0.2896 | 0.4267 | No | 0.306 |
| NLSy1 & blazars (hard) | 141 | 165.6 | Yes | 0.0131 | 0.4054 | 0.4267 | No | 0.051 |
∗Considering all NlSy1 galaxies that include radio-quiet and radio-loud sources.
†Considering only radio-quiet NlSy1 galaxies, that include NGC 4051,
IGR J145525113, MCG 0540026 and IGR J212775656.
3.6 Spectral variations
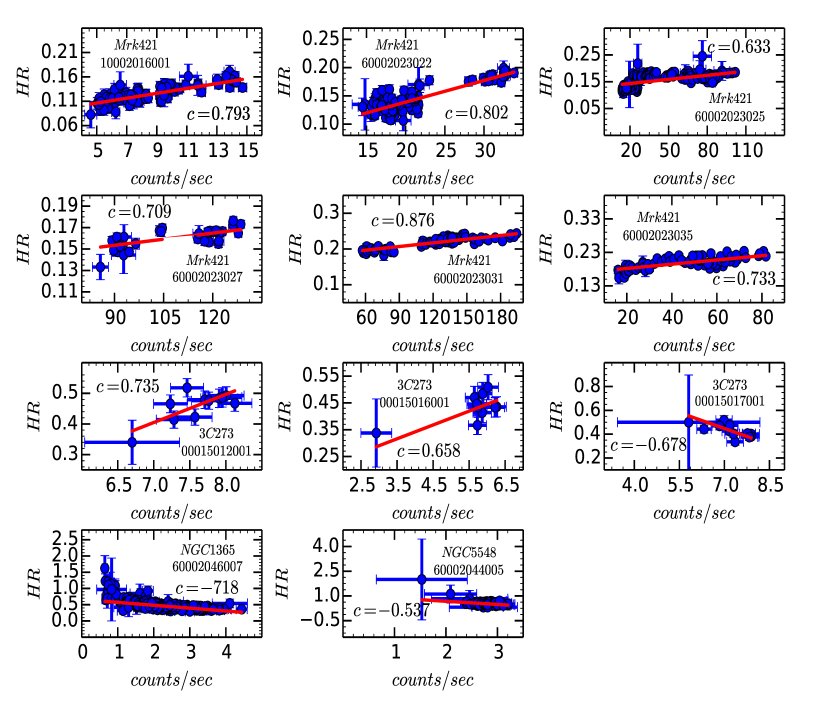
The lack of one to one correspondence between the amplitude of flux variations in the soft and hard bands in some sources indicate that they show spectral variations. To further characterise spectral variations, we construct diagrams of hardness ratio (HR) plotted as a function of total flux in the 379 keV energy range. This is a model independent way to study spectral variations. HR is estimated using the following relation
| (7) |
where, and refer to the fluxes in the 1079 keV and the 310 keV respectively. For most of the sources we do not find a significant correlation between variations in HR and total flux. However, for some sources we do find a correlation. For those sources, the plot of HR as a function of the flux in the 379 keV band is shown in Figure 5. To quantify the significance of the correlation, we fit the observed points in the HR v/s flux diagram using a linear function of the form . During the fit we take into account the errors both in HR and flux following Press et al. (1992). The results of the fit are given in Table 10 and they are shown as solid lines in Figure 5. Significant spectral variations are seen in the BL Lacs object Mrk 421, the FSRQ 3C 273, the Seyfert 1 galaxy NGC 5548 and the Seyfert 2 galaxy NGC 1365. For the BL Lac object Mrk 421 a significant harder when brighter trend is seen in 6 epochs of observations. However, for the FSRQ 3C 273, in the three epochs where a correlation between HR and total flux is found, on two epochs a harder when brighter trend is found, while, in one epoch a softer when brighter trend is noticed. Blazars in general are found to show a harder when brighter behaviour. Such hardening when brightening behaviour more often seen in the HSP category (Giommi et al., 1990; Pian et al., 1998) among other things could be due to the shift of their broad band SEDs to higher energies (Brinkmann et al., 2003). The behaviour seen in Mrk 421 here is observed before as well (Takahashi et al., 1996). In the radio-quiet category, two Seyfert galaxies, namely NGC 5548 and NGC 1365 showed spectral variations with their spectra becoming softer with increasing brightness. This trend is also known in other Seyfert galaxies based on observations from RXTE (Sobolewska & Papadakis, 2009), Swift/XRT (Connolly et al., 2016) and Swift/BAT (Caballero-Garcia et al., 2012), which is expected in various models (Haardt et al., 1997; Turner & Miller, 2009). We conclude that among the sample of sources studied here, only some sources do show spectral variations. The hard X-ray band in Mrk 421 is primarily dominated by the non-thermal continuum (not necessarily true for the Seyfert galaxies NGC 5548 and NGC 1365), while in the soft X-ray band there can be contribution from different processes such as power law continuum, soft excess, neutral absorption and absorption features from warm absorbers. Thus, the harder when brighter trend seen in Mrk 421 is most likely due to changes in the power law component in the relativistic jets of these sources.
| Name | Type | OBSID | Sig. | Sig. | ||
|---|---|---|---|---|---|---|
| (310 keV) | (1079 keV) | |||||
| (min.) | (min.) | |||||
| 3C 120 | Sy1 | 60001042002 | 17.36 5.60 | 3.11 | 5.25 2.01 | 3.33 |
| MCG 0741003 | Sy2 | 60001083002 | 16.82 5.49 | 3.07 | 9.13 2.63 | 3.56 |
| NGC 4051 | NLSy1 | 60001050008 | 6.96 1.25 | 5.65 | 5.70 1.48 | 3.91 |
| NGC 4151 | Sy1 | 60001111005 | 16.42 5.78 | 3.08 | 23.53 6.36 | 3.70 |
| Mrk 421 | BLLac | 10002015001 | 23.40 6.66 | 3.52 | 43.40 13.44 | 3.85 |
| 60002023006 | 22.32 6.80 | 3.29 | 3.04 1.23 | 3.75 | ||
| 60002023022 | 113.64 15.26 | 7.71 | 96.20 26.51 | 3.78 | ||
| 60002023025 | 37.08 8.69 | 4.27 | 16.59 4.44 | 3.98 | ||
| 60002023027 | 55.84 4.72 | 11.57 | 47.44 8.28 | 5.58 | ||
| 60002023031 | 34.13 3.47 | 9.84 | 34.72 9.89 | 3.43 | ||
| 60002023033 | 55.96 16.92 | 3.31 | 22.33 6.48 | 3.45 | ||
| 60002023035 | 25.11 2.54 | 9.88 | 25.07 5.60 | 4.48 | ||
| 3C 273 | FSRQ | 10002020001 | 20.64 6.36 | 3.25 | 11.06 2.45 | 4.52 |
| IC 4329A | Sy1 | 60001045002 | 22.11 7.27 | 3.05 | 14.12 4.19 | 3.38 |
| MCG 052316 | Sy1 | 60001046002 | 99.58 23.12 | 4.23 | 3.35 1.45 | 3.89 |
| MCG 063015 | Sy1 | 60001047003 | 10.45 3.18 | 3.30 | 7.89 2.53 | 3.15 |
| PDS 456 | NLSy1 | 60002032002 | 4.94 1.45 | 3.27 | 1.99 0.85 | 3.34 |
| IGR J212775656 | NLSy1 | 60001110002 | 10.36 2.84 | 3.68 | 32.59 8.63 | 3.56 |
| 60001110005 | 5.78 1.93 | 3.79 | 51.47 17.07 | 3.04 | ||
| NGC 1068 | Sy2 | 60002030004 | 17.63 8.07 | 3.98 | 5.12 1.72 | 3.02 |
| NGC 1365 | Sy2 | 60002046005 | 10.49 2.45 | 4.32 | 5.36 2.17 | 3.14 |
| 60002046007 | 8.45 2.16 | 3.94 | 7.70 2.83 | 3.04 | ||
| 60002046009 | 10.56 3.16 | 3.35 | 7.76 2.39 | 3.28 | ||
| NGC 1052 | Sy2 | 60061027002 | 3.53 1.45 | 3.10 | 1.86 1.02 | 3.67 |
| NGC 4395 | Sy2 | 60061322002 | 3.08 0.44 | 7.33 | 4.35 1.08 | 4.13 |
4 Discussion
X-ray flux variations in AGN can be described by a wide variety of physical processes. In the radio-quiet category of objects hard X-rays can be produced by the Comptonization of soft disk photons in the hot plasma above the accretion disk (Haardt & Maraschi, 1993), whereas, in the radio-loud category of AGN, hard X-rays are dominated by inverse Compton scattering of synchrotron photons by relativistic electrons in the jet via Synchrotron Self Compton process and synchrotron radiation. Given the various methods of the production of hard X-rays in AGN, there can be different causes for X-ray flux variations. In this section we discuss the results of our variability analysis, the potential causes of such variations, the nature of X-ray variations as well as their relation to various physical properties of the sources.
4.1 Flux variability
From the results of our variability analysis on a large sample of AGN belonging to different categories, we find that a major fraction of 65% of the sources in our sample show flux variability. Radio-loud objects (blazars) show large amplitude flux variations relative to their radio-quiet counterparts (Seyfert galaxies) in all the three bands, namely soft, hard and total bands. Such large amplitude flux variations are expected if the X-ray emission in radio-loud sources are dominated by radiative processes in their relativistic jets.
A total of 8 NLSy1 galaxies are in our sample. They are a separate class of AGN with soft X-ray excess (Boller et al., 1996) showing fast large amplitude X-ray flux variations (Pounds et al., 1995; Leighly, 1999) and having FWHM of the H line less than 2000 km (Osterbrock & Pogge, 1985). Some of the peculiar properties of these sources have been attributed to them having higher accretions rates compared to the conventional broad line Seyfert galaxies (Peterson et al., 2000). Considering all the NLSy1 galaxies studied here as a whole, from statistical tests, no difference is found in the variability behaviour between soft and hard bands. However, three sources, namely 1H 0323342, MCG0422042 and PDS 456 show high values in the hard band relative to the soft band. MCG0422042, 1H 0323342 and PDS 456 are detected at 1.4 GHz with flux densities of 10 mJy, 614 mJy and 22 mJy respectively (Condon et al., 1998). As the above three NLSy1 galaxies are detected in the radio band and as they also show more amplitude of variability in the hard band relative to the soft X-ray band, it is likely that these three sources have a significant hard X-ray contribution from relativistic jets. Of them, 1H 0323+342 is a gamma-ray emitting NLSy 1 galaxy (Abdo et al., 2009), suggesting the presence of a relativistic jet in it similar to blazars. Removing these three sources, from the list of NLSy1 galaxies and classifying the remaining sources as radio-quiet NLSy1 galaxies, we find from U test, that in radio-quiet NLSy1 galaxies variations in soft band is more than the variations in hard band. However, KS test report of no difference in Fvar values between hard and soft bands. In the soft X-ray band our statistical tests indicate that radio-quiet NLSy1 galaxies are more variable than Seyfert 1 galaxies with broad optical emission lines similar to that reported by Leighly (1999). However, from both U and KS test it is evident that there is no difference in the Fvar statistics in the hard X-ray band between radio-quiet NLSy1 galaxies and their broad line counterparts. This increased Fvar in the soft band in radio-quiet NLSy1 galaxies might be due to them having lower BH masses than broad line Seyfert galaxies in accordance to the negative correlation between Fvar and BH mass (see section 4.3). However, recently from spectro-polarimetric observations of one NLSy1 galaxy PKS 2004447, Baldi et al. (2016) suggested that the now existing notion of NLSy1 galaxies having low BH masses need not be true and NLSy1 galaxies too have BH masses similar to blazars. If it is indeed the case, then the larger Fvar seen in NLSy1 galaxies compared to their broad line counterparts might be because of them having X-ray flux variations caused by physical processes other than Seyfert 1 galaxies. In radio-quiet objects, no statistically significant differences in flux variations between soft and hard bands is found both in Seyfert 1 and Seyfert 2 galaxies. Also, we find both Seyfert 1 and Seyfert 2 galaxies showing similar characteristics in all the three bands, namely, soft, hard and the full energy bands. Though these results pertain to variations on short time scales, from long term variability studies in the hard X-ray band, Seyfert 2 galaxies are found to be marginally more variable compared to Seyfert 1 galaxies (Beckmann et al., 2007; Soldi et al., 2014).
| Name | OBS ID | Slope | Intercept | P | R | |
|---|---|---|---|---|---|---|
| Mrk 421 | 10002016001 | 0.005 0.000 | 0.081 0.003 | 0.900 | 10-5 | 0.793 |
| 60002023022 | 0.003 0.000 | 0.062 0.006 | 3.030 | 10-5 | 0.802 | |
| 60002023025 | 0.001 0.000 | 0.133 0.000 | 6.954 | 10-5 | 0.524 | |
| 60002023027 | 0.000 0.000 | 0.119 0.000 | 1.984 | 10-5 | 0.709 | |
| 60002023031 | 0.000 0.000 | 0.176 0.000 | 2.924 | 10-5 | 0.876 | |
| 60002023035 | 0.001 0.000 | 0.169 0.000 | 3.562 | 10-5 | 0.646 | |
| 3C 273 | 00015012001 | 0.085 0.034 | 0.186 0.262 | 1.193 | 0.010 | 0.735 |
| 00015016001 | 0.049 0.032 | 0.168 0.187 | 0.984 | 0.029 | 0.658 | |
| 00015017001 | 0.085 0.028 | 1.038 0.208 | 1.809 | 0.015 | 0.678 | |
| NGC 5548 | 60002044005 | 0.192 0.027 | 1.060 0.077 | 1.301 | 10-5 | 0.537 |
| NGC 1365 | 60002046007 | 0.093 0.007 | 0.679 0.018 | 1.890 | 10-5 | 0.718 |
4.2 Spectral variability
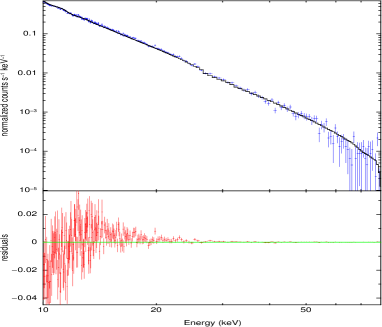
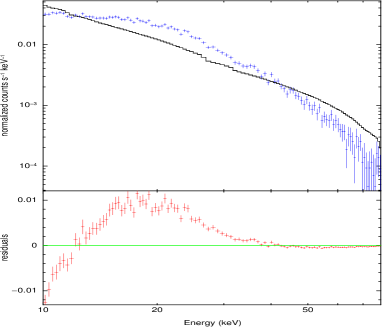
To have an idea of the spectral variations of the sources relative to their brightness, correlation between HR and total flux has been studied. The HR is computed from light curves that cover a wide energy range. Therefore the disadvantage in using HR to characterize spectral variations is that they do not identify spectral components that are responsible for the observed variations measured over a band, however, they are the simplest one to study spectral variations in a model independent way. The majority of sources in our sample do not show any correlation between HR and flux variations. However, some sources do show correlations between flux and spectral variations. In the radio-loud category, objects such as Mrk 421 and 3C 273 (most of the time), showed a spectral hardening with increasing brightness level, i.e, a hardening when brightening trend is noticed. Among the radio-loud sources that showed a harder when brighter trend, Mrk 421 belong to the HSP type, where the harder when brighter trend is often seen (Giommi et al., 1990; Pian et al., 1998; Baloković et al., 2016). In the FSRQ 3C 273 (most of the FSRQs are LSP blazars), we find both harder when brighter and softer when brighter trend. We do not as yet have an unambiguous knowledge of the physical parameters that cause spectral variations. However, the harder when brighter trend seen in the sources studied here, namely, Mrk 421 and 3C 273 might be due to the emergence of a hard X-ray tail produced in the relativistic jets in the high brightness states in these objects. Though the overall X-ray spectrum of HSP blazars is dominated by the high energy tail of synchrotron emission (contrary to LSP blazars which is dominated by IC emission) it has recently been noticed that in the HSP blazar Mrk 421, during in its low brightness state, excess emission is noticed above 20 keV which is attributed to the emergence of the IC emission (Kataoka & Stawarz, 2016). This clearly indicates that phenomena of flux and spectral variability in Mrk 421 and other blazars is complex. To identify the nature of the hard X-ray emission in our sample of radio-loud vis-a-vis radio-quiet sources, we generate the NuSTATR hard X-ray spectra and fit them with a simple power law model. The results of this spectral fitting for a BL Lac Mrk 421 and a Seyfert galaxy PKS 1409651 is shown in Figure 6. From the figure it is clear that the hard X-ray emission in Mrk 421 (and other blazars) is likely dominated either by jet synchrotron or inverse Compton processes or a combination of both assuming a leptonic jet model. For Seyfert galaxies, power law model is not a good fit to the spectra, thus indicating the hard X-ray emission as due to thermal Comptonization processes. The hardening when brightening trend noticed here in the radio-loud objects Mrk 421 and 3C 273 has been reported earlier (Malizia et al., 2000; Gliozzi et al., 2007, 2008). For two Seyfert galaxies, namely NGC 5548 and NGC 3516 a softening when brightening trend is noticed. Such softening when brightening trend is known for other Seyferts at low energies below 1 keV (Sobolewska & Papadakis, 2009) as well as at energies above 2 keV (Soldi et al., 2014).
4.3 v/s black hole mass
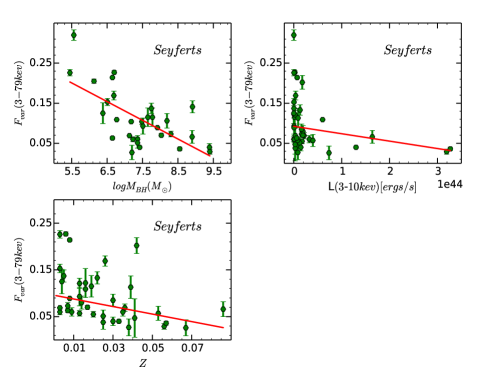
We show in Figure 7 the relation between in the 379 keV energy range and black hole (BH) mass. The BH masses are collected from the online BH mass data base at the Georgia State University 333http://www.astro.gsu.edu/AGNmass/, which is a compilation of BH masses determined from spectroscopic monitoring observations (Bentz & Katz, 2015). Of the 81 objects in our sample, BH masses are available for only 50 objects. Among those 50 objects, only 37 objects are found to be variable and they are thus used to study the correlation if any between and BH mass. Figure 7 indicates that there is an anti correlation between and BH mass. Both Spearmann rank correlation and Kendalls tests on the data indicate that the anti correlation is significant with 99.9 percent. Using a simple linear least squares fit to the data by including the error in we find
| (8) |
Therefore, there is in general a trend for high mass objects to be less variable though there is a large scatter in the v/s MBH diagram. Studies of X-ray variations in the soft X-ray band on a large number of sources do show a negative correlation between and BH mass similar to the one observed here (Papadakis & McHardy, 1995; O’Neill et al., 2005; Ponti et al., 2012).
4.4 v/s 310 keV luminosity
The relation between and the luminosity of the source in the energy range 310 keV is shown in Figure 7. To determine the flux, we have fitted power law to the observed spectra for all the sources with fixed galactic column density . This was then used to calculate the luminosity in the 3 10 keV range. From the figure there is a hint that low luminosity objects are more variable than their high luminosity counterparts.
4.5 Short time scale variability
Short time scales of flux variations in AGN taken as the flux doubling/halving time scale in this work are more often seen at high energies in the -ray band, for example, 4 min in PKS 2155304 (Aharonian et al., 2007) and 15 min in Mrk 421 (Gaidos et al., 1996) and 14 min in Mrk 421 in the NuSTAR band (Paliya et al., 2015). A recent systematic search for flux doubling/halving time scale less than 15 minutes in the soft X-ray (0.210 keV) band, from Swift/XRT observation of blazars by Pryal et al. (2015) has yielded a negative result. Observations of short time scale flux variations in the high energy band of the electromagnetic spectrum is very important, as this can set an upper limit on the size of the emitting region (Rs) via the relation and consequently, can help in constraining the emission processes. Here, is the time scale of variability, is the redshift of the source and is the Doppler factor. Doppler factor is defined as , where, is the Lorentz factor of the jet, is the ratio of the jet speed to the speed of light in vacuum and is the viewing angle, the angle between the jet and the observers line of sight. In this work, by characterising the variability time scale by either the flux doubling/halving timescale we found the shortest flux doubling/halving time scale of 1.86 1.02 min for the Seyfert 2 galaxy NGC 1052. Using this observed we find cm. Such short time scales of variations are also seen in few radio-loud sources. In our sample, we were able to derive flux doubling/halving time scale for 16 sources, of which 11 sources have time scales less than 10 min. Thus, this is the first report of the detection of statistically significant hard X-ray flux variability in a large number of AGN with flux doubling/halving time scale less than 10 minutes. The only other report of short time scale flux doubling/halving variability in the hard X-ray band available in the literature is for the source Mrk 421 (Paliya et al., 2015). On analysis of the blazar light curves for which we were able to derive flux doubling time scales, we found that the flares are asymmetric in nature showing a quick rise and slow decay. This might be due to the difference between the particle acceleration and synchrotron cooling time scales.
5 Summary
In this work we have examined 176 observations of AGN from NuSTAR to search for hard X-ray flux variations in them, characterize their variability and to see how the flux variations are related to other AGN properties. Key findings of this work are summarized below
-
1.
A total of 81 sources (3 FSRQs, 4 BL Lac objects, 24 Seyfert 1 galaxies, 42 Seyfert 2 galaxies and 8 NLSy1 galaxies) over 176 sets of observations are studied for hard X-ray flux variability on hour time scales. We find evidence of X-ray flux variations in about 65% of the sources in our sample.
-
2.
NLSy1 galaxies are found to show the highest DC of variability of about 87% followed by BL Lac objects that show a DC of 82%. Both Seyfert 1 and 2 galaxies show similar DC of about 56%. The lowest DC of variations of about 23% is shown by FSRQs.
-
3.
In the 3 79 keV band, BL Lacs have a weighted mean of 0.310 0.138, while FSRQs have a weighted mean of 0.078 0.028. In the radio-quiet category, Seyfert 2 galaxies have a higher weighted mean of 0.149 0.108 relative to Seyfert 1 galaxies that have a weighted mean of 0.092 0.061. Both U and KS test reject the null hypothesis of differences in variability between FSRQs and BL Lac as well as Sy1 and Sy2 galaxies. In the soft X-ray band, radio-quiet NLSy1 galaxies are more variable than their broad line counterparts. Although, the BL Lacs and FSRQs examined here are more variable than the NLSy1 galaxies in the hard band, statistically in the soft bands their variations are indistinguishable.
-
4.
Majority of the sources do not show any correlation between HR and count rate in the 379 keV energy range suggesting no spectral variability. However, a small fraction of sources show significant correlation between HR and count rate in the 379 keV energy range. The BL Lac object Mrk 421 showed a hardening when brightening trend and the FSRQ 3C 273 showed both hardening and softening when brightening behaviour. Among the three epochs of observations, for which 3C 273 has shown variability, in two epochs a hardening when brightening trend is observed, while in one epoch a softening when brightening trend is noticed. In the radio-quiet category, two Seyfert galaxies namely, NGC 5548 and NGC 3516 showed a softening when brightening behaviour. This is opposite to that shown by the BL Lac source Mrk 421.
-
5.
Sources hosted by massive BHs are less variable on hour time scale than their less massive counterparts. Also, values show a hint for a negative correlation with luminosity of the sources in the 310 keV band.
-
6.
We are able to estimate flux doubling/halving time scale for a total of 16 sources in our sample, of which 11 sources show flux doubling/halving time less than 10 minutes.
We caution on the small number of BL Lacs, FSRQs and NLSy1 galaxies used in this work. Future observations of a large number of BL Lacs, FSRQs and NLSy1 galaxies are indeed needed to confirm the findings reported here.
Acknowledgments
We thank the anonymous referee for his/her detailed comments that helped to improve the manuscript. The comments by Dr. Markus Bottcher on an initial version of the manuscript is thankfully acknowledged. This research has made use of data from the NuSTAR mission, a project led by the California Institute of Technology, managed by the Jet Propulsion Laboratory and funded by the National Aeronautics and Space Administration. We thank the NuSTAR Operations, Software and Calibration teams for support with the execution and analysis of these observations. This research has made use of the NuSTAR Data Analysis Software (NuSTARDAS) jointly developed by the ASI Science Data Center (ASDC, Italy) and the California Institute of Technology(USA).
Note Added in Proof
We thank Dr. Madsen of the NuSTAR operations team for bringing to our attention improved background filtering for South Atlantic Anomaly (SAA) passage made available since the work in this paper as well as the ways to identify flares due to SAA from inspection of the background light curves. All data have now been checked for the existence of such events in our analysis and the updated results are given in this version of the manuscript.
References
- Abdo et al. (2009) Abdo A. A., et al., 2009, ApJ, 707, L142
- Abdo et al. (2010) Abdo A. A., et al., 2010, ApJ, 716, 30
- Abeysekara et al. (2017) Abeysekara A. U., et al., 2017, ApJ 834, 2
- Aharonian et al. (2007) Aharonian F., et al., 2007, ApJ, 664, L71
- Aleksić et al. (2015) Aleksić J., et al., 2015, A&A, 578, A22
- Antonucci (1993) Antonucci R., 1993, ARA&A, 31, 473
- Baldi et al. (2016) Baldi R. D., Capetti A., Robinson A., Laor A., Behar E., 2016, MNRAS, 458, L69
- Baloković et al. (2016) Baloković M., et al., 2016, ApJ, 819, 156
- Barthelmy et al. (2005) Barthelmy S. D., et al., 2005, Space Sci. Rev., 120, 143
- Beckmann & Shrader (2012) Beckmann V., Shrader C. R., 2012, Active Galactic Nuclei
- Beckmann et al. (2007) Beckmann V., Barthelmy S. D., Courvoisier T. J.-L., Gehrels N., Soldi S., Tueller J., Wendt G., 2007, A&A, 475, 827
- Bentz & Katz (2015) Bentz M. C., Katz S., 2015, PASP, 127, 67
- Błażejowski et al. (2000) Błażejowski M., Sikora M., Moderski R., Madejski G. M., 2000, ApJ, 545, 107
- Boettcher et al. (1997) Boettcher M., Mause H., Schlickeiser R., 1997, A&A, 324, 395
- Boller et al. (1996) Boller T., Brandt W. N., Fink H., 1996, A&A, 305, 53
- Brinkmann et al. (2003) Brinkmann W., Papadakis I. E., den Herder J. W. A., Haberl F., 2003, A&A, 402, 929
- Caballero-Garcia et al. (2012) Caballero-Garcia M. D., Papadakis I. E., Nicastro F., Ajello M., 2012, A&A, 537, A87
- Cirasuolo et al. (2003) Cirasuolo M., Celotti A., Magliocchetti M., Danese L., 2003, MNRAS, 346, 447
- Condon et al. (1998) Condon J. J., Cotton W. D., Greisen E. W., Yin Q. F., Perley R. A., Taylor G. B., Broderick J. J., 1998, AJ, 115, 1693
- Connolly et al. (2016) Connolly S. D., McHardy I. M., Skipper C. J., Emmanoulopoulos D., 2016, MNRAS, 459, 3963
- Dermer & Schlickeiser (1993) Dermer C. D., Schlickeiser R., 1993, ApJ, 416, 458
- Edelson et al. (2002) Edelson R., Turner T. J., Pounds K., Vaughan S., Markowitz A., Marshall H., Dobbie P., Warwick R., 2002, ApJ, 568, 610
- Falcone et al. (2004) Falcone A. D., Cui W., Finley J. P., 2004, ApJ, 601, 165
- Fiore et al. (1998) Fiore F., Laor A., Elvis M., Nicastro F., Giallongo E., 1998, ApJ, 503, 607
- Foschini et al. (2011) Foschini L., Ghisellini G., Tavecchio F., Bonnoli G., Stamerra A., 2011, A&A, 530, A77
- Fossati et al. (2008) Fossati G., et al., 2008, ApJ, 677, 906
- Gaidos et al. (1996) Gaidos J. A., et al., 1996, Nature, 383, 319
- Gehrels et al. (2004) Gehrels N., et al., 2004, ApJ, 611, 1005
- Ghisellini & Madau (1996) Ghisellini G., Madau P., 1996, MNRAS, 280, 67
- Ghisellini et al. (1994) Ghisellini G., Haardt F., Matt G., 1994, MNRAS, 267, 743
- Giommi et al. (1990) Giommi P., Barr P., Pollock A. M. T., Garilli B., Maccagni D., 1990, ApJ, 356, 432
- Gliozzi et al. (2002) Gliozzi M., Brinkmann W., Räth C., Papadakis I. E., Negoro H., Scheingraber H., 2002, A&A, 391, 875
- Gliozzi et al. (2007) Gliozzi M., Papadakis I. E., Brinkmann W. P., 2007, ApJ, 656, 691
- Gliozzi et al. (2008) Gliozzi M., Papadakis I. E., Sambruna R. M., 2008, ApJ, 678, 78
- Gupta et al. (2016) Gupta A. C., Kalita N., Gaur H., Duorah K., 2016, MNRAS, 462, 1508
- Haardt & Maraschi (1993) Haardt F., Maraschi L., 1993, ApJ, 413, 507
- Haardt et al. (1997) Haardt F., Maraschi L., Ghisellini G., 1997, ApJ, 476, 620
- Harrison et al. (2013) Harrison F. A., et al., 2013, ApJ, 770, 103
- Heidt (1996) Heidt J., 1996, in Miller H. R., Webb J. R., Noble J. C., eds, Astronomical Society of the Pacific Conference Series Vol. 110, Blazar Continuum Variability. p. 64
- Ivezić et al. (2002) Ivezić Ž., et al., 2002, AJ, 124, 2364
- Kataoka & Stawarz (2016) Kataoka J., Stawarz Ł., 2016, ApJ, 827, 55
- Kelly et al. (2009) Kelly B. C., Bechtold J., Siemiginowska A., 2009, ApJ, 698, 895
- Konigl (1981) Konigl A., 1981, ApJ, 243, 700
- Leighly (1999) Leighly K. M., 1999, ApJS, 125, 317
- MacLeod et al. (2010) MacLeod C. L., et al., 2010, ApJ, 721, 1014
- Malizia et al. (2000) Malizia A., et al., 2000, MNRAS, 312, 123
- Maraschi et al. (1999) Maraschi L., et al., 1999, ApJ, 526, L81
- Markowitz et al. (2003) Markowitz A., Edelson R., Vaughan S., 2003, ApJ, 598, 935
- McHardy (2010) McHardy I., 2010, in Belloni T., ed., Lecture Notes in Physics, Berlin Springer Verlag Vol. 794, Lecture Notes in Physics, Berlin Springer Verlag. p. 203 (arXiv:0909.2579), doi:10.1007/978-3-540-76937-8_8
- McHardy et al. (2006) McHardy I., Uttley P., Taylor R., Papadakis I., 2006, in Gaskell C. M., McHardy I. M., Peterson B. M., Sergeev S. G., eds, Astronomical Society of the Pacific Conference Series Vol. 360, Astronomical Society of the Pacific Conference Series. p. 85
- Nandra et al. (1997) Nandra K., George I. M., Mushotzky R. F., Turner T. J., Yaqoob T., 1997, ApJ, 476, 70
- O’Neill et al. (2005) O’Neill P. M., Nandra K., Papadakis I. E., Turner T. J., 2005, MNRAS, 358, 1405
- Osterbrock & Pogge (1985) Osterbrock D. E., Pogge R. W., 1985, ApJ, 297, 166
- Padovani & Giommi (1995) Padovani P., Giommi P., 1995, ApJ, 444, 567
- Paliya et al. (2015) Paliya V. S., Böttcher M., Diltz C., Stalin C. S., Sahayanathan S., Ravikumar C. D., 2015, ApJ, 811, 143
- Pancoast et al. (2014) Pancoast A., Brewer B. J., Treu T., 2014, MNRAS, 445, 3055
- Papadakis & McHardy (1995) Papadakis I. E., McHardy I. M., 1995, MNRAS, 273, 923
- Peterson et al. (2000) Peterson B. M., et al., 2000, ApJ, 542, 161
- Petrucci et al. (2000) Petrucci P. O., et al., 2000, ApJ, 540, 131
- Petrucci et al. (2013) Petrucci P.-O., et al., 2013, A&A, 549, A73
- Pian et al. (1998) Pian E., et al., 1998, ApJ, 492, L17
- Ponti et al. (2012) Ponti G., Papadakis I., Bianchi S., Guainazzi M., Matt G., Uttley P., Bonilla N. F., 2012, A&A, 542, A83
- Pounds et al. (1995) Pounds K. A., Done C., Osborne J. P., 1995, MNRAS, 277, L5
- Press et al. (1992) Press W. H., Teukolsky S. A., Vetterling W. T., Flannery B. P., 1992, Numerical recipes in C. The art of scientific computing
- Pryal et al. (2015) Pryal M., Falcone A., Stroh M., 2015, ApJ, 802, 33
- Ravasio et al. (2003) Ravasio M., Tagliaferri G., Ghisellini G., Tavecchio F., Böttcher M., Sikora M., 2003, A&A, 408, 479
- Ravasio et al. (2004) Ravasio M., Tagliaferri G., Ghisellini G., Tavecchio F., 2004, A&A, 424, 841
- Rees (1984) Rees M. J., 1984, ARA&A, 22, 471
- Reis et al. (2012) Reis R. C., et al., 2012, ApJ, 745, 93
- Romero et al. (1999) Romero G. E., Cellone S. A., Combi J. A., 1999, A&AS, 135, 477
- Sembay et al. (1993) Sembay S., Warwick R. S., Urry C. M., Sokoloski J., George I. M., Makino F., Ohashi T., Tashiro M., 1993, ApJ, 404, 112
- Sikora et al. (1994) Sikora M., Begelman M. C., Rees M. J., 1994, ApJ, 421, 153
- Sobolewska & Papadakis (2009) Sobolewska M. A., Papadakis I. E., 2009, MNRAS, 399, 1597
- Soldi et al. (2008) Soldi S., et al., 2008, A&A, 486, 411
- Soldi et al. (2014) Soldi S., et al., 2014, A&A, 563, A57
- Tagliaferri et al. (2000) Tagliaferri G., et al., 2000, A&A, 354, 431
- Takahashi et al. (1996) Takahashi T., et al., 1996, ApJ, 470, L89
- Tanihata et al. (2000) Tanihata C., et al., 2000, ApJ, 543, 124
- Tanihata et al. (2003) Tanihata C., Takahashi T., Kataoka J., Madejski G. M., 2003, ApJ, 584, 153
- Turner & Miller (2009) Turner T. J., Miller L., 2009, A&ARv, 17, 47
- Turner et al. (1999) Turner T. J., George I. M., Nandra K., Turcan D., 1999, ApJ, 524, 667
- Ulrich et al. (1997) Ulrich M.-H., Maraschi L., Urry C. M., 1997, ARA&A, 35, 445
- Urry & Padovani (1995) Urry C. M., Padovani P., 1995, PASP, 107, 803
- Uttley et al. (2002) Uttley P., McHardy I. M., Papadakis I. E., 2002, MNRAS, 332, 231
- Vaughan et al. (2003) Vaughan S., Edelson R., Warwick R. S., Uttley P., 2003, MNRAS, 345, 1271
- Véron-Cetty & Véron (2010) Véron-Cetty M.-P., Véron P., 2010, A&A, 518, A10
- Wagner & Witzel (1995) Wagner S. J., Witzel A., 1995, ARA&A, 33, 163
- Wierzcholska & Wagner (2016) Wierzcholska A., Wagner S. J., 2016, MNRAS, 458, 56
- Zhang et al. (2002) Zhang Y. H., et al., 2002, ApJ, 572, 762
- Zhang et al. (2005) Zhang Y. H., Treves A., Celotti A., Qin Y. P., Bai J. M., 2005, ApJ, 629, 686
- Zhang et al. (2006) Zhang Y. H., Treves A., Maraschi L., Bai J. M., Liu F. K., 2006, ApJ, 637, 699
- Zu et al. (2011) Zu Y., Kochanek C. S., Peterson B. M., 2011, ApJ, 735, 80
- Zu et al. (2013) Zu Y., Kochanek C. S., Kozłowski S., Udalski A., 2013, ApJ, 765, 106