3D radiation non-ideal magnetohydrodynamical simulations of the inner rim in protoplanetary disks.
Abstract
Many planets orbit within an AU of their stars, raising questions about their origins. Particularly puzzling are the planets found near the silicate sublimation front. We investigate conditions near the front in the protostellar disk around a young intermediate-mass star, using the first global 3-D radiation non-ideal MHD simulations in this context. We treat the starlight heating; the silicate grains’ sublimation and deposition at the local, time-varying temperature and density; temperature-dependent Ohmic dissipation; and various initial magnetic fields.
The results show magnetorotational turbulence around the sublimation front at 0.5 AU. The disk interior to 0.8 AU is turbulent, with velocities exceeding 10% of the sound speed. Beyond 0.8 AU is the dead zone, cooler than 1000 K and with turbulence orders of magnitude weaker. A local pressure maximum just inside the dead zone concentrates solid particles, favoring their growth. Over many orbits, a vortex develops at the dead zone’s inner edge, increasing the disk’s thickness locally by around 10%.
We synthetically observe the results using Monte Carlo transfer calculations, finding the sublimation front is near-infrared bright. The models with net vertical magnetic fields develop extended, magnetically-supported atmospheres that reprocess extra starlight, raising the near-infrared flux 20%. The vortex throws a non-axisymmetric shadow on the outer disk. At wavelengths m, the flux varies several percent on monthly timescales. The variations are more regular when the vortex is present. The vortex is directly visible as an arc at ultraviolet through near-infrared wavelengths, given sub-AU spatial resolution.
Subject headings:
protoplanetary disks, accretion disks, magnetohydrodynamics (MHD), radiation transfer1. Introduction and motivation
Our grasp of planetary systems’ origins relies on our understanding of the disks of gas and dust found orbiting young stars. Here we focus on the environment for planet formation in the disks’ hot central region where temperatures exceed 1000 K. Among the main processes governing the temperatures in this region are the sublimation and deposition of silicate grains, which change the opacity by orders of magnitude (Pollack et al., 1994). Since the starlight is a major source of heating, the opacity has a major impact on temperatures.
A key process governing the turbulent stirring of the planet-forming materials is magneto-rotational instability (Balbus & Hawley, 1991). Magnetic fields are coupled to the plasma, and the instability converts gravitational potential energy into the kinetic and magnetic energy of turbulence (Jin, 1996; Gammie, 1996; Miller & Stone, 2000; Hirose & Turner, 2011), when temperatures are high enough for thermal ionization (Umebayashi & Nakano, 1988; Desch & Turner, 2015). The decline in temperature with distance from the star thus leads to a decline in the magnetic stresses across the thermal ionization threshold. This means the surface density increases across the threshold if the inflow is in steady-state, so that the mass flow rate is independent of distance. The resulting local pressure maximum can concentrate solid particles in the size range where their stopping time due to gas drag is comparable to the orbital period (Haghighipour & Boss, 2003; Lyra et al., 2008; Kretke et al., 2009; Dzyurkevich et al., 2010; Lyra & Mac Low, 2012; Faure et al., 2014a), possibly allowing for in situ planet formation (Chatterjee & Tan, 2014).
In addition, the pressure maximum can act as a planet trap: young planets’ inward migration under their tidal interaction with the disk comes to a halt near the pressure peak (Masset et al., 2006; Matsumura et al., 2009; Kretke & Lin, 2012; Bitsch et al., 2014; Hu et al., 2015). Concentrating both pebbles and protoplanets in a region where dynamical timescales are short has the potential to lead quickly to the growth of planets.
Of all young stars, perhaps the best suited for measuring the disks’ hot central regions are the Herbig stars, which have masses a few times the Sun’s. Nearby examples are bright enough to be observed with near-infrared interferometry down to the angular scale of the disk’s inner rim (Dullemond & Monnier, 2010; Kraus, 2015) yielding maps of the silicate sublimation front (Benisty et al., 2011). However these objects’ spectra show puzzlingly large near-infrared fluxes (Hillenbrand et al., 1992; Chiang et al., 2001; Millan-Gabet et al., 2001; Meeus et al., 2001; Vinković et al., 2006). Radiation hydrostatic (Mulders & Dominik, 2012) and radiation hydrodynamic models (Flock et al., 2016) produce too little flux at wavelengths 2-4 m by factors up to several. Ingredients modelers must consider include the transfer of the starlight into the disk, and the escape of the re-radiated infrared emission; the sublimation and deposition of the dust grains that provide most of the opacity; and the forces supporting the disk material against the star’s gravity (Kama et al., 2009). Models can yield near-infrared excesses closer to the observed range if some disk material near the sublimation front is either launched into a wind (Bans & Königl, 2012) or supported on the magnetic fields escaping from MRI turbulence within the disk (Turner et al., 2014a). In both pictures, the magnetic forces lift some material above its hydrostatic position, increasing the height where the starlight is absorbed, so that a bigger fraction of the stellar luminosity is reprocessed into thermal emission at distances where the emission comes out at near-infrared wavelengths. Until now, there was no global modeling of magneto-rotational turbulence at the inner rim, treating the dust sublimation and radiation transfer together with the MHD.
In this work we present the first 3-D radiation non-ideal MHD simulations of protostellar disks to include starlight heating, silicate grains’ sublimation and deposition at the local temperature and density, and Ohmic dissipation depending on the thermal ionization. We test the results against various observational constraints, comparing the spectral energy distributions, images, and lightcurves at different wavelengths. The models let us address several important questions: How does the MHD turbulence affect the sublimation front? What are the consequences for the starlight-absorbing surface, the system’s near-infrared emission, and its time variability? And what controls the dynamics at the location where the solids are concentrated?
We describe in section 2 the radiation MHD methods and the treatment of the dust sublimation and deposition. Section 3 deals with the results of the calculations, and section 4 with the comparison against observations. We discuss the implications in section 5, and summarize our conclusions in section 6.
2. Methods and setup
In this section we briefly summarize the method and the setup of the 3D radiation non-ideal MHD simulations. The relevant equations are given in Section 2.1. The resistivity module which determines the magnetic field coupling parameter is presented in Section 2.2. The initial and boundary conditions are presented in Sections 2.3 and 2.4. For full details off the radiation transfer and the dust evaporation modules, we refer the reader to our previous works (Flock et al., 2013, 2016).
2.1. Radiation non-ideal MHD equations
In this paper, we solve the following radiation non-ideal MHD equations in a spherical coordinate system :
| (1) | |||||
| (2) | |||||
| (3) | |||||
| (4) | |||||
| (5) |
where is the density, is the velocity and is the magnetic field111The magnetic field already includes the normalization factor .. is the current density and is the tensor magnetic resistivity. The total pressure is given by where the gas pressure relates to the temperature through
| (6) |
where is the mean molecular weight, is the Boltzmann constant and is the atomic mass unit. stands for the temperatures of the gas and dust which are assumed equal thanks to collisional exchange of thermal energy at these high gas densities.
Introducing the gravitational constant , the gravitational potential is calculated according to
| (7) |
where is the stellar mass. denotes the total energy and is given by the relation where is the gas internal energy, being the adiabatic index. The radiation energy is denoted while stands for the frequency-integrated irradiation flux. is calculated as
| (8) |
with the Stefan-Boltzmann constant , the stellar surface temperature and the radius of the star. The radial optical depth of the irradiation flux is calculated using the opacity at the stellar temperature , see also Section 2.1 in Flock et al. (2016). and are the Rosseland and Planck mean opacity, respectively. Both opacities include gas and dust contributions. The dust opacity is set to which represents the opacity at the dust sublimation temperature per gram of dust. The gas opacity is set constant to which represents the opacity per gram of gas. For more details on the opacities we refer to our previous work (Flock et al., 2016). Finally, is the radiation constant and stands for the speed of light.
The gas is a mixture of hydrogen and helium with solar abundance (Decampli et al., 1978) so that and . For the typical density and temperature we considered, most of the hydrogen is bound in molecular hydrogen222We have checked that for g.cm-3 and over 50 % of the hydrogen is bound in H2.. Silicates dust grains are present when the temperature is smaller than a critical temperature noted and sublimates otherwise. As in our previous paper (Flock et al., 2016), we follow Pollack et al. (1994) and Isella & Natta (2005) and determine according to
| (9) |
is then used to calculate the local dust density , assuming perfect mixing of dust and gas (see Eq.(10) in Flock et al., 2016).
2.2. Resistivity
We implemented a simple treatment of the resistivity in order to model the ionization transition at 1000 K (Umebayashi & Nakano, 1988; Desch & Turner, 2015). To do so, we set
| (10) |
where the magnetic Reynolds number dependence on the temperature is given by
| (11) |
The asymptotic value of the magnetic Reynolds number is used for temperatures above 1000 K. This upper limit is high enough to obtain sustained MRI turbulence closely resembling the ideal-MHD limit (Flock et al., 2012b). For temperatures below 1000 K the Reynolds number decreases and we set the lower limit of the magnetic Reynolds number to . Such a value is low enough to ensure the damping of the MRI inside the dead-zone (Elsasser number ).
2.3. Initial conditions
In order to initialize the simulations presented here, we used the final snapshot of the axisymmetric radiation viscous 2.5D3332.5D represents the use of 2 dimensions (,) and 3 components (,.) for the velocity and magnetic field vectors. hydrodynamical simulation RMHD_1e-8 of Flock et al. (2016), for which the flow has reached a steady-state characterized by a uniform accretion rate of solar mass per year. We refer the reader to Flock et al. (2016) for more details on that particular simulation, and only show here the resulting 2D distribution of , and in the disk meridional plane (Fig.1). These 2D fields are extended in the azimuthal direction to cover the range radian and radian for the models RMHD_P0_4 and RMHD_P1_6, respectively.
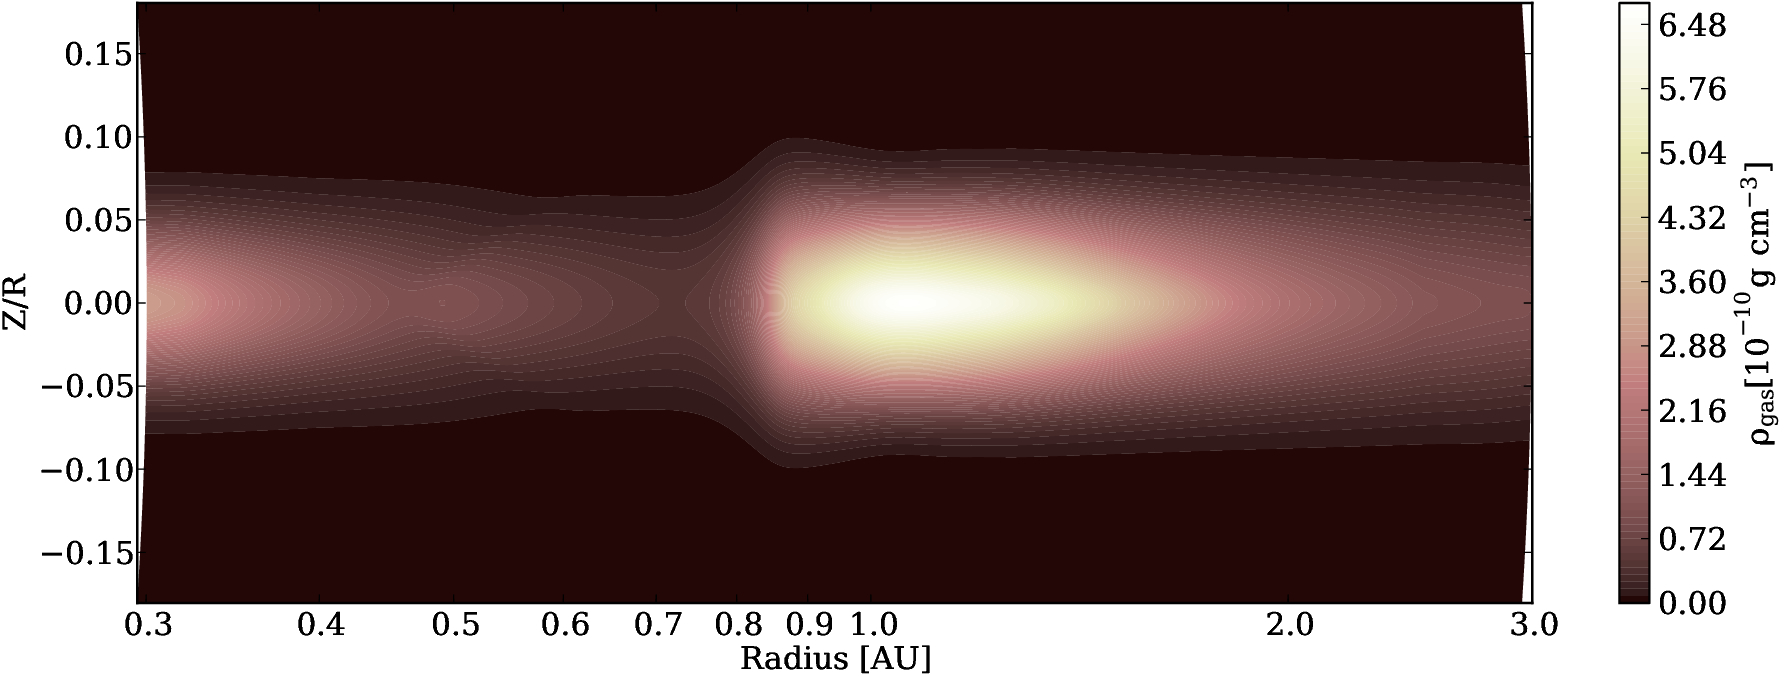
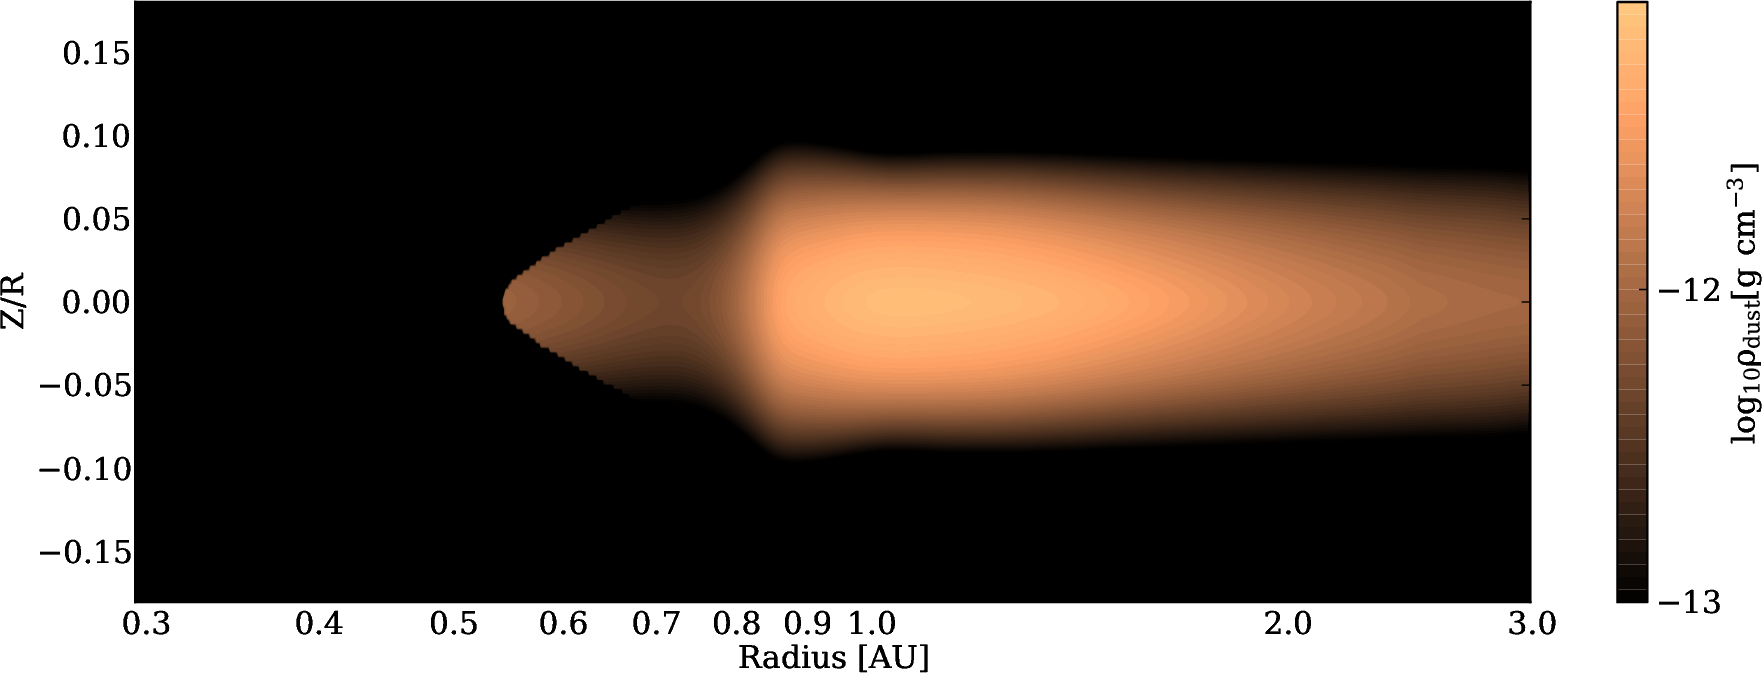
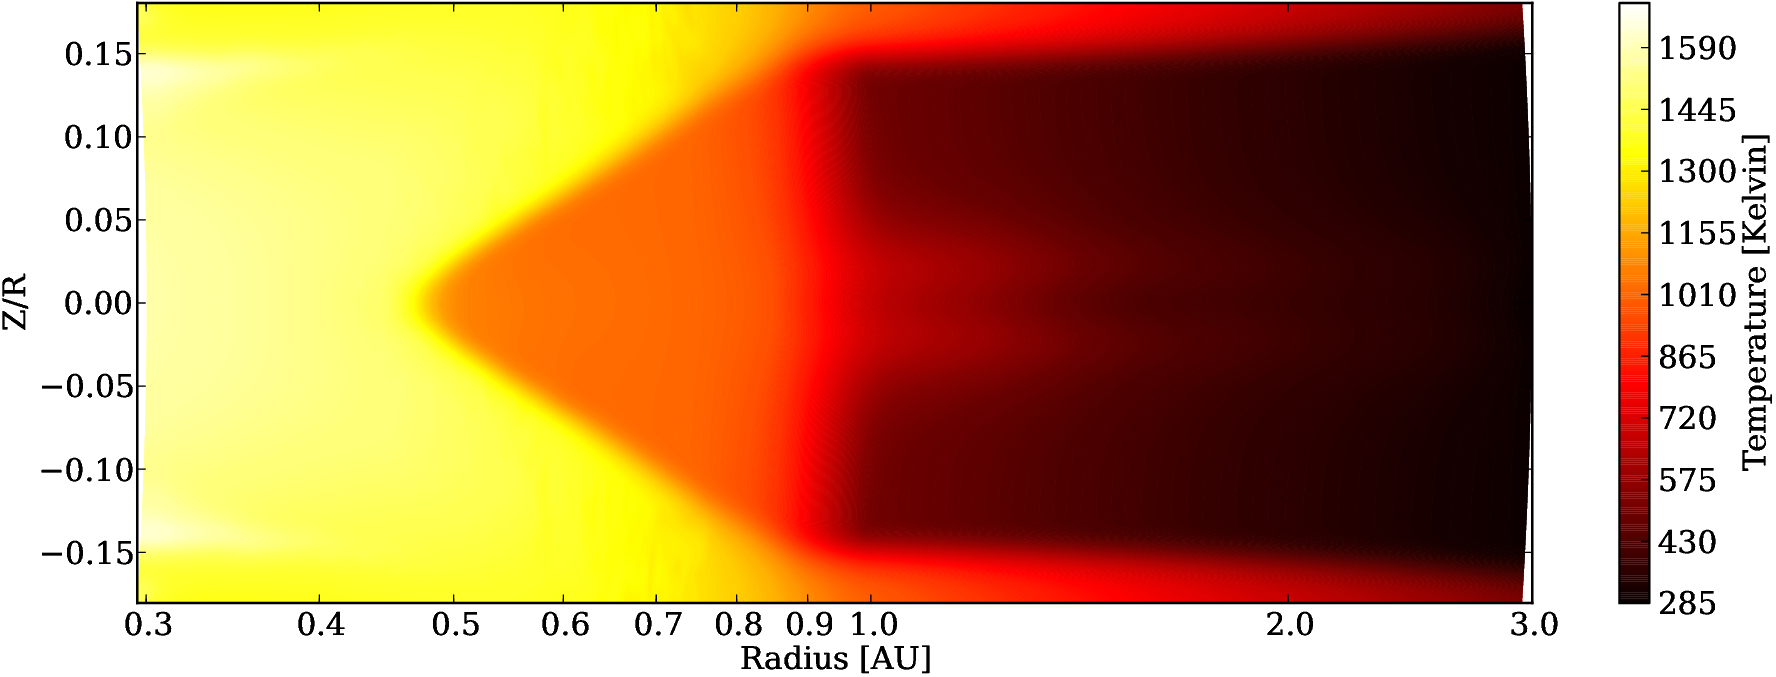
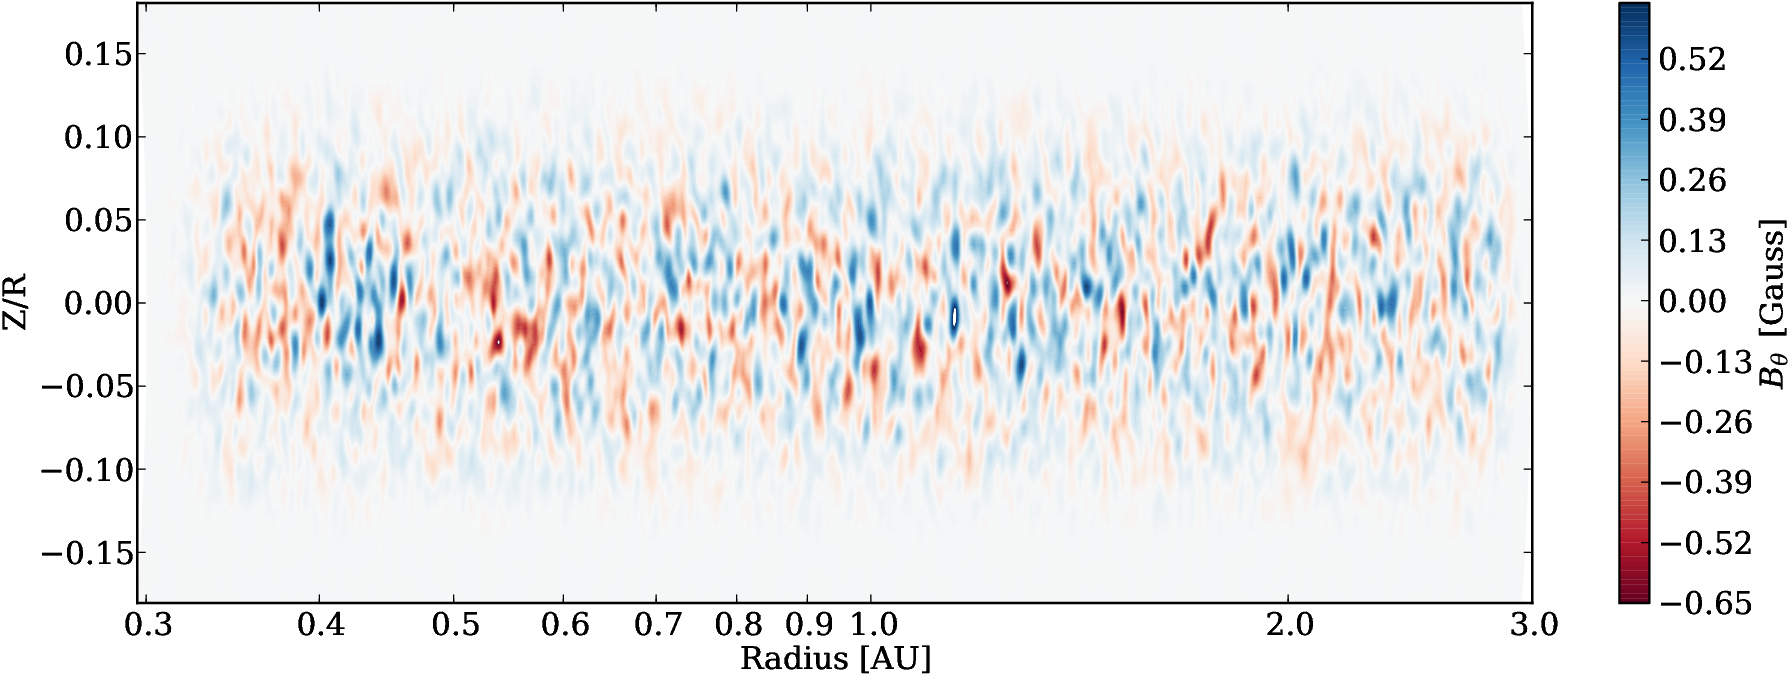
To trigger the MRI, we investigate two different configurations for the magnetic field geometry at the beginning of the simulations. First, a random zero-net flux magnetic field is used for the models RMHD_P0_4 and RMHD_P1_6. A snapshot of the initial magnetic field is shown in Fig. 1 (bottom panel). For model RMHD_P0_4_BZ, we also added a vertical net flux magnetic field. In Appendix B, we detail the procedure we used to generate the magnetic vector potential in both cases. The naming convention of the radiation MHD (RMHD) models includes the size of the azimuthal domain given in radians (e.g. P0_4 for ) and if a vertical magnetic field is included, BZ. The model parameters are summarized in Table 1.
| Stellar parameter | , , |
|---|---|
| Opacity | |
| Dust to gas mass ratio | |
| Cell aspect ratio | |
| 0.3-3AU : | |
| 896 x128 | |
| RMHD_P0_4 | , , runtime 300 orbits |
| RMHD_P1_6 | , , runtime 150 orbits |
| RMHD_P0_4_BZ | , , runtime 70 orbits |
2.4. Boundary conditions and buffer zones
In the radial direction we use zero gradient conditions for all variables while is set to enforce vanishing mass inflow. In the meridional direction we extrapolate the logarithmic density and the temperature in the ghost cells. The ghost cells are a set of additional cells at the domain boundary which provide the boundary values for the integration. For the velocity we set a zero mass inflow condition. The azimuthal boundaries are periodic. In addition, we use a buffer zone at the radial inner boundary over the radial range AU to avoid effects arising from the presence of the boundary. In this zone we damp the radial and vertical velocities and increase linearly the magnetic resistivity in order to reach a magnetic Reynolds number of at the location of the inner radial boundary. In addition, we used the same modified gravitational potential inside the buffer zone as used in the 2D radiation hydrodynamical simulations (see Appendix E in Flock et al., 2016). This last modification affects the region with and , and manifests itself as a layer with temperatures slightly larger than expected (see white zone in Fig. 1, third panel). R and Z represent here the cylindrical coordinates. This buffer zone is excluded from the analyses presented below.
2.5. Diagnostics
We determine the strength of the turbulence by calculating the stress to pressure ratio :
| (12) |
which is the sum of the Reynolds stress and Maxwell stress 444We compared the mass weighted integral for the parameter with the classical definition . The radial profiles are almost identical with maximum relative deviations of around 5 % close to the inner rim.. Radial profiles of are obtained by integration along and . 2-D profiles are obtained by integration along .
We note that the time units are inner orbits, which always refer to the orbital time at 0.3 AU.
3. Results
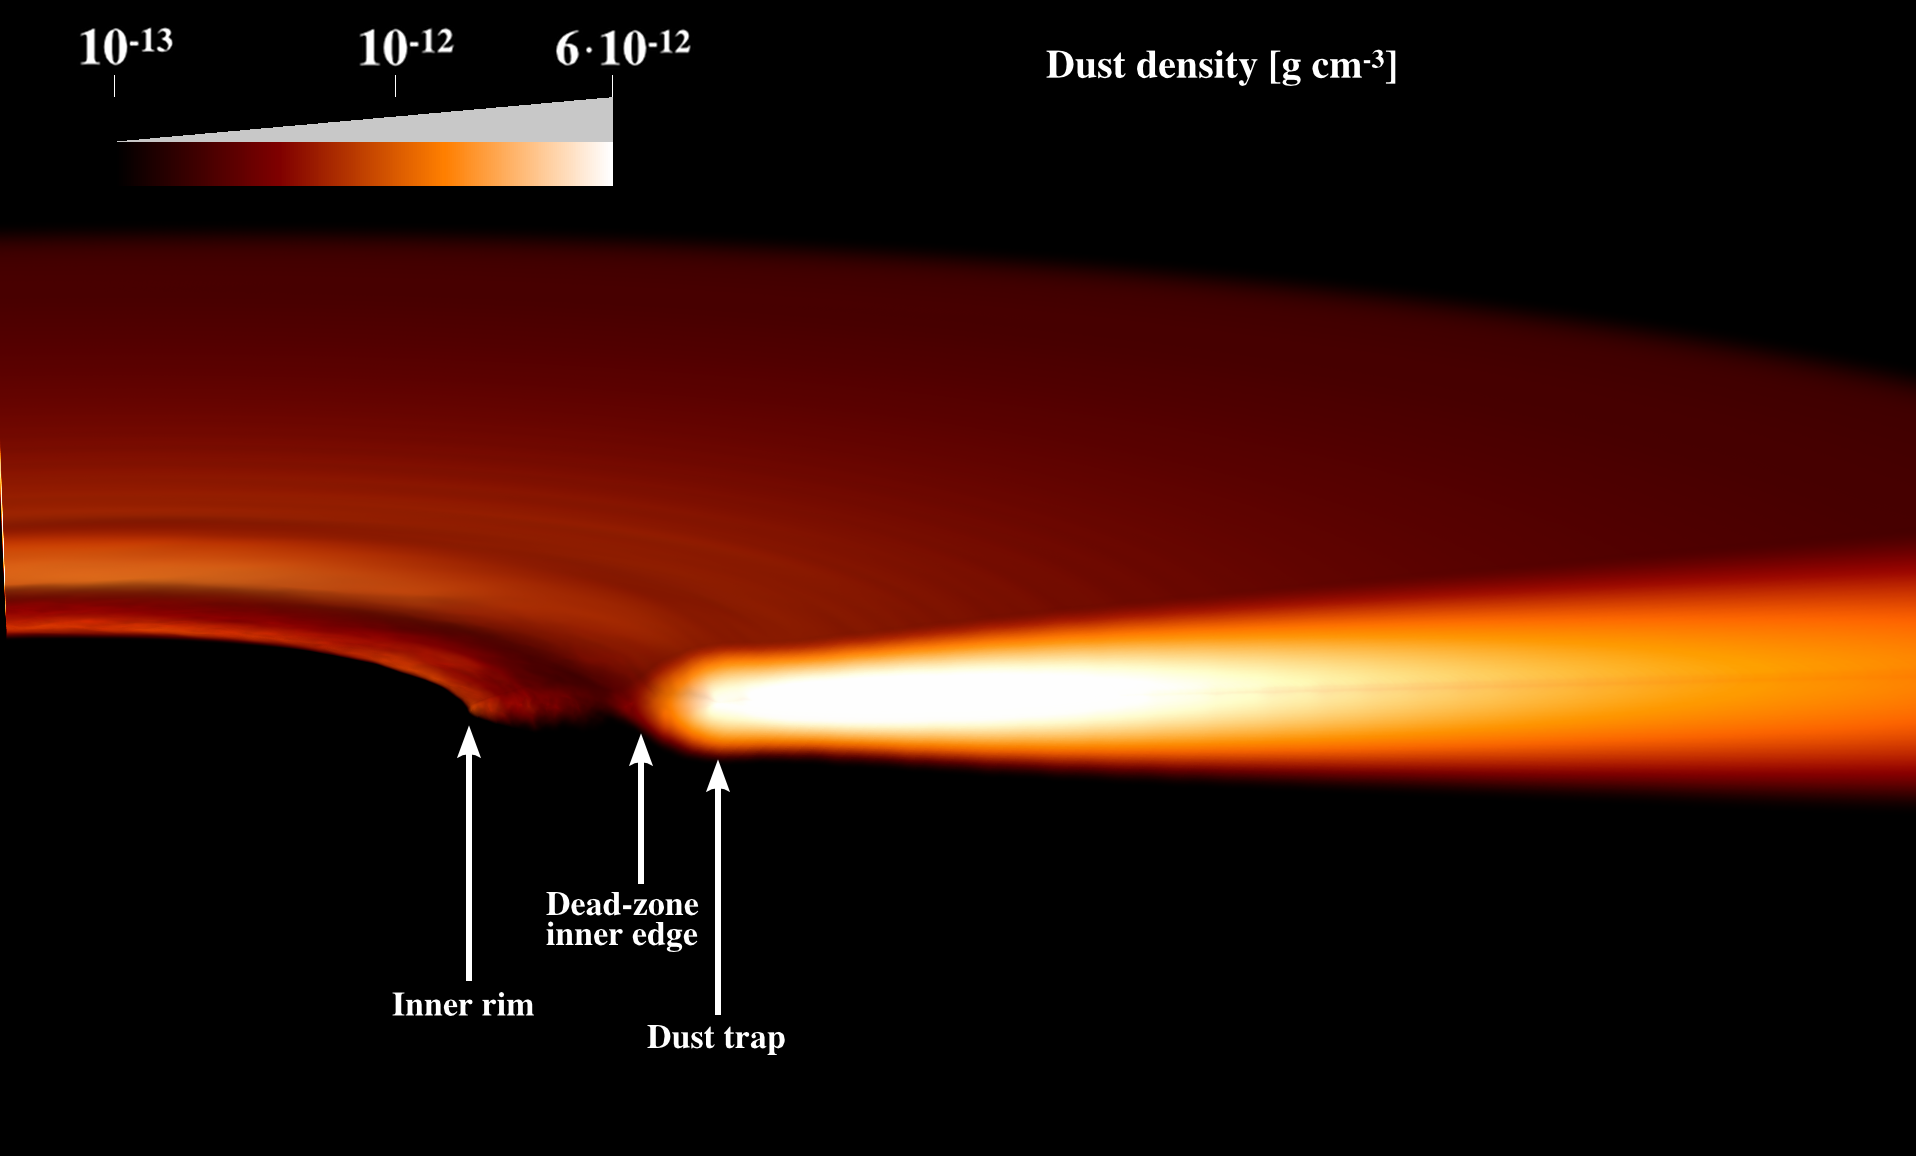
We focus our analysis on the dynamics of three distinct regions of the disk. The first is the inner rim, which we define as the irradiation line. The second is the inner edge of the dead-zone, defined as the region where the Elsasser number ( being the Alfvén velocity) is smaller than unity. MRI turbulence is damped when is less than unity (Sano & Stone, 2002). The third is the dust concentration radius, and is defined as the location when pressure reaches a maximum and where the gas azimuthal velocity is exactly Keplerian. The gas is rotating with super(sub)-Keplerian velocities inward (outward) of that location. We will focus on those three regions in the following analysis and mark their positions in Figs. 2 to 7.
We first investigate the detailed disk dynamics using the results of model RMHD_P0_4 in Sections 3.1 and 3.2. The results of model RMHD_P0_4_BZ are presented in Section 3.3. The question of whether large-scale and long-term non-axisymmetric perturbations arise in the simulations is investigated using model RMHD_P1_6 in Section 3.4.
3.1. Time evolution
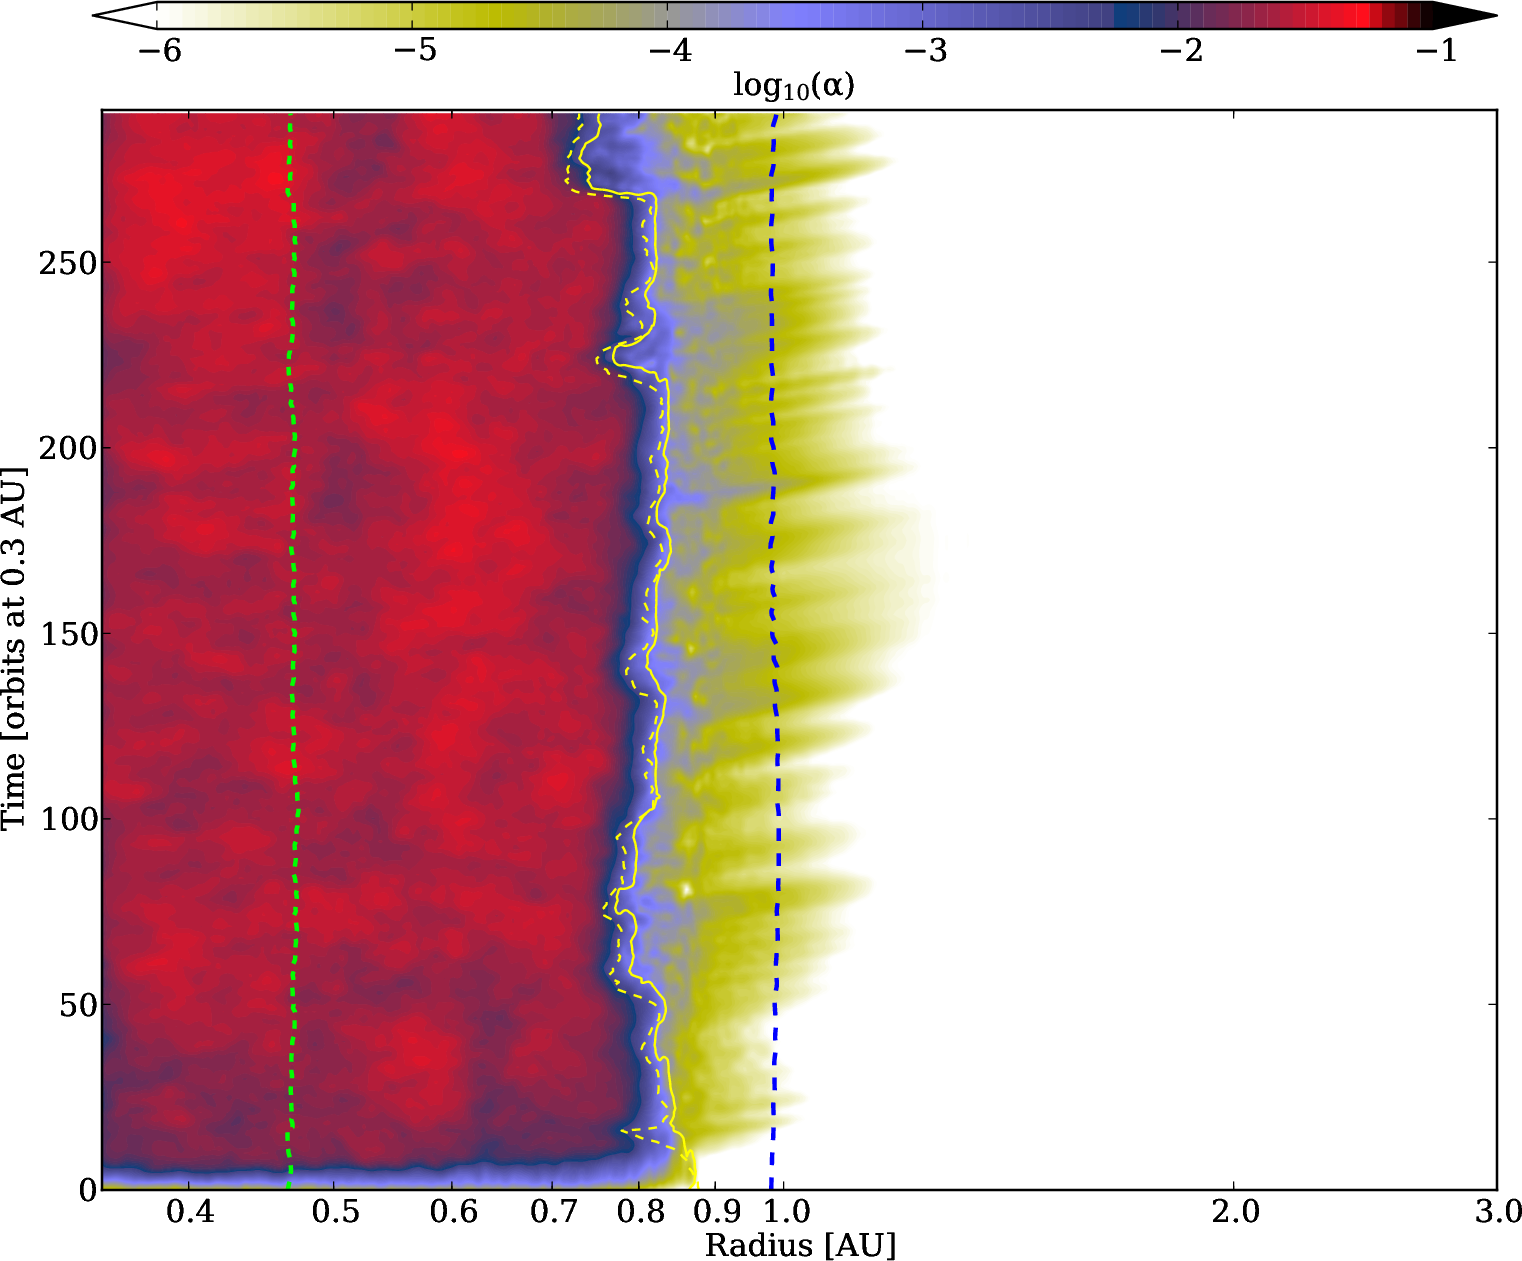
Fig. 2 shows the time variations of for model RMHD_P0_4. The immediate result is that the model quickly reaches a quasi-steady state. As a result of the MRI, the flow is turbulent in the inner disk ( AU) during the entire simulation, with typical values of . Such a rate for the flux of angular momentum is in agreement with previous locally isothermal global ideal MHD simulations (Fromang & Nelson, 2006; Flock et al., 2011; Parkin & Bicknell, 2013) and global radiation ideal MHD simulations (Flock et al., 2013).
The inner rim () in the midplane is located at around AU inside this highly turbulent region (green dashed line). Its position remains almost unaffected by the turbulence because the optical depth to the star is the line integral through a large number of uncorrelated turbulent density fluctuations. The dead-zone inner edge is located at around AU (yellow solid line). At this position, the Elsasser number drops below unity. In our model, the dead-zone inner edge is also close to the temperature contour K (yellow dashed line) and corresponds to the location where the magnetic Reynolds number drops below . At this position, the value of drops by several orders of magnitude. We note that the exact radial position of the dead-zone inner edge shows variations of around 2 to 3 disk scale heights in the radial direction with time (with typical displacement of the order of 0.1 AU). This is due to temperature variations associated with the turbulence. Finally, the dust concentration radius is located inside the dead-zone at around AU (blue dashed line) and displays little sign of radial variations.
We now take a deeper look at the time evolution of the disk structure. Fig. 3 shows the time evolution of the surface density and three selected temperature contours. For the simulation runtime the disk remains stable. Overplotted temperature contours in steps of 400 K show the temperature variations over time at different disk locations. Close to the inner rim, the 1200 K contour show only small radial fluctuations. The 800 K and 400 K contours behind the inner rim move slightly radially inward by around 0.1 AU in the first 40 local orbits due to the extended height of the dust rim by magnetic fields, which causes a steeper temperature drop in the shadow behind the rim.
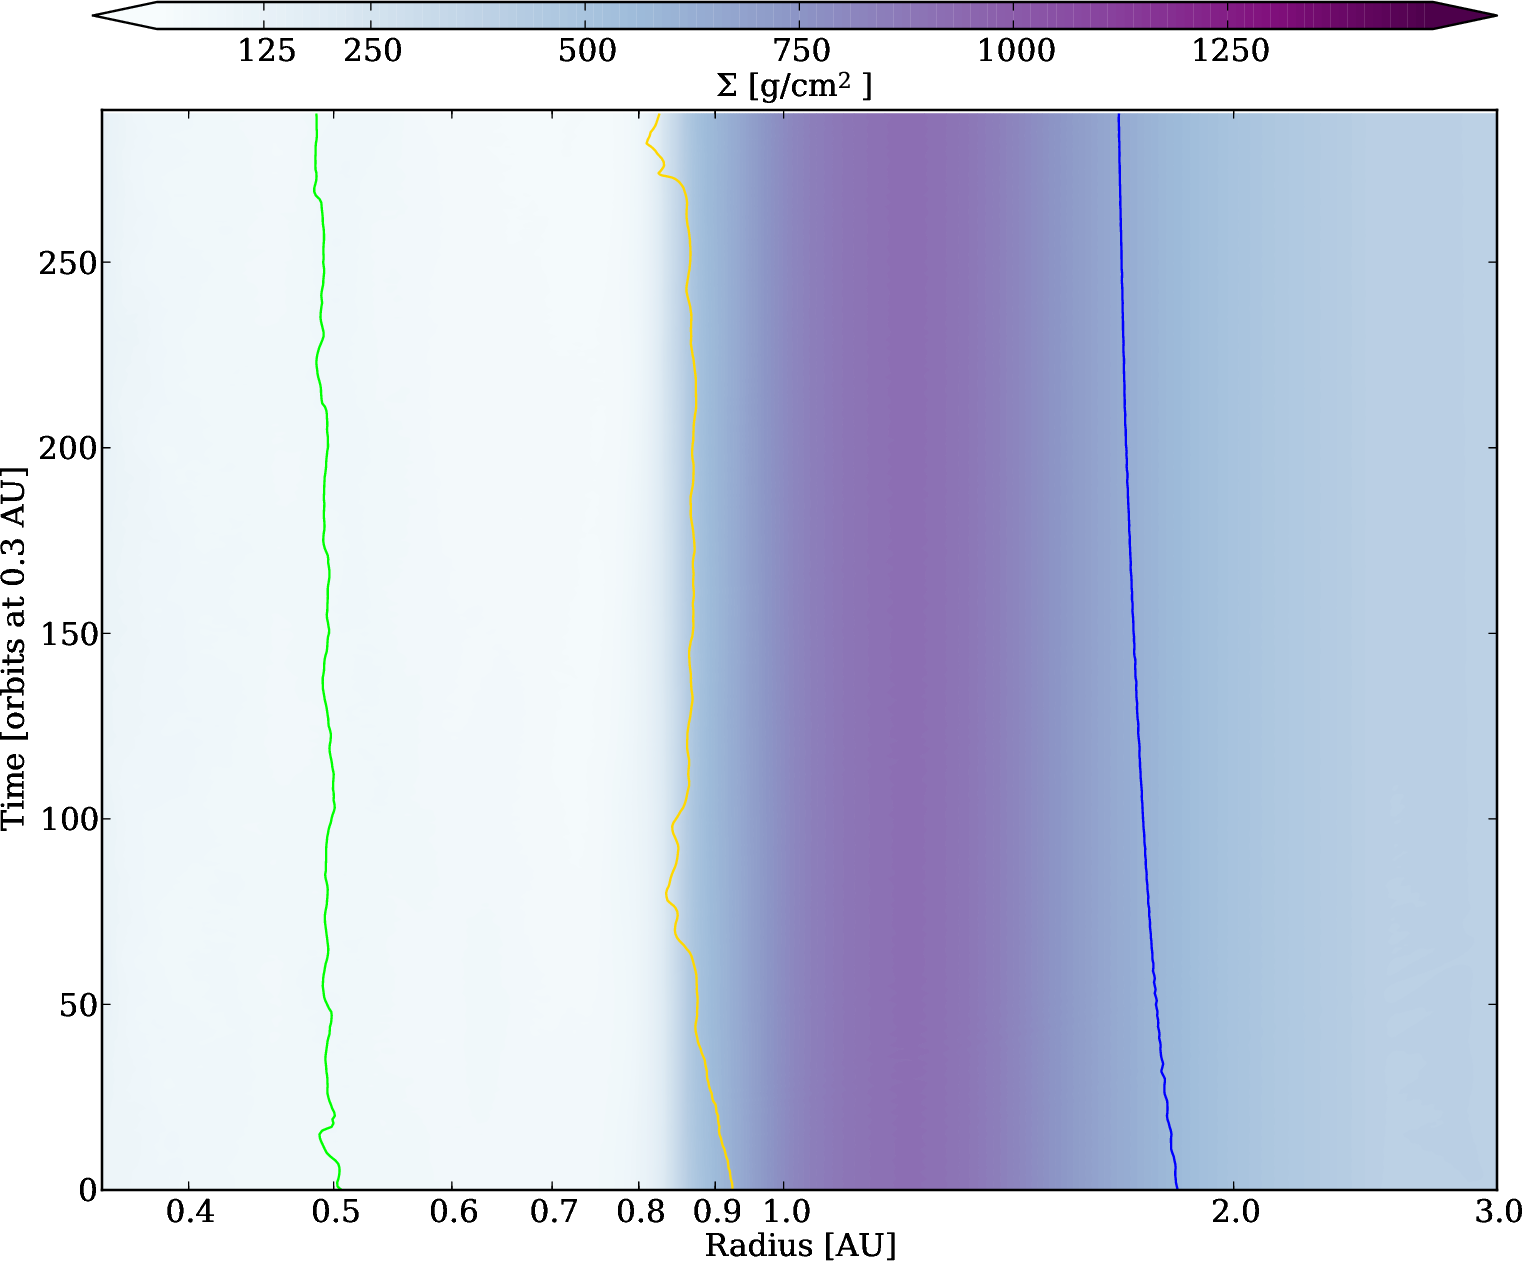
Fig. 4 shows the time averaged radial temperature profile of model RMHD_P0_4 overplotting the standard deviations. The temperature fluctuations remain small. The maximal deviations are around 10-30 K and appear due to variations of the rim surface and so the grazing angle variations of the irradiation.

To summarize, the disk structure for model RMHD_P0_4 remains stable over the simulation time. The model shows a quasi steady-state on dynamical timescales. However we emphasize that this model is not in inflow equilibrium on the longer accretion flow timescale. The initial surface density profile was calculated assuming for temperatures below 1000 K. In our 3D models we find values of which are orders of magnitude smaller. In such a case the surface density should be much higher to balance the drop in accretion stress. In the discussion section we explore this point further.
3.2. Time averaged results: Zero-net flux model
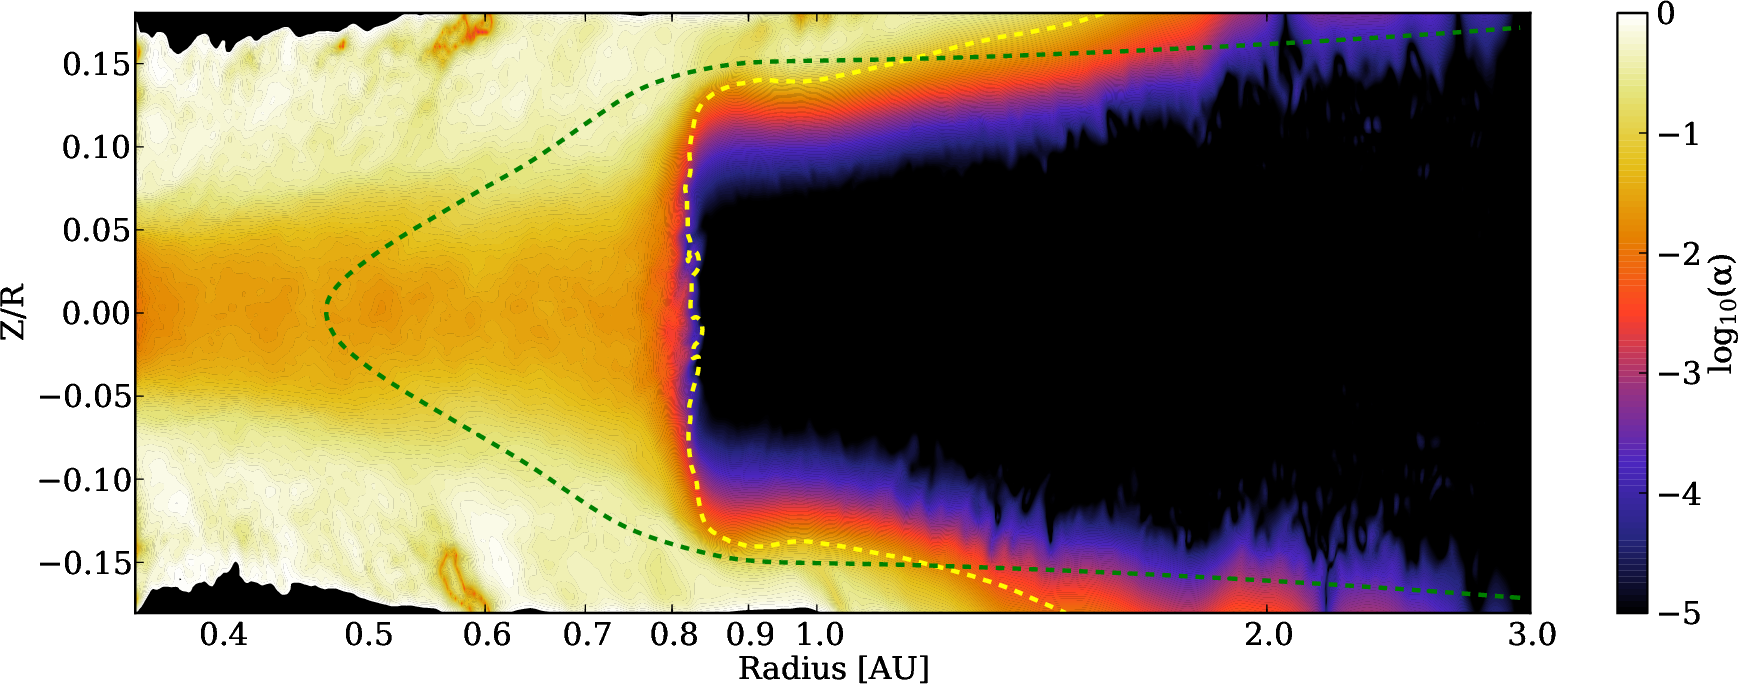
The time averaged meridional distribution of the stress to pressure ratio for model RMHD_P0_4 is plotted in Fig. 5, along with the positions of the inner rim and the dead-zone inner edge (green and yellow dashed lines, respectively). The plot shows that the entire inner rim surface is embedded in the turbulent region of the disk. The dead-zone edge is located at AU. Its shape is roughly vertical around the disk midplane () while in the upper disk layers it curves radially outward, consistent with the fact that the disk surface is radiatively heated by the central star. In agreement with the results described above, turbulent activity quickly drops to a very small value inside the dead-zone.
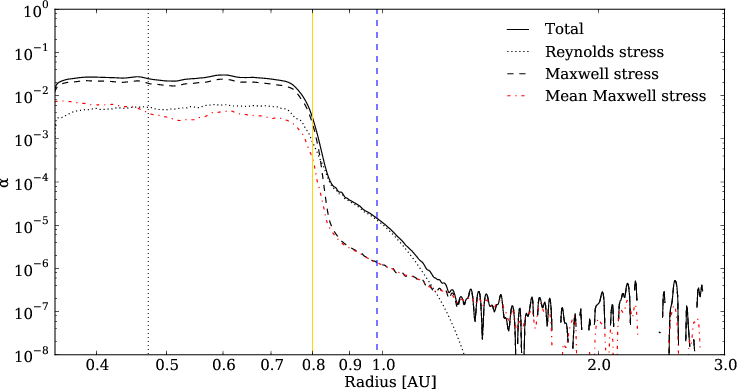
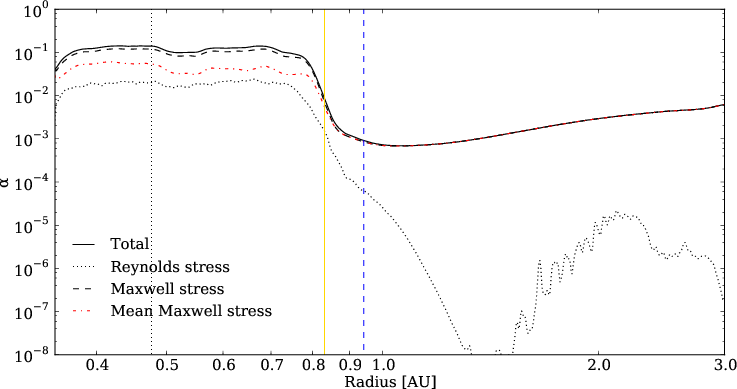
The time averaged and meridionally integrated 1D profile of the stress to pressure ratio is shown in Fig. 6 (top panel). The plot features a plateau with a constant value of over the entire inner disk, without any noticeable change across the dust rim. In agreement with previously published simulations performed in the ideal MHD limit (Brandenburg et al., 1995; Miller & Stone, 2000; Simon et al., 2009; Davis et al., 2010), the Maxwell stress is around 3 times larger than the Reynolds stress. At the dead-zone inner edge, the Maxwell stress drops sharply by roughly four orders of magnitude. By contrast, the Reynolds stress decrease is more shallow, so that it dominates the total stress in a small region between and AU which corresponds to roughly disk scale heights. Over that region, the total stress takes values that range between to times the pressure. The Maxwell stress amounts to about and is governed by mean magnetic fields which diffuse into the dead-zone. The mean Maxwell stress is computed from the volume averaged fields, see red dashed curve on the top panel. The relatively large Reynolds stress is mainly due to density waves which are excited in the inner disk turbulence (Heinemann & Papaloizou, 2009a). Previous global MHD simulations of the inner dead-zone edge have found similar amounts of Reynolds stress close to the dead-zone inner edge (Dzyurkevich et al., 2010; Faure et al., 2014b). These density waves propagate into the dead-zone and are quickly damped after around 10 scale heights. In Appendix C we review and discuss in more detail the damping mechanism. Finally, outside of AU, drops further to values of about .
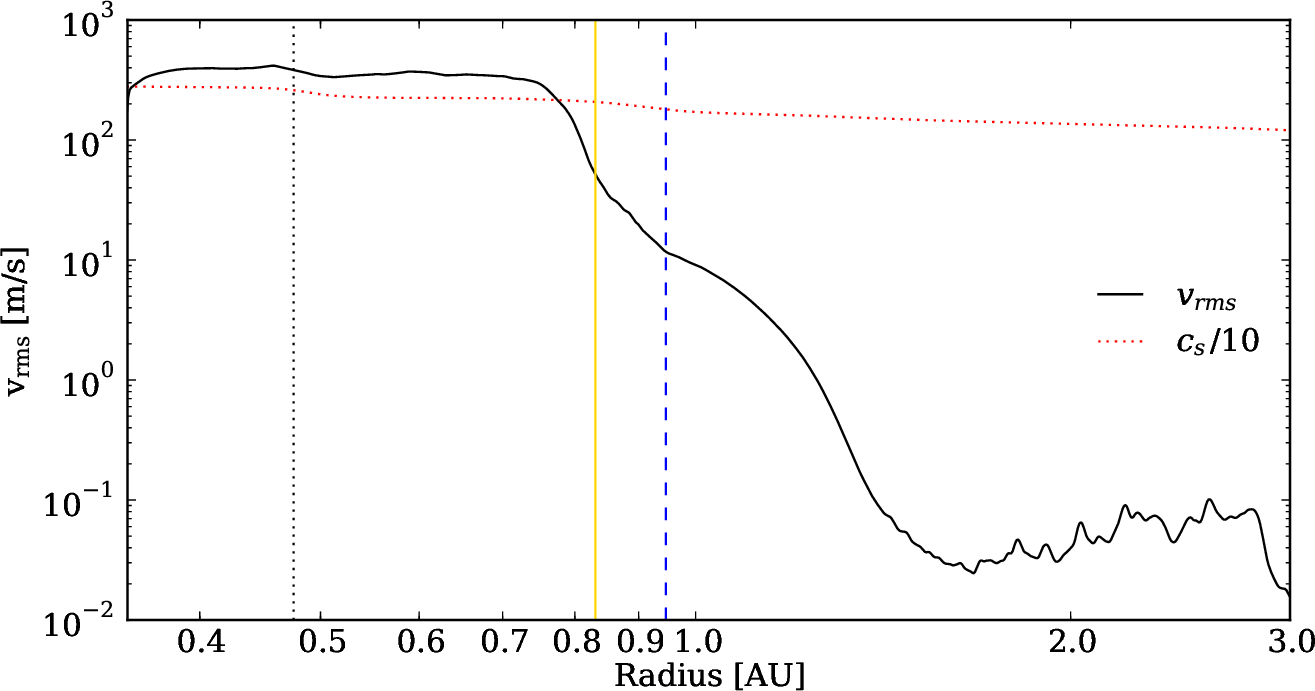
The radial profile of the (mass weighted) turbulent velocity fluctuations shown in Fig. 6 (middle panel) displays similarities with the radial profile of . It plateaus inside AU, with values between and meters per second that correspond to several tens of percent of the sound speed. At the rim position, there is a small decrease that we trace to the sudden temperature decrease and the associated drop in the sound speed (see red dotted line in Fig. 6, middle panel). This is not surprising since the value of remains roughly constant across the inner rim. At the dead-zone inner edge ( AU), the turbulent velocities quickly drop by several orders of magnitude so that, at the position of the dust concentration radius ( AU), the turbulent velocity fluctuations are reduced to values around m s-1.
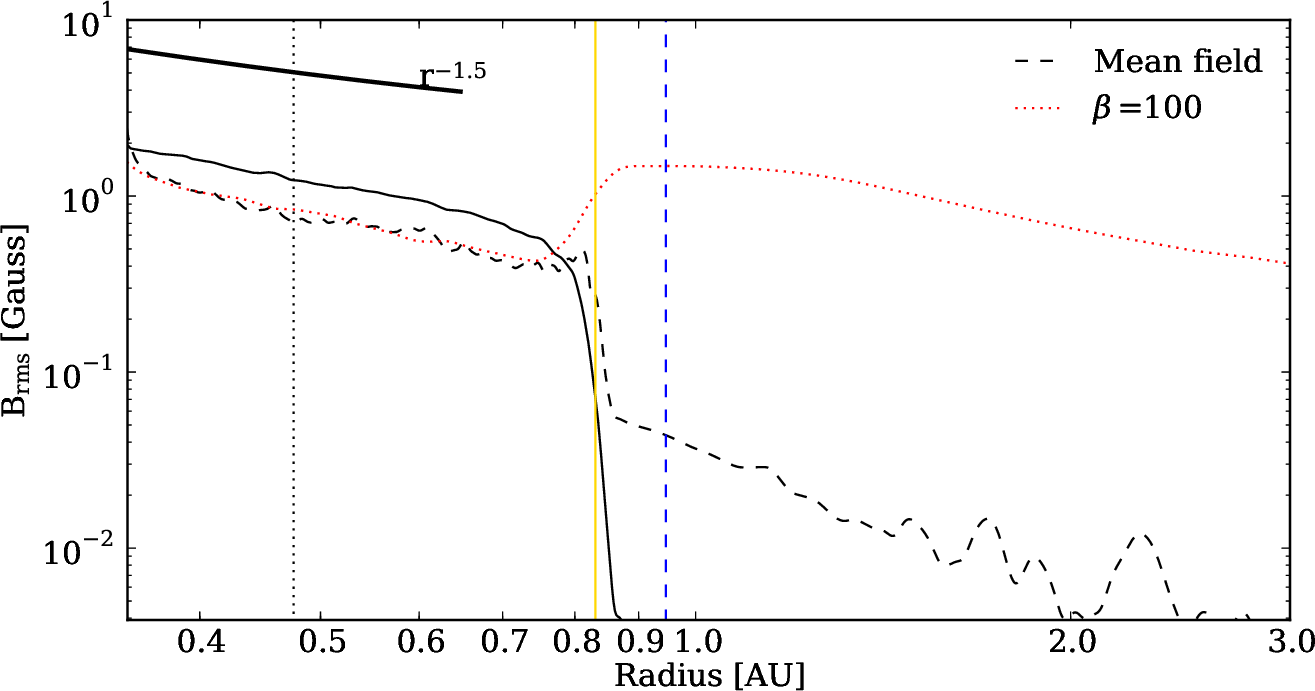
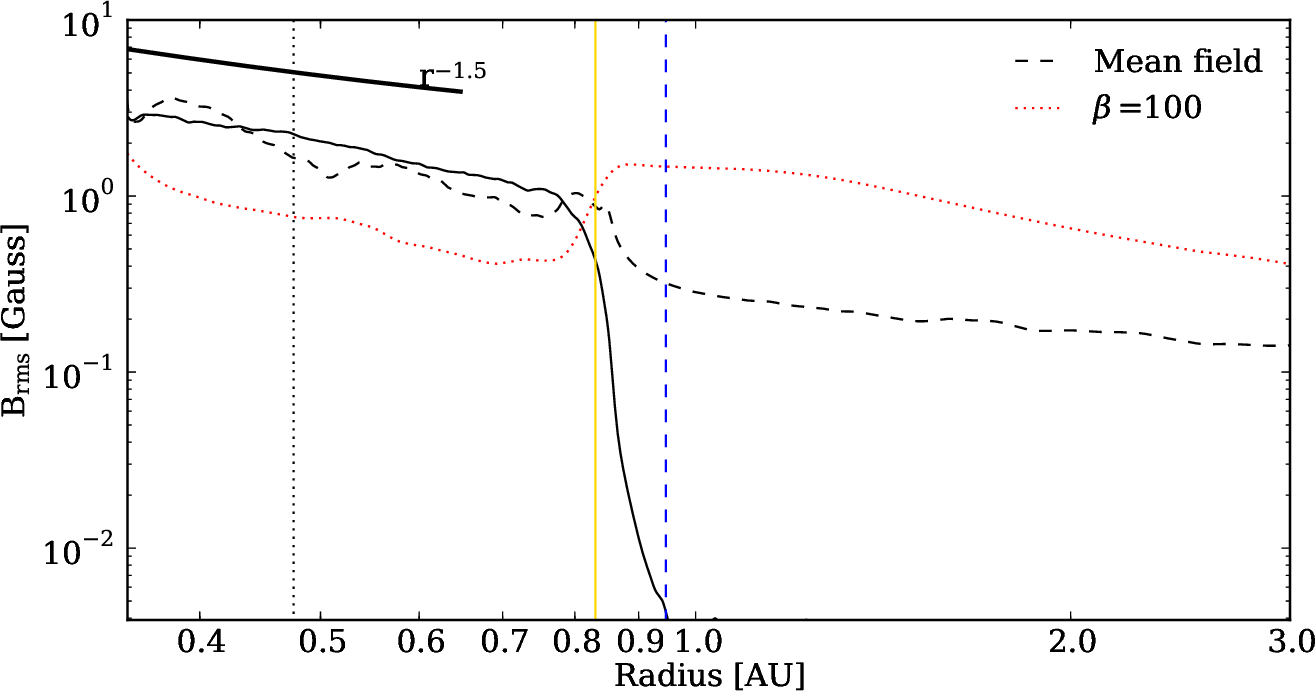
The radial profiles of the turbulent and mean magnetic field given in Fig. 6 (bottom panel) were calculated by performing a simple average over one scale height above and below the midplane. Inside the MRI active region, the turbulent magnetic fields show a power law radial profile with a slope of about and a strength of one Gauss at AU. This profile is slightly steeper than the radial profile found in toroidal net-flux global 3D isothermal simulations (Flock et al., 2011) and also recently again by Suzuki & Inutsuka (2014) in global simulations with a vertical net flux field. The radial profile of the turbulent and mean magnetic field (the latter being dominated by the toroidal component) both follow the profile that would be expected in a gas characterized by a constant value, where is the ratio between gas and magnetic pressure (see red dotted line which corresponds to ). At the dead-zone inner edge, the turbulent field strength quickly drops leaving a dominant mean magnetic field inside the dead-zone. The plot shows that the mean magnetic field diffuses outward in the dead-zone from its inner edge at AU.
3.3. Stronger turbulence: the net flux model
In this section we present the results of model RMHD_P0_4_BZ. It is intended to simulate the conditions in a protoplanetary disk which is under the influence of a vertical magnetic field. Model RMHD_P0_4_BZ was computed by restarting model RMHD_P0_4 after inner orbits, adding a uniform vertical magnetic field (see Appendix B for details) whose strength is such that at AU in the disk midplane. We find that the radial locations of the inner rim, the dead-zone edge and the dust concentration are only weakly modified compared to model RMHD_P0_4.
Fig. 7 (top panel) plots the time averaged and meridionally integrated radial profile of the stress to pressure ratio. Time averaging is done between 20 and 70 inner orbits. The model RMHD_P0_4_BZ shows a substantially increased turbulent activity compared to model RMHD_P0_4, with a high plateau of in the inner disk. Such high values are expected in the ideal MHD limit when the disk is threaded by a vertical net flux magnetic field (Bai & Stone, 2013). The mean Maxwell stress is large even in the MRI active region and accounts for about half of the angular momentum transport. It drops by one order of magnitude only at the dead-zone inner edge (see red dash-dotted line) and dominates the total stress in the bulk of the dead-zone, with a typical of order . Such large values generated by axisymmetric magnetic fields have also been found in local box simulations that include a Ohmic dead-zone only (see model V1 by Turner et al. (2007), model X1d by Okuzumi & Hirose (2011) or model D1-NVFb by Gressel et al. (2012)).
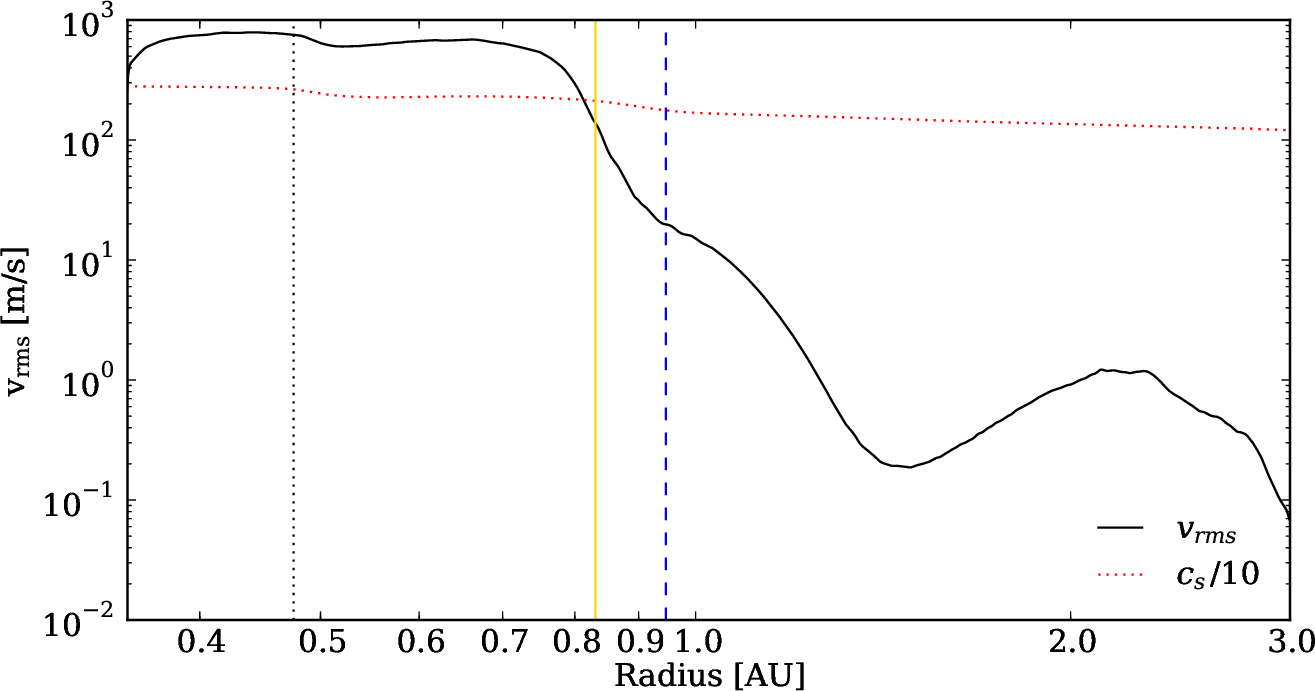
Next the middle panel of Fig. 7 shows the radial profile of the time averaged and mass weighted turbulent velocity fluctuations. Compared to RMHD_P0_4, is increased by a factor of two to three in the inner disk. Finally, the time averaged turbulent and mean magnetic fields are shown in Fig. 7 (bottom panel). Again, in the MRI active region, we find an increase by a factor two to three compared to model RMHD_P0_4. Their radial slopes, however, remain similar in this region. The biggest difference is the presence of a large mean field in the whole domain (compare black dashed lines in the bottom panel of Fig. 6 and Fig. 7). This is particularly true in the dead-zone, where the mean field in model RMHD_P0_4_BZ is almost two orders of magnitudes larger than the typical value we found in model RMHD_P0_4. Finally, we caution that the total duration of the simulation for model RMHD_P0_4_BZ remains fairly small. We refer the reader to the discussion section for more details.
3.4. Long lasting non-axisymmetric perturbations
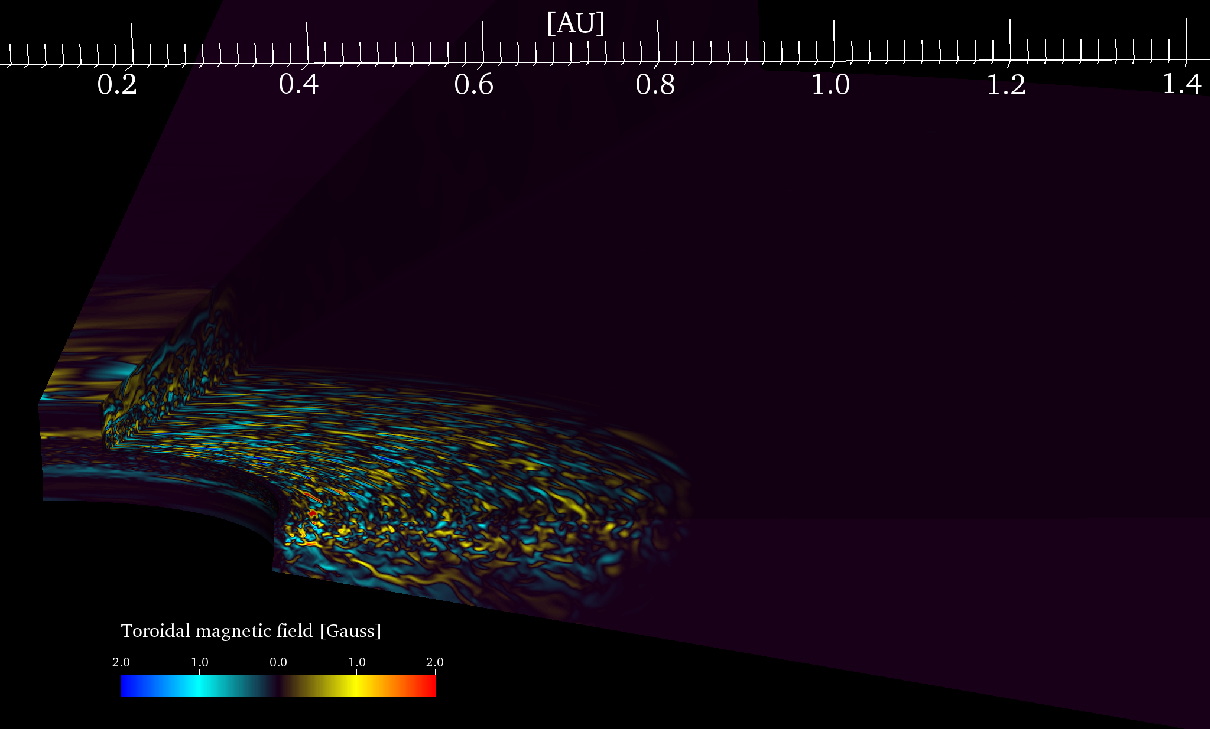
In this section, we investigate the potential growth of non-axisymmetric structures. This is done by using model RMHD_P1_6, which is similar to model RMHD_P0_4 but features a larger azimuthal extent. The initial conditions for this simulation are generated using a snapshot of the flow in model RMHD_P0_4 after 150 inner orbits and periodically repeating the azimuthal domain four times. Velocity perturbations of the order are applied cellwise to each component to break the symmetry. Model RMHD_P1_6 quickly reaches a new turbulent state, albeit with statistical properties similar to model RMHD_P0_4 (see Appendix A). The 3D rendering of the dust density after 50 inner orbits is shown in Fig. 8 (left panel). The plot confirms that dust particles are found between the rim and the dead zone inner edge in a highly turbulent environment. As discussed in the previous sections, the dust density increases sharply at the dead zone inner edge, following a similar increase in the gas surface density that is due to the drop of the accretion stress (Flock et al., 2016). The right panel shows the tangled structure of the turbulent magnetic field. It is dominated by the toroidal component which reaches amplitudes of several Gauss.
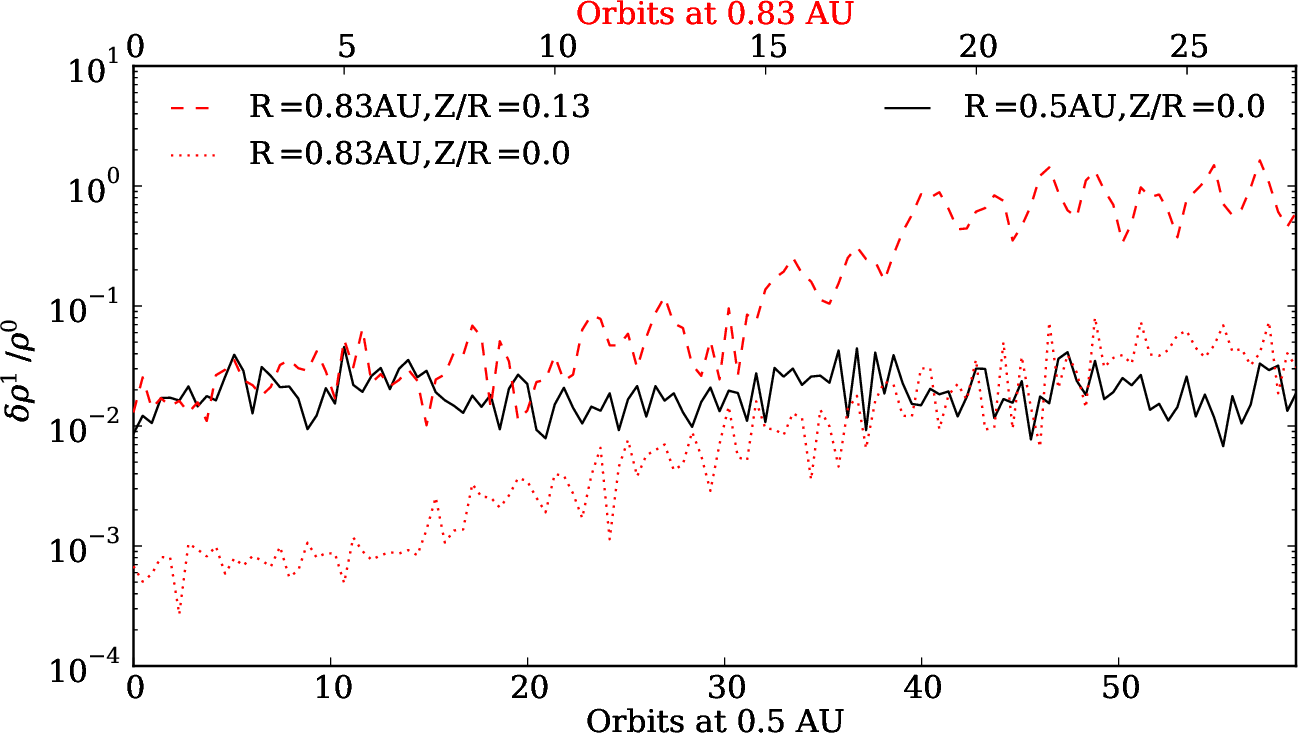
We next compute discrete Fourier transforms of the density along azimuth. We focus on three different locations: (1) the midplane at 0.5 AU, which is fully turbulent, (2) the upper layer close to the inner rim surface and the dead-zone edge (R=0.83 AU and Z/R = 0.13), and (3) the midplane at 0.83 AU. The results are summarized in Fig. 9. Initially, the large scale density variations are weak. They amount to a few percent in both the turbulent midplane at AU and in the disk upper layers at AU (see black solid and red dashed lines). They are even smaller in the disk midplane at AU (i.e. at the dead-zone edge) where they only reach value of (red dotted line). In the MRI active region, these density perturbations do not grow for local orbital periods ( 129 inner orbits). However, there is a clear increase by about two orders of magnitude at the location of the dead-zone edge (both red lines). In particular, the relative perturbations reach order unity in the disk upper layers at AU. The presence of a sharp surface density change at that location and the growth timescale of local orbits both suggest the Rossby wave instability (RWI) (Lovelace et al., 1999; Meheut et al., 2013). This is confirmed by the appearance of a localized vortex (not shown) characterized by a midplane relative vorticity of about in the vortex core. Similar values have been reported in the literature for vortices produced by the RWI (Lyra & Mac Low, 2012; Meheut et al., 2013; Flock et al., 2015). Fig. 9 indicates that the vortex is not growing anymore after 20 local orbits. Regarding the expected lifetime of the vortex we can only make predictions based on its shape. The vortex has an extent of H in radius and around H in azimuth ( at the vortex location). Such an elongated vortex is known to be vulnerable to elliptical instabilities (Lesur & Papaloizou, 2009), which will limit its subsequent growth. An alternating vortex growth and destruction, as it was found in (Flock et al., 2015), could be also possible.
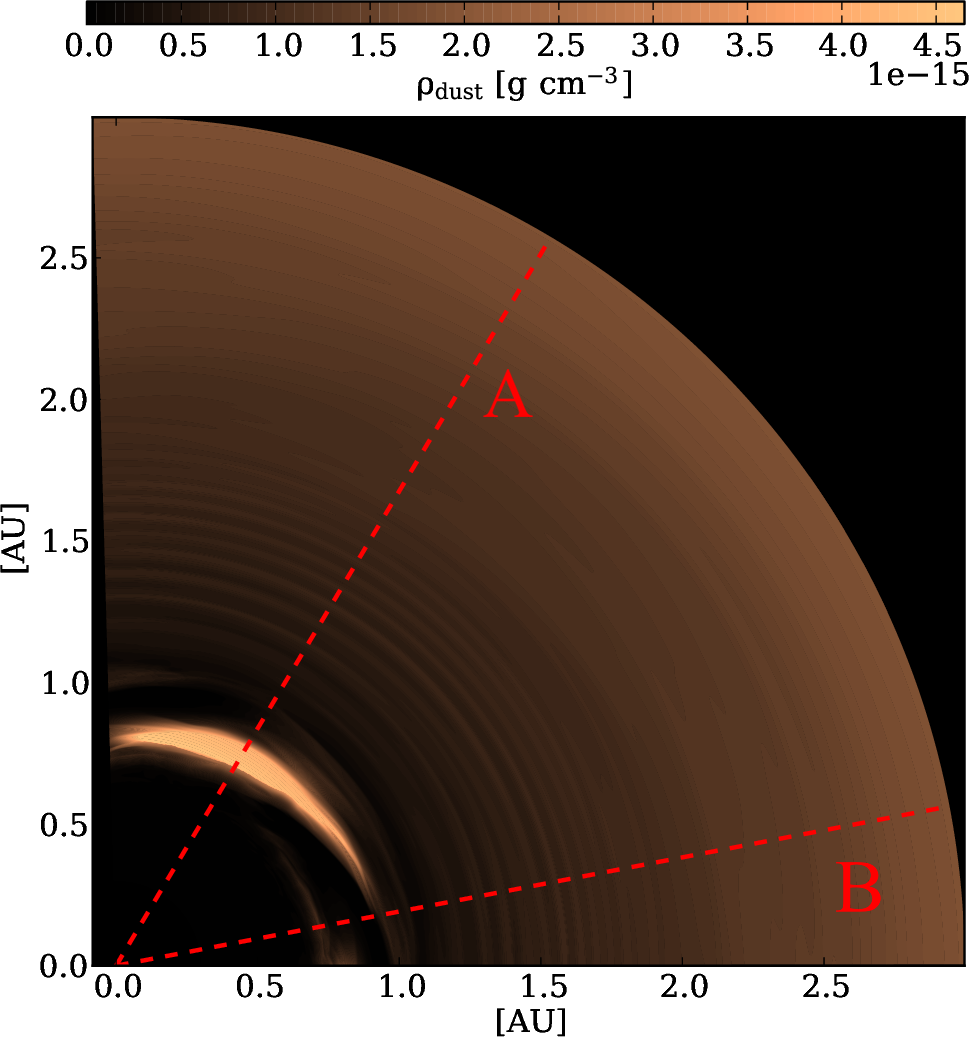
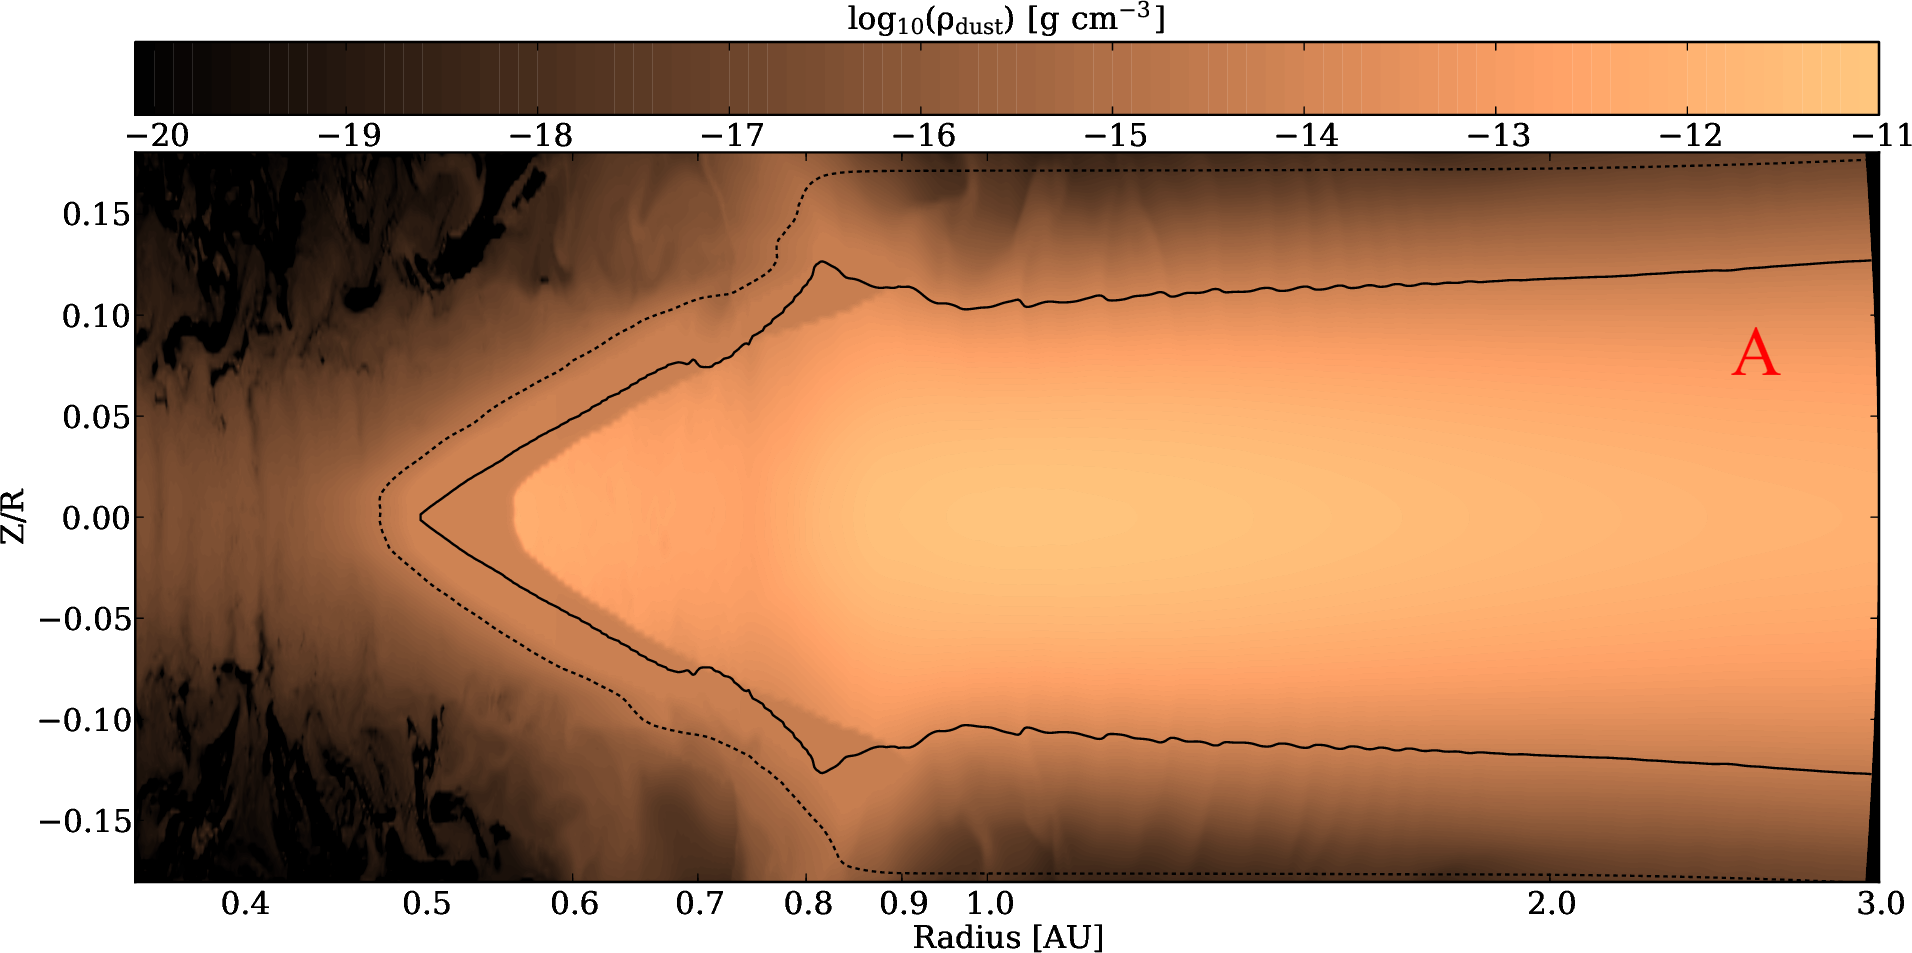
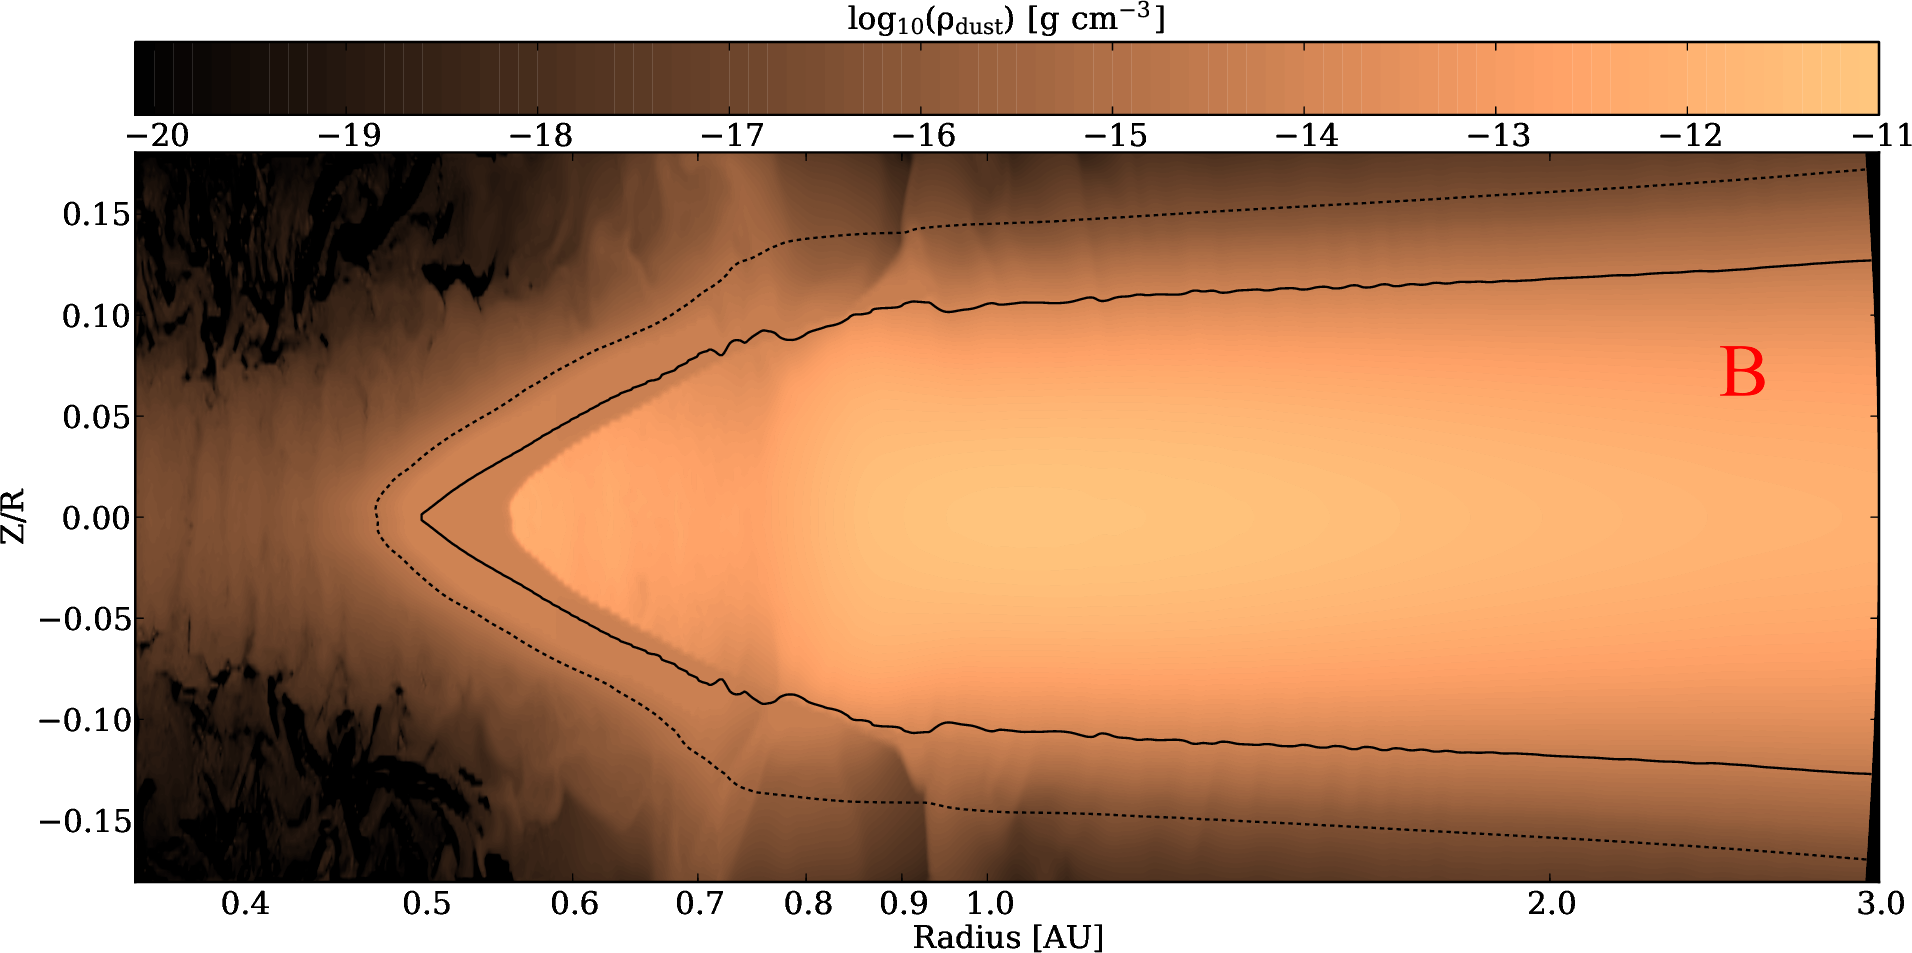
The vortex appears in Fig. 10 (top panel) in the snapshot of the dust density after 150 inner orbits as a clear non-axisymmetric density maximum. The middle and bottom panels of Fig. 10 show the dust density in the - plane inside and outside the vortex (along the lines labeled “A” and “B” on the top panel, respectively). Inside the overdensity, the irradiation optical depth unity line (or, equivalently, the height of the rim) is increased vertically (see the dotted lines on the middle and bottom panels of Fig. 10): at AU, we measured for cut “A”, and for cut “B”. As will be further discussed in section 4.3, such a difference in height is enough to create an extended shadow on the disk beyond.
4. Observational constraints
In this section we post-process our models with Monte-Carlo radiation transfer tools in order to translate the results described in the previous sections into observational constraints. This is done using the Monte Carlo radiative transfer code RADMC3D (Dullemond, 2012) for which we use the same parameters as in Flock et al. (2016). For more details on the post-processing and the RADMC configuration we use, we refer the reader to Appendix D. We first focus on the disk spectral energy distribution (SED) in Section 4.1 and next compute synthetic images in Section 4.2. Then, we discuss the time variability associated with the disk dynamics in Section 4.3.
4.1. SED
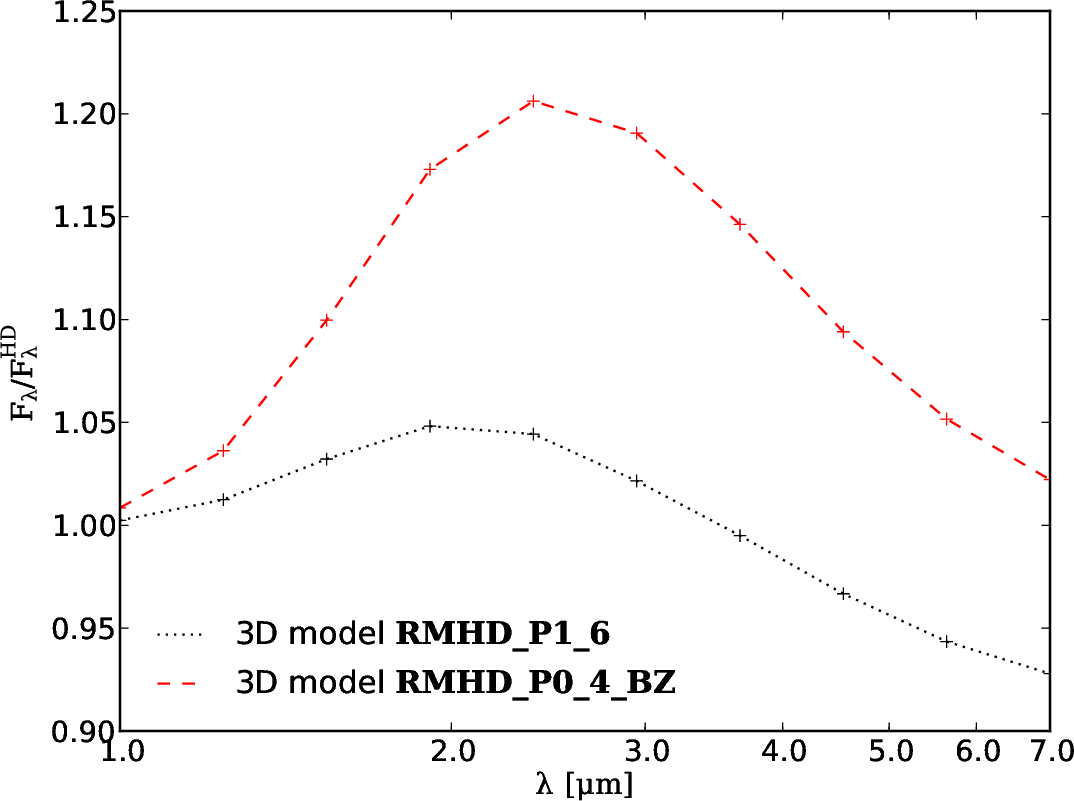
First, we determine the SED of the models RMHD_P1_6 and RMHD_P0_4_BZ and compare them with the initial radiation HD models. The system is seen inclined 45∘ from face-on and the azimuthal domain is repeated to cover the entire azimuthal range. We calculate the flux at seven individual wavelengths between 1 and 7 as it is the relevant wavelength range for our domain size and temperature range. The results are plotted in Fig. 11. The 3D radiation non-ideal MHD model RMHD_P1_6 is very close to the 2D radiation hydrodynamical model, with a modest increase of the emission around of due to the weak magnetized corona. By contrast, model RMHD_P0_4_BZ, for which the magnetic activity is much stronger, shows a significant increase of about compared to the hydrodynamical model.
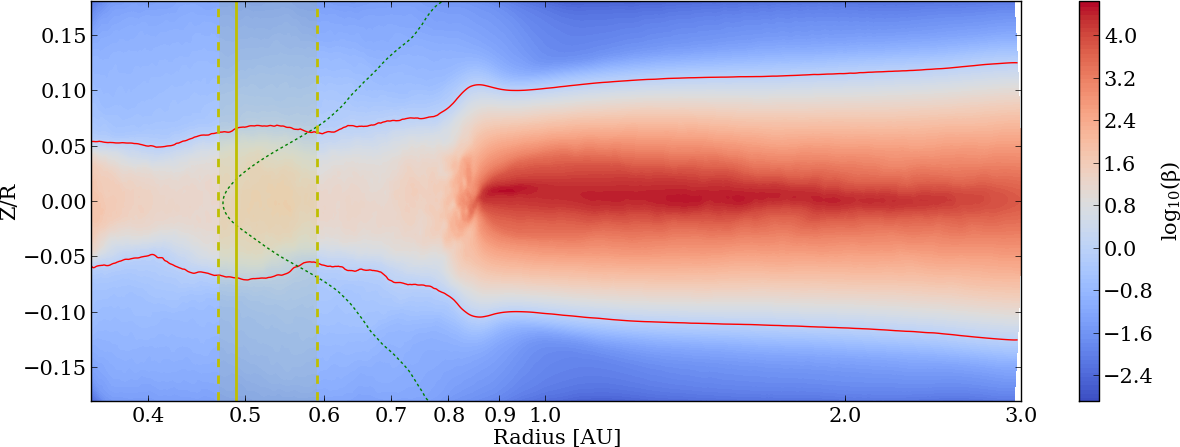
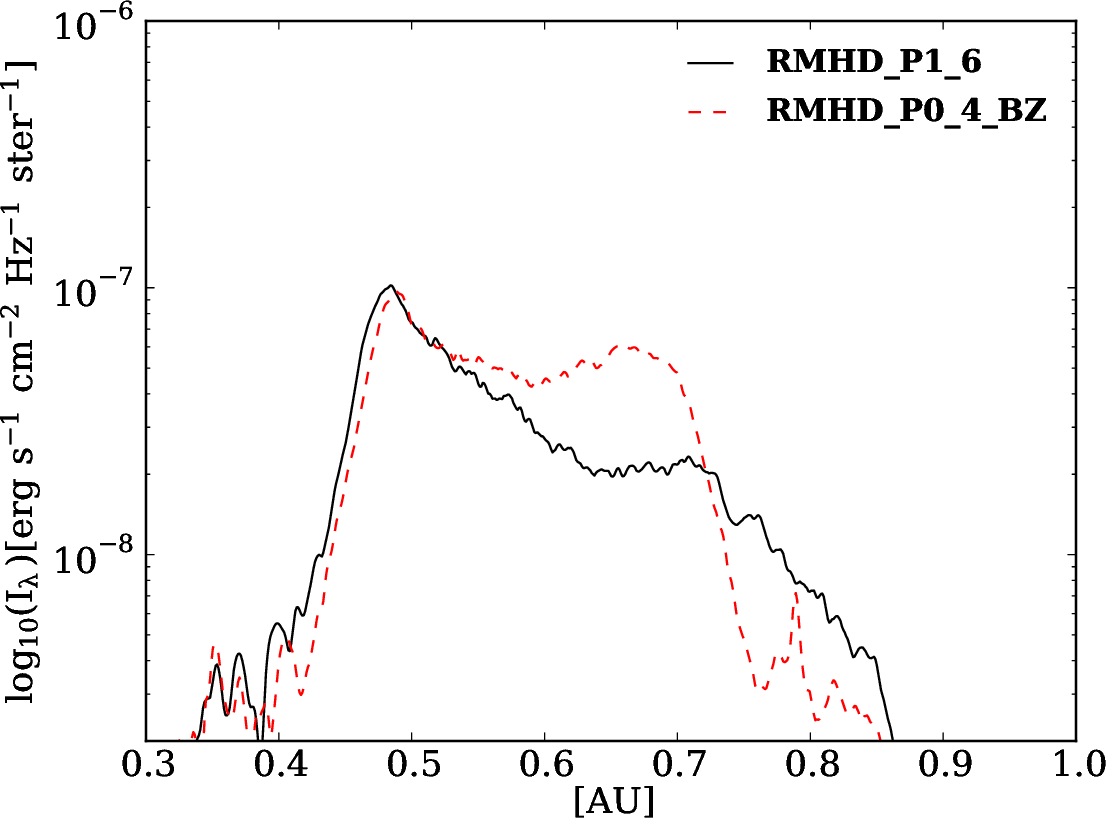
A discussion of the origin of the emission arising at different wavelengths is enlightening to understand this difference. Most of the NIR emission is thermal in origin and comes from the surface located where Z/R 0.05 and R 0.6 AU. At these locations, the magnetic field is weak and does not alter the density distribution: the area of the emitting region is unchanged. This can be illustrated with the help of the quantity , which indicates the importance of gas relative to magnetic pressure. Fig. 12 shows the distribution of in the - plane for model RMHD_P0_4_BZ, averaged in time and in azimuth. The upper layers are magnetically dominated () while the midplane region remains gas pressure dominated (). The equipartition line () stays above the rim surface () for . Most of the J and K band NIR emission is coming from a narrow region: the solid yellow line in Fig. 12 marks the location of the peak emission (solid) and the area between the dashed yellow lines corresponds to the location where 50% of total flux at is emitted (at face-on orientation). Although it is shown here for model RMHD_P0_4_BZ, this result is similar for model RMHD_P1_6. Fig. 13 helps to understand the increased NIR emission in model RMHD_P0_4_BZ: it shows a radial cut from the synthetic image at for both models. The regions outward from AU mainly contribute to the increased emission in model RMHD_P0_4_BZ. As seen in Fig. 12, the magnetic pressure is stronger than the gas pressure at the position of which results in increased magnetic support, and thereby a shallower density profile in the disk upper layers. By contrast, model RMHD_P1_6 presents weaker magnetic activity and a thinner magnetically supported corona which leads to the SED profile being closer to the hydrodynamical model. Overall, these results suggest that magnetic field are able to increase the emission between to by to . We discuss the possibility of obtaining an even higher NIR excess in section 5.
4.2. Synthetic images
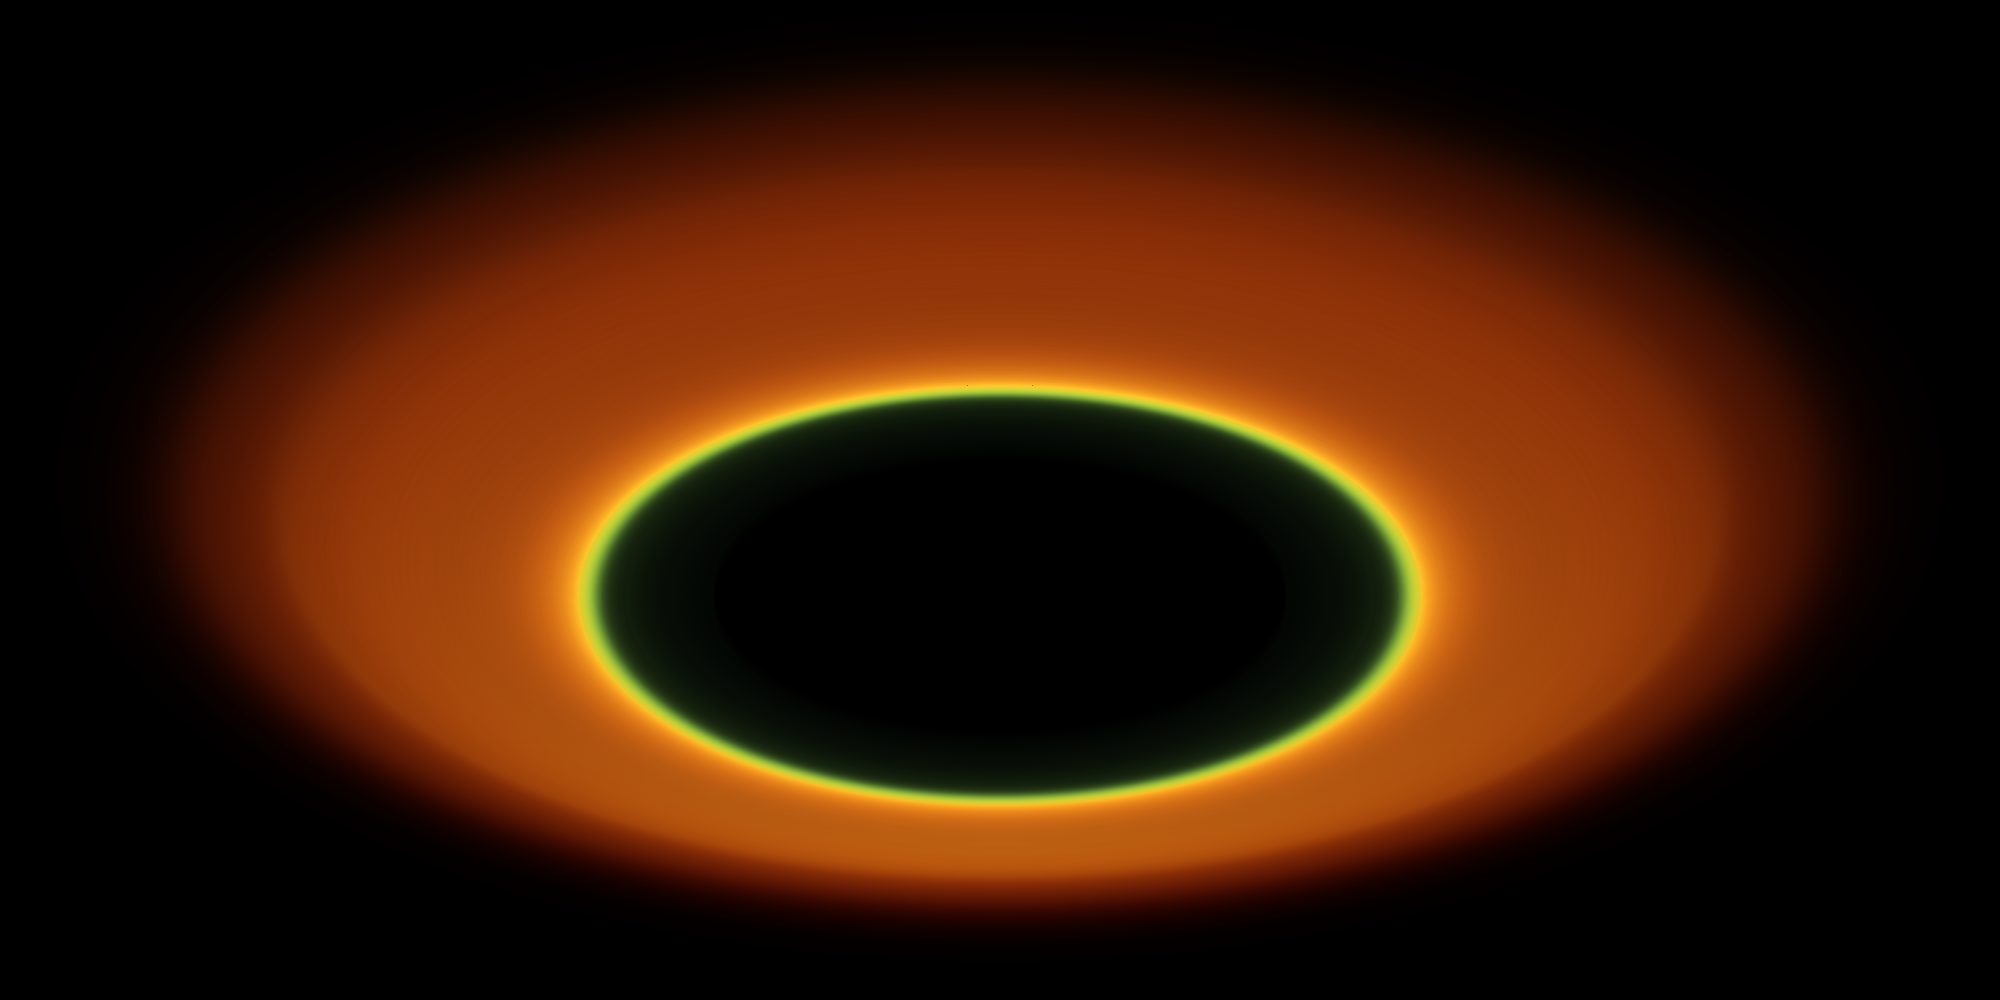
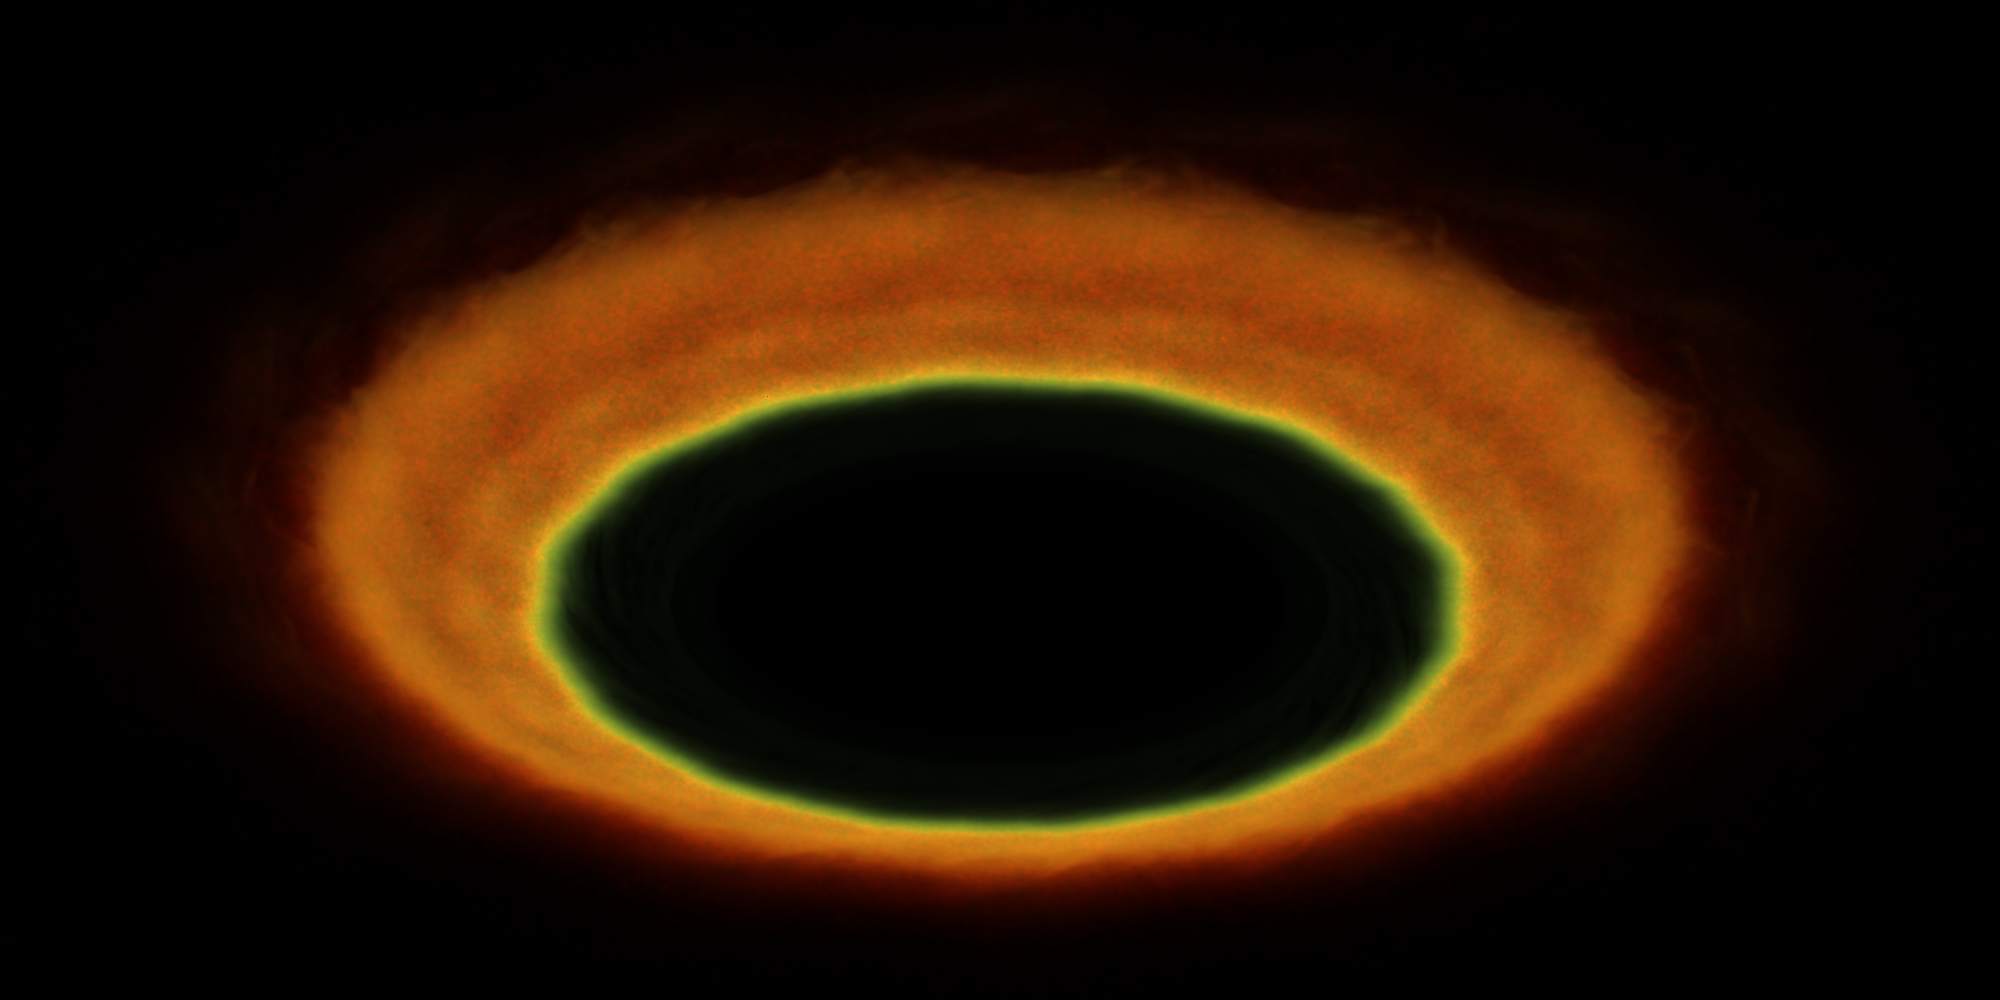
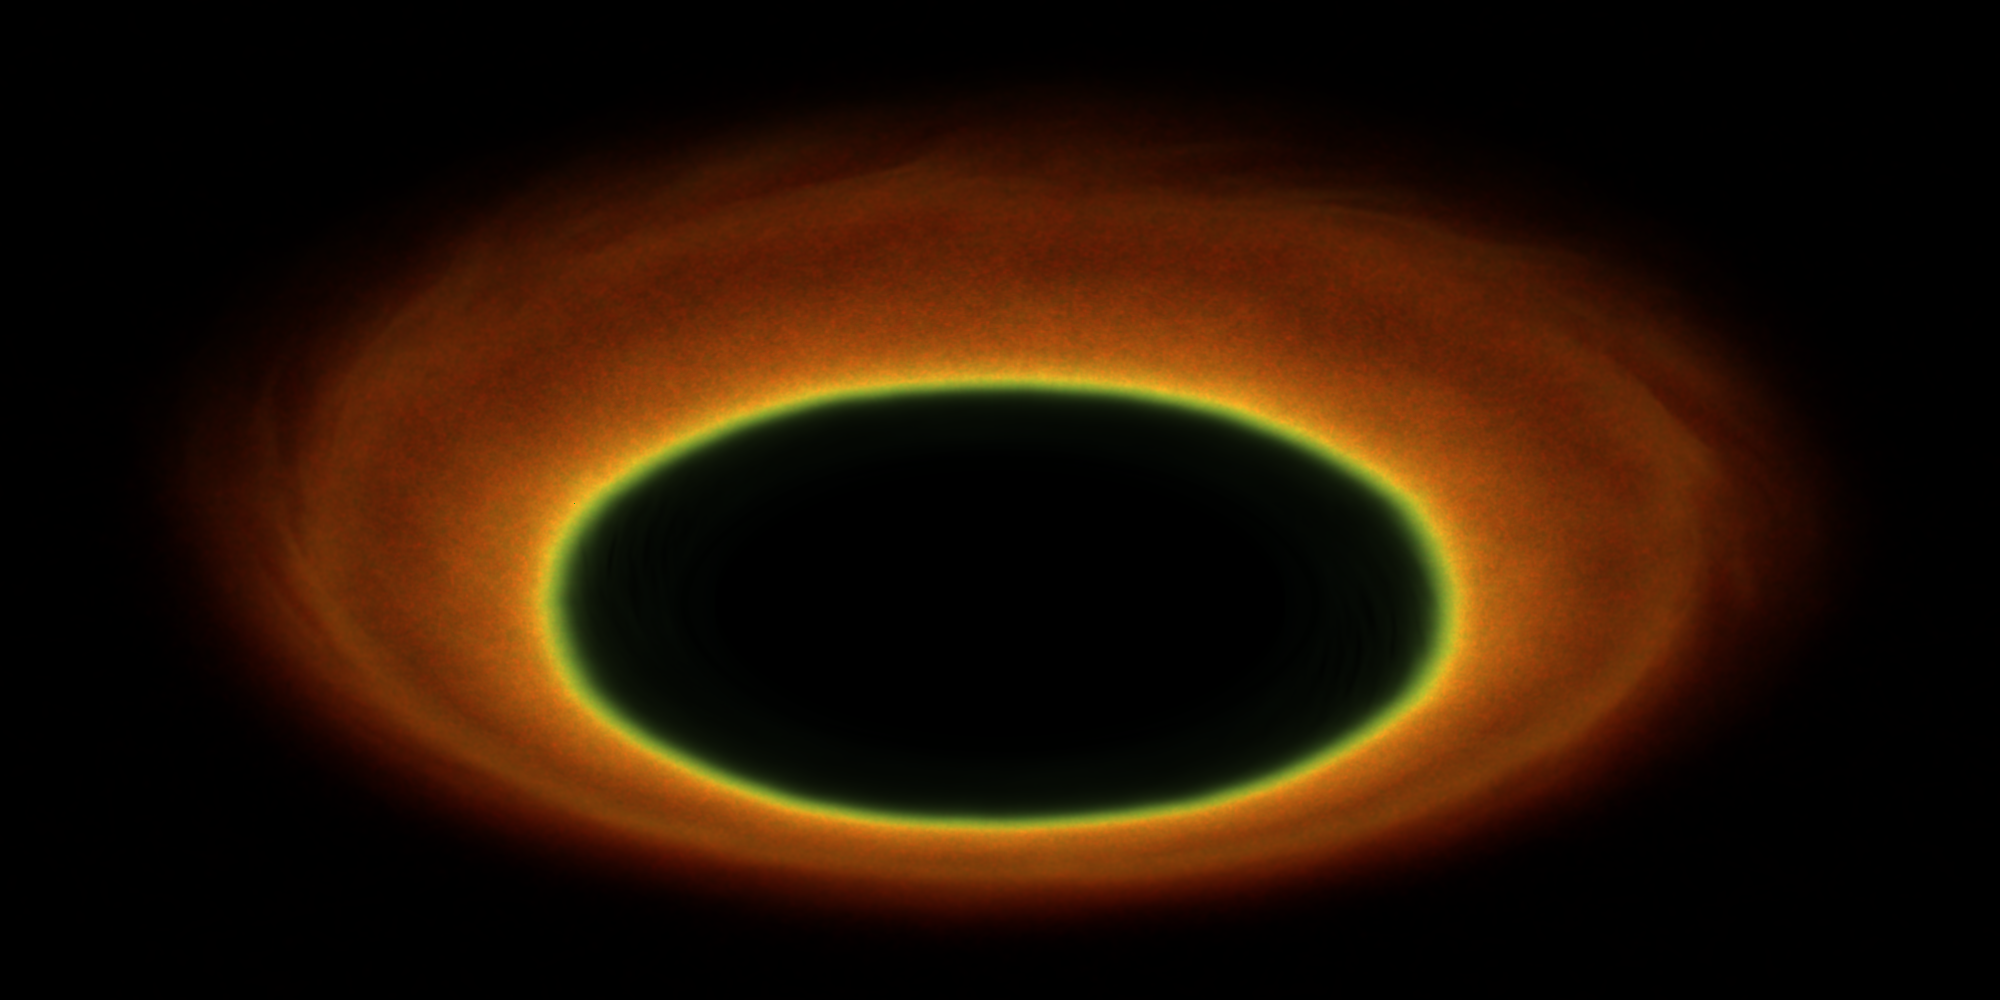
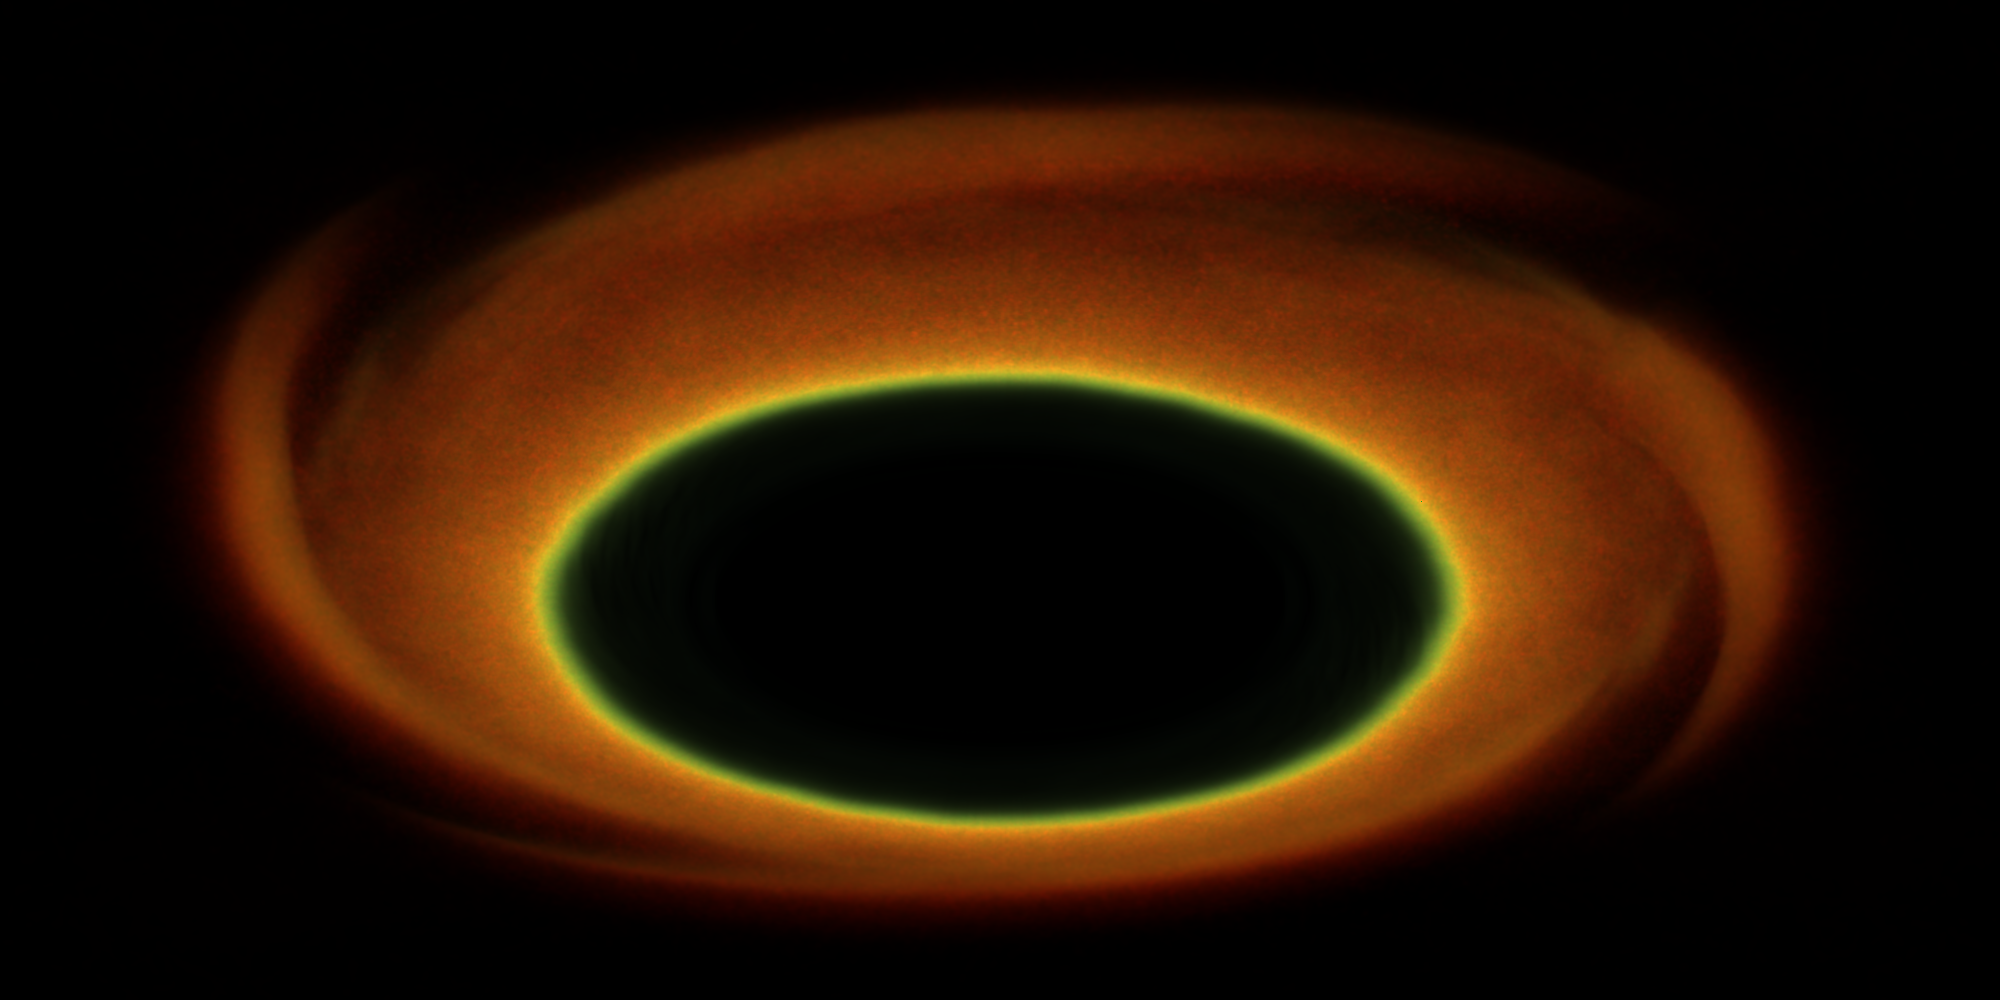
Synthetic images are shown in Fig. 14 corresponding to the radiation hydrodynamical model (top panel) and the global 3D radiation non-ideal MHD models (bottom three panels). For all cases, the images cover a region which is approximately wide. The fluxes at , , and m from the blue, green and red channels on a shared linear color scale normalized over the maximum intensity at 4.8 m. In the synthetic images of the 3D models computed at early times during the simulations (second and third panels), small turbulent structures can be identified, especially in the uppermost layers of the near-infrared emitting region. Model RMHD_P0_4_BZ (second panel) shows a slightly narrower and brighter ring compared to model RMHD_P1_6 (third panel). This is because the rim surface is slightly steeper compared to the other models (see also the line in Fig. 12) owing to the magnetic support. At later time during the evolution of model RMHD_P1_6, the effect of the vortex becomes visible in the synthetic image of the NIR emission (bottom panel in Fig. 14) as a spiral pattern visible in the M band emission. We note that the pattern comes from duplicating the simulation domain in the azimuthal direction before viewing the snapshot. Global hydrodynamical calculations indicate such multiple RWI vortices merge leaving a single pattern (Lyra & Mac Low, 2012; Meheut et al., 2012).
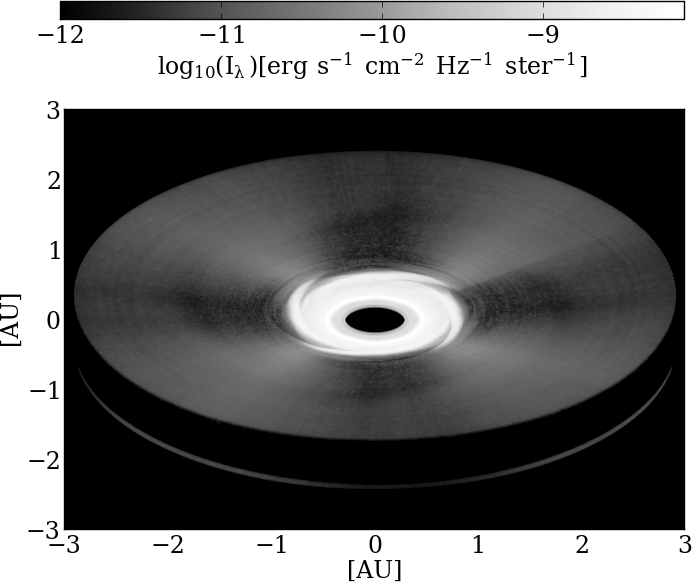
Using the final snapshot of model RMHD_P1_6, we also computed the synthetic image at in Fig. 15. At this wavelength, most of the surface brightness is due to star light scattered from the disk surface. The strongest scattering happens at the rim, producing the ring structure outward of AU. The spiral structure due to the vortex is also visible. At larger radii ( AU), the intensity drops by orders of magnitude and a shadow is visible. The vortex increases locally the inner rim height, throwing a non-axisymmetric shadow onto the outer disk. Almost all the scattered 0.3-m flux of the system comes from the inner rim. As recently discussed by Dong (2015), the shadow structure shows a smooth profile, without any sharp transitions. Although we do not expect such a structure to be observed given the spatial resolutions that can be reached with current telescope facilities, such shadowing by an inner vortex might affect the disk temperature (and therefore its dynamical response) through its impacts on heating and cooling.
4.3. Variability
We now investigate potential variability using the results of model RMHD_P1_6. We focus on two aspects. The first is the variability of the NIR emission caused by variations of the rim surface and shape. The second is related to the star’s occultation by the inner rim.
4.3.1 NIR intensity variability
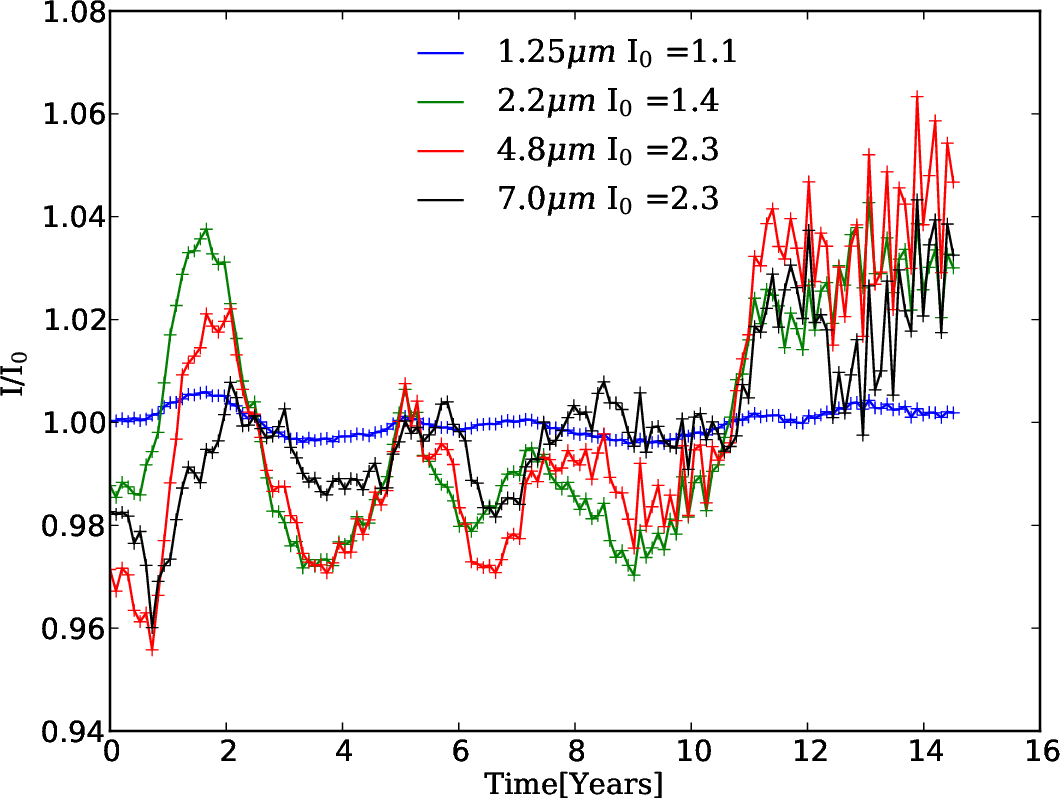
We start with the variability of the NIR emission, which we calculate for a system viewed with an inclination of 45∘. The lightcurve is plotted in Fig. 16 for different wavelengths. At , the variations are smaller than . At this wavelength, most of the emission is coming from the optically thin and hot material close to the midplane position of the inner rim. Larger variations become visible at the wavelengths and , reaching up to in relative amplitude. At longer wavelengths, e.g. at , the fluctuations amplitude decreases again. Fig. 16 also shows clearly that the variations at different wavelengths are correlated.
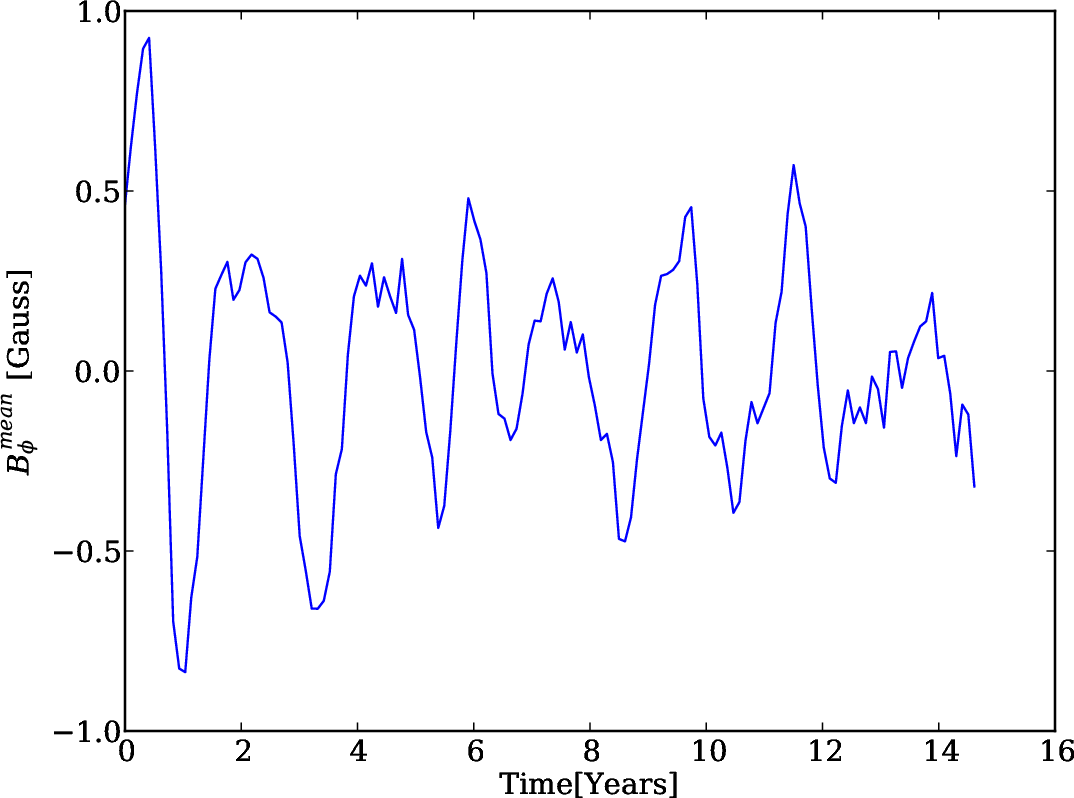
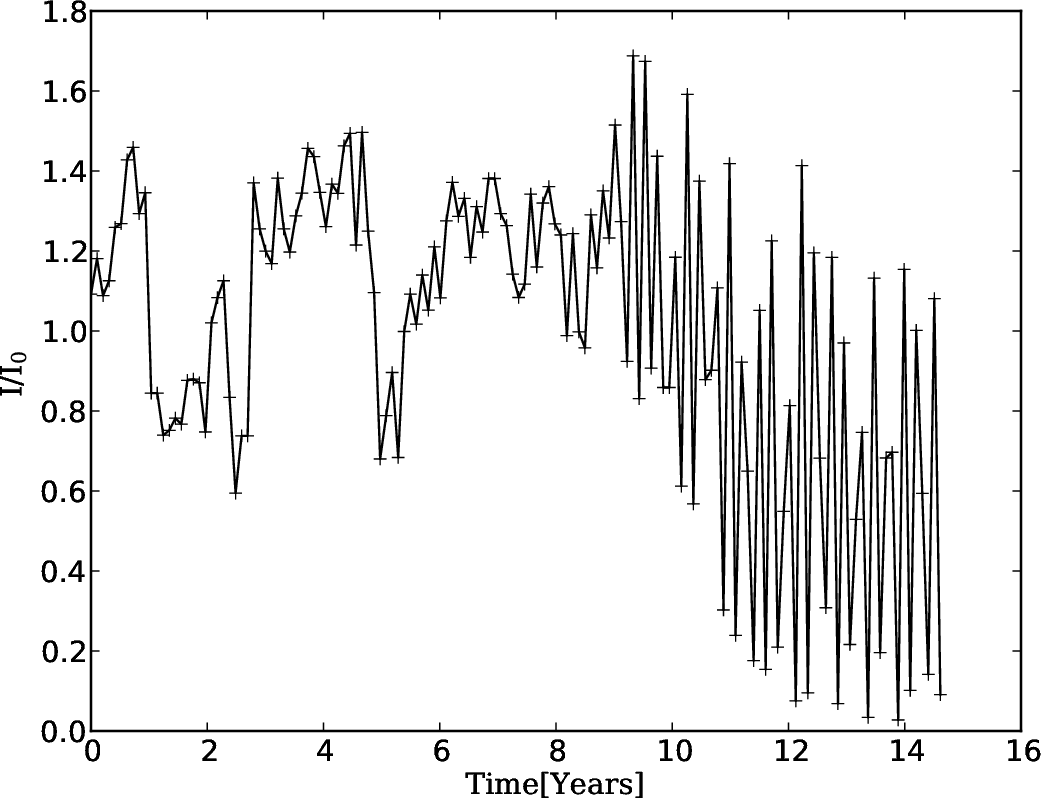
The NIR emission exhibits two different types of variations. During the early evolution (- years), Fig. 16 shows low frequency variations with a period of two years (which roughly corresponds to Keplerian orbits at 0.5 AU). These variations could be connected to the oscillations of the mean toroidal magnetic field which happen to display a similar timescale of orbits (see Fig. 16, bottom panel, where we plot the mean toroidal magnetic field at a radius of 0.5 AU and a height of Z/R=0.05). Oscillations of the mean toroidal magnetic field such as reported here are known to be a robust outcome of MRI-driven MHD turbulence in disks (Stone et al., 1996; Miller & Stone, 2000; Lesur & Ogilvie, 2008; Gressel, 2010; Simon et al., 2011; Flock et al., 2012a). Our results thus potentially suggest an indirect signature of this dynamical feature in the NIR emission variability of Herbig stars. At later time during the simulation ( years), the frequency of the variability changes and the NIR emission starts to display monthly time variations. These are due to the vortex rotating around the star and depend on the combination of vortex azimuthal angle and disk inclination.
4.3.2 Stellar occultation by the inner rim
Finally, we investigate the variability associated with the occultation of the star due to variations, both in space and time, of the inner rim height. Such height variations will produce a time-varying absorption of the stellar light which we study here. To do so, we calculate a time series of the relative intensity (i.e., normalized by the mean intensity) received by an observer at when viewing the disk at an inclination . We chose that particular inclination because this is the value of for which the variability is the largest. The wavelength at was chosen to represent the variations at the peak emission flux for this type of star.
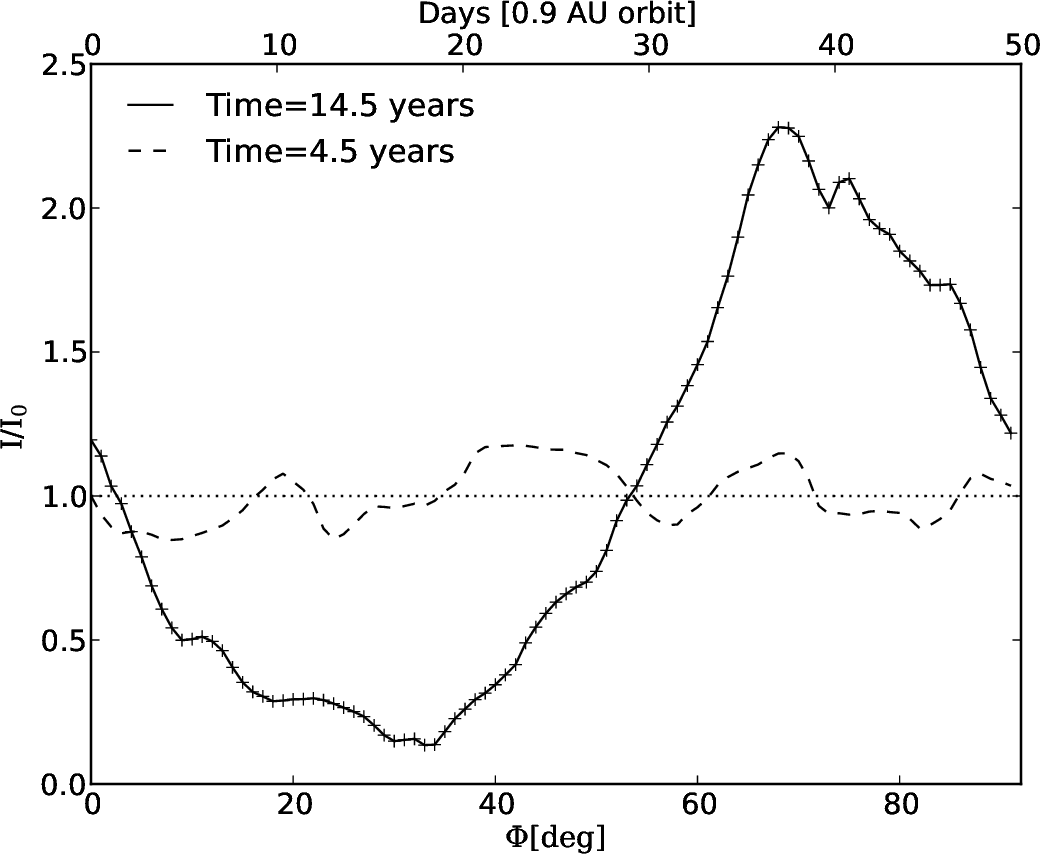
The time evolution of the intensity is shown in Fig. 17 (top panel), with a time sampling of years ( of an orbital period at 1 AU for this type of star). The amplitude of the variability is initially (i.e at times yrs) of the order of 50% and displays an irregular pattern. It is caused by the turbulent motions at the rim surface. In addition, the mean field oscillations reported in Fig. 16 are also able to increase the density along the line-of-sight for a given time. At later times during the evolution ( yrs), the vortex causes the variations to become more periodic with intensity fluctuations up to an order of magnitude. To obtain a finer sampling of both occultation patterns, we make two additional series of Monte Carlo radiative transfer calculations, one for a representative snapshot from the pre-vortex stage of the disk’s evolution, and the other for the later stage. For each, we simulate the time changes by systematically increasing the azimuthal angle from which we view the disk. The results are shown in Fig. 17 (bottom panel). At yrs (dashed curve), we find variations of the order of with a corresponding timescale of about ten days. They are due to turbulent structures located at the rim surface and correspond to the high frequency fluctuations seen at early times on the top panel of Fig. 17. At yrs (solid curve), we recover the periodic modulation of the intensity, with an amplitude of roughly one order of magnitude, seen at late times on the top panel of Fig. 17. As discussed previously (see the variations of the line of Fig. 10), this is due to the rim height locally increasing by about at the location of the vortex.
5. Discussion
In this section, we discuss some limitations of our modeling.
5.1. Zero-net-flux models
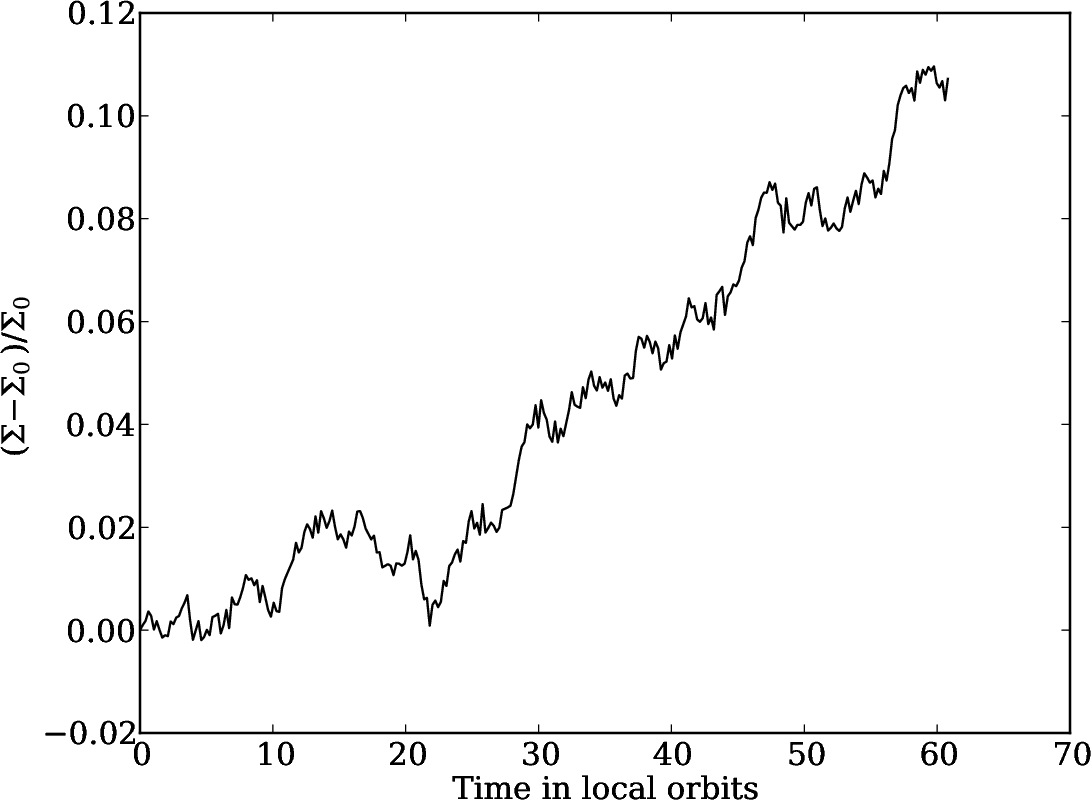
In section 3.1 we have shown that the disk structure remains stable for the simulation runtime. However, the accretion stress inside the dead zone which is found for model RMHD_P0_4 and model RMHD_P1_6 is orders of magnitude lower than what was assumed to generate the initial conditions. The value of the surface density inside the dead-zone should therefore be taken with care. Fig. 18 shows the surface density evolution over time at the dead-zone inner edge at 0.85 AU for model RMHD_P0_4. There we observe the fastest surface density variation. The surface density at the dead-zone inner edge increases around 10% over the runtime. Over the accretion flow timescale we would expect a gradual increase of the surface density in the dead zone. Spanning such timescales is not feasible in 3D simulations.
5.2. Vertical net flux model
Model RMHD_P0_4_BZ shows a much higher accretion stress in the dead zone, close to the value assumed in computing the initial conditions. However, one should be careful in interpreting the magnetic field strength and geometry at large radii in this model given the short simulation time. The time average of inner orbits represents only outer orbits and the high stress we observe in the dead-zone might only be due to the initial conditions. Model RMHD_P0_4_BZ is also limited by severe mass loss associated with a strong magnetically driven outflow. Local and global simulations by Fromang et al. (2013) and Suzuki et al. (2010) suggest that the surface density would decrease on timescales of local orbits as a result. This will eventually also affect the optical depth and the thermal structure at the rim, setting a practical limit to the maximum integration time of model RMHD_P0_4_BZ.
5.3. Ohmic resistivity
We here treat only the Ohmic resistivity, though the other non-ideal effects – ambipolar diffusion and Hall drift – are important in the dead zone (Bai & Stone, 2013; Turner et al., 2014b; Lesur et al., 2014). We have compared Eq. 11 which mimics the Ohmic dissipation dependence on temperature with the ionization balance results from Desch & Turner (2015). Eq. 11 reproduces the transition region around Elsasser number unity very well. However we note that the Ohmic resistivity is much greater inside the dead zone () than our computational resources allow. Furthermore, we consider only thermal ionization, neglecting the stellar FUV and X-ray photons and the stellar and interstellar energetic protons. Thus the disk’s surface layers, where these external fluxes ought to be absorbed, are ionized too little in the colder parts of our models. Treating these additional factors would likely affect the geometry of the magnetic fields in and around the dead zone.
5.4. Comparison to previous works
Turner et al. (2014a) showed that a magnetically supported atmosphere could increase the near infrared excess emission by a factor of two. However, the sublimation curve (Eq. 9) was not fully treated in that paper. In our models we find the rim’s shape accurately using Eq. (9). Most of the emission in the J and K band is then coming from a narrow region which is not much affected by magnetic fields, except in the outer parts of the rim. As a result, we find the NIR flux increase of about at microns when adding a strong and uniform vertical magnetic field. An even stronger magnetized corona would be needed to explain the NIR excess.
5.5. Observed variability
Variability of young star-disk systems has been the focus of intense research for decades (Joy, 1945; Carpenter et al., 2001; Morales-Calderón et al., 2011). Large sets of month-long simultaneous optical and infrared lightcurves became available recently through surveys of low-mass T Tauri stars with the CoRoT and Spitzer space telescopes (Cody et al., 2014; Stauffer et al., 2016). A few Herbig stars have been examined through imaging and/or spectroscopic time series. Sitko et al. (2012) studied the variability of the gas and dust emission from the Herbig system SAO 206462, reporting spectral line changes connected with variations in the accretion rate, and near-infrared dust flux changes on monthly timescales with amplitudes of 10 to 20%. Our models match the observed timescales very well, but the MRI turbulence yields somewhat lower amplitudes below 10%. Wagner et al. (2015) investigated the Herbig system HD 169142 at two epochs separated by 10 years. They reported near-infrared variability of 45%, explaining it by a structural change in the inner dust rim. These observations suggest there may be an additional variability mechanism, perhaps associated with a disk wind (Bans & Königl, 2012) which could be driven by the MRI (Miyake et al., 2016). Further linking the variability to the inner rim shape are scattered light observations of HD 163296 by Wisniewski et al. (2008). They report that shadows cast by the inner rim vary on timescales of several years. We finally note that occultation by vortices might be observed in highly inclined systems. An example is AA Tau, which is inclined about and still undergoing a strong occultation event that began in 2013 (Bouvier et al., 2013). Such an event could be due to a local thickening of the disk at a vortex like that on the inner rim in the models we present, but located further from the star. Highly inclined disks appear well suited to observe the rim occulting the star, especially in cases where the outer disk is dust-depleted by radial drift or settling (Bertout, 2000). Other studies relating flux dips in highly inclined systems to occultation by dusty material include those by Alencar et al. (2010); Morales-Calderón et al. (2011); Cody et al. (2014).
Such an event could be due to a vortex located at larger disk radii, increasing locally the height of the disk, similar as the vortex at the inner rim in the models we present.
Such highly inclined disk systems might be ideally suited to observe the star occultation by the rim (Bertout, 2000), especially in cases where the outer disk is dust depleted by the radial drift or settling. The studies by Alencar et al. (2010); Morales-Calderón et al. (2011); Cody et al. (2014) related dipping events by dust occultation which was observed in highly inclined systems. Recently Ansdell et al. (2016) showed that such events could also occur for less inclined systems.
6. Summary
We have presented the first global 3-D radiation non-ideal MHD models of the innermost reaches of protostellar disks, using them to investigate the dynamics and thermodynamics of the planet-forming material. Our models include the transfer of the starlight into the dust and gas, where the heating impacts the dust sublimation and deposition and the Ohmic resistivity. The starting conditions come from axisymmetric radiation viscous hydrodynamical models of the disk around a typical Herbig Ae star, with a radially-independent mass accretion rate of M⊙ yr-1. Magnetic fields either with or without a net vertical flux yield magneto-rotational turbulence. The inner disk’s structure divides naturally into four zones:
-
1.
Between the star and the silicate front, the gas is turbulent with RMS speeds of 400 to 800 m s-1, depending on the initial magnetic field configuration. The accretion stress-to-pressure ratio is between 3 and 10%, and the turbulent magnetic field strengths are several Gauss. The gas is hotter than the silicate sublimation threshold.
-
2.
Lower temperatures let silicate dust exist beyond a curved front that is closest to the star in the midplane at about 0.5 AU. Dust and strong turbulence coexist at 0.5 to 0.8 AU, where temperatures are about 1000 K. The stress-to-pressure ratios are similar to those nearer the star, but the turbulence is slightly slower, due to the lower temperatures, at 300 to 700 m s-1. High-speed collisions should substantially limit the grains’ maximum size.
-
3.
Beyond about 0.8 AU, temperatures are low enough and collisional ionization slow enough that the magnetic fields decouple from the gas motions. This region is the dead zone. From 0.8 to 1.1 AU, turbulent speeds decline quickly with distance. Density waves propagating from the turbulent region are quickly damped, leaving laminar gas with turbulent velocities below 1 m s-1. A local pressure maximum lies in the weakly-turbulent dead zone near 1 AU. This pressure peak is able to halt solid particles’ radial drift.
-
4.
Beyond 1.1 AU, well inside the dead-zone, the disk is quasi-laminar with very low turbulent speeds. This region lies partly in the shadow cast by the sublimation front.
The 3-D calculations let us investigate non-axisymmetric stability. We find Rossby wave instability develops over timescales of 20 local orbits into a vortex located at the dead zone’s inner edge and close to the upper rim of the curved silicate sublimation front. The vortex moves the disk’s surface up and down over its orbital period.
We post-process our results using Monte Carlo radiative transfer tools to compare against a variety of observational constraints:
-
1.
Our models with strong magnetic fields have near-infrared fluxes that are 5 to 20% greater than the viscous version, because the magnetically-supported disk atmosphere raises the sublimation front, reprocessing more of the starlight into wavelengths near 2 and 3 m. Magneto-rotational turbulence could thus be a factor in the long-standing puzzle of Herbig stars’ anomalously large near-infrared excesses (Vinković et al., 2006; Acke et al., 2009; Dullemond & Monnier, 2010).
-
2.
The vortex that develops near the sublimation front’s high point locally raises the height where the starlight is absorbed, thus casting a longer shadow on the disk beyond. The fraction of the stellar luminosity intercepted by the sublimation front at this stellar longitude is increased about 10%. Such shadow-casting vortices could potentially be related to the variability observed in scattered-light imaging of Herbig disks (Wisniewski et al., 2008).
-
3.
The near-infrared flux varies up to 10% due to the movements of the inner rim, on timescales of months to years. The regular component of the variations is larger relative to the irregular component when the vortex is present. Further development of this picture could help in understanding why young stars with protostellar disks have such diverse optical and infrared lightcurves (Sitko et al., 2012; Cody et al., 2014).
Radiation-MHD models of the kind we have demonstrated here open a new window for investigating protoplanetary disks’ central regions. They are ideally suited for exploring young planets’ formation environment, interactions with the disk, and orbital migration, in order to understand the origins of the close-in exoplanets.
Acknowledgments
We thank John Stauffer for his valuable comments on the manuscript. We thank also Satoshi Okuzumi for helpful discussions during the project. We thank Andrea Mignone for supporting and advising us with the newest PLUTO code. Parallel computations have been performed on the Genci supercomputer ’curie’ at the calculation center of CEA TGCC and on the zodiac supercomputer at JPL. For this work, Sebastien Fromang and Mario Flock received funding from the European Research Council under the European Union’s Seventh Framework Programme (FP7/2007-2013) / ERC Grant agreement nr. 258729. This research was carried out in part at the Jet Propulsion Laboratory, California Institute of Technology, under a contract with the National Aeronautics and Space Administration and with the support of the NASA Exoplanet Research program via grant 14XRP14_20153. Copyright 2016 California Institute of Technology. Government sponsorship acknowledged.
Appendices A A Comparison vs.
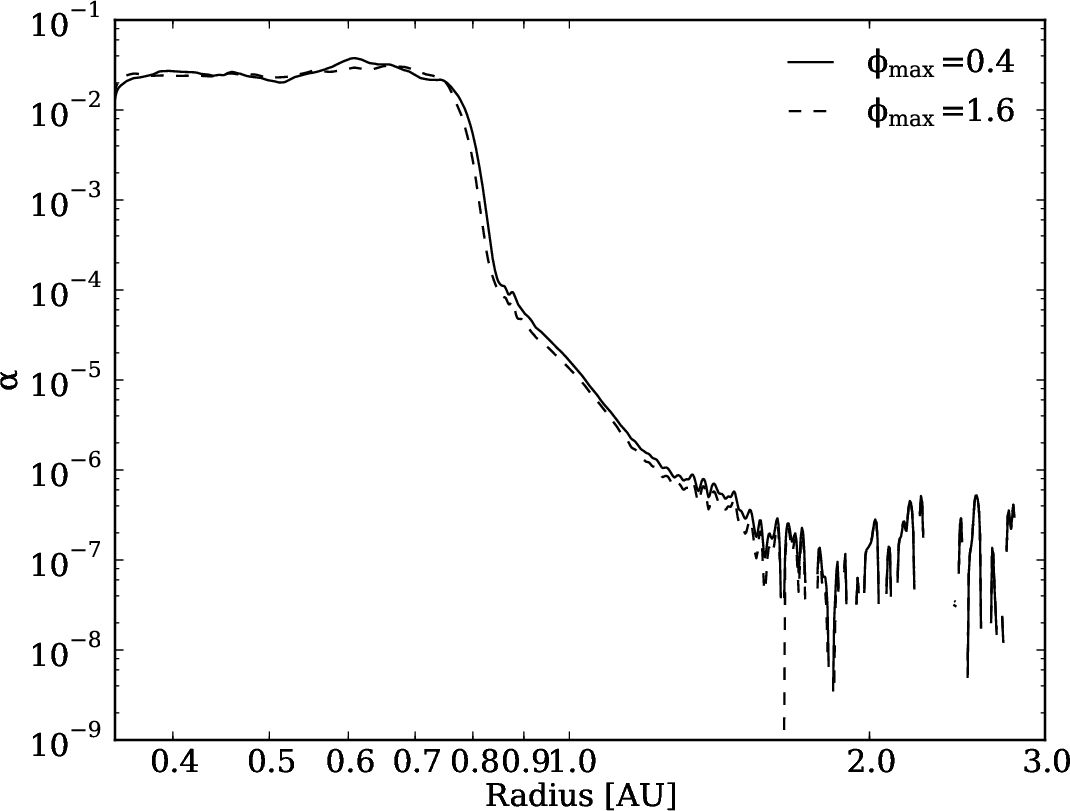
We previously reported stronger accretion stress in a smaller azimuthal domain due to stronger mean fields Flock et al. (2012b). Here we compare the two models with different azimuthal domains. In Fig. 19, left, we show the radial profiles of in the models RMHD_P0_4 and RMHD_P1_6 averaged over the same time period of 50 inner orbits. The two models present similar radial profiles with no significant differences. However, we note that we consider here a zero-net-flux field while a net-flux field was used in our previous simulations (Flock et al., 2012b). In addition, we think that the short azimuthal domain still can be an issue for the model RMHD_P0_4_BZ, which uses a net vertical flux field. Here, the mean field becomes nearly as large as the turbulent component (Section 3.3) which could be a sign that the azimuthal domain is too small.
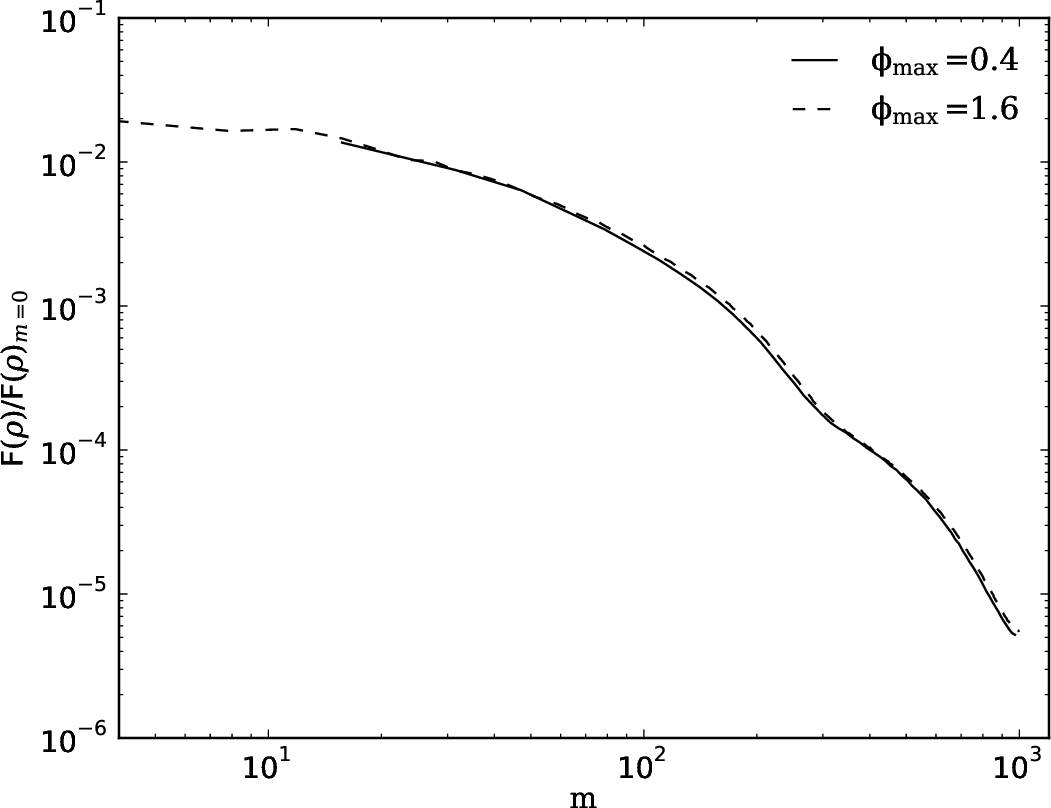
In Fig. 19, right, we take a final look at the density perturbations of model RMHD_P0_4 and RMHD_P1_6. Here, we calculate the Fourier transform of the density along azimuth at the midplane at 0.5 AU using the same time average as before. Fig. 19, right, shows that the profiles look very similar, from which we conclude that both models represent similar turbulent characteristics.
Appendices B B Generating initial magnetic field configurations
In the following steps we explain how to generate the initial random magnetic field. Such a field has the advantage that the MRI turbulence quickly reaches a steady-state.
-
1.
Calculate a random vector potential for the component with r being the radius, being a parabolic damping factor proportional to to set at the inner and outer radial boundary. is a parabolic factor which decreases the potential from the midplane to the boundary by the factor 50 to account for the decrease of the magnetic field in the disk corona.
-
2.
The amplitude of the vector potential is set to match a plasma beta value of 100 at the midplane.
-
3.
Apply a Gaussian filter () to smooth out fluctuations on grid level to obtain comparable scales as the turbulent field in the steady-state.
-
4.
Calculate to obtain an initial and .
It is important to define the vector potential with a periodic boundary condition in direction. Otherwise there will be a violation of the condition at the boundary. Initially the amplitudes of and are equal. A snapshot of the initial magnetic field is shown in Fig. 1.
For model RMHD_P0_4_BZ, we add to the vector potential a constant value of . The value of is chosen to match a magnetic field strength of 100 mGauss at 1 AU, which corresponds to a plasma beta of at 1 AU at the midplane. The resulting vertical field has a radial profile of . The strength of the field corresponds to a relative high value of vertical magnetic flux (Okuzumi et al., 2014).
Appendices C C Wave damping at the dead-zone inner edge
There are several damping mechanisms for the density waves, generated in the MRI turbulent regions and which are traveling into the dead-zone. The most important one is the non-linear damping by shocks as soon as the wavelength is comparable to the disk scale height (Heinemann & Papaloizou, 2009b). A similar wave dissipation by weak shocking in the dead-zone was found in global MHD simulations at the inner dead-zone edge by Faure et al. (2014b). One difference, to previous simulations is the fact that the local H/R is much smaller, meaning that waves traveling over a given radial distance are stronger damped. Another difference is the radial changing thermal diffusion. The density waves travel through a region with increasing surface density, and so increased optical thickness. At the same time, in this region the MRI is switched of and there is no excitation of density waves anymore.
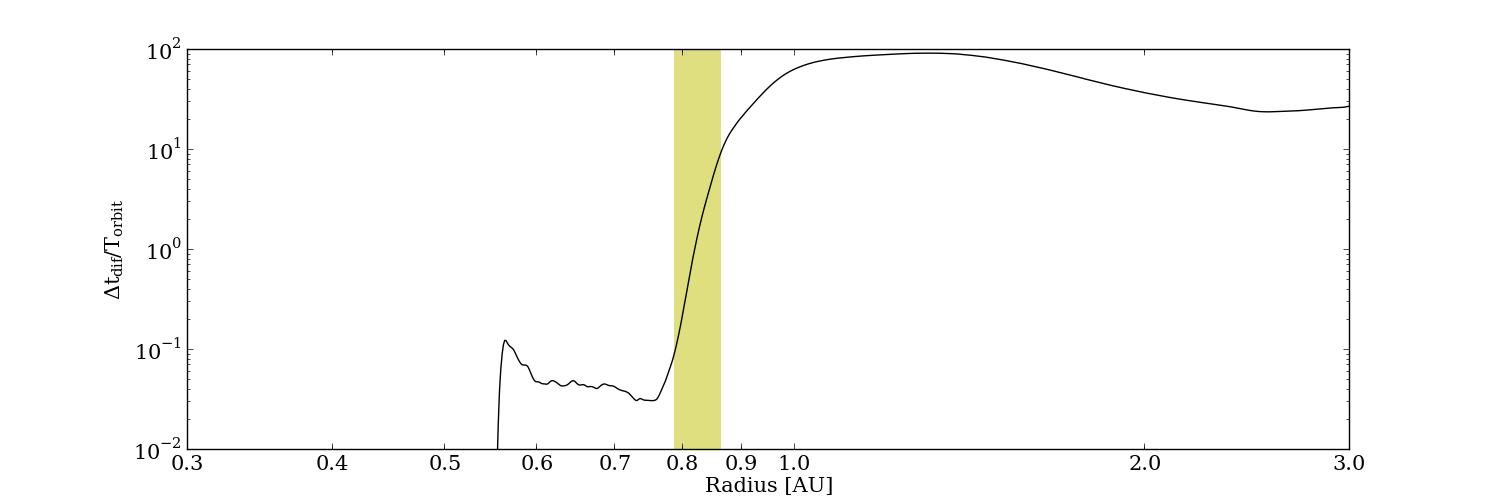
The efficiency of wave damping by thermal diffusion is highest if the diffusion timescale is comparable with the typical timescale of the density wave. The turbulent correlation time of the MRI is roughly one tenths of the orbital period for lengthscales comparable to H. At the same time, Heinemann & Papaloizou (2009b) report that the largest density waves fitting in the azimuthal domain carry most of the energy. The characteristic timescale of thermal diffusion can be estimated with the radiation diffusion in the gas pressure dominated regime (Flaig et al., 2010):
| (C1) |
with the characteristic lengthscale L, which we set to the disk scale height H. In Fig. 20 we plot the midplane diffusion timescale for this lengthscale, normalized over the dynamical timescale. The yellow bar marks the region in which the diffusion timescale becomes comparable to the dynamical timescale, for which we expect highest damping. The zone matches the region in which the Reynolds stress quickly drops.
We summarize that the combination of a small H/R and a thermal diffusion timescale comparable to the dynamical timescale at the dead-zone inner edge leads to an efficient damping of the density waves and so the Reynolds stress in the dead-zone.
Appendices D D RT setup and dust halo
We briefly summarize the setup for RADMC3D to post-process the 3D datasets. For the Monte-Carlo runs we use 210 million photon packages. We first transfer the grid values from the radiation MHD calculation to the RADMC grid structure. Then we re-calculate the thermal structure using the wavelength dependent dust opacity table. This ensures that the SED and the temperatures are consistent for the given dust opacity. For the dust opacity we assume the same grains size distribution as for the 2D models (Appendix A (Flock et al., 2016)). All grains have the same size distribution, including those in the dust halo in front of the dust rim. In reality, larger grains would be more likely to survive the hotter temperatures in front of the inner rim due to their higher emission to absorption ratio (Kama et al., 2009).
We have checked that the temperature of the Monte Carlo run and the global RMHD models match exactly at the inner rim. As we neglect the gas opacity in the Monte-Carlo runs, we observe small deviations in the temperature for the very optical thin layers of the global models. In addition, we have already shown in our previous models that the effect of the accretion heating remains small for these model parameters (Flock et al., 2016).
We want also to discuss again the dust halo which appears in our models (Flock et al., 2016). The main reason for this halo is the difference between the gas and dust temperatures in the optically thin environment. For the case , the dust starts to evaporate, however pure gas alone would lead to a temperature below the evaporation temperature. The solution is that a tiny amount of dust condenses to balance the temperature drop. The result is a small dust halo in which the temperature is close to the evaporation temperature. A similar result was found by Kama et al. (2009), however in their model, larger dust grains are responsible as they have a larger emission to absorption ratio and so survive in front of the rim. In our models, the gas component has a larger value which leads to a temperature which is cooler than dust in an optical thin environment.
Appendices E E MRI quality factor
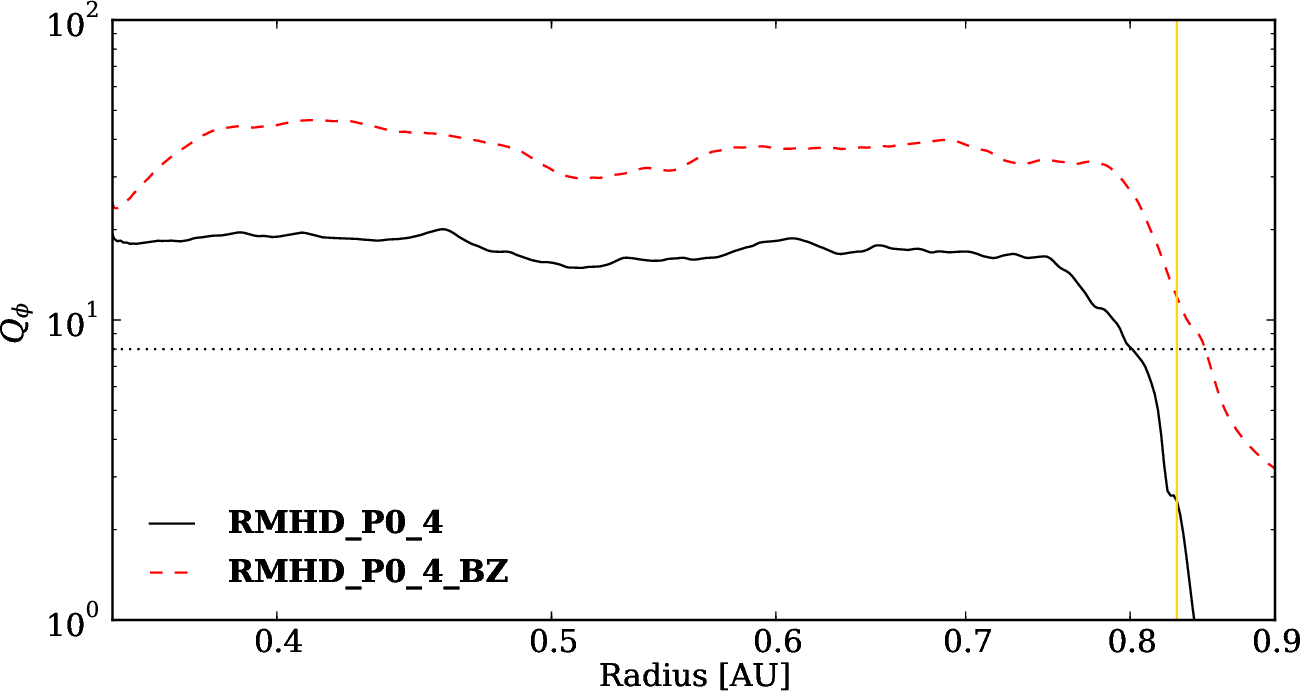
Following the work by Noble et al. (2010) and Sorathia et al. (2011) we determine the quality factor Q which shows the number of grid cells per fastest MRI growing mode. The quality factor for the azimuthal field is defined as
| (E1) |
In Fig. 21 we plot the quality factor for the models RMHD_P0_4 and RMHD_P0_4_BZ. Space and time averaging follows the same strategy as in Section 3.2 and 3.3. The plot shows that both models resolve very well the MRI in the region with high ionization with 16 or more grid cells per fastest-growing MRI wavelength. Model RMHD_P0_4_BZ shows a even higher quality factor due to the stronger field (Figs. 6 and 7).
References
- Acke et al. (2009) Acke, B., Min, M., van den Ancker, M. E., et al. 2009, A&A, 502, L17
- Alencar et al. (2010) Alencar, S. H. P., Teixeira, P. S., Guimarães, M. M., et al. 2010, A&A, 519, A88
- Ansdell et al. (2016) Ansdell, M., Gaidos, E., Williams, J. P., et al. 2016, MNRAS, 462, L101
- Bai & Stone (2013) Bai, X.-N. & Stone, J. M. 2013, ApJ, 767, 30
- Balbus & Hawley (1991) Balbus, S. A. & Hawley, J. F. 1991, ApJ, 376, 214
- Bans & Königl (2012) Bans, A. & Königl, A. 2012, ApJ, 758, 100
- Benisty et al. (2011) Benisty, M., Renard, S., Natta, A., et al. 2011, A&A, 531, A84
- Bertout (2000) Bertout, C. 2000, A&A, 363, 984
- Bitsch et al. (2014) Bitsch, B., Morbidelli, A., Lega, E., Kretke, K., & Crida, A. 2014, A&A, 570, A75
- Bouvier et al. (2013) Bouvier, J., Grankin, K., Ellerbroek, L. E., Bouy, H., & Barrado, D. 2013, A&A, 557, A77
- Brandenburg et al. (1995) Brandenburg, A., Nordlund, A., Stein, R. F., & Torkelsson, U. 1995, ApJ, 446, 741
- Carpenter et al. (2001) Carpenter, J. M., Hillenbrand, L. A., & Skrutskie, M. F. 2001, AJ, 121, 3160
- Chatterjee & Tan (2014) Chatterjee, S. & Tan, J. C. 2014, ApJ, 780, 53
- Chiang et al. (2001) Chiang, E. I., Joung, M. K., Creech-Eakman, M. J., et al. 2001, ApJ, 547, 1077
- Cody et al. (2014) Cody, A. M., Stauffer, J., Baglin, A., et al. 2014, AJ, 147, 82
- Davis et al. (2010) Davis, S. W., Stone, J. M., & Pessah, M. E. 2010, ApJ, 713, 52
- Decampli et al. (1978) Decampli, W. M., Cameron, A. G. W., Bodenheimer, P., & Black, D. C. 1978, ApJ, 223, 854
- Desch & Turner (2015) Desch, S. J. & Turner, N. J. 2015, ApJ, 811, 156
- Dong (2015) Dong, R. 2015, ApJ, 810, 6
- Dullemond (2012) Dullemond, C. P. 2012, RADMC-3D: A multi-purpose radiative transfer tool, astrophysics Source Code Library
- Dullemond & Monnier (2010) Dullemond, C. P. & Monnier, J. D. 2010, ARA&A, 48, 205
- Dzyurkevich et al. (2010) Dzyurkevich, N., Flock, M., Turner, N. J., Klahr, H., & Henning, T. 2010, A&A, 515, A70
- Faure et al. (2014a) Faure, J., Fromang, S., latter, H., & Meheut, H. 2014a, ArXiv e-prints
- Faure et al. (2014b) Faure, J., Fromang, S., & Latter, H. N. 2014b, ArXiv e-prints
- Flaig et al. (2010) Flaig, M., Kley, W., & Kissmann, R. 2010, MNRAS, 409, 1297
- Flock et al. (2012a) Flock, M., Dzyurkevich, N., Klahr, H., Turner, N., & Henning, T. 2012a, ApJ, 744, 144
- Flock et al. (2011) Flock, M., Dzyurkevich, N., Klahr, H., Turner, N. J., & Henning, T. 2011, ApJ, 735, 122
- Flock et al. (2013) Flock, M., Fromang, S., González, M., & Commerçon, B. 2013, A&A, 560, A43
- Flock et al. (2016) Flock, M., Fromang, S., Turner, N. J., & Benisty, M. 2016, ArXiv e-prints
- Flock et al. (2012b) Flock, M., Henning, T., & Klahr, H. 2012b, ApJ, 761, 95
- Flock et al. (2015) Flock, M., Ruge, J. P., Dzyurkevich, N., et al. 2015, A&A, 574, A68
- Fromang et al. (2013) Fromang, S., Latter, H., Lesur, G., & Ogilvie, G. I. 2013, A&A, 552, A71
- Fromang & Nelson (2006) Fromang, S. & Nelson, R. P. 2006, A&A, 457, 343
- Gammie (1996) Gammie, C. F. 1996, ApJ, 457, 355
- Gressel (2010) Gressel, O. 2010, MNRAS, 404
- Gressel et al. (2012) Gressel, O., Nelson, R. P., & Turner, N. J. 2012, MNRAS, 422, 1140
- Haghighipour & Boss (2003) Haghighipour, N. & Boss, A. P. 2003, ApJ, 583, 996
- Heinemann & Papaloizou (2009a) Heinemann, T. & Papaloizou, J. C. B. 2009a, MNRAS, 397, 52
- Heinemann & Papaloizou (2009b) Heinemann, T. & Papaloizou, J. C. B. 2009b, MNRAS, 397, 64
- Hillenbrand et al. (1992) Hillenbrand, L. A., Strom, S. E., Vrba, F. J., & Keene, J. 1992, ApJ, 397, 613
- Hirose & Turner (2011) Hirose, S. & Turner, N. J. 2011, ApJ, 732, L30
- Hu et al. (2015) Hu, X., Zhu, Z., Tan, J. C., & Chatterjee, S. 2015, ArXiv e-prints
- Isella & Natta (2005) Isella, A. & Natta, A. 2005, A&A, 438, 899
- Jin (1996) Jin, L. 1996, ApJ, 457, 798
- Joy (1945) Joy, A. H. 1945, ApJ, 102, 168
- Kama et al. (2009) Kama, M., Min, M., & Dominik, C. 2009, A&A, 506, 1199
- Kraus (2015) Kraus, S. 2015, Ap&SS, 357, 97
- Kretke & Lin (2012) Kretke, K. A. & Lin, D. N. C. 2012, ApJ, 755, 74
- Kretke et al. (2009) Kretke, K. A., Lin, D. N. C., Garaud, P., & Turner, N. J. 2009, ApJ, 690, 407
- Lesur et al. (2014) Lesur, G., Kunz, M. W., & Fromang, S. 2014, A&A, 566, A56
- Lesur & Ogilvie (2008) Lesur, G. & Ogilvie, G. I. 2008, A&A, 488, 451
- Lesur & Papaloizou (2009) Lesur, G. & Papaloizou, J. C. B. 2009, A&A, 498, 1
- Lovelace et al. (1999) Lovelace, R. V. E., Li, H., Colgate, S. A., & Nelson, A. F. 1999, ApJ, 513, 805
- Lyra et al. (2008) Lyra, W., Johansen, A., Klahr, H., & Piskunov, N. 2008, A&A, 479, 883
- Lyra & Mac Low (2012) Lyra, W. & Mac Low, M.-M. 2012, ArXiv e-prints
- Masset et al. (2006) Masset, F. S., Morbidelli, A., Crida, A., & Ferreira, J. 2006, ApJ, 642, 478
- Matsumura et al. (2009) Matsumura, S., Pudritz, R. E., & Thommes, E. W. 2009, ApJ, 691, 1764
- Meeus et al. (2001) Meeus, G., Waters, L. B. F. M., Bouwman, J., et al. 2001, A&A, 365, 476
- Meheut et al. (2012) Meheut, H., Keppens, R., Casse, F., & Benz, W. 2012, A&A, 542, A9
- Meheut et al. (2013) Meheut, H., Lovelace, R. V. E., & Lai, D. 2013, MNRAS, 430, 1988
- Millan-Gabet et al. (2001) Millan-Gabet, R., Schloerb, F. P., & Traub, W. A. 2001, ApJ, 546, 358
- Miller & Stone (2000) Miller, K. A. & Stone, J. M. 2000, ApJ, 534, 398
- Miyake et al. (2016) Miyake, T., Suzuki, T. K., & Inutsuka, S.-i. 2016, ApJ, 821, 3
- Morales-Calderón et al. (2011) Morales-Calderón, M., Stauffer, J. R., Hillenbrand, L. A., et al. 2011, ApJ, 733, 50
- Mulders & Dominik (2012) Mulders, G. D. & Dominik, C. 2012, A&A, 539, A9
- Noble et al. (2010) Noble, S. C., Krolik, J. H., & Hawley, J. F. 2010, ApJ, 711, 959
- Okuzumi & Hirose (2011) Okuzumi, S. & Hirose, S. 2011, ApJ, 742, 65
- Okuzumi et al. (2014) Okuzumi, S., Takeuchi, T., & Muto, T. 2014, ApJ, 785, 127
- Parkin & Bicknell (2013) Parkin, E. R. & Bicknell, G. V. 2013, ArXiv e-prints
- Pollack et al. (1994) Pollack, J. B., Hollenbach, D., Beckwith, S., et al. 1994, ApJ, 421, 615
- Sano & Stone (2002) Sano, T. & Stone, J. M. 2002, ApJ, 577, 534
- Simon et al. (2009) Simon, J. B., Hawley, J. F., & Beckwith, K. 2009, ApJ, 690, 974
- Simon et al. (2011) Simon, J. B., Hawley, J. F., & Beckwith, K. 2011, ApJ, 730, 94
- Sitko et al. (2012) Sitko, M. L., Day, A. N., Kimes, R. L., et al. 2012, ApJ, 745, 29
- Sorathia et al. (2011) Sorathia, K. A., Reynolds, C. S., Stone, J. M., & Beckwith, K. 2011, ArXiv e-prints
- Stauffer et al. (2016) Stauffer, J., Cody, A. M., Rebull, L., et al. 2016, AJ, 151, 60
- Stone et al. (1996) Stone, J. M., Hawley, J. F., Gammie, C. F., & Balbus, S. A. 1996, ApJ, 463, 656
- Suzuki & Inutsuka (2014) Suzuki, T. K. & Inutsuka, S.-i. 2014, ApJ, 784, 121
- Suzuki et al. (2010) Suzuki, T. K., Muto, T., & Inutsuka, S. 2010, ApJ, 718, 1289
- Turner et al. (2014a) Turner, N. J., Benisty, M., Dullemond, C. P., & Hirose, S. 2014a, ApJ, 780, 42
- Turner et al. (2014b) Turner, N. J., Fromang, S., Gammie, C., et al. 2014b, ArXiv e-prints
- Turner et al. (2007) Turner, N. J., Sano, T., & Dziourkevitch, N. 2007, ApJ, 659, 729
- Umebayashi & Nakano (1988) Umebayashi, T. & Nakano, T. 1988, Progress of Theoretical Physics Supplement, 96, 151
- Vinković et al. (2006) Vinković, D., Ivezić, Ž., Jurkić, T., & Elitzur, M. 2006, ApJ, 636, 348
- Wagner et al. (2015) Wagner, K. R., Sitko, M. L., Grady, C. A., et al. 2015, ApJ, 798, 94
- Wisniewski et al. (2008) Wisniewski, J. P., Clampin, M., Grady, C. A., et al. 2008, ApJ, 682, 548