22institutetext: Key Laboratory of Modern Astronomy and Astrophysics (Nanjing University), Ministry of Education, Nanjing 210093, PR China
Quasi-periodic pulsations with periods that change depending on whether the pulsations have thermal or nonthermal components
Abstract
Context. Quasi-periodic pulsations (QPPs) typically display periodic and regular peaks in the light curves during the flare emissions. Sometimes, QPPs show multiple periods at the same wavelength. However, changing periods in various channels are rare.
Aims. We report QPPs in a solar flare on 2014 October 27. They showed a period change that depended on whether thermal or nonthermal components were included. The flare was simultaneously observed by many instruments.
Methods. Using the fast Fourier transform (FFT), we decomposed the light curves at multiple wavelengths into slowly varying and rapidly varying signals. Then we identified the QPPs as the regular and periodic peaks from the rapidly varying signals. The periods are derived with the wavelet method and confirmed based on the FFT spectra of the rapidly varying signals.
Results. We find a period of 50 s from the thermal emissions during the impulsive phase of the flare, that is, in the soft X-ray bands. At the same time, a period of about 100 s is detected from the nonthermal emissions, such as hard X-ray and microwave channels. The period ratio is exactly 2.0, which might be due to the modulations of the magnetic reconnection rate by the fundamental and harmonic modes of magnetohydrodynamic waves. Our results further show that the 100 s period is present over a broad wavelength, such as hard X-rays, extreme-UV/UV, and microwave emissions, indicating the periodic magnetic reconnection in this flare.
Conclusions. To our knowledge, this is the first report about period changes from thermal to nonthermal components in a single flare that occur at almost the same time. This new observational finding could be a challenge to the theory of flare QPPs.
Key Words.:
Sun: flares —Sun: oscillations — Sun: radio radiation — Sun: UV radiation — Sun: X-rays, gamma rays1 Introduction
Quasi-periodic pulsations (QPPs) are very common features in flare emissions. They typically exhibit periodic peaks in the light curves. All these peaks have similar lifetimes, which results in regular intervals between the peaks. The observed periods can last from milliseconds through seconds to minutes (e.g., Hoyng et al., 1976; Karlický et al., 2005; Tan et al., 2010; Su et al., 2012; Ning, 2014; Li et al., 2015; Zhang et al., 2016). Previous observations indicated that the periods of these flares are strongly dependent on the major radius of flare loops (Aschwanden et al., 1998). On the other hand, QPPs can be detected in intensity (or flux) observations at wide bands, that is, in X-rays (Hoyng et al., 1976; Dolla et al., 2012; Ning, 2014; Hayes et al., 2016) from extreme-ultraviolet (EUV) (Su et al., 2012) to microwave (Mangeney & Pick, 1989; Tan et al., 2010) emissions. QPPs can also be observed in Doppler shifts in spectral observations, such as the hot (6 MK) lines observed by SOHO/SUMER (Ofman & Wang, 2002; Wang et al., 2002), the coronal lines from Hinode/EIS (Tian et al., 2011), and the flare and transition lines from IRIS observations (Li et al., 2015; Li & Zhang, 2015; Tian et al., 2016). Sometimes, QPPs in the same flare display multiple periods (Inglis & Nakariakov, 2009), and these multi-periods are often detected at the same channels, that is, in sof X-ray (SXR) (Chowdhury et al., 2015), EUV (Su et al., 2012; Tian et al., 2016), H (Srivastava et al., 2008; Yang & Xiang, 2016), and microwave (Melnikov et al., 2005; Kupriyanova et al., 2014) channels. Multi-periods are also found at various channels but in different flare loops (Zimovets & Struminsky, 2010) or phases (Hayes et al., 2016; Tian et al., 2016). All these period ratios are always deviating from 2.0.
Today, the formation mechanism of QPPs is still debated (e.g., Aschwanden, 1987; Nakariakov & Melnikov, 2009; Van Doorsselaere et al., 2016). Generally, QPPs are thought to be related with waves or energetic particles (electrons). Magnetohydrodynamic (MHD) waves are most frequently used to explain QPPs. These include slow magnetoacoustic, fast kink, and sausage waves (Nakariakov & Melnikov, 2009; Tan et al., 2010; Su et al., 2012). QPPs can also be explained by quasi-periodic magnetic reconnection (Nakariakov & Melnikov, 2009; Li et al., 2015; Li & Zhang, 2015). The periods can be spontaneous (Kliem et al., 2000; Murray et al., 2009) or may be modulated by some MHD waves (Chen & Priest, 2006; Nakariakov & Zimovets, 2011; Li et al., 2015).
Until now, QPPs in a flare that have periods that change in different channels have rarely been simultaneously observed with different instruments. We here analyze QPPs with changing periods in a solar flare on 2014 October 27, which was detected by The Reuven Ramaty High Energy Solar Spectroscopic Imager (RHESSI) (Lin et al., 2002), the Atmospheric Imaging Assembly (AIA) (Lemen et al., 2012) onboard Solar Dynamics Observatory (SDO), Nobeyama Radio Polarimeters (NoRP) (Nakajima et al., 1985), and the Nobeyama Radioheliograph (NoRH) (Hanaoka et al., 1994) in the SXR, HXR, EUV/UV, and microwave channels.
2 Observations and results
We explore an M7.1 flare that erupted in NOAA AR12192 (S12W42). It started at 00:06 UT, peaked at 00:34 UT, and stopped at 00:44 UT according to the GOES SXR flux. This flare was detected by many instruments over a broad channel with various temporal resolution, as shown in Table 1. Figure 1 displays the normalized light curves and images detected by GOES, RHESSI, SDO, NoRP, and NoRH. The black profile in panel (a) shows the GOES SXR flux at 18 Å, which clearly shows two peaks at about 00:26 UT and 00:34 UT, indicating two heating processes during the impulsive phase of the flare (see also Chen et al., 2015; Polito et al., 2016). Panel (a) also displays the light curves from RHESSI 36 keV (turquoise) and 1225 keV (orange), AIA 94 Å (purple), and 1700 Å (blue). Panel (b) shows the HXR flux at 2550 keV (blue), microwave emissions from NoRP 17 GHz (orange), and NoRH 34 GHz (red). These three light curves in panel (b) seem to be well correlated and have similar peaks during the impulsive phase of the flare; see also Table 1. The reference channel is HXR emissions at 2550 keV. Table 1 gives the correlation coefficients (c.c.) between the light curves at HXR 2550 keV and other channels. Most of the coefficients are higher than 0.8. However, the coefficient between the flux at AIA 94 Å is slightly lower, only about 0.57. The reason might be that the heating process at AIA 94 Å occurs later than that at other channels. Figure 1 (a) also shows that the peak time of AIA 94 Å is later than others, that is, later than GOES 18 Å and AIA 1700 Å. In order to clearly show the light curves, the solid profiles in panels (a) and (b) work with the left axes, while the dashed profiles correspond to the right axes.
| Instruments | Channels | Cadence (s) | Descriptions | c.c. |
| 36 keV | 4.0 | SXR | 0.88 | |
| RHESSI | 1225 keV | 4.0 | SXR/HXR | 0.92 |
| 2550 keV | 4.0 | HXR | 1.0 | |
| GOES | 18 Å | 2.0 | SXR | 0.82 |
| NoRP | 17 GHz | 1.0 | Microwave | 0.81 |
| NoRH | 34 GHz | 1.0 | Microwave | 0.82 |
| 94 Å | 12 | EUV | 0.57 | |
| SDO/AIA | 1700 Å | 24 | UV | 0.86 |
| SDO/HMI | 6173 Å | 45 | magnetogram | – |
Figure 1 (c)(f) shows the AIA images with a size of about 115″105″ at 94 Å and 1700 Å from two peak times marked by the vertical ticks in panel (a). The light curves at 94 and 1700 Å in panel (a) are integrated from the all flare regions. The color contours in panels (c) and (e) represent the RHESSI SXR/HXR images using the CLEAN algorithm from detectors 3, 4, 5, 6, and 8, while the color contours in panels (d) and (f) are from the SDO/HMI line-of-sight (LOS) magnetograms at a scale of 800 G for positive (turquoise) and negative (yellow) fields, respectively. The imaging observations show that the flare has complex ribbons and the HXR sources are located between two of them. This M7.1 flare is also associated with strong magnetic fields that were connected by the positive and negative poles.
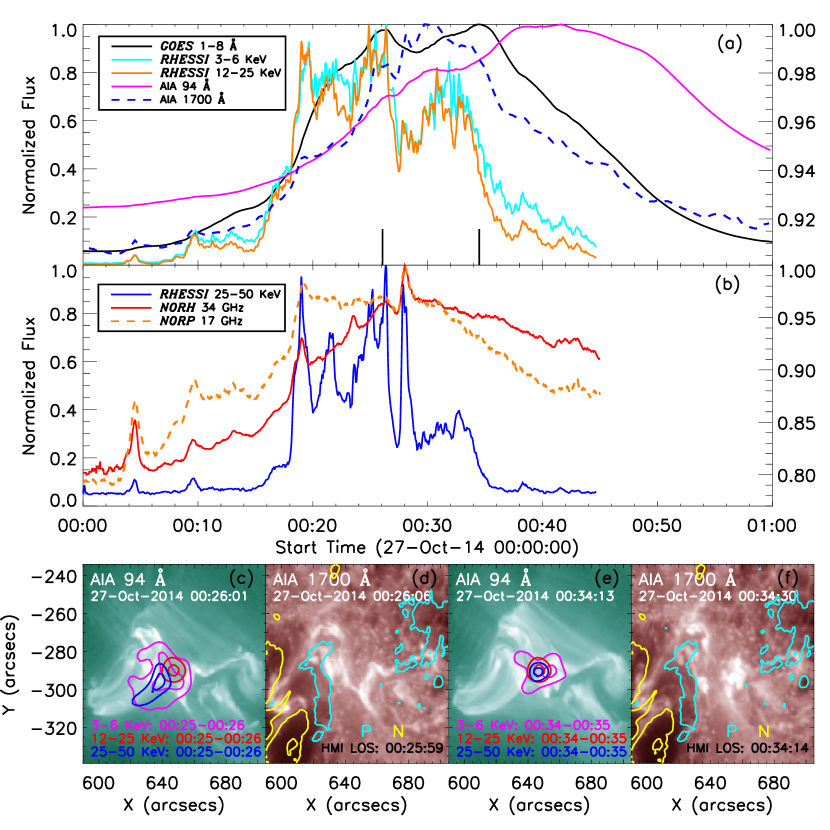
Figure 1 (b) shows several peaks during the impulsive phase of the flare in HXR and microwave light curves between 00:18 UT and 00:28 UT. These peaks appear to be regular and periodic, but they are superposed by the gradual background emissions, which makes them difficult to distinguished. Therefore, these light curves were decomposed into the slowly varying and rapidly varying signals with the Fourier transform. First, the power spectrum of the light curve was calculated using the fast Fourier transform (FFT). Second, the power spectrum was split into domains with lower and higher frequency. Third, the inverse FFT was applied to these two domains to obtain the slowly varying (background) and rapidly varying (quasi-periodic peaks) signals (see also Ning, 2014; Ning & Guo, 2014). Here, a uniform timescale of 120 s was used to distinguish these two signals for all the observation data.
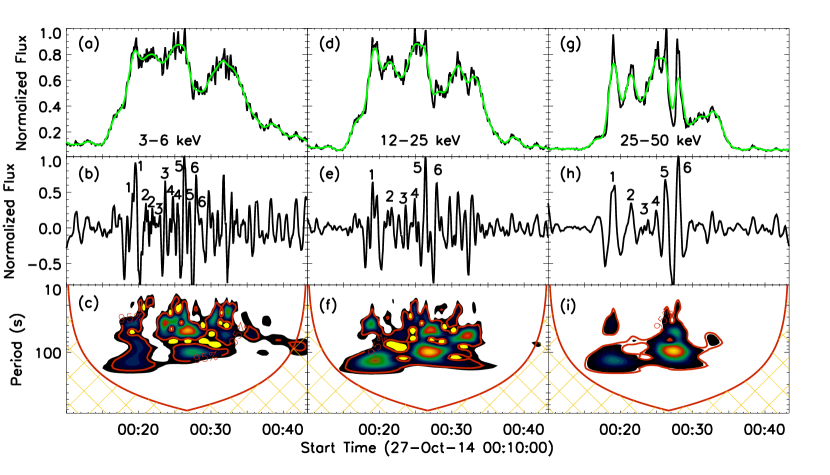
Figure 2 (a, d, and g) shows the slowly varying signals (green profiles) that overlap the X-ray light curves at three energy channels from RHESSI. The middle panels display their rapidly varying signals. In order to make the rapidly varying signal more, it was normalized by its slowly varying signal (see also Kupriyanova et al., 2010, 2013). The period is clearly identified in the higher energy channel, that is, 2550 keV. Panel (h) clearly shows 6 peaks (as marked by the numbers) from around 00:18 UT to 00:28 UT (600 s), which means that the period is about 100 s at this channel. Then we applied a wavelet analysis to the rapidly varying signals, and we show the results in the bottom panels. The wavelet results further confirm the period of about 100 s at the higher energy, see panel (i). However, at the lower energy (36 keV), there are more peaks and their intervals are shorter, that is, 12 peaks from about 00:18 UT to 00:28 UT, and some peaks are weaker than others. The wavelet results show a period of 50 s, as shown in panel (c), which is twice lower than the period at the higher energy. It is interesting that both the periods of 50 s and 100 s are detected in the medium-energy channel, that is, 1225 keV, as shown in panel (f). Panel (e) also shows that there are 6 main peaks in the rapidly varying signals at 1225 keV, as indicted by the numbers. Meanwhile, there are double subpeaks at almost every main peak. This is possible because the emissions from this channel include both thermal and nonthermal components. Therefore, periods of both 50 s and 100 s are displayed in this channel. To our knowledge, this is the first time that changing periods in a flare are reported that change from the thermal components (SXR emissions) to the nonthermal components (HXR emissions) at almost the same time.
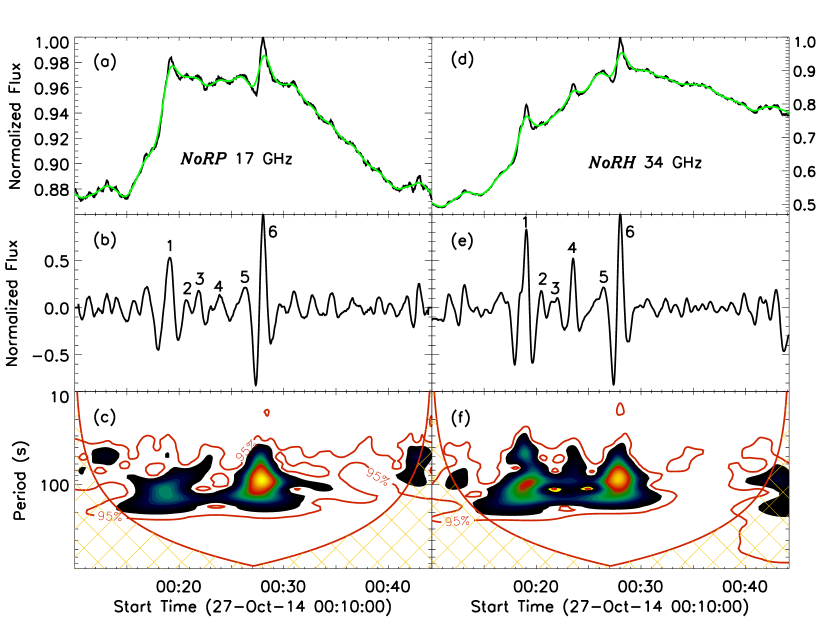
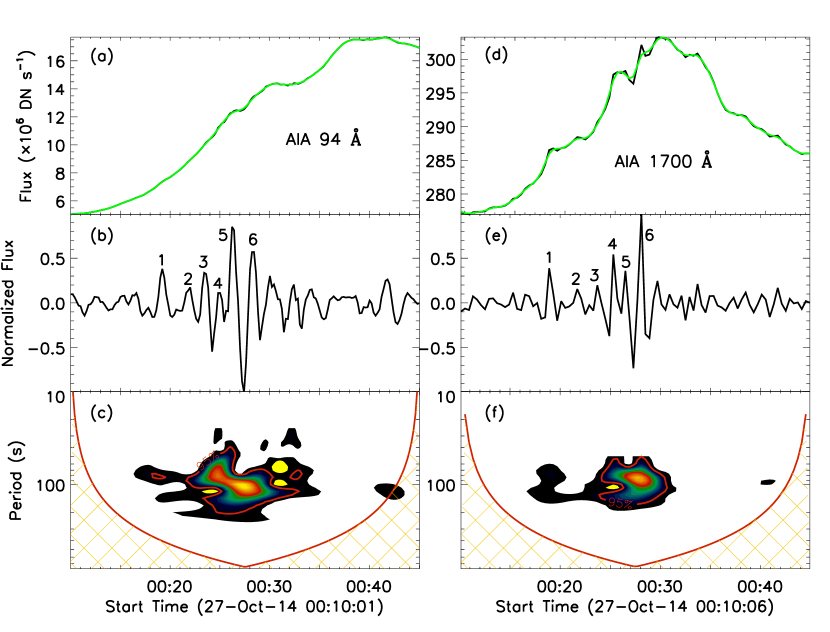
Except for the RHESSI HXR channels, the 100 s QPPs are also detected in microwave and EUV/UV emissions using the same method. Figure 3 shows the wavelet results from the microwave emissions at frequencies of 17 GHz and 34 GHz. The green profiles that overlap on the black profiles are the slowly varying signals using the Fourier transform (Ning, 2014; Ning & Guo, 2014). The rapidly varying signals and their wavelet power spectra are shown in the middle and bottom panels. Similar to the RHESSI HXR emissions, the microwave emissions at 17 GHz and 34 GHz exhibit the 100 s QPPs. All these emissions at HXR and microwave bands could be considered as the nonthermal components. Figure 4 shows the wavelet analysis results from the EUV/UV wavelengths at AIA 94 Å and 1700 Å. In the same way as in Fig. 3, the upper panels show the integrated intensity flux (black profiles) and their slowly varying signals (green profiles), and the integral region is shown in Fig. 1 (c), while the rapidly varying signals and their wavelet power spectra are shown in the middle and bottom panels. The same 100 s QPPs are found using the wavelet method. Figures 3 and 4 show that there are more than 6 peaks in some channels, and some peaks are out of the time between 00:18 UT and 00:28 UT; these are AIA 94 Å and RHESSI 1225 keV. However, only 6 main peaks are marked by the numbers from about 00:18 UT to 00:28 UT, which is exactly the HXR peak time during the impulsive phase of the flare. More important, these 6 peaks appear to match well in the HXR, microwave, and EUV/UV channels, as indicated by the number ticks.
3 Conclusions and discussions
We reported 100 s QPPs in the HXR, microwave, and EUV/UV channels and the 50 s QPPs in the SXR bands in the M7.1 flare on 2014 October 27. The result was obtained using the multi-instrument observations from RHESSI, NoRP, NoRH, and SDO/AIA. To our knowledge, this is the first report about periods in the same flare that change at almost the same time from nonthermal components to thermal components. We identified QPPs based on the rapidly varying signals that were obtained from the original light curves with the fast Fourier transform. Then the 100 s and 50 s QPPs were derived with the wavelet method. Based on this, the ratio between these two periods is 2.0. This is well consistent with the period ratio (2.0) between the fundamental and harmonic MHD waves.
It is very interesting that the changing periods are detected in the same flare at almost the same time and that the periods change from 50 s at the thermal components to 100 s at the nonthermal components. There have been some reports about multi-period QPPs in the same flare. However, these periods have always been detected in the same channels, that is, in SXR light curves (Chowdhury et al., 2015), EUV flux/spectra (Su et al., 2012; Tian et al., 2016), H images (Srivastava et al., 2008; Yang & Xiang, 2016), or microwave emissions (Melnikov et al., 2005; Kupriyanova et al., 2014). On the other hand, multiple periods have been detected in various channels, but these periods typically appeared at different times or loops, such as the impulsive and decay phases of the flare (Zimovets & Struminsky, 2010; Huang et al., 2014; Hayes et al., 2016; Tian et al., 2016). It is interesting that the period ratio is exactly 2.0. This could be interpreted as modulations in the magnetic reconnection rate that are caused by the fundamental and harmonic modes of the MHD waves. However, previous multi-period observations usually showed that the period ratio deviated from 2.0 (e.g., Srivastava et al., 2008; Chowdhury et al., 2015; Yang & Xiang, 2016), which may be due to the longitudinal density stratification (Andries et al., 2005), the loop expansion (Verth & Erdélyi, 2008), the siphon flow (Li et al., 2013), or the flare phase/loop differences (Zimovets & Struminsky, 2010; Tian et al., 2016; Hayes et al., 2016).
It is also interesting that the QPPs exhibit the same period of 100 s at a broad wavelength from HXR through EUV/UV to microwave emissions. Their radiation sources spread from the chromosphere through the transition region to the corona. It is still an open question what modulates the 100 s QPPs at such broad wavelengths. Three models have been presented in previous documents (e.g., Aschwanden, 1987): (i) MHD flux tube oscillations modulated by waves; (ii) periodic self-organizing systems of plasma instabilities of wave-particle or wave-wave interactions; and (iii) modulation of periodic particle acceleration. We here observed QPPs in the impulsive phase, which gives us a clue about how to explain the QPPs. It is generally thought that the magnetic reconnection process occurs in the impulsive phase. Thus, it is possible that the QPPs are produced by periodic magnetic reconnection in this flare. Based on the standard flare model, magnetic reconnection could simultaneously accelerate the bidirectional electron beams (Aschwanden et al., 1995; Su et al., 2013; Li et al., 2016). The downward beam produces the microwave emission peak in its trajectory propagation, it also produces one peak of the HXR emission when it is injected into the chromosphere, and this process will heat the local plasmas to produce one peak in the EUV/UV emission. In this case, the periodic magnetic reconnection can produce the QPPs peaks at HXR, EUV/UV, and microwave emissions. The period of 100 s could be modulated by certain MHD waves in the solar corona, such as the fast kink mode (Nakariakov et al., 2006; Nakariakov & Melnikov, 2009; Huang et al., 2014), or the slow sausage mode (Van Doorsselaere et al., 2011), which could modulate the period of around 100 s. However, it is difficult to determine the MHD waves in this flare because of the observation limitation, such as the absence of a three-dimensional magnetic configuration of the active regions.
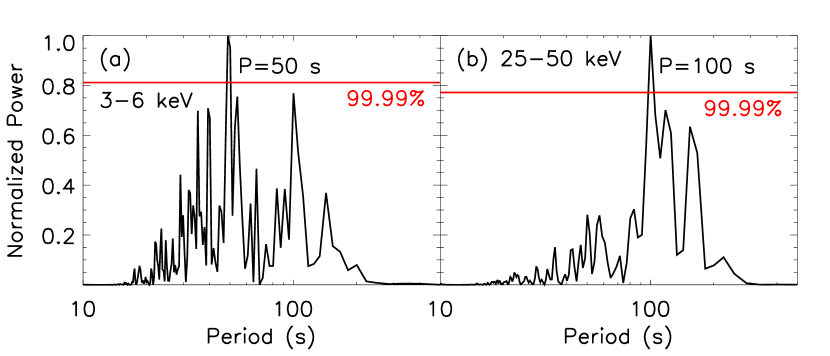
The wavelet spectra in Figs. 24 exhibit broad amplitudes with brightest cores and weaker borders, which may result in a fuzzy result for the QPP periods. To unambiguously conclude on the periods, we performed a periodogram analysis of the rapidly varying signals using the Lomb-Scargle periodogram method (Scargle, 1982). Figure 5 shows the FFT spectra at RHESSI 36 keV and 2550 keV, and the red line indicates the 99.99% confidence level defined by Horne & Baliunas (1986). We were easily able to detect the periods of 50 s and 100 s in the FFT spectra in the SXR and HXR channels, respectively. This additionally confirms that the periods change depending on the thermal or nonthermal emission.
Acknowledgements.
The authors would like to thank the anonymous referee for the valuable comments that improved the manuscript. We thank the teams of RHESSI, GOES, NoRP, NoRH, SDO/AIA, and SDO/HMI for their open-data use policy. This study is supported by NSFC under grants 11603077, 11573072, 11473071, 11303101, 11333009, 973 program (2014CB744200), and Laboratory No. 2010DP173032. This work is also supported by the Youth Fund of Jiangsu No. BK20161095 and BK20141043, and Y. N. Su is also supported by the one hundred talent program of the Chinese Academy of Sciences.References
- Andries et al. (2005) Andries, J., Arregui, I., & Goossens, M. 2005, ApJ, 624, L57
- Aschwanden (1987) Aschwanden, M. J. 1987, Sol. Phys., 111, 113
- Aschwanden et al. (1995) Aschwanden, M. J., Benz, A. O., Dennis, B. R., & Schwartz, R. A. 1995, ApJ, 455, 347
- Aschwanden et al. (1998) Aschwanden, M. J., Kliem, B., Schwarz, U., et al. 1998, ApJ, 505, 941
- Chen & Priest (2006) Chen, P. F., & Priest, E. R. 2006, Sol. Phys., 238, 313
- Chen et al. (2015) Chen, H., Zhang, J., Ma, S., et al. 2015, ApJ, 808, L24
- Chowdhury et al. (2015) Chowdhury, P., Srivastava, A. K., Dwivedi, B. N., Sych, R., & Moon, Y.-J. 2015, Advances in Space Research, 56, 2769
- Dolla et al. (2012) Dolla, L., Marqué, C., Seaton, D. B., et al. 2012, ApJ, 749, L16
- Hanaoka et al. (1994) Hanaoka, Y., Shibasaki, K., Nishio, M., et al. 1994, Proceedings of Kofu Symposium, 35
- Hayes et al. (2016) Hayes, L. A., Gallagher, P. T., Dennis, B. R., et al. 2016, ApJ, 827, L30
- Horne & Baliunas (1986) Horne, J. H., & Baliunas, S. L. 1986, ApJ, 302, 757
- Hoyng et al. (1976) Hoyng, P., & Brown, J. C., & van Beek, H. F. 1976, Sol. Phys., 48, 197
- Huang et al. (2014) Huang, J., Tan, B., Zhang, Y., Karlický, M., & Mészárosová, H. 2014, ApJ, 791, 44
- Inglis & Nakariakov (2009) Inglis, A. R., & Nakariakov, V. M. 2009, A&A, 493, 259
- Karlický et al. (2005) Karlický, M., & Bárta, M., & Mészárosová, H., & Zlobec, P. 2005, A&A, 432, 705
- Kliem et al. (2000) Kliem, B., & Karlický, M. & Benz, A. O. 2000, A&A, 360, 715
- Kupriyanova et al. (2010) Kupriyanova, E. G., Melnikov, V. F., Nakariakov, V. M., & Shibasaki, K. 2010, Sol. Phys., 267, 329
- Kupriyanova et al. (2013) Kupriyanova, E. G., Melnikov, V. F., & Shibasaki, K. 2013, Sol. Phys., 284, 559
- Kupriyanova et al. (2014) Kupriyanova, E. G., Melnikov, V. F., Puzynya, V. M., Shibasaki, K., & Ji, H. S. 2014, Astronomy Reports, 58, 573
- Lemen et al. (2012) Lemen, J. R., & Title, A. M., & Akin, D. J., et al. 2012, Sol. Phys., 275, 17
- Li et al. (2013) Li, B., Habbal, S. R., & Chen, Y. 2013, ApJ, 767, 169
- Li et al. (2015) Li, D., Ning, Z. J., & Zhang, Q. M. 2015, ApJ, 807, 72
- Li & Zhang (2015) Li, T., & Zhang, J. 2015, ApJ, 804, L8
- Li et al. (2016) Li, L., Zhang, J., Peter, H., et al. 2016, Nature Physics, 12, 847
- Lin et al. (2002) Lin, R. P., Dennis, B. R., Hurford, G. J., et al. 2002, Sol. Phys., 210, 3
- Mangeney & Pick (1989) Mangeney, A., & Pick, M. 1989, A&A, 224, 242
- Melnikov et al. (2005) Melnikov, V. F., Reznikova, V. E., Shibasaki, K., & Nakariakov, V. M. 2005, A&A, 439, 727
- Murray et al. (2009) Murray, M. J., van Driel-Gesztelyi, L., & Baker, D. 2009, A&A, 494, 329
- Nakariakov et al. (2006) Nakariakov, V. M., Foullon, C., Verwichte, E., & Young, N. P. 2006, A&A, 452, 343
- Nakariakov & Melnikov (2009) Nakariakov, V. M., & Melnikov, V. F. 2009, Space Sci. Rev., 149, 119
- Nakariakov & Zimovets (2011) Nakariakov, V. M., & Zimovets, I. V. 2011, ApJ, 730, L27
- Nakajima et al. (1985) Nakajima, H., Sekiguchi, H., Sawa, M., Kai, K., & Kawashima, S. 1985, PASJ, 37, 163
- Ning (2014) Ning, Z. J. 2014, Sol. Phys., 289, 1239
- Ning & Guo (2014) Ning, Z., & Guo, Y. 2014, ApJ, 794, 79
- Ofman & Wang (2002) Ofman, L., & Wang, T. J. 2002, ApJ, 580, L85
- Polito et al. (2016) Polito, V., Reep, J. W., Reeves, K. K., et al. 2016, ApJ, 816, 89
- Scargle (1982) Scargle, J. D. 1982, ApJ, 263, 835
- Srivastava et al. (2008) Srivastava, A. K., Zaqarashvili, T. V., Uddin, W., Dwivedi, B. N., & Kumar, P. 2008, MNRAS, 388, 1899
- Su et al. (2012) Su, J. T., & Shen, Y. D., & Liu, Y., et al. 2012, ApJ, 755, 113
- Su et al. (2013) Su, Y., Veronig, A. M., Holman, G. D., et al. 2013, Nature Physics, 9, 489
- Tan et al. (2010) Tan, B. L., & Zhang, Y., & Tan, C. M., & Liu, Y. Y. 2010, ApJ, 723, 25
- Tian et al. (2011) Tian, H., McIntosh, S. W., & De Pontieu, B. 2011, ApJ, 727, L37
- Tian et al. (2016) Tian, H., Young, P. R., Reeves, K. K., et al. 2016, ApJ, 823, L16
- Van Doorsselaere et al. (2011) Van Doorsselaere, T., De Groof, A., Zender, J., Berghmans, D., & Goossens, M. 2011, ApJ, 740, 90
- Van Doorsselaere et al. (2016) Van Doorsselaere, T., Kupriyanova, E. G., & Yuan, D. 2016, Sol. Phys.,
- Verth & Erdélyi (2008) Verth, G., & Erdélyi, R. 2008, A&A, 486, 1015
- Wang et al. (2002) Wang, T., Solanki, S. K., Curdt, W., Innes, D. E., & Dammasch, I. E. 2002, ApJ, 574, L101
- Yang & Xiang (2016) Yang, S., & Xiang, Y. 2016, ApJ, 819, L24
- Zhang et al. (2016) Zhang, Q. M., Li, D., & Ning, Z. J. 2016, arXiv:1609.03165
- Zimovets & Struminsky (2010) Zimovets, I. V., & Struminsky, A. B. 2010, Sol. Phys., 263, 163