Millimeter Spectral Line Mapping Observations Toward Four Massive Star Forming Hii Regions
Abstract
We present spectral line mapping observations toward four massive star-forming regions (Cepheus A, DR21S, S76E and G34.26+0.15), with the IRAM 30 meter telescope at 2 mm and 3 mm bands. Totally 396 spectral lines from 51 molecules, one helium recombination line, ten hydrogen recombination lines, and 16 unidentified lines were detected in these four sources. An emission line of nitrosyl cyanide (ONCN, 140,14-130,13) was detected in G34.26+0.15, as first detection in massive star-forming regions. We found that the -C3H2 and NH2D show enhancement in shocked regions as suggested by evidences of SiO and/or SO emission. Column density and rotational temperature of CH3CN were estimated with the rotational diagram method for all four sources. Isotope abundance ratios of 12C/13C were derived using HC3N and its 13C isotopologue, which were around 40 in all four massive star-forming regions and slightly lower than the local interstellar value (65). 14N/15N and 16O/18O abundance ratios in these sources were also derived using double isotopic method, which were slightly lower than that in local interstellar medium. Except for Cep A, 33S/34S ratio in the other three targets were derived, which were similar to that in the local interstellar medium. The column density ratios of N(DCN)/N(HCN) and N(DCO+)/N(HCO+) in these sources were more than two orders of magnitude higher than the elemental [D]/[H] ratio, which is 1.510-5. Our results show the later stage sources, G34.26+0.15 in particular, present more molecular species than earlier stage ones. Evidence of shock activity is seen in all stages studied.
keywords:
Submillimeter: stars, Stars: formation, Stars: massive, Stars: winds, outflows, Radio lines: Stars, ISM: clouds1 Introduction
Massive stars play an important role in galaxy evolution. The formation of massive stars is difficult to study due to large distances, complex cluster environments and rapid time scales in evolution (e.g., Zinnecker & Yorke, 2007; Herbst & van Dishoeck, 2009). Massive star formation involves different physical and astro-chemical properties in various evolutionary stages, i.e., starless cores, Hot Molecular Cores (HMCs), Hyper-Compact Hii (HCHii ), Ultra Compact Hii (UCHii ), Compact Hii (CHii ) and evolved Hii regions (Kurtz et al., 2000; Churchwell, 2002). Feedback from massive stars in turn affects surrounding molecular clouds through energetic stellar winds, powerful outflows, UV radiation, expansion of Hii regions, and supernova explosions (Kennicutt, 1998). Emissions of radio continuum and recombination lines have been used to investigate HCHii, UCHii and Hii regions (Churchwell, 2002). Molecular probes are also essential for investigating the physical and chemical conditions of massive star-forming regions (e.g, temperature, density, radiation field, etc.). They are also utilized to study chemical evolution in massive star formation regions (van Dishoeck & Blake, 1998).
Millimetre wavelength window is important for studying massive star formation, because it contains many useful molecular probes, such as shock tracers: SiO, SO, HNCO and H2CO (Schilke et al., 1997; Esplugues et al., 2013; Rizzo et al., 2005), long carbon chain molecules: -C3H2, HC3N, and HC5N (Morris et al., 1977; Chung et al., 1991; Bergin et al., 1996), deuterated molecules: DCN, DCO+, C2D, and NH2D (Shah & Wootten, 2001; Pety et al., 2007; Parise et al., 2009), and dense gas traces: HCN, HCO+, CS and C2H (Padovani et al., 2009), etc.
The various molecules can probe different physical and chemical components. Thus, molecular tracers offer a powerful tool for investigating the physical and chemical conditions of star-forming regions. Studying the physical and chemical evolutions in various scales are essential to developing a picture of massive star formation, and are the main focus of this study. To achieve these main goals, we mapping four massive star formation regions, at different evolutionary stages from HCHii to Hii, with total 11.8 GHz bandwidth coverage.
In this paper we present observational results of four massive star-forming regions, which were carried out by the IRAM 30m telescope. In Section 2, we describe the observations and the data reduction. Observational results, including molecular lines, velocity-integrated maps of molecular lines, isotope abundance ratios and long carbon chain molecules, which are introduced in Section 3. In Section 4, we derive the rotational temperature and column density of CH3CN for each source, and investigating the properties of shocked region with shock tracers and deuterated molecules. A brief summary is given in Section 5.
2 Source selection and Observations
2.1 Sources
We select four well studied massive star formation regions from Wu et al. (2010), which are representative of different evolutionary stages. Cepheus A (hereafter Cep A), DR21S, G34.26+0.15 (hereafter G34) and S76E lie at different distances from 0.7 kpc to 3.3 kpc, and associated with HCHii (Hughes & Wouterloot, 1984), cometary shaped Hii (Immer et al., 2014), CHii (Reid & Ho, 1985; Mookerjea et al., 2007) and an extended Hii regions (Li et al., 2012), respectively, according to radio observations. These regions provide ideal laboratories to study the properties of massive star-forming regions with mapping observations, since they are high mass and luminosity.
Cep A molecular cloud complex is the second nearest star formation region after the Orion complex, located at a distance of 70040 pc (Moscadelli et al., 2009). Herbig-Haro objects (Hartigan et al., 1986), HCHii regions (Hughes & Wouterloot, 1984), and two bipolar molecular outflow aligned east-west and northeast-southwest (NE-SW) (Rodriguez et al., 1980; Gómez et al., 1999) have been detected in Cep A. The bolometric luminosity of this region is 2.5 104 L⊙ with a mass of 330 M⊙ (Evans et al., 1981; Narayanan & Walker, 1996). Our mapping centre of Cep A locates in the radio source HW2, which is a massive protostar (Cunningham et al., 2009; Dzib et al., 2011), with a mass of 18 M⊙ (Torrelles et al., 2011). There is a fast, bipolar, highly collimated radio jet ejected from the HW2 young stellar object (YSO), with well aligned NE-SW direction and scale of 1500 AU (Curiel et al., 2006). Furthermore, a rotating disk around the HW2 have been identified from sub-millimetre observations (Patel et al., 2005). The infrared observations toward HW2 show that there are strong shocks, implying that the object is at the early evolutionary stage.
DR21S is a massive star-forming region within the Cygnus X molecular cloud at a distance of 1.50.08 kpc (Rygl et al., 2012). This region has been studied in multiple wavelength observations (Wilson & Mauersberger, 1990; Liechti & Walmsley, 1997; Jakob et al., 2007; Schneider et al., 2006, 2010). It contains molecular gas mass of about 4.710 and a far-infrared luminosity of 1.5 105 L⊙ (Schneider et al., 2006; Campbell et al., 1982). The cloud also hosts one of the strong energetic outflow, with a mass of about 3000 (Cruz-González et al., 2007). Our mapping observations have covered two cometary Hii regions (Immer et al., 2014) and several regions where ongoing shock activity (Davis et al., 2007) toward DR21S.
G34 molecular cloud complex is a massive star-forming region at a distance of 3.3 kpc (Kuchar & Bania, 1994), and its envelope scale is 8.1 104 AU. The cloud contains 1.1 104 of dense gas (Hill et al., 2005), and has a luminosity of 3.2 105 L⊙ (van der Tak et al., 2013), with an age of a few yr (Paron et al., 2009). From radio continuum observations, this source shows two very condensed UC Hii regions (named as A and B), a more evolved CHii region with a cometary shape (named as C) and an extended ringlike Hii region (named as D) (Reid & Ho, 1985; Mookerjea et al., 2007). There are several outflows in G34, as evidenced by SiO emission extends to the northwest, southeast and northeast of the compact Hii regions (Hatchell et al., 2001).
S76E is a massive star-forming region containing an extended Hii region (Li et al., 2012), with an emitting region size of about 2′, i.e., about 1.2 pc given a distance of 2.11 kpc (Plume et al., 1992). This region has an IRAS total IR (TIR) luminosity of 2.3104 L⊙ (Zinchenko et al., 1997), with a molecular mass of 1.64 103 (Zinchenko et al., 1994).
2.2 IRAM 30m observations and VLA archive data
We carried out mapping observations with the IRAM 30m telescope at Pico Veleta, Spain111Based on observations carried out with the IRAM 30m Telescope. IRAM is supported by INSU/CNRS (France), MPG (Germany) and IGN (Spain)., in January 2012. On-the-fly (OTF) mapping mode was used for all four objects, with a mapping size of 120 120′′. The mapping centers are listed in Table 1. The Eight MIxer Receiver (EMIR) and Fourier Transform Spectrometers (FTS) backends were used. These observations cover the frequency range between 84.5GHz and 92.3 GHz in the 3 mm atmospheric window, and between 143.7GHz and 147.7 GHz in the 2 mm atmospheric window. A variety of molecular lines are covered simultaneously, which can improves observational efficiency and avoid deviation of relative position and flux calibration. The reasonable frequency resolution (V.V. Guzmn et al. 2013) of FTS with 195 kHz sampling correspond to 0.67 km s-1 and 0.4 km s-1 at 87 and 145 GHz, respectively. The data were converted to the main beam temperature using , where is main beam efficiency and is forward efficiency. The main beam efficiencies are 0.81 for 86 GHz and 0.73 for 145 GHz. The forward efficiencies are 95% at 3 mm and 93% at 2 mm. The beam sizes are about 17′′ and 28′′, and the are about 0.05 and 0.1, while the typical system temperatures are about 125 K and 95 K at 2 mm and 3 mm, respectively. All data were re-gridded to the step of 15′′, and assumed that the beam-filling factor is unity for following analysis.
Free-free emission at centimetre wavelength is an useful tool to study HCHii, UCHii, and Hii regions. Radio continuum data at band (3.6 cm) observed with Very Large Array (VLA) were obtained from the Li et al. (2012). In Table 1, we list the peak intensity in Column 7, the flux density in Column 8, the deconvolved size in Column 9.
3 Results
3.1 Line identification
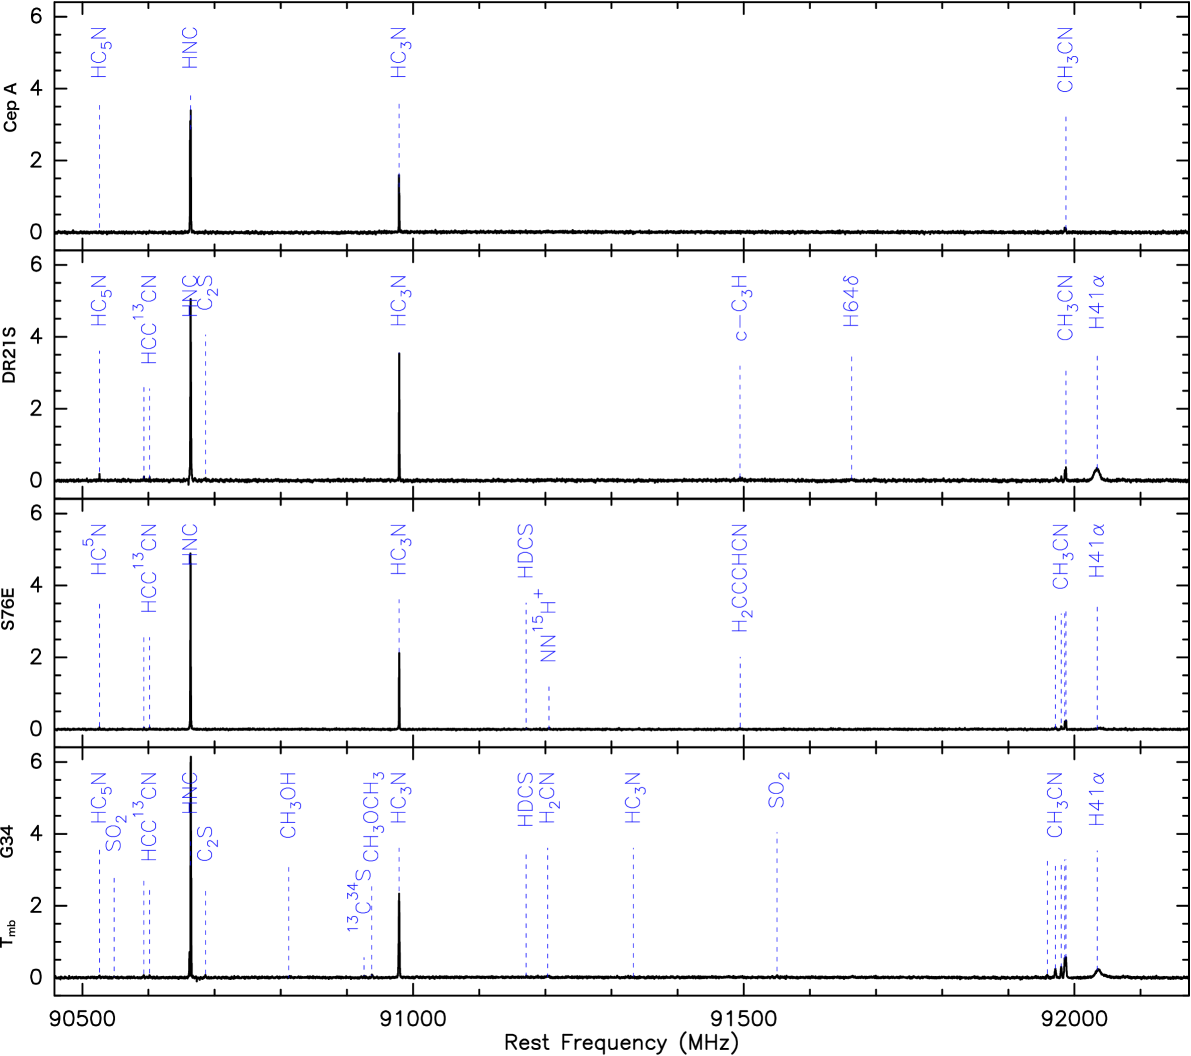
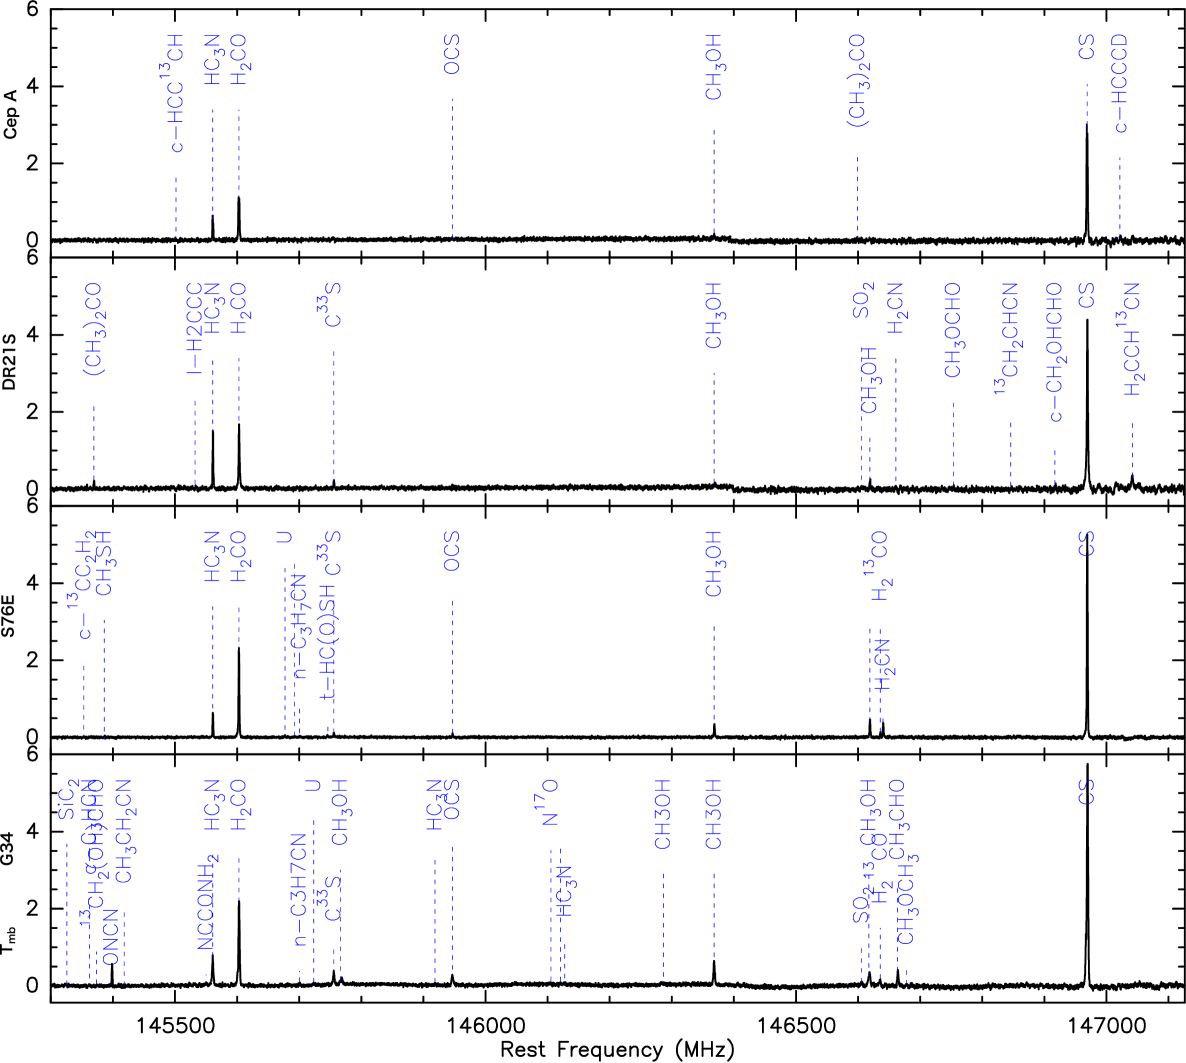
To increase sensitivity of weak lines, we averaged spectrum over the map of for each source (figure 1). The molecular lines were identified using the Splatalogue, Cologne and CDMS spectroscopic databases. Most of the molecular lines have similar line widths and central velocities, while several lines are more broad than the typical line widths, such as radio recombination lines (RRLs) and SiO lines. RRLs were detected in DR21S, G34 and S76E, but not detected in Cep A, where the radio continuum emission was dominated by high-velocity ionized jet (Jiménez-Serra et al., 2011). The line parameters derived from Gaussian fitting are listed in table 5, 6, 8, 11, including velocity integrated intensity (A), local standard of rest velocity , line width (full width at half maximum FWHM), and emission peak temperature (in ). Detailed information of the molecular lines for each source are described below.
Cep A. In total, 61 lines from 35 molecules were identified (see table 5), including long carbon chain molecules (e.g, HC2n-1N, CH3C2H, H13C2n-1N, -C3H2, C4H, n=2,3), deuterated molecules (DCN, DCO+, C2D, NH2D.) and shock tracers (SiO and SO, etc.), etc. Most of these lines velocities are around -11 km s-1, while the line width (FWHM) range from 3.3 to 4.5 km s-1.
DR21S. We identified 78 spectral features corresponding to 43 different molecular species, including long carbon chain molecules, deuterated molecules, PDR and shock tracers, etc. In addition, one helium recombination (He42), six RRLs and one unidentified line were detected (see table 6). A complex oxygen-bearing molecule of acetone (CH3)2CO 2311,13-2212,10 AE was detected for the first time in this massive star-forming region. These lines velocities are around -2 km s-1, while the typical FWHM range from 3 to 5 km s-1.
G34. A total of 169 spectral features were detected (table 8). We identified 78 molecular species and 3 RRLs, including long carbon chain molecules, deuterated molecules, PDR and shock tracers, etc. In addition, 9 unidentified lines were detected. Most of these molecular lines velocities are around 58 km s-1 and the typical FWHM range from 3.5 to 4.5 km s-1. Several molecule were detected in this source, but absent in the other three sources, e.g, SiC2, H2CN, HDCS, N15NH+, 15NNH+, 13C34S, SO2, ONCN and HCO. The line width of SiC2 is 6.23 km s-1 (FWHM) which is significantly broader than the typical FWHM.
S76E. We detected 71 spectral lines from 44 molecules, and one RRL (table 11), including long carbon chain molecules, deuterated molecules, several well known PDR and shock tracers, etc. In addition, we found 6 unidentified lines. These lines are around 33 km s-1, while the typical FWHM range from 2.8 to 3.5 km s-1.
In summary, many fundamental molecules were detected in all four sources, such as long carbon chain molecules, deuterated molecules, sulfur-bearing molecules, PDR and shock tracers, etc. Both C2S and HCO were detected in DR21S and G34, while SO2, ONCN, SiC2, C3S, NH2CO and H2NCH2CN were only detected in G34, and (CH3)2CO is only detected in DR21S. In addition, the number of molecules in G34 is significantly more than other sources. This indicates that the chemical environment in G34 is more complicated than other three sources. Molecules were detected in all four sources might be formed or existed at the early stage of massive star formation. The molecules were only detected in DR21S and/or G34, but absent in Cep A and S76E, likely only form in specific environments. The physical and chemical environments can be affected by interaction between two compact Hii regions in DR21S. The G34 molecular cloud complex is interacting with a SNR, which could affect the chemical environments of molecular cloud, accelerate chemical reaction and produce complicated molecules. These sources exhibit different radio continuum specific intensities and chemical complexities, indicating that they may be in different evolutionary stage. G34 and DR21S show more chemical complexity than Cep A and S76E, which is consistent with the evolutionary stages as suggested by evidences of radio continuum and RRLs. The comparison between our results and previous line survey, toward infrared dark clouds (IRDCs), high-mass protostellar objects (HMPOs), HMCs, and UCHii regions at 3 mm, show that the molecular abundances in our sources are significantly higher than in IRDCs and HMPOs (Sanhueza et al., 2012; Marseille et al., 2008), but generally in agreement with the HMCs and UCHii (Gerner et al., 2014).
3.2 Velocity-integrated intensity maps
In each target, most molecular lines show similar spatial distributions with their emission peaking at the core position, while some other lines exhibit distinct morphologies. For example, both -C3H2 and DCO+ have multiple emission peaks in all four sources, while few cases (HCO, ONCN and (CH3)2CO) show anti-correlated with the RRLs (or free-free continuum emission) in the velocity-integrated intensity maps.
Cep A. Our mapping centre locates at the radio source HW2. The velocity-integrated intensity map of DCO+ 2-1 shows three main condensations, as well as -C3H2 2-1 (figure 2), which will be discussed in Sect.3.4.1 and Sect.4.3. Figure 3 shows the velocity-integrated intensity maps of the deuterated molecules and shock tracers. The SiO 2-1 emission is stretched along the northeast-southwest (NE-SW) direction, which is consistent with what was found in literature Codella et al. (2006).
DR21S. Velocity-integrated intensity maps and spectra of deuterated molecules are shown in figure 4. Some of them show slightly different morphologies comparing with its corresponding hydrogenated molecules. Detail discussion about the deuterated molecules will be presented in Sect.4.3. Large oxygen-bearing molecule of acetone (CH3)2CO shows strong emission in several positions, with a cavity around the emission peak of H41 (figure 7), which is similar to the results of Friedel & Snyder (2008). The -C3H2 2-1 emission also shows a cavity around the radio continuum emission peak, which will be discussed in Sect.3.4.1. He42 emission was detected toward the core region (figure 7).
G34. Figure 8 shows different spatial distributions between H41 and HC3N. H41 emission is extended in the southeast, while HC3N is extended in the west. HCO and -C3H2 show significantly different morphologies compared to RRLs. HCO shows anti-correlated with H41 (figure 8), while -C3H2 shows a cavity feature in the emission peak of RRL, which will be discussed in Sect.3.4.1.
3.3 Isotopic abundances
12C/13C. Since the millimeter HC3N lines are optically thin in most molecular clouds (Li et al., 2012), the line intensity () ratios between HC3N 10-9 and its isotopologues (HCC13CN 10-9 and HC13CCN 10-9) can be used to determine the abundance ratios of these molecules. The 12C/13C isotope abundance ratios were derived from the line ratio between HC3N and its isotopologues assuming similar astro-chemical processes. The 12C/13C isotope ratios are about 40 in all four sources (table 2), which are slightly lower than the ratio of 60–70 found in the local interstellar medium (ISM) (Milam et al., 2005), but agree well with the result in Orion (40) (Persson et al., 2007; Tercero et al., 2010). The rarer isotope 13C is a secondary element which can be produced from 12C in the carbon-nitrogen-oxygen (CNO) cycle in low- and intermediate-mass stars (Prantzos et al., 1996). While the main isotope of carbon 12C, as a primary element, is mainly produced by the triple alpha reaction (Timmes et al., 1995). A positive gradient along the Galactic radius is apparent in the 12C/13C ratios, which are 25 to 100 from the Galactic centre to the outer disk, following the relationship 12C/13C = 6.21DGC + 18.71, where DGC is the distance from the Galactic center (Milam et al., 2005). The 12C/13C ratios that are calculated from HC3N and its isotopologues seem exhibiting a gradient with DGC, except for DR21S and S76E, since the ratio is lower than the prediction of Milam et al. (2005) for the former and the Galactic latitude is much higher than 2∘ for the later. The discrepancy of isotope abundance ratios between our sources and the local ISM may arise from Galactic chemical evolution, since the solar value represents the ISM 4.5 Gyr ago. The 12C/13C ratios also can be effected by isotope selective photodissociation from UV photon because both 12C and 13C have different self-shielding (Wilson & Rood, 1994; Milam et al., 2005). The 13C is more easily to be photodissociated than 12C, which can result in a lower 12C/13C ratios in star-forming region comparing with local ISM (e.g., Szűcs et al., 2014).
14N/15N. The HCN molecule and its isotopologues have large Einstein co-efficiencies, making their line emission easily optically thick. To accurately estimate the abundance ratios from lines with high optical depths, we used the double isotope method, which has one of the isotope abundances is either measured from different species or fixed with the local ISM value. We estimated the isotope abundance ratios of 14N/15N, which were calculated from the observed line ratios of H13CN(1-0) and HC15N(1-0), after adopting the ratio of 12C/13C derived from HC3N 10-9 and its isotopologues.
The 14N/15N isotope ratios in these sources range from 109 to 304, which are lower than 400 found in local ISM (Terzieva & Herbst, 2000), and 1000 200 found in the prototypical starless cloud core L1544 (Bizzocchi et al., 2013). The 14N/15N ratio in S76E is 304 15, which is roughly consistent with 300 50 in Barnard 1 (Daniel et al., 2013). The HC15N abundance could be enhanced in the early stages of molecular dense cores (Rodgers & Charnley, 2008), while the effect can be neglected in our sources because they are all Hii regions. The 15N element is believed to be formed in the synthesis of massive stars and potential can be destroyed in low mass stars (Wang et al., 2009). This indicates that a part of the 15N element may be destroyed in local ISM. Adande & Ziurys (2012) found that the 14N/15N ratio shows a positive gradient with distance of DGC, 14N/15N = 21.1(5.2) kpc-1 DGC + 123.8(37.1), which likely supports the Galactic chemical evolution model that 15N has a secondary origin in novae. The results of Cep A and G34 are consistent with the above scenario. The Galactic chemical evolution can be used to explain the discrepancy of 14N/15N ratios between our sources and the local ISM.
16O/18O. With the double isotope method, we derived the 16O/18O isotopic ratios with H13CO+(1-0), HC18O+(1-0) and the ratio of 12C/13C. The local ISM value (55730) is slightly higher than our results (Wilson, 1999), which are about 422, 415, 532 and 288 in Cep A, S76E DR21S and G34, respectively. The ratio of 288 found in G34 is consistent with 287 27 found in Orion derived from OCS and its isotopologues (Tercero et al., 2010). The fractionation of oxygen can be ignored due to its high first ionization potential (Langer et al., 1984).
34S/33S. C33S 3-2 and C34S 3-2 lines are optically thin (Goicoechea et al., 2006), thus their flux ratio can be used to derive the ratios of 34S/33S. The ratios of 34S/33S are 5.1, 4.7 and 5.5 in DR21S, G34 and S76E, respectively. These values are in agreement with the local ISM ( 6) and Orion KL ( 5) isotope abundance ratio (Chin et al., 1996; Persson et al., 2007; Tercero et al., 2010). For Cep A, the 34S/33S isotope ratio was not derived, because the C33S 3-2 line was not detected.
D/H. Several deuterated molecules were found in all four sources. DCN, DCO+, H13CN and H13CO+ are adopted to derive the abundance ratios of N(DCN)/N(HCN) and N(DCO+)/N(HCO+), and the 12C/13C ratios are obtained with HC3N and its isotopologues. To derive the abundance ratio of D/H, we adopt several assumptions. Firstly we assume local thermal equilibrium (LTE) conditions and optically thin for all these lines. In addition, these lines have similar excitation temperatures, emitting regions and filling factors. With the above assumptions, we derived the abundance (column density) ratio using the formula from Sakai et al. (2012).
| (1) |
where is the column density, is the dipole moment, is the rest frequency of the line, is the upper state energy, is the excitation temperature, is the background radiation temperature (2.7K), and is the velocity-integrated in . is the Planck function as:
| (2) |
With the values of , and shown in Table 4. The above equation can be reduced as
| (3) |
We can also derived the N(DCO+)/N(H13CO+) ratio with the same method,
| (4) |
We take from the highest value of the rotational temperature of CH3CN (table 3), which will be discussed in Sect.4.1.
The column density ratios of N(DCN)/N(HCN) and N(DCO+)/N(HCO+) are converted by N(DCN)/N(H13CN) and N(DCO+)/N(H13CO+), with the 12C/13C ratios which derived from the aforementioned method for each sources. The ratios of N(DCN)/N(HCN) are slightly higher than the N(DCO+)/N(HCO+), while these values are two order of magnitude higher than the elemental [D]/[H] 1.510-5 ratio (Linsky et al., 2006). These ratios are consistent with 0.018 - 0.08 from a study of DNC and HNC toward UCHii regions, which are an order of magnitude lower than the high-mass starless core candidates (HMSCs) (Fontani et al., 2014). This result confirms the theoretic prediction that the deuterated fraction (column density ratio between a deuterated molecules and its hydrogenated counterpart, ) decreases with the core evolution after the young stellar object formed (Caselli, 2002). The high found in our sources is likely because the abundances of deuterated molecules were enhanced in cold molecular clouds before the formation of the proto-star or warm deuterium chemistry drived by CH2D+ and/or C2HD+ (Parise et al., 2009). These ratios are summarized in table 2.
3.4 Long carbon chain molecules
3.4.1 -C3H2
Two lines of -C3H2 (21,2-10,1, 31,2-22,1) were detected in all four sources. As a small cyclic hydrocarbon, -C3H2 was first detected towards Sgr B2 (Thaddeus et al., 1985), and then was detected in a variety of sources (Vrtilek et al., 1987; Madden et al., 1989; Lucas & Liszt, 2000; Qi et al., 2013). -C3H2 is easily dissociated by radiation from the central star (Qi et al., 2013). Acetylene (C2H2), which is released from polycyclic aromatic hydrocarbons (PAHs), has been used to explain the -C3H2 enhancement in UV exposed regions (Fuente et al., 2003).
The velocity-integrated intensity map of -C3H2 2-1 shows a cavity around the emission peak of the 8.4 GHz radio continuum in DR21S (figure 2). However, the -C3H2 3-2 emission peaks at the radio continuum emission peak, which implies that the abundance of -C3H2 in the radio continuum emission peak region should not be lower than its surrounding region. In addition, the spectra of -C3H2 2-1 have an absorption feature toward the cavity region as shown in figure 2. Therefore, the cavity feature of -C3H2 2-1 toward the radio continuum emission peak should be caused by absorption. The velocity-integrated intensity map of -C3H2 2-1 in G34 also shows an absorption feature similar to that in DR21S (figure 2). In figure 2, we also show the velocity-integrated intensity map of -C3H2 in S76E, with two emission peaks. The slightly different spatial distributions between -C3H2 2-1 and 3-2 might be due to both transitions have different excitation conditions.
As shown in figure 2, the -C3H2 2-1 emission in CepA is resolved into three main condensations, which are labeled as P1, P2 and P3 in the order of clockwise rotation. Similar to DR21S and G34, the -C3H2 cavity on top of the radio continuum peak is caused by absorption. The -C3H2 emission is associated with CS 3-2 emission in P1 and P3, while CS emission is weaker in P2. The -C3H2 line emission in P1 is stronger and narrower than those in P2 and P3. Since -C3H2 has similar spatial distribution and line profile compared to SO, which is considered as a low-velocity shock tracer in massive star-forming regions (Podio et al., 2015), we suggest that the main mechanism to enhance abundance of -C3H2 in the P2 region is likely low-velocity shock activity.
3.4.2 Other long carbon chain molecules
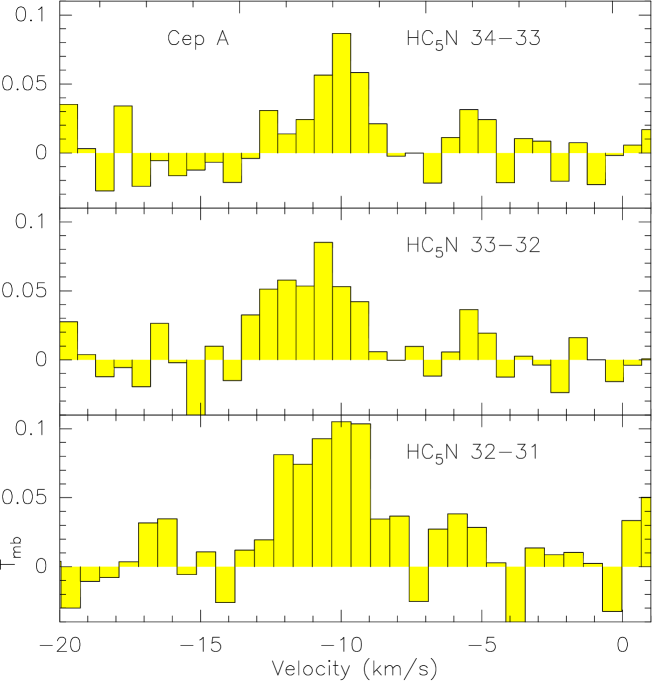
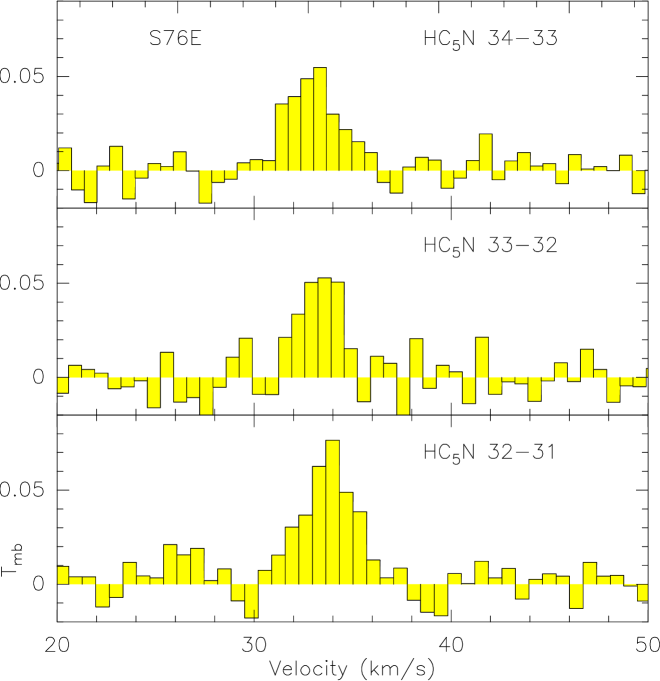
We also detected some other long carbon chain molecules, including the cyanopolyynes (HC2n+1N), such as cyanoacetylene (HC3N) and cyanodiacetylene (HC5N), and C4H. Three high- excitation lines of HC5N (J=34-33, J=33-32, and J=32-31), two transitions of HC3N (10-9 and 16-15) and their isotopoogues (HCC13CN 10-9 and HC13CCN 10-9) were detected in these targets. The HC3N isomeride molecule of HCCNC and C3S 15-14 was only detected in DR21S and G34, respectively. CH3C5N was only detected in G34, which is the largest molecule in this observation. We present these spectra in figure 10.
3.5 ONCN
Nitrosyl cyanide ONCN (140,14-130,13, 145397.59 MHz) emission, which has an upper level energy of 52.4 K and an Einstein A coefficient Aij of 2.66, was detected in G34. It is the first detection of ONCN in massive star formation regions. Figure 9 presents the spectra and the velocity-integrated intensity map of ONCN, which shows an anti-correlated with the ionized gas tracer H41. ONCN emission is neither associated with the core, nor associated with the shock activity. The ONCN line was not detected in previous observations probably because its emission not focused on the center of source, and previous observations did not cover this frequency.
4 Discussions
4.1 Excitation and column densities
In all the four sources, we have detected several transitions of CH3CN (methyl cyanide), which is an excellent probe of gas temperature in warm dense environments (Goldsmith & Langer, 1999). We estimated the excitation conditions of CH3CN using the population diagram method introduced by Goldsmith & Langer (1999):
| (5) |
where = , is the beam filling factor. Cτ = /(1-e-τ), is the optical depth. For an uniform beam filling () and low optical depth, the population diagram reduces to a rotational diagram with a rotational temperature and total column density . Column density () and rotational temperature () can be estimated based on
| (6) |
where is the observed upper state column density of the molecule including line opacity and beam-source coupling effects; is the degeneracy of the upper state; is the rotational partition function; is the Boltzmann constant; is the upper level energy.
The rotation diagrams are shown in figure 11. Under the LTE assumption, the excitation temperature is the same as the rotational temperature. The excitation temperature of CH3CN in G34 ( 68K) and Cep A ( 71K) are higher than DR21S ( 47K) and S76E ( 47K). While the total column density of CH3CN in G34 ( 1.5) and S76E (5.4) are higher than that in Cep A ( 1.1) and DR21S ( 4.0). CH3CN in G34 has a higher excitation temperature and higher column density than those in the other three sources, indicating that G34 is in an more evolved stage. The high excitation temperature of CH3CN found in Cep A might be affected by the radio jet from HW2. We summarize the diagnostic results of CH3CN in table 3.
4.2 Shock related molecules
Cep A. Figure 3 shows the velocity-integrated intensity map of SiO 2-1, which is a fast shock tracer (e.g., Qiu et al., 2007). The SiO emission stretchs along the direction of NE-SW, indicating that shock is in the NE-SW direction, which is consistent with the results in literature Codella et al. (2006). SiO emission peaks are located at two positions: offset (0′′, 0′′) with of -9.77 km s-1, and offset (30′′, 30′′) with of -8.38 km s-1, which give an velocity gradient of 0.66 km s-1kAU-1 (1arcsec = 700 AU at the given distance of 0.7 kpc). The line width of the second peak (8.57 km s-1) is broader than the first one (5.55 km s-1).
SO is an important shock tracer in star formation regions (Podio et al., 2015), and it can be significantly enhanced by low-velocity shocks (Chernin et al., 1994). From the channel map of SO (figure 3), it appears that the -5.36 km s-1 component of SO shows similar spatial distribution as SiO. This might be due to both emissions are affected by central star, since they are emissions associated with radio continuum. SO also shows strong emission in northern region (P2) of the core at a velocity of -9.44 km s-1, and its spectra profile shows a blue-shifted line wing with high T and a narrow line width. The HCO+ 1-0 emission in P2 also shows a blue profile, the spectrum presents a blue-shifted emission and red-shifted absorption, which are considered as a signature of infalling gas (Liu et al., 2013). Thus, low-velocity shocks likely dominate gas properties here, due to the gas infall.
DR21S. Figure 4 shows the velocity-integrated intensity maps of shock tracers (SiO 2-1, HNCO 4-3, SO 2-1). They show strong emission on the south side of the core with narrow line width. This region likely has a shock activity, which is consistent with previous observations (see the figure A1: A 4-2 in Davis et al. (2007)). As shown in figure 4, a blue-shifted line wing with an inverse P-Cygni profile of HCO+ can be seen in the western region of the core, while SiO, HNCO and SO without obvious emission in this region. Class I CH3OH maser emission at 84.5 GHz was also detected in this region, and it was considered to be associated with outflows/inflows in star-forming region (Sobolev, 1993). These results are consistent with previous high spatial resolution observations that there are detected several shock activities (see the figure A2: B 1-1, B 1-2 and B 1-3 in Davis et al. (2007)).
G34. We detected several shock gas tracers in G34, including SO 2-1, HNCO 4-3, SiO 2-1 and its isotopologues (29SiO 2-1 and 30SiO 2-1). They show strong emission in the west region of the core (figure 5), this shocked region and the tracer velocity are in agreement with the results of study SiO in Hatchell et al. (2001). Their emitting region correspond to a cometary compact HII region, where is named “C” in literature Mookerjea et al. (2007). Figure 5 shows that the spectra of HCO+ present a a blue-shifted line wing with an inverse P-Cygni profile in the western region. CS 3-2 emission also shows a redshifted absorption feature in the same region. These features may be due to the gas infalling towards cometary HII region “C” (e.g., Liu et al., 2013).
S76E. Figure 6 shows the velocity-integrated intensity maps of SiO 2-1 and SO 2-1. Their emission only associate with a part of radio continuum emission, where the south-west side of the core. The velocity-integrated intensity map of SiO redshifted emission, integrated from 33.5 to 47 km s-1, shows similar spatial distribution to the blueshifted emission, integrated from 28.2 to 33.5 km s-1. In figure 6 we show the position-velocity (pv) diagram of SiO, which presents a strong emission in the blueshifted.
In all the four sources, we have detected several shock gas tracers, including SO, HNCO, SiO and its isotopologues, at a level of 5. The SiO emission usually associate with strong shocks, it is a ideal probe for revealing the processes of jet/outflow activity associated with young protostars, such as in the case of Cep A. SO not only can be enhanced in hot cores, but also in shocked region. This emission likely can be enhanced by low-velocity shocks, due to the gas infall, such as in the P2 region of Cep A. These tracers provide a powerful tool to investigate the shock processes in star formation regions.
4.3 Deuterium-bearing molecules
The deuterated molecules are widespread in massive star-forming regions (Caselli et al., 2012). High toward these regions provide a chemical “fingerprint” of physical conditions (Shah & Wootten, 2001). We have detected DCN 2-1, DCO+ 2-1 and NH2D 1-1 in all four sources, C2D 2-1 in three sources except for G34, and HDCS (3-2) in G34.
Cep A. The velocity-integrated intensity maps of DCN 2-1 and DCO+ 2-1 show different spatial distributions compared to the radio continuum emission (figure 3). DCO+ emissions are resolved into three main condensations surrounding the emission peak of radio continuum with different line central velocities, which are labeled as M1, M2 and M3 in order of clockwise rotation. The velocity is -12.0 km s-1 in M1, -10.1 km s-1 in M2, and -9.7 km s-1 in M3. The DCO+ emission in M1 and M3 have comparable line widths (FWHM) of 1.4 km s-1, which is broader than 1.0 km s-1 in M2. DCN and NH2D also show strong emission around the M1 region, and DCN presents similar spatial distribution to the DCO+ in M1. The deuterated molecules likely have been enhanced around the M1 region, since there are strong emission of DCO+, DCN and NH2D. As discussed in Section 4.2, there are strong shock activity in M1 region and low-velocity shock activity in M2 region. Moreover, weak emission of SiO toward M3 indicates that there is likely associated with an intermediate shock activity.
Two main pathways are considered for forming deuterated molecules in different temperature ranges: at low temperature of 10 - 30 K, the dominant pathway is via H isotopologues; at slightly high of 30-80 K, the dominant pathway is via light hydrocarbons (CH2D+ and C2HD+) (Albertsson et al., 2013). The DCO+ is considered mainly forming at low temperated through H isotopologues, thus it is expected to be formed during the prestellar phase and sensitive to freeze-out (Albertsson et al., 2013). One possible explanation of DCO+ shows strong emission around M2 and M3 regions is that it’s abundance has been enhanced by shock, since it is likely to be injected into gas phase from the grain mantles through shock activity (Mangum et al., 1991). The DCO+ emission around M1 not only associated with radio continuum emission, but also in the vicinity of the shocked region with the same velocity compared to SiO (-9.7 km s-1), as well as the DCN emission. The DCN is considered to be formed by light hydrocarbon at relatively high temperature of 30 - 80 K (Albertsson et al., 2013), and it is not mainly formed on grain-surface. The gas, in the surrounding areas of central young protostar, will be warming with the shock activity and evolution of dense cores. This may be responsible for enhancement of DCO+ and DCN emission around M1 region, since DCO+ can be released into gas phase from dust grain and DCN can be formed with an increase in temperature. DCO+ shows a cavity in the vicinity of the emission peak of radio continuum, which may be due to there are low abundances or it was destroyed by high temperature (heated by central star), since DCO+ can be destroyed in high temperature environment (Pety et al., 2007). NH2D is considered formed at the low temperatures (30 K) and high densities () regions (e.g., starless cores, protostars), and it not only can be formed via gas-phase reactions but also via grain-surface reactions with D atoms (Tielens, 1983). The NH2D shows strong emission around the shocked region (M1), implying that it likely has been released into gas phase from dust grain through shock activity (e.g., Mookerjea et al., 2009).
DR21S. As shown in figure 4, the emission peak of DCN 2-1, DCO+ 2-1 and NH2D 1-1 are away from the emission peak of radio continuum. In addition, both DCO+ and NH2D show obvious emission on the south side of the core, where likely dominated by shock activity considering the aforementioned shock tracers. The shock interacts with ambient gas/dust, which can affects the chemical composition of the grain mantles and of the molecular gas, is possibly responsible for the enhancement of DCO+ and NH2D emission on the south side of the core. For C2D(2-1), the signal-to-noise ratio is not good enough to make a velocity-integrated map, and its spectrum is shown in figure 4.
G34. The velocity-integrated intensity maps and spectra of deuterated molecules are presented in figure 5. Both DCN 2-1 and NH2D 1-1 show obvious emission on the west side of the core, where is associated with shock activity as suggested by evidences of SiO and SO. This indicates that the shock activity likely responsible for the enhancement of DCO+ and NH2D emission in this region, since the gas temperature can be increased in shocked region, and both molecules can be evaporated to gas phase from the dust grain with an increase in temperature. DCO+ 2-1 shows obvious emission on the north side of the core, as well as NH2D. The gas temperature in this region is around 30 K derived from CH3CN. Both DCO+ and NH2D lines can be excited in such high temperature environments. We present the spectrum of HDCS 3-2 in figure 5 instead of velocity-integrated intensity map, due to the low signal-to-noise ratio.
S76E. Figure 6 shows the velocity-integrated intensity maps of DCN 2-1 and NH2D 1-1. Both NH2D and DCN emissions are in the vicinity of the radio continuum emission, while looks more extended in NH2D. NH2D shows obvious emission in the south-western region of the radio continuum emission, where also found obvious SiO emission. This indicates that the NH2D emission likely associate with shock activity in this region. We show the spectra of DCO+ 2-1 and C2D 2-1 in figure 6 instead of velocity-integrated intensity map, due to the low signal-to-noise ratio.
From above analysis, we noted that the NH2D emission has been enhanced by shock activity toward all sources, while DCO+ and DCN emission have been enhanced by shock activity only in some cases, e.g., Cep A and DR21S for DCO+, Cep A and G34 for DCN.
5 Summary and future prospectus
We carried out spectral line mapping observations toward four massive star-forming regions (CepA, DR21S, G34 and S76E) with the IRAM 30 meter telescope. Our main results are summarized as:
-
1.
A total of 395 spectral features were detected in four massive star-forming regions. In total we identified 61 lines from 25 molecules in Cep A; 78 lines from 43 molecules, an unidentified line, a helium combination line and six RRLs in DR21S; and 169 lines from 86 molecules, three RRLs, and nine unidentified lines in G34; 78 lines from 44 molecules, one RRLs and six unidentified lines in S76E.
-
2.
We detected a large oxygen-bearing molecules of acetone (CH3)2CO in DR21S. For all four sources, we detected three transitions of HC5N, two transitions of HC3N and its isotopologues of HCC13CN and HC13CCN in all four sources. The HC3N isomeride molecule, HCCNC was only detected in DR21S, while C3S was detected in G34, and C4H was detected in DR21S and S76E. The nitrosyl cyanide ONCN(140,14-130,13) emission, as the first detection of ONCN in massive star-forming region, was detected in G34, and its emission shows anti-correlated with the RRLs.
-
3.
We derived several isotope abundance ratios in each source: For example, 12C/13C, 14N/15N, 16O/18O and 33S/34S. The 12C/13C ratio are about 40, which are slightly lower than the ratio of 60-70 found in the local ISM (Milam et al., 2005). The 14N/15N ratios are from 109 to 304, and the 16O/18O ratios are from 287 to 532. The 33S/34S ratios are about 5, except for CepA, in which C33S 3-2 line is not detected. The ratios of N(DCN)/N(HCN) and N(DCO+)/N(HCO+) in each source are two orders of magnitude higher than the elemental [D]/[H] ratio (1.510-5), which is consistent with results in literature Parise et al. (2009).
-
4.
Several shock tracers (SiO, SO and HNCO) were detected and used to investigate the shock properties in these star-forming regions. Comparing these shock traces and deuterated molecules, we found that NH2D emission can be enhanced in shocked region, and both DCO+ and DCN emissions also can be enhanced toward shocked region in some cases (e.g., Cep A and DR21S/G34).
-
5.
The CH3CN lines are used to derive rotational temperature and column density of this line in each source, which show the highest excitation temperature and column density in G34.
Mapping observations of multiple lines toward massive star-forming regions at different evolutionary stages allow detailed studies of chemical properties, shock activities and physical conditions. Sensitive high-angular resolution observations with (sub-)millimeter interferometers, such as ALMA, will be a powerful tool to constrain chemical and physical properties during massive star formation process.
Acknowledgements
We thank the support of the China Ministry of Science and Technology under the State Key Development Program for Basic Research (2012CB821800), the Natural Science Foundation of China under grants of 11173013. Z-Y. Z acknowledges support from the European Research Council in the form of the Advanced Investigator Programme, 321302, cosmicism. We thank helpful discussions and comments from Professors Keping Qiu, Di Li, and Qizhou Zhang to improve the manuscript. We thank the anonymous referee for her/his valuable comments that helped to improve the paper.
References
- Adande & Ziurys (2012) Adande G. R., Ziurys L. M., 2012, ApJ, 744, 194
- Albertsson et al. (2013) Albertsson T., Semenov D. A., Vasyunin A. I., Henning T., Herbst E., 2013, ApJS, 207, 27
- Bergin et al. (1996) Bergin E. A., Snell R. L., Goldsmith P. F., 1996, ApJ, 460, 343
- Bevington & Robinson (2003) Bevington P. R., Robinson D. K., 2003, Data reduction and error analysis for the physical sciences
- Bizzocchi et al. (2013) Bizzocchi L., Caselli P., Leonardo E., Dore L., 2013, A&A, 555, A109
- Campbell et al. (1982) Campbell M. F., Niles D., Nawfel R., Hawrylycz M., Hoffmann W. F., Thronson Jr. H. A., 1982, ApJ, 261, 550
- Caselli (2002) Caselli P., 2002, Planet. Space Sci., 50, 1133
- Caselli et al. (2012) Caselli P., Keto E., Bergin E. A., Tafalla M., Aikawa Y., Douglas T., Pagani L., Yíldíz U. A., van der Tak F. F. S., Walmsley C. M., Codella C., Nisini B., Kristensen L. E., van Dishoeck E. F., 2012, ApJ, 759, L37
- Chernin et al. (1994) Chernin L. M., Masson C. R., Fuller G. A., 1994, ApJ, 436, 741
- Chin et al. (1996) Chin Y.-N., Henkel C., Whiteoak J. B., Langer N., Churchwell E. B., 1996, A&A, 305, 960
- Chung et al. (1991) Chung H. S., Osamu K., Masaki M., 1991, Journal of Korean Astronomical Society, 24, 217
- Churchwell (2002) Churchwell E., 2002, ARA&A, 40, 27
- Codella et al. (2006) Codella C., Viti S., Williams D. A., Bachiller R., 2006, ApJ, 644, L41
- Cruz-González et al. (2007) Cruz-González I., Salas L., Hiriart D., 2007, Rev. Mexicana Astron. Astrofis., 43, 337
- Cunningham et al. (2009) Cunningham N. J., Moeckel N., Bally J., 2009, ApJ, 692, 943
- Curiel et al. (2006) Curiel S., Ho P. T. P., Patel N. A., Torrelles J. M., Rodríguez L. F., Trinidad M. A., Cantó J., Hernández L., Gómez J. F., Garay G., Anglada G., 2006, ApJ, 638, 878
- Daniel et al. (2013) Daniel F., Gérin M., Roueff E., Cernicharo J., Marcelino N., Lique F., Lis D. C., Teyssier D., Biver N., Bockelée-Morvan D., 2013, A&A, 560, A3
- Davis et al. (2007) Davis C. J., Kumar M. S. N., Sandell G., Froebrich D., Smith M. D., Currie M. J., 2007, MNRAS, 374, 29
- Dzib et al. (2011) Dzib S., Loinard L., Rodríguez L. F., Mioduszewski A. J., Torres R. M., 2011, ApJ, 733, 71
- Esplugues et al. (2013) Esplugues G. B., Tercero B., Cernicharo J., Goicoechea J. R., Palau A., Marcelino N., Bell T. A., 2013, A&A, 556, A143
- Evans et al. (1981) Evans II N. J., Slovak M. H., Becklin E. E., Beichman C., Gatley I., Werner M. W., Hildebrand R. H., Keene J., Whitcomb S. E., 1981, ApJ, 244, 115
- Fontani et al. (2014) Fontani F., Sakai T., Furuya K., Sakai N., Aikawa Y., Yamamoto S., 2014, MNRAS, 440, 448
- Friedel & Snyder (2008) Friedel D. N., Snyder L. E., 2008, ApJ, 672, 962
- Fuente et al. (2003) Fuente A., Rodrıguez-Franco A., Garcıa-Burillo S., Martın-Pintado J., Black J. H., 2003, A&A, 406, 899
- Gerner et al. (2014) Gerner T., Beuther H., Semenov D., Linz H., Vasyunina T., Bihr S., Shirley Y. L., Henning T., 2014, A&A, 563, A97
- Goicoechea et al. (2006) Goicoechea J. R., Pety J., Gerin M., Teyssier D., Roueff E., Hily-Blant P., Baek S., 2006, A&A, 456, 565
- Goldsmith & Langer (1999) Goldsmith P. F., Langer W. D., 1999, ApJ, 517, 209
- Gómez et al. (1999) Gómez J. F., Sargent A. I., Torrelles J. M., Ho P. T. P., Rodríguez L. F., Cantó J., Garay G., 1999, ApJ, 514, 287
- Hartigan et al. (1986) Hartigan P., Lada C. J., Tapia S., Stocke J., 1986, AJ, 92, 1155
- Hatchell et al. (2001) Hatchell J., Fuller G. A., Millar T. J., 2001, A&A, 372, 281
- Herbst & van Dishoeck (2009) Herbst E., van Dishoeck E. F., 2009, ARA&A, 47, 427
- Hill et al. (2005) Hill T., Burton M. G., Minier V., Thompson M. A., Walsh A. J., Hunt-Cunningham M., Garay G., 2005, MNRAS, 363, 405
- Hughes & Wouterloot (1984) Hughes V. A., Wouterloot J. G. A., 1984, ApJ, 276, 204
- Immer et al. (2014) Immer K., Cyganowski C., Reid M. J., Menten K. M., 2014, A&A, 563, A39
- Jakob et al. (2007) Jakob H., Kramer C., Simon R., Schneider N., Ossenkopf V., Bontemps S., Graf U. U., Stutzki J., 2007, A&A, 461, 999
- Jiménez-Serra et al. (2011) Jiménez-Serra I., Martín-Pintado J., Báez-Rubio A., Patel N., Thum C., 2011, ApJ, 732, L27
- Kennicutt (1998) Kennicutt Jr. R. C., 1998, ARA&A, 36, 189
- Kuchar & Bania (1994) Kuchar T. A., Bania T. M., 1994, ApJ, 436, 117
- Kurtz et al. (2000) Kurtz S., Cesaroni R., Churchwell E., Hofner P., Walmsley C. M., 2000, Protostars and Planets IV, pp 299–326
- Langer et al. (1984) Langer W. D., Graedel T. E., Frerking M. A., Armentrout P. B., 1984, ApJ, 277, 581
- Li et al. (2012) Li J., Wang J., Gu Q., Zhang Z.-y., Zheng X., 2012, ApJ, 745, 47
- Liechti & Walmsley (1997) Liechti S., Walmsley C. M., 1997, A&A, 321, 625
- Linsky et al. (2006) Linsky J. L., Draine B. T., Moos H. W., Jenkins E. B., Wood B. E., Oliveira C., Blair W. P., Friedman S. D., Gry C., Knauth D., Kruk J. W., Lacour S., Lehner N., Redfield S., Shull J. M., Sonneborn G., Williger G. M., 2006, ApJ, 647, 1106
- Liu et al. (2013) Liu T., Wu Y., Zhang H., 2013, ApJ, 776, 29
- Lucas & Liszt (2000) Lucas R., Liszt H. S., 2000, A&A, 358, 1069
- Madden et al. (1989) Madden S. C., Irvine W. M., Swade D. A., Matthews H. E., Friberg P., 1989, AJ, 97, 1403
- Mangum et al. (1991) Mangum J. G., Plambeck R. L., Wootten A., 1991, ApJ, 369, 169
- Marseille et al. (2008) Marseille M., Bontemps S., Herpin F., van der Tak F. F. S., Purcell C. R., 2008, A&A, 488, 579
- Milam et al. (2005) Milam S. N., Savage C., Brewster M. A., Ziurys L. M., Wyckoff S., 2005, ApJ, 634, 1126
- Mookerjea et al. (2007) Mookerjea B., Casper E., Mundy L. G., Looney L. W., 2007, ApJ, 659, 447
- Mookerjea et al. (2009) Mookerjea B., Sandell G., Jarrett T. H., McMullin J. P., 2009, A&A, 507, 1485
- Morris et al. (1977) Morris M., Snell R. L., vanden Bout P., 1977, ApJ, 216, 738
- Moscadelli et al. (2009) Moscadelli L., Reid M. J., Menten K. M., Brunthaler A., Zheng X. W., Xu Y., 2009, ApJ, 693, 406
- Narayanan & Walker (1996) Narayanan G., Walker C. K., 1996, ApJ, 466, 844
- Padovani et al. (2009) Padovani M., Walmsley C. M., Tafalla M., Galli D., Müller H. S. P., 2009, A&A, 505, 1199
- Parise et al. (2009) Parise B., Leurini S., Schilke P., Roueff E., Thorwirth S., Lis D. C., 2009, A&A, 508, 737
- Paron et al. (2009) Paron S., Ortega M. E., Rubio M., Dubner G., 2009, A&A, 498, 445
- Patel et al. (2005) Patel N. A., Curiel S., Sridharan T. K., Zhang Q., Hunter T. R., Ho P. T. P., Torrelles J. M., Moran J. M., Gómez J. F., Anglada G., 2005, Nature, 437, 109
- Persson et al. (2007) Persson C. M., Olofsson A. O. H., Koning N., Bergman P., Bernath P., Black J. H., Frisk U., Geppert W., Hasegawa T. I., Hjalmarson Å., Kwok S., Larsson B., Lecacheux A., Nummelin A., Olberg M., Sandqvist A., Wirström E. S., 2007, A&A, 476, 807
- Pety et al. (2007) Pety J., Goicoechea J. R., Hily-Blant P., Gerin M., Teyssier D., 2007, A&A, 464, L41
- Plume et al. (1992) Plume R., Jaffe D. T., Evans II N. J., 1992, ApJS, 78, 505
- Podio et al. (2015) Podio L., Codella C., Gueth F., Cabrit S., Bachiller R., Gusdorf A., Lee C.-F., Lefloch B., Leurini S., Nisini B., Tafalla M., 2015, A&A, 581, A85
- Prantzos et al. (1996) Prantzos N., Aubert O., Audouze J., 1996, A&A, 309, 760
- Qi et al. (2013) Qi C., Öberg K. I., Wilner D. J., Rosenfeld K. A., 2013, ApJ, 765, L14
- Qiu et al. (2007) Qiu K., Zhang Q., Beuther H., Yang J., 2007, ApJ, 654, 361
- Reid & Ho (1985) Reid M. J., Ho P. T. P., 1985, ApJ, 288, L17
- Rizzo et al. (2005) Rizzo J. R., Fuente A., García-Burillo S., 2005, ApJ, 634, 1133
- Rodgers & Charnley (2008) Rodgers S. D., Charnley S. B., 2008, ApJ, 689, 1448
- Rodriguez et al. (1980) Rodriguez L. F., Moran J. M., Ho P. T. P., Gottlieb E. W., 1980, ApJ, 235, 845
- Rygl et al. (2012) Rygl K. L. J., Brunthaler A., Sanna A., Menten K. M., Reid M. J., van Langevelde H. J., Honma M., Torstensson K. J. E., Fujisawa K., 2012, A&A, 539, A79
- Sakai et al. (2012) Sakai T., Sakai N., Furuya K., Aikawa Y., Hirota T., Yamamoto S., 2012, ApJ, 747, 140
- Sanhueza et al. (2012) Sanhueza P., Jackson J. M., Foster J. B., Garay G., Silva A., Finn S. C., 2012, ApJ, 756, 60
- Schilke et al. (1997) Schilke P., Walmsley C. M., Pineau des Forets G., Flower D. R., 1997, A&A, 321, 293
- Schneider et al. (2006) Schneider N., Bontemps S., Simon R., Jakob H., Motte F., Miller M., Kramer C., Stutzki J., 2006, A&A, 458, 855
- Schneider et al. (2010) Schneider N., Csengeri T., Bontemps S., Motte F., Simon R., Hennebelle P., Federrath C., Klessen R., 2010, A&A, 520, A49
- Shah & Wootten (2001) Shah R. Y., Wootten A., 2001, ApJ, 554, 933
- Sobolev (1993) Sobolev A. M., 1993, Astronomy Letters, 19, 293
- Szűcs et al. (2014) Szűcs L., Glover S. C. O., Klessen R. S., 2014, MNRAS, 445, 4055
- Tercero et al. (2010) Tercero B., Cernicharo J., Pardo J. R., Goicoechea J. R., 2010, A&A, 517, A96
- Terzieva & Herbst (2000) Terzieva R., Herbst E., 2000, MNRAS, 317, 563
- Thaddeus et al. (1985) Thaddeus P., Vrtilek J. M., Gottlieb C. A., 1985, ApJ, 299, L63
- Tielens (1983) Tielens A. G. G. M., 1983, A&A, 119, 177
- Timmes et al. (1995) Timmes F. X., Woosley S. E., Weaver T. A., 1995, ApJS, 98, 617
- Torrelles et al. (2011) Torrelles J. M., Patel N. A., Curiel S., Estalella R., Gómez J. F., Rodríguez L. F., Cantó J., Anglada G., Vlemmings W., Garay G., Raga A. C., Ho P. T. P., 2011, MNRAS, 410, 627
- van der Tak et al. (2013) van der Tak F. F. S., Chavarría L., Herpin F., Wyrowski F., Walmsley C. M., van Dishoeck E. F., Benz A. O., Bergin E. A., Caselli P., Hogerheijde M. R., Johnstone D., Kristensen L. E., Liseau R., Nisini B., Tafalla M., 2013, A&A, 554, A83
- van Dishoeck & Blake (1998) van Dishoeck E. F., Blake G. A., 1998, ARA&A, 36, 317
- Vrtilek et al. (1987) Vrtilek J. M., Gottlieb C. A., Thaddeus P., 1987, ApJ, 314, 716
- Wang et al. (2009) Wang M., Chin Y.-N., Henkel C., Whiteoak J. B., Cunningham M., 2009, ApJ, 690, 580
- Wilson (1999) Wilson T. L., 1999, Reports on Progress in Physics, 62, 143
- Wilson & Mauersberger (1990) Wilson T. L., Mauersberger R., 1990, A&A, 239, 305
- Wilson & Rood (1994) Wilson T. L., Rood R., 1994, ARA&A, 32, 191
- Wu et al. (2010) Wu J., Evans II N. J., Shirley Y. L., Knez C., 2010, ApJS, 188, 313
- Zinchenko et al. (1994) Zinchenko I., Forsstroem V., Lapinov A., Mattila K., 1994, A&A, 288
- Zinchenko et al. (1997) Zinchenko I., Henning T., Schreyer K., 1997, A&AS, 124
- Zinnecker & Yorke (2007) Zinnecker H., Yorke H. W., 2007, ARA&A, 45, 481
| Source | R.A. | Decl. | Gal Lat | D | Dg | Synthesized Beam | |||
|---|---|---|---|---|---|---|---|---|---|
| (J2000) | (J2000) | degree | (kpc) | (kpc) | (km s-1) | mJy beam-1 | mJy | (, ∘) | |
| Cep A | 22:56:18.1 | 62:01:46.2 | 2.1 | 0.70.04(ref 1) | 8.7 | -11 | 4.810.05 | 10.30.1 | 8.86.6, -22 |
| DR21S | 20:39:00.8 | 42:19:29.8 | 0.5 | 1.50.08(ref 2) | 8.6 | -2 | 57816 | 1393219 | 8.87.2,89 |
| G34 | 18:53:18.5 | 01:14:56.7 | 0.1 | 3.3 (ref 3) | 5.8 | 58 | 20513 | 25125 | 129,-23 |
| S76E | 18:46:10.4 | 07:53:14.1 | 4.7 | 2.11 (ref 4) | 7.0 | 33 | 1331 | 243728 | 14.48.7,50 |
Notes. Columns are (1) source name, (2) right ascension, (3) declination, (4)Galactic latitude, (5)distance D and the reference, (6) galactocentric distance Dg, (7) Local standard of rest velocity. (8) peak intensities of radio continuum emission, (9) flux densities of radio continuum emission, (10) Synthesized beam of radio continuum emission.
| Source | 12C/13C | 14N/15N | 16O/18O | 34S/33S | N(DCN)/N(HCN) | N(DCO+)/N(HCO+) |
|---|---|---|---|---|---|---|
| Cep A | 49.08.6 | 214.141.3 | 422.187.9 | (2.40.5) | (7.91.6) | |
| DR21S | 32.82.4 | 109.911.2 | 532.9113.1 | 5.10.8 | (3.60.4) | (1.50.2) |
| G34 | 38.72.7 | 289.223.6 | 287.927.4 | 4.70.3 | (1.30.1) | (3.50.7) |
| S76E | 46.44.2 | 304.231.9 | 415.960.1 | 5.50.4 | (1.10.1) | (9.84.8) |
| Local interstellar medium | 60-70(ref 1) | 400(ref 2) | 55730(ref 3) | 6.31(ref 4) |
Notes. References. (1) Milam et al. (2005), (2) Terzieva & Herbst (2000), (3) Wilson (1999), (4) Chin et al. (1996).
The errors of isotope ratios were calculated by the error propagation equation in Bevington & Robinson (2003).
| Source | Cep A | DR21S | G34 | S76E | ||||
| Trot | Ntot | Trot | Ntot | Trot | Ntot | Trot | Ntot | |
| Position | K | K | K | K | ||||
| (0′′,0′′) | 399 | 1.0 | 474 | 4.0 | ||||
| (0′′,15′′) | 459 | 2.6 | 404 | 53.7 | ||||
| (0′′,30′′) | 336 | 1.6 | ||||||
| (0′′,-15′′) | 202 | 1.9 | 4713 | 1.9 | ||||
| (0′′,-30′′) | 244 | 1.4 | ||||||
| (15′′,0′′) | 354 | 3.00.4 | ||||||
| (15′′,15′′) | 7127 | 1.1 | ||||||
| (-15′′,15′′) | 682 | 15.40.1 | ||||||
| (-15′′,30′′) | 383 | 3.8 | ||||||
| (-15′′,45′′) | 263 | 1.0 | ||||||
| (-15′′,60′′) | 337 | 1.1 | ||||||
| (-30′′,15′′) | 4515 | 0.7 | ||||||
| (-30′′,-15′′) | 4413 | 0.9 |
Notes: From the mapping results, we only selected the positions that detected three transitions of CH3CN for calculating the Trot and Ntot.


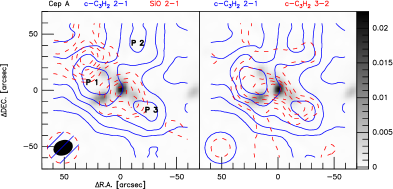
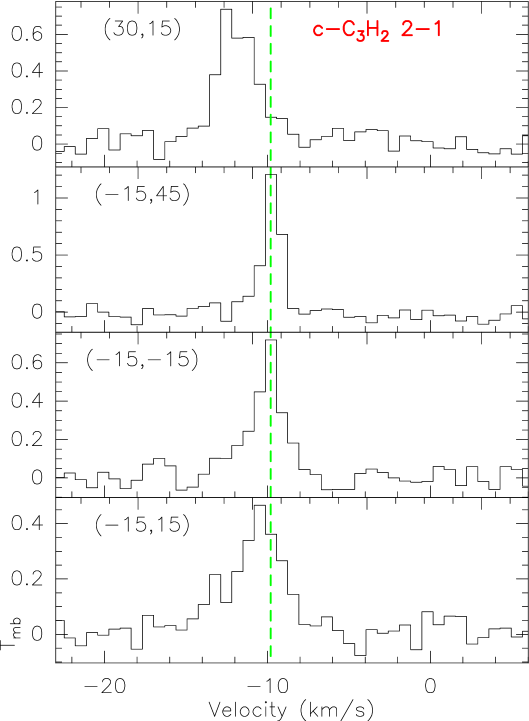


Upper plane: shows -C3H2 emissions in Cep A. Left: Velocity-integrated intensity maps of SiO 2-1 (red dash line, -13.5 to -1.3 km s-1) overlaid on -C3H2 2-1 (-15 to -7 km s-1). Middle: Velocity-integrated intensity maps of -C3H2 3-2 (red dash line, -15 to -7 km s-1) overlaid on -C3H2 2-1. Right: spectra of -C3H2 2-1 at four different positions. The contour levels are 30% to 100%, in step 15% of the peak intensities, for SiO and -C3H2 2-1. -C3H2 3-2 are 45% to 100%, in step 15% of the peak intensity.
Middle plane: -C3H2 emissions in DR21S. Left: velocity-integrated intensity maps of -C3H2 3-2 (red dash line, -6.5 to 2 km s-1) overlaid on -C3H2 2-1 (-6.5 to 2 km s-1). Right: spectrum of -C3H2 overlaid on velocity-integrated intensity map of -C3H2 2-1 absorption component (5.6 to 12 km s-1). The contour level are 30% to 100%, in step 15% of the peak intensity, for -C3H2 3-2 and -C3H2 2-1.
Bottom plane: Left: velocity-integrated intensity maps of -C3H2 3-2 (red dash line) overlaid on -C3H2 2-1 in G34. The contour level are 30% to 100%, in step 15% of the peak intensity, for -C3H2 3-2 and -C3H2 2-1. Right: Velocity-integrated intensity maps of -C3H2 3-2 (red dash line) and CS 3-2 (green dash line) overlaid on -C3H2 2-1 (blue line) in S76E. The contour level are 30% to 100%, in step 15% of the peak intensity, for -C3H2 3-2 and -C3H2 2-1. CS are 80%, 90% and 100%. The ellipse and circle in the bottom conner show the beam sizes (HPBW) of the observations. (A colour version of this figure is available in the online journal.)


Upper plane: from left to right: velocity-integrated intensity maps of SiO 2-1 (-13.5 to -1.3 km s-1), SO 2-1 (-14 to -4 km s-1), and CS 3-2 (red dash line, -17 to 0 km s-1) overlaid on SiO 2-1 (blue line).
Middle plane: from left to right: channel map of SO 2-1, the spectra of SO 2-1 (black line) overlaid on HCO+ 1-0 (red line).
Bottom plane: from left to right: velocity-integrated intensity maps of DCN 1-0 (-15 to -5 km s-1), NH2D1-1 (red dash line, -20 to -5 km s-1) overlaid on DCO+ 2-1 (blue line, -15 to -5 km s-1). The contour levels are 30% to 100%, in step 15% of the peak intensities, for these molecular lines. The ellipse and circle in the bottom-left conner show the beam sizes of the observations.


Upper plane: From left to right, velocity-integrated intensity maps of SiO 2-1 (-20 to 20 km s-1), HNCO 4-3 ( -8 to 3 km s-1), SO 2-1( -8 to 3 km s-1), red triangle indicates the position of CH3OH 5-1,5-40,4 E maser). The contour level are 30% to 100%, in step 15% of the peak intensity, for SiO 2-1, HNCO 4-3, SO 2-1 and HCO+ 1-0.
Middle plane: the spectra of HCO+ 1-0 and CH3OH 5-1,5-40,4 E.
Bottom plane: From left to right, velocity-integrated intensity maps of DCN 2-1 (-9 to 5 km s-1), SO 2-1 (red dash line) overlaid on DCO+ 2-1 (-5.5 to 2 km s-1), NH2D 1-1 (-7.5 to 5 km s-1) and spectra of C2D 2-1. The contour level are 30% to 100%, in step 15% of the peak intensity, for these molecular lines. The ellipse and circle in the bottom-left conner show the beam sizes of the observations.


Upper plane: from the left to right: velocity-integrated intensity maps of SiO 2-1 (50 to 70 km s-1), HNCO 4-3 (52 to 65 km s-1), SO 2-1 (52 to 70 km s-1). The contour level are 30% to 100%, in step 15% of the peak intensity, for SiO 2-1, HNCO 4-3, SO 2-1 and HCO+ 1-0.
Middle plane: the first row is spectrum of HCO+ 1-0, the second row is CS 3-2, and the third row is SiO 2-1.
Bottom plane: From left to right: velocity-integrated intensity maps of DCN 2-1 (50 to 65 km s-1), DCO+ 2-1 (53 to 61 km s-1), SiO 2-1 (red dash line) overlaid on NH2D 1-1 (50 to 65 km s-1), the spectra of HDCS 3-2. The contour level are 30% to 100%, in step 15% of the peak intensity, for DCN 2-1, DCO+ 2-1, SiO 2-1 and NH2D 1-1. The ellipse and circle in the bottom-left conner show the beam sizes of the observations.


Upper plane: from left to right: velocity-integrated intensity maps of SiO 2-1 (25 to 55 km s-1), SO 2-1 (30 to 40 km s-1). The contour level are 30% to 100%, in step 15% of the peak intensity, for SiO 2-1 and SO 2-1.
Middle plane: from left to right: velocity-integrated intensity maps of redshift velocity component (25 to 33.5 km s-1) of SiO 2-1 overlaid on its blueshift velocity component (33.5 to 55 km s-1), position-velocity diagram of SiO 2-1 (PA=90∘). The contour level are 30% to 100%, in step 15% of the peak intensity, for SiO 2-1.
Bottom plane: Left: velocity-integrated intensity maps of SiO 2-1 (green dash line) and NH2D 1-1 (red dash line, 28 to 38 km s-1) overlaid on DCN 2-1 (blue line, 30 to 38 km s-1). The contour level are 30% to 100%, in step 15% of the peak intensity, for SiO 2-1, NH2D 1-1 and DCN 2-1. Middle: DCO+ 2-1 line profile. Right: C2D 2-1 line profile. The ellipse and circle in the bottom-left conner show the beam sizes of the observations.


Appendix A The molecular line profiles


Appendix B The parameters of molecular lines.
| Species | Transition | Rest Frequency | ||
|---|---|---|---|---|
| MHz | D | |||
| DCN | 2-1 | 144828.11 | 10.43 | 13.42 |
| H13CN | 1-0 | 86342.26 | 4.14 | 15.85 |
| DCO+ | 2-1 | 144077.29 | 10.37 | 7.89 |
| H13CO+ | 1-0 | 86754.29 | 4.16 | 6.34 |
The parameters of molecular lines were assigned using CMDS spectroscopic databases.
| Molecule | Transition | Frequency | FWHM | |||
|---|---|---|---|---|---|---|
| MHz | (K km s-1) | (km s-1) | (km s-1) | K | ||
| CH3OH | vt=0,1 5(-1,5)-4(0,4)E | 84521.16 | 0.63 0.05 | -10.80 0.13 | 3.66 0.32 | 0.16 |
| HC18O+ | 1-0 | 85162.22 | 0.39 0.04 | -10.85 0.19 | 3.52 0.39 | 0.11 |
| HC5N | v=0 32-31 | 85201.34 | 0.29 0.05 | -11.62 0.24 | 3.15 0.66 | 0.05 |
| -C3H2 | 2(1,2)-1(0,1) | 85338.89 | 1.01 0.04 | -10.49 0.07 | 3.38 0.17 | 0.28 |
| HCS+ | 2-1 | 85347.89 | 0.34 0.04 | -10.81 0.22 | 3.61 0.48 | 0.09 |
| CH3CCH | 5(3)-4(3) | 85442.60 | 0.22 0.06 | -10.73 0.67 | 4.71 1.91 | 0.04 |
| CH3CCH | 5(2)-4(2) | 85450.76 | 0.49 0.05 | -10.77 0.18 | 3.55 0.38 | 0.13 |
| CH3CCH | 5(1)-4(1) | 85455.66 | 0.90 0.04 | -10.70 0.07 | 2.81 0.15 | 0.30 |
| CH3CCH | 5(0)-4(0) | 85457.29 | 1.18 0.04 | -10.77 0.05 | 3.11 0.13 | 0.36 |
| C4H | 9-8 J=17/2-15/2 | 85672.58 | 0.13 0.04 | -10.66 0.32 | 2.37 0.71 | 0.05 |
| NH2D | 1(1,1)0+-1(0,1)0- F=1-2 | 85926.27 | 1.02 0.09 | -11.86 0.24 | 5.99 0.79 | 0.06 |
| HC15N | v=0 1-0 | 86054.96 | 0.53 0.04 | -10.69 0.12 | 3.24 0.27 | 0.15 |
| SO | v=0 N,J=2,2-1,1 | 86093.95 | 0.89 0.05 | -10.45 0.09 | 3.69 0.24 | 0.23 |
| H13CN | 1-0 F=1-1 | 86338.73 | 0.67 0.04 | -10.55 0.09 | 3.01 0.24 | 0.21 |
| H13CN | 1-0 F=2-1 | 86340.17 | 1.28 0.05 | -10.60 0.06 | 3.70 0.17 | 0.33 |
| H13CN | 1-0 F=0-1 | 86342.25 | 0.26 0.04 | -10.46 0.32 | 3.76 0.71 | 0.07 |
| H13CO+ | 1-0 | 86754.28 | 3.38 0.05 | -10.71 0.02 | 3.41 0.05 | 0.93 |
| SiO | v=0-6 2-1 v=0 | 86846.96 | 0.50 0.07 | -10.21 0.53 | 7.51 1.36 | 0.06 |
| HN13C | 1-0 F=1-1 | 87090.82 | 0.86 0.04 | -10.40 0.06 | 2.92 0.14 | 0.28 |
| CCH | v=0 1-0 3/2-1/2 F=1-1 | 87284.10 | 0.74 0.04 | -10.81 0.09 | 3.24 0.22 | 0.22 |
| CCH | v=0 1-0 3/2-1/2 F=2-1 | 87316.89 | 4.95 0.18 | -10.88 0.06 | 3.35 0.14 | 1.39 |
| CCH | v=0 1-0 3/2-1/2 F=1-0 | 87328.58 | 2.72 0.05 | -10.82 0.02 | 3.31 0.06 | 0.79 |
| CCH | v=0 1-0 1/2-1/2 F=1-1 | 87401.98 | 2.87 0.05 | -10.82 0.02 | 3.38 0.06 | 0.81 |
| CCH | v=0 1-0 1/2-1/2 F=0-1 | 87407.16 | 1.34 0.05 | -10.62 0.05 | 3.42 0.13 | 0.37 |
| CCH | v=0 1-0 1/2-1/2 F=1-0 | 87446.47 | 0.65 0.04 | -10.89 0.09 | 3.27 0.20 | 0.19 |
| HC5N | v=0 33-32 | 87863.63 | 0.14 0.04 | -12.37 0.21 | 1.54 0.68 | 0.09 |
| HNCO | 4(0,4)-3(0,3) | 87925.23 | 0.41 0.05 | -10.69 0.25 | 4.07 0.70 | 0.10 |
| HCN | 1-0 F=1-1 | 88630.41 | 12.67 0.43 | -12.53 0.14 | 8.66 0.31 | 1.38 |
| HCN | 1-0 F=2-1 | 88631.84 | 4.52 0.23 | -12.17 0.02 | 2.23 0.07 | 1.90 |
| HCN | 1-0 F=0-1 | 88633.93 | 3.74 0.20 | -10.71 0.11 | 4.74 0.25 | 0.74 |
| HCO+ | v=0 1-0 | 89188.52 | 13.02 0.43 | -12.13 0.05 | 4.07 0.20 | 3.01 |
| HC5N | v=0 34-33 | 90525.88 | 0.21 0.04 | -10.53 0.45 | 3.35 0.87 | 0.04 |
| HNC | v=0 1-0 | 90663.56 | 11.39 0.04 | -10.91 0.00 | 4.40 0.01 | 2.43 |
| CCS | 7-6 | 90686.38 | 0.18 0.04 | -10.32 0.36 | 3.57 0.77 | 0.05 |
| HCCCN | v=0 10-9 | 90979.02 | 3.44 0.04 | -10.43 0.01 | 2.95 0.03 | 1.09 |
| CH3CN | v=0 5(1)-4(1) | 91985.31 | 0.22 0.05 | -10.47 0.28 | 3.29 0.90 | 0.07 |
| CH3CN | v=0 5(0)-4(0) | 91987.08 | 0.21 0.04 | -10.24 0.25 | 2.91 0.59 | 0.07 |
| 33SO2 | 4(2,2)-4(1,3) F=5.5-5.5 | 143793.88 | 0.27 0.04 | -11.25 0.26 | 3.39 0.57 | 0.08 |
| 33SO2 | 4(2,2)-4(1,3) | 143795.86 | 0.22 0.04 | -10.65 0.34 | 3.15 0.74 | 0.06 |
| CH3OH | 3(1,3)-2(1,2) A++ | 143865.79 | 0.25 0.04 | -11.11 0.26 | 3.33 0.47 | 0.07 |
| DCO+ | 2-1 | 144077.28 | 0.46 0.04 | -10.60 0.17 | 3.37 0.32 | 0.13 |
| CH3C3N | 35(19)-34(19) | 144087.77 | 0.33 0.04 | -9.32 0.31 | 4.09 0.53 | 0.08 |
| CH3OH | vt=0 24(-6,18)-25(-5,20) | 144194.75 | 0.33 0.04 | -4.79 0.21 | 3.62 0.47 | 0.09 |
| CCD | 2-1 J=5/2-3/2F=7/2-5/2 | 144241.96 | 0.27 0.04 | -11.83 0.36 | 4.30 0.73 | 0.04 |
| CCD | 2-1 J=5/2-3/2 F=3/2-1/2 | 144243.05 | 0.13 0.03 | -14.87 0.27 | 2.14 0.56 | 0.05 |
| C34S | 2-1 | 144617.10 | 0.73 0.03 | -10.55 0.06 | 2.73 0.14 | 0.25 |
| DCN | 2-1 F1=2-1 | 144828.00 | 0.61 0.05 | -10.71 0.18 | 4.66 0.45 | 0.13 |
| -C3H2 | 3(1,2)-2(2,1) | 145089.62 | 0.23 0.03 | -10.33 0.18 | 2.64 0.39 | 0.09 |
| CH3OH | 3(0,3)-2(0,2) E | 145093.76 | 0.54 0.05 | -11.55 0.31 | 5.78 0.82 | 0.09 |
| CH3OH | 3(-1,3)-2(-1,2) E | 145097.44 | 1.48 0.05 | -10.71 0.05 | 3.67 0.16 | 0.38 |
| CH3OH | 3(0,3)-2(0,2) A++ | 145103.19 | 1.86 0.04 | -10.69 0.04 | 3.75 0.11 | 0.47 |
| CH3OH | 3(-2,2)-2(-2,1) E | 145126.39 | 0.23 0.17 | -10.14 1.53 | 3.81 2.89 | 0.06 |
| CH3OH | 3(1,2)-2(1,1) E | 145131.87 | 0.25 0.04 | -11.08 0.37 | 4.57 0.79 | 0.05 |
| HCCCN | 16-15 | 145560.95 | 1.04 0.04 | -10.56 0.05 | 2.97 0.12 | 0.33 |
| H2CO | 2(0,2)-1(0,1) | 145602.95 | 4.19 0.04 | -10.76 0.02 | 4.38 0.05 | 0.90 |
| OCS | 12-11 | 145946.81 | 0.11 0.04 | -10.09 0.33 | 1.90 1.05 | 0.05 |
| CH3OH | 3(1,2)-2(1,1) A– | 146368.34 | 0.46 0.08 | -10.55 0.48 | 6.36 1.82 | 0.07 |
| (CH3)2CO | v=0 43(16,27)-42(19,24)EE | 146599.28 | 0.17 0.04 | -9.28 0.26 | 2.23 0.73 | 0.07 |
| CS | 3-2 | 146969.02 | 9.80 0.09 | -10.65 0.02 | 4.57 0.04 | 2.01 |
| -HCCCD | 19(6,13)-18(8,10) | 147021.69 | 0.47 0.09 | -12.81 0.38 | 4.19 1.10 | 0.11 |
| Molecule | Transition | Frequency | FWHM | |||
|---|---|---|---|---|---|---|
| MHz | (K km s-1) | (km s-1) | (km s-1) | K | ||
| CH3OH | 5(-1,5)-4(0,4) | 84521.20 | 0.62 0.05 | -2.03 0.10 | 2.74 0.32 | 0.22 |
| H | H60 | 84914.39 | 3.80 0.16 | -0.16 0.68 | 30.80 1.68 | 0.05 |
| HC18O+ | 1-0 | 85162.22 | 0.15 0.02 | -1.69 0.16 | 1.60 0.46 | 0.10 |
| HC5N | 32-31 | 85201.34 | 0.35 0.04 | -2.07 0.12 | 2.32 0.28 | 0.14 |
| C13CH | 1-0 3/2-1/2F=2,2.5-1,1.5 | 85229.27 | 0.12 0.02 | -2.00 0.14 | 1.30 0.48 | 0.09 |
| C13CH | 1-0 3/2-1/2F=2,1.5-1,0.5 | 85232.76 | 0.95 0.04 | -2.84 0.39 | 1.97 0.83 | 0.04 |
| C13CH | 1-0 3/2-1/2F=1,1.5-0,0.5 | 85256.96 | 0.14 0.05 | -2.10 0.69 | 3.36 1.99 | 0.03 |
| c-C3H2 | 2(1,2)-1(0,1) | 85338.90 | 2.36 0.05 | -2.13 0.03 | 3.44 0.08 | 0.64 |
| HCS+ | 2-1 | 85347.86 | 0.34 0.04 | -1.99 0.19 | 3.19 0.46 | 0.10 |
| CH3CCH | 5(3)-4(3) | 85442.60 | 0.13 0.02 | -1.91 0.26 | 2.02 0.52 | 0.06 |
| CH3CCH | 5(2)-4(2) | 85450.76 | 0.34 0.04 | -1.77 0.11 | 2.27 0.28 | 0.14 |
| CH3CCH | 5(1)-4(1) | 85455.66 | 0.81 0.04 | -1.87 0.05 | 2.30 0.13 | 0.33 |
| CH3CCH | 5(0)-4(0) | 85457.29 | 0.90 0.04 | -1.84 0.05 | 2.37 0.13 | 0.36 |
| C4H | 9-8 J=19/2-17/2 | 85634.00 | 0.25 0.04 | -2.34 0.18 | 2.48 0.53 | 9.58 |
| -C3H2 | 4(3,2)-4(2,3) | 85656.41 | 0.25 0.05 | -3.57 0.63 | 5.59 1.40 | 0.04 |
| He | He42 | 85723.31 | 5.55 0.40 | -0.74 0.12 | 32.51 0.64 | 0.02 |
| H | H42 | 85688.39 | 26.20 0.20 | 0.78 1.16 | 37.49 2.87 | 0.34 |
| SO | N,J=2,2-1,1 | 86093.98 | 0.63 0.05 | -2.30 0.12 | 3.29 0.34 | 0.18 |
| CCS | N,J=7,6-6,5 | 86181.41 | 0.16 0.04 | -2.07 0.31 | 2.69 0.79 | 0.06 |
| H13CN | 1-0 F=1-1 | 86338.73 | 1.07 0.05 | -2.03 0.06 | 2.75 0.17 | 0.36 |
| H13CN | 1-0 F=2-1 | 86340.17 | 1.90 0.05 | -2.02 0.03 | 2.83 0.10 | 0.63 |
| H13CN | 1-0 F=0-1 | 86342.25 | 0.50 0.07 | -1.66 0.17 | 3.06 0.66 | 0.16 |
| H | H70 | 86488.42 | 1.08 0.14 | -1.99 1.80 | 27.62 4.42 | 0.03 |
| HCO | 1(0,1)-0(0,0) 3/2-1/2 F=2-1 | 86670.82 | 0.57 0.04 | -2.17 0.11 | 3.04 0.25 | 0.18 |
| HCO | 1(0,1)-0(0,0) 3/2-1/2 F=1-0 | 86708.35 | 0.40 0.05 | -2.29 0.18 | 3.18 0.46 | 0.12 |
| H13CO+ | 1-0 | 86754.28 | 2.57 0.04 | -2.00 0.02 | 2.72 0.05 | 0.89 |
| HCO | 1(0,1)-0(0,0) 1/2-1/2 F=1-1 | 86777.43 | 0.35 0.04 | -2.52 0.20 | 3.28 0.51 | 0.10 |
| SiO | 2-1 v=0 | 86846.99 | 2.79 0.08 | -1.51 0.22 | 5.06 0.59 | 0.17 |
| HN13C | 1-0 F=2-1 | 87090.85 | 1.30 0.04 | -1.60 0.03 | 2.39 0.09 | 0.51 |
| CCH | 1-0 3/2-1/2 F=1-1 | 87284.15 | 1.01 0.04 | -2.03 0.05 | 2.77 0.15 | 0.34 |
| CCH | 1-0 3/2-1/2 F=2-1 | 87316.92 | 7.67 0.05 | -2.14 0.01 | 3.11 0.02 | 2.32 |
| CCH | 1-0 3/2-1/2 F=1-0 | 87328.62 | 4.16 0.05 | -2.08 0.01 | 3.01 0.04 | 1.30 |
| CCH | 1-0 1/2-1/2 F=1-1 | 87402.00 | 4.12 0.05 | -2.16 0.01 | 2.98 0.04 | 1.30 |
| CCH | 1-0 1/2-1/2 F=0-1 | 87407.16 | 1.94 0.04 | -2.17 0.03 | 2.94 0.08 | 0.62 |
| CCH | 1-0 1/2-1/2 F=1-0 | 87446.47 | 1.01 0.04 | -2.10 0.05 | 2.75 0.13 | 0.35 |
| H | H65 | 87615.00 | 2.29 0.16 | -0.14 1.39 | 36.62 3.22 | 0.02 |
| HC5N | 33-32 | 87863.63 | 0.27 0.04 | -1.99 0.15 | 2.13 0.33 | 0.12 |
| HNCO | 4(0,4)-3(0,3) | 87925.23 | 0.43 0.05 | -2.22 0.14 | 2.54 0.37 | 0.16 |
| HCN | 1-0 F=1-1 | 88630.41 | 7.24 0.18 | -1.22 0.04 | 3.95 0.11 | 1.72 |
| HCN | 1-0 F=2-1 | 88631.84 | 19.00 0.41 | -2.43 0.03 | 4.66 0.09 | 3.84 |
| HCN | 1-0 F=0-1 | 88633.93 | 8.43 0.61 | -2.26 0.66 | 5.00 0.66 | 1.59 |
| H15NC | 1-0 | 88865.69 | 0.15 0.04 | -1.97 0.22 | 1.65 0.40 | 0.09 |
| HCO+ | v=0,1-0 | 89188.52 | 28.74 0.41 | -3.08 0.06 | 9.44 0.18 | 2.87 |
| HCCNC | 9-8 | 89419.26 | 0.23 0.05 | -2.10 0.30 | 3.00 0.72 | 0.07 |
| t-HCOOH | 4(3,1)-3(3,0) | 89950.33 | 0.29 0.05 | -1.31 0.52 | 4.99 1.04 | 0.05 |
| t-HCOOH | 4(2,2)-3(2,1) | 90164.63 | 0.28 0.07 | -4.49 0.78 | 8.02 2.90 | 0.03 |
| HC5N | 34-33 | 90525.89 | 0.25 0.02 | -2.20 0.17 | 2.86 0.38 | 0.08 |
| HC13CCN | 10–9 | 90593.05 | 0.27 0.02 | -1.75 0.18 | 3.09 0.46 | 0.08 |
| HCC13CN | 10-9 | 90601.79 | 0.19 0.02 | -2.08 0.16 | 2.10 0.35 | 0.09 |
| HNC | v=0 1-0 | 90663.56 | 13.72 0.06 | -2.29 0.00 | 3.82 0.02 | 3.39 |
| CCS | N,J=7,7-6,6 | 90686.38 | 0.13 0.04 | -2.88 0.61 | 3.80 1.58 | 0.03 |
| HCCCN | v=0 | 90979.02 | 4.82 0.04 | -0.93 0.00 | 2.44 0.02 | 1.86 |
| c-C3H | 2(1,2)-1(1,1) 5/2,3-3/2,2 | 91494.34 | 0.22 0.04 | -2.50 0.22 | 2.76 0.55 | 0.08 |
| c-C3H | 2(1,2)-1(1,1) 5/2,2-3/2,1 | 91497.60 | 0.19 0.04 | -2.24 0.27 | 2.86 0.86 | 0.06 |
| H | H64 | 91663.13 | 1.87 0.13 | -0.87 0.99 | 28.14 2.11 | 0.05 |
| CH3CN | 5(3)-4(3) F=4-3 | 91971.46 | 0.45 0.06 | -1.67 0.16 | 6.46 1.15 | 0.06 |
| CH3CN | 5(2)-4(2) F=6-5 | 91979.99 | 0.14 0.02 | -2.71 0.16 | 1.71 0.32 | 0.08 |
| CH3CN | 5(1)-4(1) | 91985.31 | 0.43 0.04 | -2.32 0.11 | 2.69 0.29 | 0.16 |
| CH3CN | 5(0)-4(0) | 91987.08 | 0.63 0.04 | -2.13 0.09 | 3.08 0.28 | 0.19 |
| Molecule | Transition | Frequency | FWHM | |||
|---|---|---|---|---|---|---|
| MHz | (K km s-1) | (km s-1) | (km s-1) | K | ||
| H | H41 | 92034.43 | 23.86 0.14 | -0.95 0.09 | 31.55 0.21 | 0.32 |
| DCO+ | 2-1 | 144077.28 | 0.43 0.04 | -1.86 0.10 | 2.24 0.22 | 0.18 |
| unidentified | 144199.7 | 0.49 0.05 | -2.26 0.11 | 2.05 0.27 | 0.23 | |
| CCD | N=2-1,J=5/2-3/2,F=7/2-5/2 | 144241.93 | 0.32 0.04 | -3.12 0.20 | 3.09 0.42 | 0.10 |
| CH3OCHO | v=1 18(14, 5)-19(13, 6) A | 144373.86 | 0.23 0.04 | -2.94 0.68 | 3.49 0.90 | 0.03 |
| C34S | 3-2 | 144616.13 | 1.50 0.04 | -4.37 0.03 | 2.59 0.08 | 0.55 |
| DCN | J= 2 - 1, F=2-1 | 144828.00 | 0.97 0.05 | -1.76 0.13 | 5.22 0.45 | 0.17 |
| -C3H2 | 3(1,2)-2(2,1) | 145089.62 | 0.27 0.09 | -2.35 0.37 | 2.06 0.88 | 0.12 |
| CH3OH | 3(-1,3)-2(-1,2) E | 145097.44 | 0.80 0.10 | -2.29 0.17 | 2.78 0.45 | 0.27 |
| CH3OH | 3(0,3)-2(0,2) A++ | 145103.19 | 1.08 0.09 | -2.19 0.11 | 2.91 0.32 | 0.35 |
| CH3OH | 3(-2,2)-2(-2,1) E | 145126.39 | 0.92 0.06 | -1.65 0.25 | 6.26 0.47 | 0.14 |
| CH3OH | 3(1,2)-2(1,1) E | 145131.87 | 0.46 0.05 | -2.84 0.45 | 6.92 1.09 | 0.06 |
| (CH3)2CO | 23(11,13)-22(12,10) AE | 145369.23 | 0.65 0.04 | -2.71 0.09 | 3.01 0.19 | 0.06 |
| -H2CCC | 7(2,5)-6(2,4) | 145532.32 | 0.31 0.06 | -4.54 0.41 | 3.99 0.85 | 0.07 |
| HCCCN | 16-15 | 145560.95 | 1.95 0.04 | -2.21 0.02 | 2.61 0.06 | 0.70 |
| H2CO | (0,2)-1(0,1) | 145602.95 | 4.32 0.05 | -2.42 0.02 | 3.72 0.05 | 1.09 |
| C33S | 3-2 F=3/2-1/2 | 145755.62 | 0.28 0.04 | -2.66 0.20 | 3.05 0.65 | 0.09 |
| CH3OH | 3( 1, 2)- 2( 1, 1) - - | 146368.34 | 2.60 0.22 | -3.76 0.31 | 7.51 0.80 | 0.33 |
| SO2 | 4(2,2)-4(1,3) | 146605.51 | 2.48 0.20 | -4.84 0.32 | 7.72 0.73 | 0.30 |
| CH3OH | 9(0,9)-8(1,8) A++ | 146618.83 | 0.33 0.04 | -2.64 0.21 | 3.14 0.49 | 0.10 |
| H2CN | 2(0,2)-1(0,1),F=5/2-5/2 | 146660.74 | 0.43 0.08 | -1.83 0.43 | 4.46 0.76 | 0.09 |
| CH3OCHO | 26(6,21)-25( 7,18) A | 146753.39 | 0.23 0.05 | -3.66 0.31 | 2.86 0.79 | 0.08 |
| 13CH2CHCN | 13(1,13)-12(0,12) | 146846.03 | 0.22 0.05 | -1.41 0.55 | 3.84 0.77 | 0.06 |
| -CH2OHCHO | v=0 40(5,35)-41(4,38) | 146916.98 | 0.48 0.08 | -3.96 0.59 | 5.90 1.08 | 0.08 |
| CS | 3-2 | 146969.02 | 12.52 0.13 | -2.44 0.01 | 4.00 0.05 | 2.94 |
| H2CCH13CN | 18(0,18) - 17(1,17) | 147042.13 | 2.10 0.14 | -1.00 0.23 | 7.07 0.58 | 0.28 |
| Molecule | Transition | Frequency | FWHM | |||
|---|---|---|---|---|---|---|
| MHz | (K km s-1) | (km s-1) | (km s-1) | K | ||
| C6H | 23/2 J=61/2-59/2 f | 84574.59 | 0.13 0.04 | 60.97 0.33 | 2.71 0.91 | 0.05 |
| t-CH3CH2OH | 4(2,3)-4(1,4) | 84595.78 | 0.27 0.06 | 60.04 0.65 | 6.26 1.64 | 0.04 |
| 30SiO | 2-1 v=0 | 84745.99 | 0.43 0.07 | 60.90 0.96 | 11.14 1.87 | 0.04 |
| NH2CHO | 4(2,3)-3(2,2) n,t | 84807.79 | 0.41 0.05 | 58.08 0.37 | 6.01 0.83 | 0.07 |
| O13CS | 7–6 | 84865.15 | 0.22 0.04 | 58.04 0.50 | 4.69 1.01 | 0.05 |
| H | H60 | 84914.39 | 0.71 0.09 | 55.64 1.33 | 20.87 2.49 | 0.03 |
| 13CH3OH | 8(0,8)-7(1,7) A++ | 84970.23 | 0.63 0.06 | 59.76 0.37 | 7.42 0.80 | 0.08 |
| NH2CHO | 4(2,2)-3(2,1) | 85093.26 | 0.13 0.04 | 59.38 0.42 | 3.29 1.14 | 0.04 |
| OCS | 7-6 | 85139.10 | 1.02 0.05 | 59.28 0.12 | 5.39 0.29 | 0.18 |
| HC18O+ | 1-0 | 85162.22 | 0.65 0.04 | 59.02 0.12 | 4.10 0.32 | 0.15 |
| C13CH | 1-0 3/2-1/2F=1,0.5-0,0.5 | 85247.65 | 0.13 0.04 | 59.61 0.43 | 2.65 0.74 | 0.04 |
| C13CH | 1-0 3/2-1/2 F=1,1.5-0,0.5 | 85256.96 | 0.18 0.05 | 58.90 0.96 | 5.89 2.11 | 0.03 |
| t-CH3CH2OH | 6(0,6)-5(1,5) | 85265.50 | 0.32 0.05 | 59.25 0.40 | 5.52 1.07 | 0.06 |
| -C3H2 | 2(1,2)-1(0,1) | 85338.90 | 1.74 0.05 | 59.30 0.07 | 5.41 0.20 | 0.30 |
| HCS+ | 2-1 | 85347.86 | 0.84 0.05 | 58.99 0.13 | 5.15 0.33 | 0.15 |
| CH3CCH | 5(3)-4(3) | 85442.60 | 0.23 0.19 | 58.88 1.58 | 3.65 3.15 | 0.06 |
| CH3CCH | 5(2)-4(2) | 85450.76 | 0.62 0.05 | 58.85 0.16 | 4.44 0.43 | 0.13 |
| CH3CCH | 5(1)-4(1) | 85455.66 | 1.40 0.06 | 58.96 0.08 | 4.35 0.20 | 0.30 |
| CH3CCH | 5(0)-4(0) | 85457.29 | 1.64 0.06 | 58.97 0.07 | 4.24 0.17 | 0.36 |
| CH3OH | 6(-2,5)-7(-1,7) E | 85568.07 | 0.16 0.04 | 59.06 0.37 | 3.68 1.00 | 0.04 |
| C4H | 9(10,10)-8(9,9) | 85634.02 | 0.26 0.05 | 60.08 0.54 | 6.19 1.48 | 0.04 |
| CH3OCHO | 4(2,3)-3(1.2) A | 85655.80 | 0.16 0.04 | 58.71 0.71 | 6.01 1.91 | 0.03 |
| H | H42 | 85688.39 | 3.38 0.09 | 54.48 0.39 | 27.11 0.98 | 0.12 |
| 29SiO | 2-1 v=0 | 85759.18 | 0.19 0.04 | 58.71 0.33 | 3.48 0.72 | 0.05 |
| CH3OCHO | 7(6,2)-6(6,1) A+E | 85926.50 | 0.47 0.06 | 59.52 0.45 | 7.85 1.36 | 0.06 |
| CH3OCHO | 7(5,2)-6(5,1) E | 86021.00 | 0.26 0.04 | 59.27 0.44 | 5.68 1.05 | 0.04 |
| CH3OCHO | 7(5,3)-6(5,2) E | 86027.67 | 0.06 0.02 | 60.30 0.38 | 1.82 0.64 | 0.04 |
| CH3OCHO | 7(5,2)-6(5,1) A | 86030.21 | 0.77 0.11 | 60.56 1.08 | 16.09 3.14 | 0.05 |
| HC15N | 1-0 | 86054.96 | 1.08 0.04 | 58.96 0.07 | 4.00 0.19 | 0.25 |
| SO | N,J=2,2-1,1 | 86093.98 | 1.54 0.05 | 59.39 0.07 | 5.23 0.20 | 0.28 |
| CCS | N,J=7,6-6,5 | 86181.41 | 0.21 0.04 | 59.52 0.39 | 4.58 1.19 | 0.05 |
| CH3OCHO | 7(4,4)-6(4,3) A | 86210.07 | 0.41 0.07 | 59.24 0.60 | 6.98 1.25 | 0.06 |
| CH3OCH3 | 7(4,3)-6(4,2) E | 86223.54 | 0.66 0.05 | 58.04 0.29 | 7.37 0.69 | 0.08 |
| CH3OCHO | 7(4,3)-6(4,2) A | 86250.57 | 0.26 0.04 | 59.33 0.50 | 5.42 0.91 | 0.04 |
| CH3OCHO | 7(3,5)-6(3,4) A | 86265.82 | 0.36 0.06 | 60.28 0.38 | 5.36 1.16 | 0.06 |
| CH3OCHO | 7(3,5)-6(3,4) E | 86268.65 | 0.54 0.06 | 58.58 0.38 | 7.55 1.06 | 0.07 |
| H13CN | 1-0 F=1-1 | 86338.73 | 2.46 0.08 | 59.20 0.06 | 4.18 0.14 | 0.55 |
| H13CN | 1-0 F=2-1 | 86340.17 | 4.45 0.14 | 58.95 0.67 | 4.40 0.67 | 0.95 |
| H13CN | 1-0 F=0-1 | 86342.25 | 1.51 0.11 | 59.69 0.22 | 6.49 0.54 | 0.22 |
| t-HCOOH | 4(1,4)-3(1,3) | 86546.19 | 0.08 0.02 | 58.68 0.26 | 1.56 0.60 | 0.05 |
| CH3OH | 7(2,6)-6(3,3) A– | 86615.60 | 0.36 0.06 | 58.66 0.87 | 10.42 1.81 | 0.03 |
| SO2 | 8(3,5)-9(2,8) | 86639.09 | 0.42 0.04 | 58.03 0.24 | 4.80 0.59 | 0.08 |
| HCO | (0,1)-0(0,0) 3/2-1/2 F=2-1 | 86670.82 | 0.25 0.04 | 60.01 0.32 | 3.98 0.77 | 0.06 |
| CCCS | 15-14 | 86708.37 | 0.16 0.04 | 59.08 0.42 | 3.74 1.05 | 0.04 |
| H13CO+ | 1-0 | 86754.28 | 4.57 0.04 | 58.73 0.01 | 4.49 0.04 | 0.98 |
| CH3CH2CN | 10(1,10)-9(1,9) | 86819.84 | 0.45 0.05 | 57.84 0.32 | 5.59 0.92 | 0.08 |
| SiO | 2-1 v=0 | 86846.99 | 2.96 0.07 | 59.55 0.07 | 7.21 0.23 | 0.38 |
| t-HCOOD | 4(2,3)-3(2,2) | 86895.46 | 0.14 0.04 | 59.03 0.71 | 4.60 1.30 | 0.03 |
| CH3OH | 7(2,5)-6(3,4) A++ | 86902.94 | 0.40 0.05 | 57.96 0.66 | 9.45 1.25 | 0.04 |
| HC17O+ | 1-0 F=7/2-5/2 | 87057.25 | 0.30 0.05 | 56.89 0.52 | 6.91 1.27 | 0.04 |
| HN13C | 1-0 F=2-1 | 87090.85 | 2.15 0.04 | 59.08 0.03 | 4.03 0.09 | 0.50 |
| C4H | 23/2 J=19/2-17/2 1v7e | 87142.30 | 0.50 0.06 | 56.51 0.54 | 8.91 1.65 | 0.05 |
| unidentified | 87161.31 | 1.06 0.02 | 59.19 0.21 | 1.81 0.52 | 0.05 | |
| C2H | 1-0 3/2-1/2 F=1-1 | 87284.15 | 1.04 0.05 | 59.08 0.09 | 4.50 0.25 | 0.22 |
| C2H | 1-0 3/2-1/2 F=2-1 | 87316.92 | 7.03 0.05 | 58.71 0.01 | 4.36 0.03 | 1.51 |
| C2H | 1-0 3/2-1/2 F=1-0 | 87328.62 | 4.01 0.05 | 58.91 0.02 | 4.37 0.06 | 0.86 |
| C2H | 1-0 1/2-1/2 F=1-1 | 87402.00 | 4.01 0.04 | 58.80 0.02 | 4.34 0.06 | 0.87 |
| C2H | 1-0 1/2-1/2 F=0-1 | 87407.16 | 1.87 0.04 | 58.89 0.04 | 4.21 0.11 | 0.42 |
| C2H | 1-0 1/2-1/2 F=1-0 | 87446.51 | 1.17 0.04 | 58.94 0.08 | 4.76 0.20 | 0.23 |
| HNCO | 4(1,4)-3(1,3) | 87597.33 | 0.47 0.05 | 57.60 0.34 | 6.21 0.94 | 0.07 |
| t-CH3CH2OH | 5(2,4)-5(1,5) | 87716.02 | 0.22 0.04 | 57.30 0.55 | 5.41 1.04 | 0.04 |
| NH2CHO | 4(1,3)-3(1,2) | 87848.87 | 0.40 0.05 | 58.11 0.58 | 8.27 1.12 | 0.05 |
| Molecule | Transition | Frequency | FWHM | |||
|---|---|---|---|---|---|---|
| MHz | (K km s-1) | (km s-1) | (km s-1) | K | ||
| HC5N | 33-32 | 87863.63 | 0.22 0.04 | 58.64 0.34 | 4.07 1.20 | 0.05 |
| H2CCCHCN | 17( 4,14)-16( 4,13) | 87894.36 | 0.22 0.04 | 55.45 0.56 | 5.23 1.03 | 0.04 |
| HNCO | 4(2,2)-3(2,1) | 87898.62 | 0.25 0.05 | 47.34 0.65 | 6.19 1.15 | 0.04 |
| unidentified | 87911.49 | 0.15 0.05 | 57.73 0.43 | 2.87 1.26 | 0.05 | |
| HNCO | 4(0,4)-3(0,3) | 87925.23 | 1.62 0.04 | 58.84 0.06 | 4.91 0.15 | 0.31 |
| CH3OCH3 | 2(2,0)-2(1,1) EE | 88226.72 | 0.15 0.05 | 58.86 0.65 | 3.93 1.36 | 0.04 |
| CH3CH2CHO | 30( 6,24)- 30( 6,25) | 88628.80 | 2.23 0.16 | 59.44 0.16 | 4.53 0.44 | 0.46 |
| HCN | 1-0 F=1-1 | 88630.41 | 0.80 0.08 | 58.49 0.07 | 1.43 0.17 | 0.53 |
| HCN | 1-0 F=2-11 | 88631.84 | 6.02 0.11 | 56.92 0.03 | 3.39 0.06 | 1.67 |
| HCN | 1-0 F=0-1 | 88633.93 | 5.18 0.11 | 57.15 0.03 | 3.06 0.08 | 1.59 |
| H15NC | 1-0 | 88865.69 | 0.21 0.05 | 58.87 0.35 | 2.81 0.95 | 0.07 |
| CH3OH | 15(3,12)-14(4,11) A– | 88939.99 | 0.46 0.05 | 58.59 0.36 | 5.74 0.82 | 0.08 |
| HSCH2CN | 15(6,10)-14(6,9) | 88966.54 | 0.30 0.06 | 57.93 0.54 | 5.37 0.94 | 0.05 |
| HSCH2CN | 15(4,11)-14(4,10) | 88990.96 | 0.16 0.04 | 57.87 0.68 | 5.14 1.39 | 0.03 |
| unidentified | 88999.14 | 0.18 0.04 | 58.77 0.94 | 6.49 2.15 | 0.26 | |
| unidentified | 89007.42 | 0.07 0.02 | 57.29 0.35 | 1.87 0.99 | 0.04 | |
| HSCH2CN | 15(10,6)-14(10,5) | 89026.90 | 0.18 0.40 | 56.48 0.58 | 4.66 0.88 | 0.04 |
| C3N | 9(10,9)-8(9,9) | 89048.27 | 0.13 0.03 | 55.92 0.80 | 5.24 1.36 | 0.03 |
| C3N | 9(9,8)-8(8,8) | 89065.02 | 0.13 0.03 | 56.01 0.42 | 3.61 1.25 | 0.03 |
| HSCH2CN | 15(12,3)-14(12,2) | 89080.78 | 0.21 0.04 | 60.25 0.70 | 6.24 1.39 | 0.03 |
| c-C3D2 | 5(4,2)-5(3,3) | 89316.91 | 0.62 0.07 | 59.85 0.88 | 12.00 1.75 | 0.04 |
| CH3CH2CN | 10(5)-9(5) | 89568.10 | 0.45 0.06 | 56.97 0.37 | 5.64 0.87 | 0.08 |
| CH3CH2CN | 10(8)-9(8) | 89573.05 | 0.26 0.04 | 57.73 0.36 | 4.04 0.73 | 0.06 |
| CH3CH2CN | 10(4,6)-9(4,5) | 89591.01 | 0.79 0.06 | 59.28 0.27 | 6.58 0.69 | 0.11 |
| CH3CH2CN | 10(3,8)-9(3,7) | 89628.44 | 0.45 0.05 | 57.15 0.31 | 5.39 0.67 | 0.08 |
| CH3CH2CN | 10(3,7)-9(3,6) | 89684.71 | 0.18 0.04 | 57.22 0.50 | 3.79 1.01 | 0.05 |
| (CH3)2CO | 9(7,3)-8(8,0) AE | 89684.71 | 0.12 0.04 | 67.65 0.83 | 4.18 1.59 | 0.03 |
| unidentified | 89970.13 | 0.18 0.04 | 60.42 0.42 | 4.02 0.93 | 0.04 | |
| t-CH3CH2OH | 4(1,4)-3(0,3) | 90117.59 | 0.19 0.02 | 58.53 0.31 | 3.82 0.66 | 0.05 |
| CH3OCHO | 7(2,5)-6(2,4) E | 90145.63 | 0.28 0.04 | 58.16 0.47 | 6.46 0.92 | 0.04 |
| CH3OCHO | 7(2,5)-6(2,4) A | 90156.51 | 0.25 0.04 | 58.60 0.37 | 4.92 0.90 | 0.05 |
| CH3OCHO | V=0 8( 0, 8)- 7( 0, 7) E | 90227.66 | 0.56 0.05 | 56.35 0.45 | 10.49 0.91 | 0.05 |
| 15NNH+ | 1-0 | 90263.83 | 0.19 0.02 | 60.06 0.33 | 4.47 0.68 | 0.04 |
| CH3CH2CN | 10(2,8)-9(2,7) | 90453.35 | 0.26 0.05 | 55.83 0.78 | 8.29 2.12 | 0.03 |
| HC5N | 34-33 | 90525.89 | 0.14 0.02 | 58.40 0.42 | 3.71 0.87 | 0.04 |
| SO2 | 25(3,23)-24(4,20) | 90548.16 | 0.13 0.04 | 57.83 0.90 | 6.22 1.77 | 0.02 |
| HC13CCN | 10-9 | 90593.05 | 0.23 0.04 | 58.75 0.41 | 4.98 0.82 | 0.05 |
| HCC13CN | 10-9 | 90601.79 | 0.13 0.02 | 54.65 0.61 | 4.25 1.37 | 0.02 |
| HNC | 1-0 F=0-1 | 90663.45 | 1.54 0.04 | 62.69 0.03 | 3.37 0.08 | 0.44 |
| HNC | 1-0,F=2-1 | 90663.57 | 15.39 0.04 | 56.83 0.00 | 3.85 0.01 | 3.72 |
| CCS | N,J=7,7-6,6 | 90686.38 | 0.23 0.05 | 58.68 0.54 | 6.01 1.75 | 0.04 |
| CH3OH | 20(-3,17)-19(-2,17) Et | 90812.39 | 0.09 0.02 | 54.72 0.64 | 3.97 1.33 | 0.02 |
| CH2CH13CN | 79( 4,75)-78( 6,72) | 90920.15 | 0.07 0.02 | 56.59 0.34 | 2.04 0.94 | 0.04 |
| 13C34S | 2-1 | 90925.99 | 0.21 0.05 | 57.90 0.57 | 5.85 1.60 | 0.04 |
| CH3OCH3 | 6(0,6)-5(1,5) AA | 90937.50 | 0.27 0.06 | 54.87 0.93 | 8.41 2.62 | 0.03 |
| HCCCN | 10-9 | 90978.98 | 6.19 0.04 | 58.30 0.01 | 4.14 0.03 | 1.40 |
| HDCS | 3(1,3)-2(1,2) | 91171.03 | 0.08 0.01 | 58.23 0.19 | 1.55 0.50 | 0.05 |
| H2CN | 13(2,11)-13(2,12),F=27/2-27/2,(n=11-11) | 91201.96 | 0.09 0.02 | 62.19 0.42 | 2.67 0.79 | 0.03 |
| H2CN | 13(2,11)-13(2,12),F=21/2-21/2,(n=23-23) | 91203.59 | 0.59 0.07 | 59.35 0.36 | 6.54 0.94 | 0.09 |
| H2CN | 13(2,11)-13(2,12),F=23/2-23/2,(n=22-22) | 91209.19 | 0.23 0.11 | 68.64 1.12 | 7.30 3.87 | 0.03 |
| HCCCN | 10-9 1v7 e=1f | 91333.37 | 0.07 0.02 | 58.08 0.52 | 2.69 0.95 | 0.03 |
| SO2 | 18(5,13)-19(4,16) | 91550.44 | 0.08 0.02 | 58.16 0.54 | 3.31 1.09 | 0.03 |
| CHCN | 5(0)-4(0) | 91941.60 | 0.38 0.07 | 59.28 1.40 | 16.66 4.80 | 0.02 |
| CH3CN | 5(4)-4(4) F=6-5 | 91959.02 | 0.19 0.05 | 59.69 0.74 | 5.17 1.67 | 0.03 |
| CH3CN | 5(3)-4(3) F=4-3 | 91971.46 | 0.72 0.05 | 59.45 0.22 | 6.73 0.50 | 0.10 |
| CH3CN | 5(2)-4(2) F=6-5 | 91979.99 | 0.73 0.05 | 58.18 0.18 | 4.84 0.44 | 0.14 |
| CH3CN | 5(1)-4(1) | 91985.31 | 1.34 0.07 | 58.39 0.10 | 4.47 0.26 | 0.28 |
| CH3CN | 5(0)-4(0) | 91987.08 | 1.57 0.06 | 58.10 0.08 | 4.80 0.22 | 0.31 |
| H | H41 | 92034.43 | 2.98 0.08 | 54.40 0.37 | 27.66 0.90 | 0.10 |
| Molecule | Transition | Frequency | FWHM | |||
|---|---|---|---|---|---|---|
| MHz | (K km s-1) | (km s-1) | (km s-1) | K | ||
| unidentified | 143778.87 | 0.27 0.03 | 56.92 0.24 | 3.68 0.55 | 0.07 | |
| CH3OCHO | V=1 46(15,32)-67(16,29)A | 143833.84 | 0.22 0.04 | 56.23 0.45 | 4.00 0.86 | 0.05 |
| unidentified | 143858.80 | 0.59 0.06 | 57.72 0.27 | 5.81 0.67 | 0.10 | |
| CH3OH | 3(1,3)-2(1,2) A++ | 143865.79 | 1.27 0.05 | 58.82 0.09 | 4.90 0.23 | 0.25 |
| DCO+ | 2-1 | 144077.28 | 0.22 0.04 | 58.40 0.26 | 3.14 0.75 | 0.07 |
| -C3H4 | 8(3,6)-8(1,7) | 144178.68 | 0.38 0.05 | 59.53 0.32 | 4.48 0.82 | 0.08 |
| CCD | 2-1 J=5/2-3/2F=5/2-3/2 | 144243.05 | 0.20 0.04 | 58.67 0.65 | 5.38 0.97 | 0.04 |
| H2NCH2CN | 33(4,29) - 33(3,30) | 144258.27 | 1.76 0.06 | 61.25 0.07 | 4.39 0.18 | 0.38 |
| CH3OH | 3(0,3)-2(0,2) A++ Vt=2 | 144571.97 | 0.70 0.06 | 60.71 0.50 | 8.99 0.97 | 0.07 |
| CH3OH | 3(-1,2)-2(-1,1) Et=2 | 144583.91 | 0.83 0.08 | 61.16 0.46 | 8.85 1.00 | 0.09 |
| CH3OH | 3(1,3)-2(1,2) A++ t=1 | 144589.85 | 0.83 0.10 | 58.00 0.42 | 6.83 0.99 | 0.12 |
| CCCH | 30-29 | 144524.63 | 0.22 0.04 | 58.44 0.33 | 3.94 0.56 | 0.05 |
| CH3OH | 3(0,3)-2(0,2) A++ Vt=2 | 144571.97 | 0.16 0.04 | 61.39 1.41 | 6.67 2.22 | 0.03 |
| C34S | 3–2 | 144617.10 | 3.63 0.04 | 58.43 0.02 | 4.26 0.06 | 0.80 |
| CH3C5N | 93(6)-92(6),F=93-92 | 144657.80 | 0.73 0.05 | 57.03 0.24 | 6.08 0.49 | 0.11 |
| CH3OH | 3(-2,1)-2(-2,0) Et=1 | 144728.77 | 1.20 0.08 | 59.52 0.20 | 6.68 0.56 | 0.17 |
| CH3OH | 3(2,2)-2(2,1) E t=1 | 144733.24 | 2.03 0.05 | 55.54 0.12 | 8.26 0.29 | 0.23 |
| CH3OH | 3(-1,2)-2(-1,1) Et=1 | 144750.24 | 0.47 0.05 | 58.84 0.33 | 5.99 0.72 | 0.08 |
| CH3OH | 3(0,3)-2(0,2) A++ t=1 | 144768.17 | 0.37 0.05 | 58.39 0.34 | 4.33 0.82 | 0.08 |
| DCN | 2-1 F1=2-2 | 144826.57 | 0.96 0.05 | 55.80 0.14 | 5.48 0.44 | 0.17 |
| CH3OH | 6(3,3)-6(2,4) EE | 144858.98 | 0.73 0.08 | 57.45 0.55 | 10.55 1.37 | 0.06 |
| CH3OH | 3(1,2)-2(1,1) A–t=1 | 144878.57 | 0.61 0.06 | 58.28 0.51 | 8.57 0.99 | 0.07 |
| -C3H2 | 3(1,2)-2(2,1) | 145089.62 | 1.36 0.29 | 58.49 0.40 | 5.59 0.40 | 0.22 |
| CH3OH | 3(0,3)-2(0,2) E | 145093.76 | 2.54 0.05 | 58.58 0.04 | 4.69 0.13 | 0.51 |
| CH3OH | 3(-1,3)-2(-1,2) E | 145097.44 | 6.28 0.05 | 58.49 0.00 | 4.50 0.04 | 1.31 |
| CH3OH | 3(0,3)-2(0,2) A++ | 145103.19 | 7.19 0.04 | 58.55 0.01 | 4.44 0.03 | 1.52 |
| CH3OH | 3(2,2)-2(2,1) A– | 145124.33 | 1.49 0.90 | 54.76 1.55 | 5.82 5.02 | 0.24 |
| CH3OH | 3(1,2)-2(1,1) E | 145131.87 | 1.50 0.83 | 58.36 1.44 | 5.76 4.09 | 0.25 |
| SiC2 | 6(2,4)-5(2,3) | 145325.84 | 0.59 0.05 | 61.83 0.29 | 6.20 0.59 | 0.09 |
| c-C3HCN | 19(3,16)19 - 19(2,17)19 | 145373.47 | 0.13 0.03 | 57.05 0.50 | 3.56 1.01 | 0.03 |
| 13CH2(OH)CHO | 12(3,9)-11(3,8) | 145362.26 | 0.13 0.03 | 58.84 0.37 | 3.23 0.75 | 0.04 |
| ONCN | 14( 0,14)-13( 0,13) | 145397.59 | 0.88 0.03 | 55.84 0.06 | 2.95 0.12 | 0.28 |
| CH3CH2CN | 16(1,15)-15(1,14) | 145418.03 | 0.31 0.10 | 58.01 0.78 | 4.62 1.58 | 0.06 |
| NCCONH2 | 21(4,17)-20(5,16) | 145550.10 | 0.43 0.06 | 57.75 0.39 | 5.95 0.96 | 0.07 |
| HCCCN | 16-15 1v7 =1e | 145560.95 | 1.75 0.04 | 58.60 0.05 | 4.80 0.14 | 0.34 |
| n-C3H7CN | 9(7,3)-8(6,3) | 145700.18 | 0.21 0.03 | 56.81 0.33 | 4.16 0.79 | 0.05 |
| unidentified | 145723.50 | 0.32 0.04 | 57.49 0.50 | 7.68 1.15 | 0.04 | |
| unidentified | 145745.70 | 0.11 0.03 | 57.29 0.78 | 3.86 1.42 | 0.03 | |
| OCS | 12–11 | 145946.81 | 0.66 0.05 | 58.69 0.20 | 5.50 0.50 | 0.11 |
| CH3CH2CN | 16(2,14)-15(2,13) | 146120.04 | 0.37 0.05 | 56.98 0.34 | 4.89 0.73 | 0.07 |
| HCCCN | J=16-15, l= 1f | 146127.53 | 0.66 0.06 | 58.00 0.38 | 7.13 0.90 | 0.09 |
| CH3OH | 20( 6, 15)- 21( 5, 16) - - | 146286.58 | 1.04 0.08 | 59.60 0.55 | 12.92 1.16 | 0.08 |
| CH3OH | 3(1,2)-2(1,1) A– | 146368.34 | 1.78 0.05 | 58.28 0.07 | 5.23 0.22 | 0.32 |
| SO2 | 4(2,2)-4(1,3) | 146605.51 | 0.41 0.05 | 57.87 0.29 | 4.78 0.60 | 0.08 |
| CH3OH | 14(1,14)-13(2,11) A++ | 146617.41 | 1.21 0.08 | 56.09 0.19 | 6.10 0.49 | 0.19 |
| HCO | 2(1,1)-1(1,0) | 146635.67 | 0.50 0.06 | 58.82 0.33 | 5.80 0.99 | 0.08 |
| CH2N | 2(0,2)-1(0,1) 7/2-5/2 9/2-7/2 | 146675.06 | 0.20 0.04 | 52.20 0.56 | 4.48 0.94 | 0.25 |
| CS | 3-2 | 146969.02 | 19.62 0.05 | 57.63 0.00 | 5.55 0.02 | 3.32 |
| Molecule | Transition | Frequency | FWHM | |||
|---|---|---|---|---|---|---|
| MHz | (K km s-1) | (km s-1) | (km s-1) | K | ||
| OCS | 7-6 | 85139.10 | 0.15 0.01 | 33.69 0.13 | 2.40 0.33 | 0.06 |
| HC18O+ | 1-0 | 85162.22 | 0.14 0.01 | 33.83 0.14 | 2.43 0.30 | 0.06 |
| HC5N | 32-31 | 85201.34 | 0.11 0.01 | 33.58 0.31 | 2.81 0.71 | 0.04 |
| -C3H2 | 2(1,2)-1(0,1) | 85338.89 | 0.79 0.01 | 34.11 0.03 | 2.66 0.08 | 0.28 |
| HCS+ | 2-1 | 85347.89 | 0.32 0.01 | 33.93 0.08 | 2.67 0.22 | 0.11 |
| CH3CCH | 5(3)-4(3) | 85442.60 | 0.14 0.02 | 32.92 0.27 | 3.35 0.60 | 0.04 |
| CH3CCH | 5(2)-4(2) | 85450.76 | 0.16 0.01 | 33.66 0.11 | 2.50 0.26 | 0.07 |
| CH3CCH | 5(1)-4(1) | 85455.66 | 0.43 0.01 | 33.47 0.04 | 2.42 0.09 | 0.17 |
| CH3CCH | 5(0)-4(0) | 85457.30 | 0.55 0.01 | 33.53 0.04 | 2.65 0.10 | 0.20 |
| C4H | 9-8 J=19/2-17/2 | 85634.01 | 0.09 0.01 | 34.48 0.27 | 2.83 0.59 | 0.03 |
| NH2D | 1(1,1)0+ - 1(0,1)0- | 85926.27 | 0.27 0.02 | 33.18 0.22 | 4.64 0.66 | 0.06 |
| HC15N | 1-0 | 86054.96 | 0.45 0.02 | 33.74 0.07 | 2.86 0.17 | 0.15 |
| SO | N,J=2,2-1,1 | 86093.95 | 0.36 0.01 | 33.43 0.07 | 2.74 0.18 | 0.13 |
| H13CN | 1-0 F=1-1 | 86338.73 | 0.88 0.01 | 33.60 0.03 | 2.62 0.07 | 0.32 |
| H13CN | 1-0 F=2-1 | 86340.17 | 1.62 0.02 | 33.64 0.01 | 2.82 0.05 | 0.54 |
| H13CN | 1-0 F=0-1 | 86342.25 | 0.36 0.02 | 33.63 0.10 | 3.07 0.28 | 0.11 |
| HC13O+ | 1-0 | 86754.28 | 1.38 0.01 | 33.36 0.02 | 2.77 0.04 | 0.47 |
| C3S | 15-14 | 86708.38 | 0.19 0.03 | 34.32 0.15 | 2.59 0.55 | 0.07 |
| unidentified | 86777.10 | 0.18 0.03 | 32.87 0.18 | 2.93 0.51 | 0.06 | |
| SiO | 2-1 v=0 | 86846.96 | 0.72 0.04 | 33.50 0.13 | 5.15 0.40 | 0.13 |
| HN13C | 1-0 F=2-1 | 87090.85 | 0.81 0.01 | 33.38 0.03 | 2.81 0.07 | 0.27 |
| CCH | 1-0 3/2-1/2 F=1-1 | 87284.10 | 0.57 0.01 | 33.51 0.04 | 2.58 0.10 | 0.21 |
| CCH | 1-0 3/2-1/2 F=2-1 | 87316.89 | 4.08 0.02 | 33.64 0.00 | 2.50 0.01 | 1.53 |
| CCH | 1-0 3/2-1/2 F=1-0 | 87328.58 | 2.26 0.01 | 33.58 0.01 | 2.53 0.02 | 0.84 |
| CCH | 1-0 1/2-1/2 F=1-1 | 87401.98 | 2.26 0.01 | 33.60 0.01 | 2.51 0.02 | 0.85 |
| CCH | 1-0 1/2-1/2 F=0-1 | 87407.16 | 1.09 0.01 | 33.55 0.02 | 2.59 0.05 | 0.40 |
| CCH | 1-0 1/2-1/2 F=1-0 | 87446.47 | 0.59 0.01 | 33.52 0.03 | 2.39 0.09 | 0.23 |
| HC5N | 33-32 | 87863.63 | 0.25 0.04 | 33.29 0.35 | 3.02 0.60 | 0.03 |
| HNCO | 4(0,4)-3(0,3) | 87925.23 | 0.35 0.02 | 33.04 0.11 | 3.42 0.27 | 0.10 |
| HCN | 1-0,F=1-1 | 88630.41 | 6.03 0.12 | 33.78 0.02 | 3.02 0.07 | 1.87 |
| HCN | 1-0 F=2-1 | 88631.84 | 1.24 0.08 | 34.55 0.06 | 1.71 0.15 | 0.68 |
| HCN | 1-0 F=0-1 | 88633.93 | 1.08 0.08 | 32.08 0.06 | 1.73 0.17 | 0.59 |
| HCO+ | 1-0 | 89188.52 | 4.29 0.07 | 34.05 0.02 | 3.09 0.06 | 1.31 |
| l-C13CC2H2 | 10(2,8)-9(2,7) | 88865.38 | 0.23 0.03 | 31.87 0.14 | 2.58 0.31 | 0.09 |
| c-C3D2 | 5(4,2)-5(3,3) | 89316.91 | 0.15 0.03 | 33.31 0.91 | 7.21 1.58 | 0.02 |
| unidentified | 89441.30 | 0.20 0.04 | 32.65 0.70 | 6.70 1.54 | 0.03 | |
| unidentified | 89449.50 | 0.20 0.04 | 32.53 0.87 | 8.47 1.62 | 0.02 | |
| HOCHCHCHO | 6(4,3)-5(3,2) | 89458.20 | 0.16 0.04 | 33.94 0.71 | 6.18 1.34 | 0.03 |
| HC5N | 34-33 | 90525.88 | 0.25 0.02 | 32.96 0.18 | 2.83 0.41 | 0.03 |
| HC13CCN | 10-9 | 90593.05 | 0.16 0.02 | 32.81 0.33 | 3.88 0.64 | 0.04 |
| HCC13CN | 10-9 | 90601.77 | 0.12 0.01 | 32.70 0.20 | 2.25 0.45 | 0.05 |
| HNC | 1-0 F=2-1 | 90663.56 | 9.70 0.04 | 33.05 0.00 | 2.69 0.01 | 3.39 |
| HCCCN | 10-9 | 90979.02 | 3.13 0.01 | 32.81 0.01 | 2.62 0.01 | 1.12 |
| HDCS | 3(1,3)-2(1,2) | 91171.03 | 0.13 0.04 | 32.09 0.38 | 2.85 0.89 | 0.03 |
| H2CCCHCN | 4(2,2)-2(1,3) | 91494.56 | 0.13 0.03 | 33.66 0.29 | 3.25 0.99 | 0.04 |
| CH3CN | 5(3)-4(3) | 91971.13 | 0.32 0.04 | 32.33 0.29 | 6.03 0.92 | 0.05 |
| CH3CN | 5(2)-4(2) | 91979.99 | 0.38 0.03 | 32.42 0.16 | 4.40 0.41 | 0.08 |
| CH3CN | 5(1)-4(1) | 91985.31 | 0.30 0.02 | 32.66 0.09 | 2.37 0.22 | 0.12 |
| CH3CN | 5(0)-4(0) | 91987.08 | 0.43 0.02 | 32.66 0.09 | 3.22 0.21 | 0.13 |
| H | H41 | 92034.43 | 0.90 0.04 | 21.00 0.70 | 28.40 1.75 | 0.03 |
| CH3COOH | v=0 18(13,6)-18(-10,8) v=0 | 143755.42 | 0.04 0.00 | 32.60 0.10 | 1.10 0.25 | 0.04 |
| CH3OH | 3(1,3)-2(1,2) A++ | 143865.79 | 0.34 0.01 | 32.58 0.08 | 3.32 0.24 | 0.10 |
| DCO+ | 2-1 | 144077.28 | 0.24 0.03 | 32.09 0.34 | 6.64 1.05 | 0.03 |
| CH3C3N | 35(16)-34(16) | 144231.92 | 0.36 0.01 | 30.70 0.07 | 2.61 0.17 | 0.13 |
| CCD | 2-1 J=5/2-3/2F=7/2-5/2 | 144241.96 | 0.06 0.01 | 32.38 0.37 | 3.08 0.66 | 0.02 |
| unidentified | 144609.02 | 0.10 0.03 | 40.55 0.27 | 2.00 0.58 | 0.05 | |
| C34S | 3-2 | 144617.10 | 0.93 0.01 | 33.20 0.02 | 2.57 0.05 | 0.34 |
| DCN | 2-1 F1=2-1 | 144828.00 | 0.31 0.03 | 33.32 0.16 | 4.35 0.51 | 0.07 |
| -C3H2 | 3(1,2)-2(2,1) | 145089.62 | 0.61 0.07 | 32.25 0.15 | 6.17 0.77 | 0.09 |
| CH3OH | 3(0,3)-2(0,2) E | 145093.76 | 0.80 0.05 | 32.41 0.10 | 3.45 0.28 | 0.22 |
| CH3OH | 3(-1,3)-2(-1,2) E | 145097.44 | 2.33 0.05 | 32.76 0.03 | 3.05 0.08 | 0.72 |
| CH3OH | 3(0,3)-2(0,2) A++ | 145103.19 | 2.64 0.03 | 32.81 0.02 | 3.01 0.05 | 0.82 |
| Molecule | Transition | Frequency | FWHM | |||
|---|---|---|---|---|---|---|
| MHz | (K km s-1) | (km s-1) | (km s-1) | K | ||
| CH3OH | 3(-2,2)-2(-2,1) E | 145126.39 | 0.36 0.01 | 32.97 0.10 | 3.30 0.27 | 0.10 |
| CH3OH | 3(1,2)-2(1,1) E | 145131.87 | 0.37 0.03 | 32.49 0.11 | 3.82 0.33 | 0.09 |
| CH3SH | v = 0 12( -3) - 13( -2) E | 145386.10 | 0.78 0.01 | 31.98 0.02 | 2.67 0.06 | 0.28 |
| HCCCN | 16-15 | 145560.95 | 0.80 0.01 | 32.98 0.03 | 2.53 0.07 | 0.30 |
| H2CO | 2(0,2)-1(0,1) | 145602.95 | 4.00 0.03 | 33.12 0.01 | 2.86 0.02 | 1.31 |
| unidentified | 145677.00 | 0.13 0.02 | 32.88 0.31 | 3.38 1.04 | 0.04 | |
| unidentified | 145692.20 | 0.06 0.01 | 32.88 0.28 | 1.77 0.43 | 0.03 | |
| n-C3H7CN | 9(7,3)-8(6,2) | 145700.18 | 0.14 0.02 | 31.39 0.44 | 5.70 1.02 | 0.03 |
| t-HC(O)SH | 15(2,13)-15(1,14) | 145746.31 | 0.18 0.02 | 34.70 0.18 | 3.23 0.46 | 0.05 |
| C33S | 3-2 F=9/2-7/2 | 145755.62 | 0.18 0.01 | 32.51 0.17 | 3.24 0.48 | 0.05 |
| OCS | 12-11 | 145946.81 | 0.10 0.01 | 32.46 0.20 | 2.23 0.54 | 0.04 |
| CH3OH | 3(1,2)-2(1,1)A– | 146368.34 | 0.41 0.01 | 32.53 0.09 | 3.32 0.24 | 0.12 |
| CH3OH | 9(0,9)-8(1,8)A++ | 146618.83 | 0.50 0.03 | 32.42 0.07 | 3.13 0.20 | 0.15 |
| HCO | 2(1,1)-1(1,0) | 146635.67 | 0.14 0.03 | 32.56 0.33 | 3.02 0.70 | 0.05 |
| H2CN | 2(0,2)-1(0,1),F=3/2-5/2 | 146640.12 | 0.41 0.03 | 32.30 0.09 | 3.07 0.24 | 0.13 |
| CS | 3-2 | 146969.02 | 9.68 0.03 | 33.01 0.00 | 2.90 0.01 | 3.13 |