Amorphous solids are ubiquitous among natural and man-made materials. Often used as structural materials for their attractive mechanical properties, their utility depends critically on their response to applied stresses. Processes underlying such mechanical response, and in particular the yielding behaviour of amorphous solids, are not satisfactorily understood. Although studied extensivelyFalk and Langer (2011); Barrat and Lemaître (2011); Maloney and Lemaître (2006); Dahmen et al. (2009); Karmakar et al. (2010); Dasgupta et al. (2012); Keim and Arratia (2013); Lin et al. (2014); E. D. Knowlton and Cipelletti (2014); Hima Nagamanasa et al. (2014); Shrivastav et al. (2016); Regev et al. (2015); Liu et al. (2016); Jaiswal et al. (2016), observed yielding behaviour can be gradual and depend significantly on conditions of study, making it difficult to convincingly validate existing theoretical descriptions of a sharp yielding transitionHébraud and Lequeux (1998); Dahmen et al. (2009); Dasgupta et al. (2012); Lin et al. (2014); Liu et al. (2016). Here, we employ oscillatory deformation as a reliable probe of the yielding transition. Through extensive computer simulations for a wide range of system sizes, we demonstrate that cyclically deformed model glasses exhibit a sharply defined yielding transition with characteristics that are independent of preparation history. In contrast to prevailing expectationsDahmen et al. (2009); Lin et al. (2014); Regev et al. (2015), the statistics of avalanches reveals no signature of the impending transition, but exhibit dramatic, qualitative, changes in character across the transition.
The yielding transition in amorphous solids under oscillatory shear deformation
The mechanical response to applied stresses or deformation is a basic material characteristic of solids, both crystalline and amorphous. Whereas the response to small perturbations are described by elastic moduli, the plastic, irreversible, response to large deformation is often more important to characterise, as it determines many material parameters such as strength and ductility, and is also of relevance to thermomechanical processing of metallic glasses Sun et al. (2016). Amorphous solids lack the translational symmetry of crystals, and thus no obvious analogs to dislocation defects in terms of which plasticity in crystals has been sought to be understood. Based on work over the last decades, it is appreciated that plasticity arises in amorphous solids through spatially localized reorganisations Argon (1979); Falk and Langer (2011); Barrat and Lemaître (2011), termed shear transformation zones, and that such localized zones interact with each other through long ranged elastic strains they induce Picard et al. (2004). While many details of the nature of these localized regions of non-affine displacements remain to be worked out, they form the basis of analyses and models of elasto-plasticity and yielding Dasgupta et al. (2012); Talamali et al. (2012); Picard et al. (2004); Liu et al. (2016); Ganguli et al. (2016). Many analyses have employed computer simulations of atomistic models of glasses, aiming to elucidate key features of plastic response Maloney and Lemaître (2006); Falk and Langer (2011); Barrat and Lemaître (2011) on atomic scales. While several studies have been conducted at finite shear rates (e.g. Shrivastav et al. (2016); Liu et al. (2016)), many studies have focussed on behaviour in the athermal, quasi-static (AQS) Maloney and Lemaître (2006); Karmakar et al. (2010); Dasgupta et al. (2012); Jaiswal et al. (2016); Salerno and Robbins (2013) limit, wherein the model glasses studied remain in zero temperature, local energy minimum, configurations as they are sheared quasi-statically. Such deformation induces discontinuous drops in energy and stress with corresponding nonaffine displacements that are highly spatially correlated, and exhibit power law distributions in size. In analogy with similar avalanches that arise in diverse context of intermittent response in disordered systems, from earthquakes, crackling noise in magnetic systems, depinning of interfaces in a disorded medium etc. Sethna et al. (2001), a theoretical description of yielding in amorphous solids Dahmen et al. (2009), predicts the mean avalanche size to diverge as the yielding transition is approached from below, leading to a power law distribution with a diverging mean size at and above the transition. Indeed, it has been observed that (e. g. Karmakar et al. (2010); Salerno and Robbins (2013); Liu et al. (2016)) system spanning avalanches are present in the steady state beyond yield, whose sizes scale with system size. The character of avalanches upon approaching the yielding transition, however, has not received much attention, as also the differences between pre- and post-yield avalanches. Among the reasons is the sample to sample variability of behaviour below yield, in contrast with the universal behaviour seen in the post-yield regime. Here, we show that oscillatory deformation offers a robust approach to systematically probe behaviour above and below yielding. Oscillatory deformation is a widely used experimental technique as well as a common protocol in materials testing. However, barring some recent work Fiocco et al. (2013); Priezjev (2013); Regev et al. (2013, 2015), it is not been employed widely to probe yielding in amorphous solids computationally. In the present work, we perform an extensive computational study of plastic response in a model glass former, over a wide range of system sizes, and amplitudes of deformation that straddle the yielding strain.
We study the Kob-Andersen 80:20 binary mixture Lennard-Jones glasses for a range of system sizes (see Methods for details). The glasses studied are prepared by performing a local energy minimization of equilibrated liquid configurations, at a reduced temperatures and . The inherent structures so obtained represent poorly annealed () and well annealed () glasses. These glasses, referred to by the corresponding liquid temperature in what follows, are subjected to volume preserving shear deformation through the AQS protocol. The strain is incremented in the same direction in the case of uniform strain, whereas for oscillatory strain for a given maximum amplitude , a cycle of strain is applied repeatedly over many cycles, till a steady state is reached. Results presented below, except Figure 1 (d) are from analysing steady state configurations. Further details concerning the simulations and analysis are presented in Methods and Supporting Information.
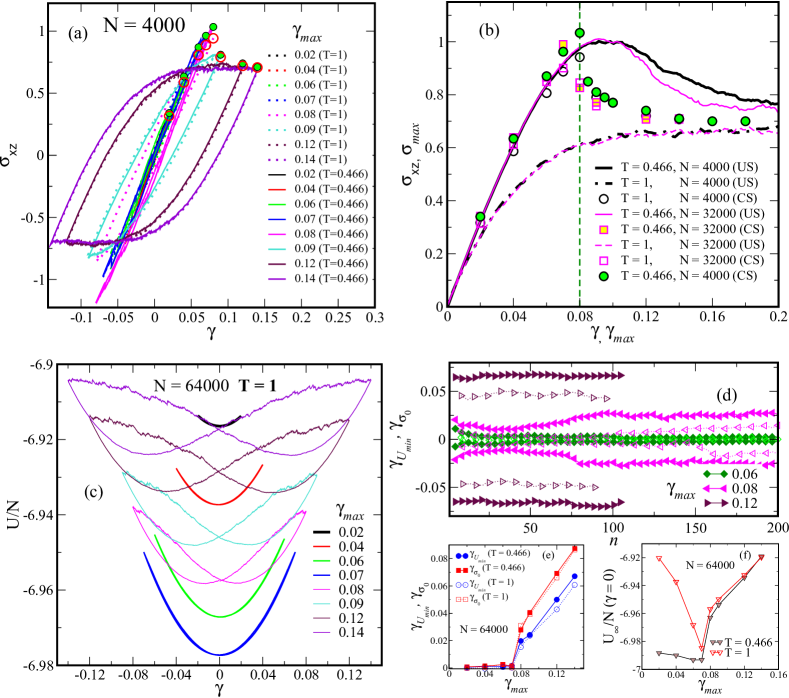
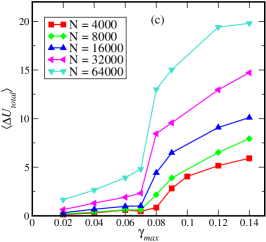
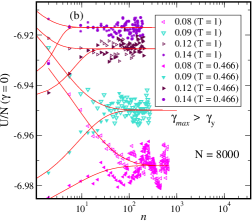
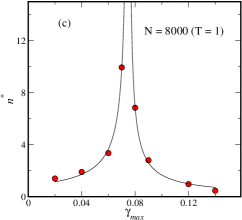
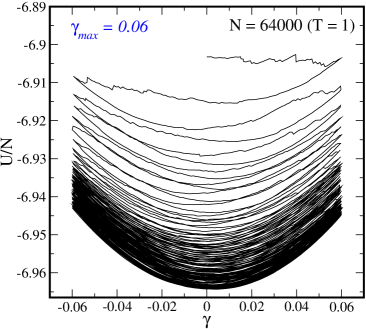
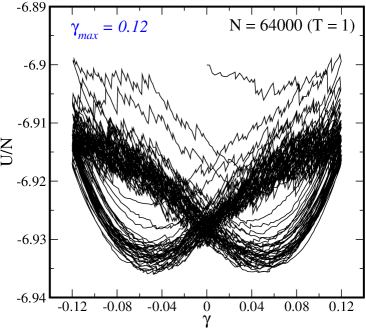
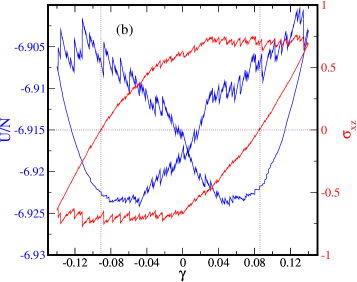
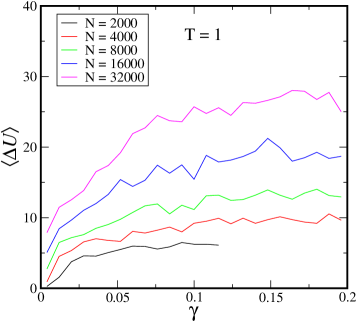
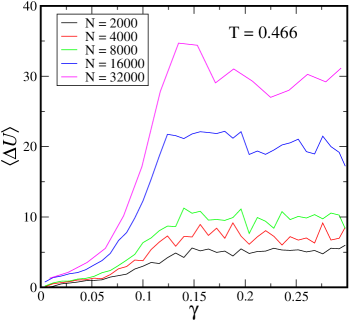
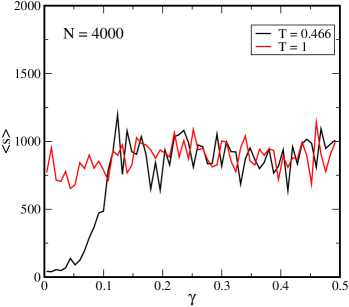
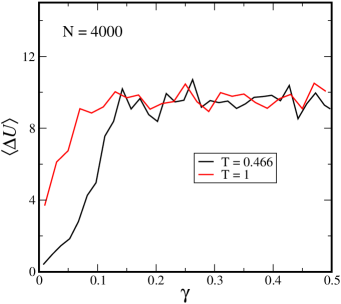
Stress and Energy across the Yielding Transition.- Previous work Fiocco et al. (2013) has shown that as the amplitude of strain approaches a critical value from either side, the approach to the steady state becomes increasingly sluggish, with an apparent divergence at (see Supporting Information). We identify () as the yield strain, as justified below. In Figure 1(a) we show the averaged stress-strain curves for . For each , we obtain a maximum stress reached at , which are plotted in Figure 1(b) for , , for . Figure 1(b) also shows the stress-strain curves for the same cases obtained with uniform strain. Whereas stresses vary smoothly for uniform strain, with no sharp signature of the onset of yielding, and differ significantly for and , they display a sharp, discontinuous, drop above ( for N = 4000) for oscillatory strain. Interestingly, below , the maximum stress increases as a result of oscillatory deformation, indicative of hardening, consistently with previous results Deng and Schuh (2012). Above , repeated oscillatory deformation leads to a stress drop relative to values just below , indicating yielding. Figure 1 (c) displays the potential energies obtained over a full cycle in the steady state (see Supporting Information for evolution with cycles of strain). For , the energies display a single minimum close to , but above, bifurcate into two minima, indicating the emergence of plasticity. The stress-strain curves show a corresponding emergence of loops (Figure 1(a)) with finite area. Strain values at the minima for energy, and , , are shown in Figure 1(d) as a function of the number of cycles for different . We note that displays interesting non-monotonic behaviour, with an initial decrease in these strain values, similar to smaller , but an eventual increase to larger strains, similar to the case , in the yielded regime. Figure 1(e) shows and vs. , which show an apparently continuous departure from nearly zero, signalling a transition at . Figure 1(f) shows that the minimum energies in the steady state vs. decrease with increasing below , but increase above, reaching the same values for and . These data demonstrate the presence of a sharp transition between a low strain regime where oscillatory shear produces better annealed, hardened, glasses to a yielded regime displaying stress relaxation and rejuvenation.
We next study (i) distribution of avalanche sizes, which we compute as the size of clusters of particles that undergo plastic rearrangements (see Methods for how they are identified), and (ii) distributions of the size of energy drops.
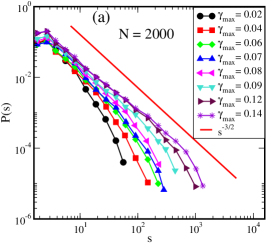
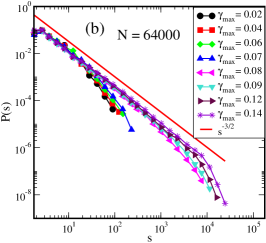
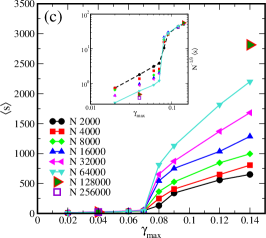
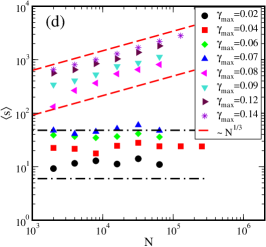
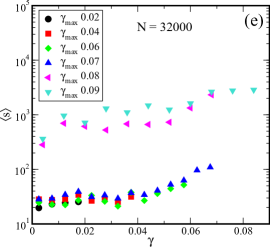
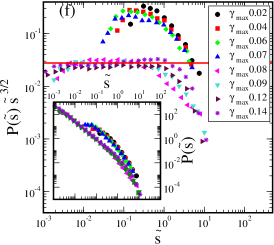
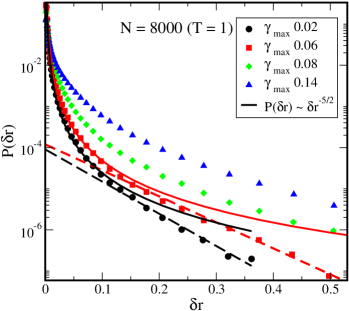
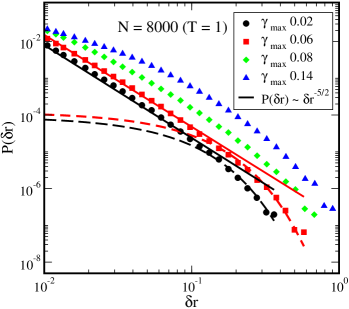
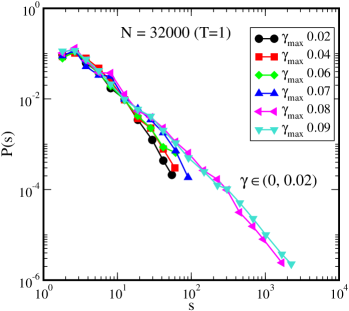
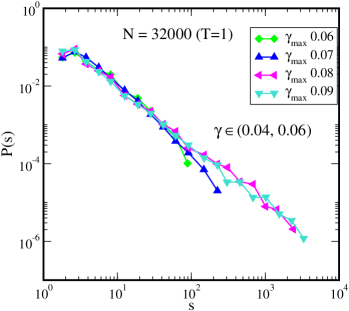
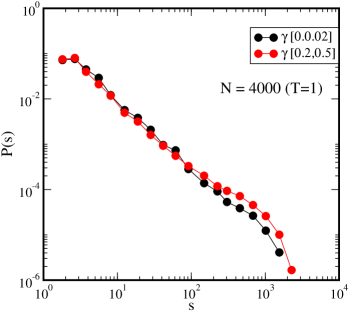
Distributions of Cluster Sizes.- In Figure 2 (a) we show the distributions of avalanche sizes for , which display a characteristic power law decay with a cutoff. Although the cutoffs move to larger values as increases, we see no indication of a transition. To assess the role of system sizes, we compute the avalanche sizes for a variety of system sizes. Figure 2(b) shows the avalanche size distribution for . The distributions fall into two clear sets, corresponding to above and below . We compute and display in Figure 2 (c) the mean avalanche size as a function of , for all studied system sizes. The striking observation is that below , displays no system size dependence, and only a very mild dependence on , and no indication of the approach to . Above , a clear system size dependence is seen. Figure 2 (d) shows the same data vs. system size, revealing a roughly (or ) dependence above , and minimal dependence below. The dependence is consistent with previous results Lerner and Procaccia (2009); Karmakar et al. (2010) for mean energy drops, but the absence of system size dependence below, to our knowledge, has not been demonstrated before. We next ask whether the mean size of avalanches, for a given depend on the strain at which they appear, and conversely, for a given what the dependence on is. As shown in Figure 2 (e) (, ), for a given the dependence is weak and is the same for (and ), but the data fall into distinct groups for and . The same pattern is seen for the full distributions (see Supporting Information). For a given , the avalanche distributions can be collapsed on to a master curve by scaling by (data not shown). The distributions of scaled sizes , averaged over system size are shown in the inset of Figure 2 (f). The same data are shown, multiplied by in the main panel, and demonstrate that the character of the distributions are different above and below yield: whereas above one finds a range of sizes over which the power law form is clearly valid (and thus the cutoff arises purely because of system size), below this is not the case, and the qualitative shape of the distributions is different (with a cutoff function multiplying the power law) Dahmen et al. (2009); Lin et al. (2014); Fiocco et al. (2014); Regev et al. (2015).
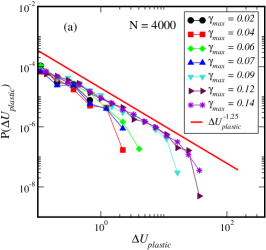
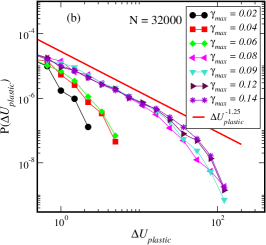
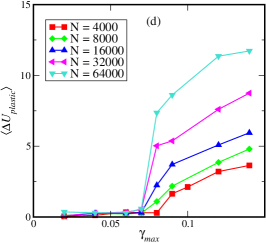
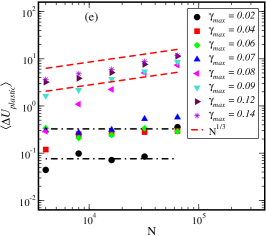
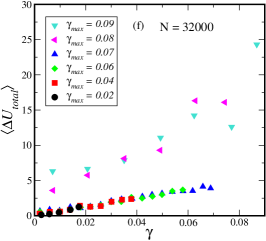
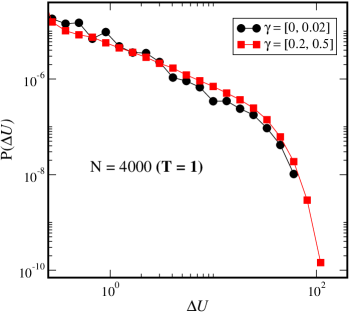
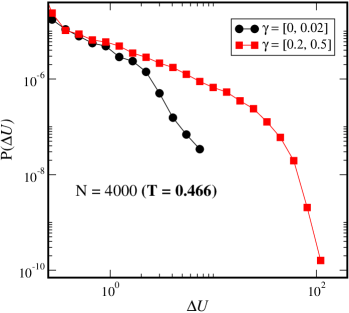
Distributions of Energy Drops.- We now discuss the distributions of energy drops. Shown for and in Figures 3(a), and 3(b), these distributions show the same features as the avalanche sizes, but with a different power law exponent of (as found in Liu et al. (2016). Thus, the exponent depends on the quantity employed, and the avalanche size based on particle displacements is in closer agreement with mean field predictions). In Figure 3(c), we show the dependence of the mean energy drop, for different system sizes, which reveal the same pattern as the avalanche sizes, albeit with a stronger apparent size dependence below yield. However, the total energy drops for the whole system include also an elastic component, in addition to the plastic component. The component of the energy drop corresponding to the plastic regions alone, which are plotted in Figure 3 (d), to demonstrate that the plastic component has no system size dependence below yield. Figure 3 (e) shows the system size dependence of the mean energy drop (plastic component), and Figure 3 (f) shows the mean energy drop vs. for different (N = 64000, T = 1), revealing the same separation below and above yield as the avalanche sizes. This is in contrast with the case of uniform shear, wherein both energy drops and avalanche sizes show a gradual, and strongly sample dependent, variation with strain (see Supporting Information).
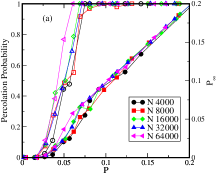
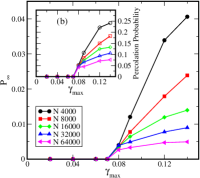
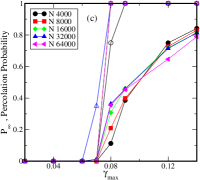
Percolation.- Finally, we analyse the spatial structure of the avalanches briefly, by studying (i) the percolation, and (ii) fractal dimension, of the avalanches. Below , none of the avalanches percolate, whereas above, a finite fraction does so. Figure 4(a) shows the weight of the spanning cluster , and percolation probability averaged over bins in “probability” , obtained from the fraction of displaced particles, (see Methods) for different system sizes for , indicating a percolation transition at . However, the threshold is system size dependent, and thus merits further investigation. In Fig 4 (b), and averaged over all considered events are shown as a function of . The percolation probability does not become , a result of considering all the drop events. To address this artefact we analyse the cumulative set of all particles displaced in any of the events. The and values shown in Figure 4 (c) indicate that above , this cumulative set always percolates and the weight is comparable for different system sizes. However, at the smallest above appears to increase with system size, suggesting a discontinuous change across . The variation of with in either method also shows an apparently discontinuous behaviour across (see Supporting Information).
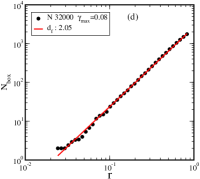
Fractal Dimension.- We compute the fractal dimension of the spanning clusters using the box counting method (see Methods). Figure 4 (d) shows a log-log plot of the occupied boxes vs. magnification (the largest corresponds to the smallest box size, of ) for , . We find a fractal dimension of , close to , which appears consistent with the possibility that yield events are quasi-two dimensional. However, based on the system size dependence of the mean cluster size, the fractal dimension deduced is Liu et al. (2016), which is at odds with the result here, and requires further investigation for it to be properly understood.
The results that we have discussed demonstrate that a sharp yielding transition is revealed through oscillatory deformation of model glasses. The character of the avalanches is qualitatively different across the transition, being localised below the transition, and becoming extended above. Contrary to theoretical expectations for uniform deformation, the mean size of the avalanches does not diverge upon approaching the yielding transition, and prompts theoretical investigation, including development of suitable elasto-plastic models, of yielding under oscillatory deformationPerchikov and Bouchbinder (2014). A signature of yielding is instead revealed by the progressive sluggishness of annealing behaviour as the transition is approached. Both the avalanche statistics and percolation characteristics suggest a discontinuous yielding transition, which may be consistent with the suggestion that yielding is a first order transition Jaiswal et al. (2016). Finally, our results reveal systematic, non-trivial annealing behaviour of the glasses near the yielding transition, which we believe are of relevance to thermomechanical processing of metallic glasses. In particular, processing near the yielding transition, both above and below, may lead to significant change of properties, which may be utilised according to specific design goals.
Methods.- The model system we study is the Kob-Andersen binary (80:20) mixtures of Lennard Jones particles. The interaction potential is truncated at a cutoff distance of such that both the potential and the force smoothly go to zero as given by
| (1) | |||||
where and the parameters , , , . Energy and length are in the units of and respectively, and likewise, reduced units are used for other quantities. The correction terms are evaluated with the conditions that the potential and its derivative at must vanish at the cutoff.
The initial liquid samples are equilibrated at two temperatures, T = 0.466 and T = 1 using the Nosé Hoover thermostat, at reduced density . Independent samples are generated for each temperature and system size by further evolving the equilibrated liquid configurations by performing the molecular dynamics simulations of constant energy, which are separated by the structural relaxation time () obtained from the self intermediate scattering function (). For the uniform shearing data, we have atleast 100 samples for all the system sizes. The avalanche data shown for cyclic shearing are for at least 20 samples for N 32000, and 10 samples for larger systems. All the simulations are carried out using LAMMPS Plimpton (1995).
Shear deformation of the model amorphous solids is done employing athermal-quasi static (AQS) simulations which consist of two steps. An affine transformation of coordinates is imposed, subsequently followed by an energy minimization using the conjugate-gradient method with Lees-Edwards periodic boundary conditions. Strain steps of are used throughout, except for for which . Initial configurations are the inherent structures (local energy minima) of equilibrated liquid samples. Potential energy and mean square displacements are computed at as functions of cycles to ascertain that steady states are reached, wherein the coordinates of particles, and properties such as the potential energy and shear stress remain (below yield strain) unchanged at the end of each cycle, or (above yield strain) become statistically unchanged upon straining further, and exhibit diffusive motion as a function of the number of cycles. Steady states for strain amplitudes of are studied for system sizes and . To further probe finite size effects, we have consider amplitude below the yield transition at for and , and for .
In the steady state, we compute the potential energy per particle and stress for each strain step. Plastic events result in discontinuous energy and stress drops. A parameter Lerner and Procaccia (2009) exceeding a value of is used to identify plastic events, where is the change in energy during minimisation after a strain step. Avalanche sizes based on the magnitude of energy drops and the cluster sizes of “active” particles (that undergo plastic displacements) are both computed. Particles are considered active if they are displaced by more than . The choice of this cutoff is based on considering the distribution of single particle displacements , which are expected to vary as a power law for elastic displacements around a plastic core, but display an exponential tail corresponding to plastic rearrangements (see, e. g., Fiocco et al. (2013)). The separation is clear cut only for small , and we choose the smallest cutoff value (observed for ) so that plastic rearrangements at all are considered. In performing cluster analysis, two active particles are considered to belong to the same cluster if they are separated by less than (first coordination shell). The normalised histogram of cluster sizes is obtained from statistics for all the events. The mean cluster size is computed from the distributions as (see Supporting Information).
For the percolation analysis, we consider all the plastic events in the first quadrant of the cycle ( from to ), and compute the “probability” from the fraction of particles that undergo plastic displacement, and the weight of the spanning cluster , from the fraction of particles that belong to the spanning cluster ( if there is no spanning cluster). The percolation probability if a spanning cluster is present and otherwise.
To obtain the fractal dimension of percolating clusters, we employ the method of box counting. The simulation volume is divided into boxes of a specified mesh size, and the number of boxes that contain a part of the cluster, , is counted. This is repeated for a series of mesh sizes, and the fractal dimension is obtained as the slope where is the inverse of mesh size.
Acknowledgements.
We wish to thank J. L. Barrat, P. Chaudhuri, M. Falk, G. Foffi, A. L. Greer, J. Horbach, I. Procaccia, M. Robbins, A. Rosso and M. Wyart for useful discussions. We wish to specially thank H. A. Vinutha for discussions and help regarding computations reported here. We gratefully acknowledge TUE-CMS and SSL, JNCASR, Bengaluru for computational resources and support.References
- Falk and Langer (2011) M. L. Falk and J. Langer, Annu. Rev. Condens. Matter Phys. 2, 353 (2011).
- Barrat and Lemaître (2011) J. L. Barrat and A. Lemaître, in Dynamical heterogeneities in glasses, colloids, and granular media, edited by L. Berthier, G. Biroli, J. P. Bouchaud, L. Cipelletti, and W. v. Saarloos (Oxford Science Publications, Oxford, 2011) Chap. 8, pp. 264–297.
- Maloney and Lemaître (2006) C. E. Maloney and A. Lemaître, Phys. Rev. E 74, 016118 (2006).
- Dahmen et al. (2009) K. A. Dahmen, Y. Ben-Zion, and J. T. Uhl, Phys. Rev. Lett. 102, 175501 (2009).
- Karmakar et al. (2010) S. Karmakar, E. Lerner, and I. Procaccia, Phys. Rev. E 82, 055103 (2010).
- Dasgupta et al. (2012) R. Dasgupta, H. G. E. Hentschel, and I. Procaccia, Phys. Rev. Lett. 109, 255502 (2012).
- Keim and Arratia (2013) N. C. Keim and P. E. Arratia, Soft Matter 9, 6222 (2013).
- Lin et al. (2014) J. Lin, E. Lerner, A. Rosso, and M. Wyart, Proceedings of the National Academy of Sciences 111, 14382 (2014).
- E. D. Knowlton and Cipelletti (2014) D. J. P. E. D. Knowlton and L. Cipelletti, Soft Matter 10, 6931 (2014).
- Hima Nagamanasa et al. (2014) K. Hima Nagamanasa, S. Gokhale, A. K. Sood, and R. Ganapathy, Phys. Rev. E 89, 062308 (2014).
- Shrivastav et al. (2016) G. P. Shrivastav, P. Chaudhuri, and J. Horbach, Phys. Rev. E 94, 042605 (2016).
- Regev et al. (2015) I. Regev, J. Weber, C. Reichhardt, K. A. Dahmen, and T. Lookman, Nature communications 6 (2015).
- Liu et al. (2016) C. Liu, E. E. Ferrero, F. Puosi, J.-L. Barrat, and K. Martens, Phys. Rev. Lett. 116, 065501 (2016).
- Jaiswal et al. (2016) P. K. Jaiswal, I. Procaccia, C. Rainone, and M. Singh, Phys. Rev. Lett. 116, 085501 (2016).
- Hébraud and Lequeux (1998) P. Hébraud and F. Lequeux, Phys. Rev. Lett. 81, 2934 (1998).
- Sun et al. (2016) Y. H. Sun, A. Concustell, and A. L. Greer, Nat. Rev. Mater. 1 (2016), doi:10.1038/natrevmats.2016.39.
- Argon (1979) A. Argon, Acta Metall. 27, 47 (1979).
- Picard et al. (2004) G. Picard, A. Ajdari, F. Lequeux, and L. Bocquet, The European Physical Journal E 15, 371 (2004).
- Talamali et al. (2012) M. Talamali, V. Petäjä, D. Vandembroucq, and S. Roux, Comptes Rendus Mécanique 340, 275 (2012).
- Ganguli et al. (2016) S. Ganguli, J. Horbach, P. Sollich, S. Karmakar, and S. Sengupta, arXiv preprint arXiv:1603.05092 (2016).
- Salerno and Robbins (2013) K. M. Salerno and M. O. Robbins, Phys. Rev. E 88, 062206 (2013).
- Sethna et al. (2001) J. P. Sethna, K. A. Dahmen, and C. R. Myers, Nature 410, 242 (2001).
- Fiocco et al. (2013) D. Fiocco, G. Foffi, and S. Sastry, Phys. Rev. E 88, 020301 (2013).
- Priezjev (2013) N. V. Priezjev, Phys. Rev. E Stat. Nonlin. Soft Matter Phys. 87, 052302 (2013).
- Regev et al. (2013) I. Regev, T. Lookman, and C. Reichhardt, Phys. Rev. E Stat. Nonlin. Soft Matter Phys. 88, 062401 (2013).
- Deng and Schuh (2012) C. Deng and C. A. Schuh, Appl. Phys. Lett. 100, 251909 (2012).
- Lerner and Procaccia (2009) E. Lerner and I. Procaccia, Phys. Rev. E 79, 066109 (2009).
- Fiocco et al. (2014) D. Fiocco, G. Foffi, and S. Sastry, Phys. Rev. Lett. 112, 025702 (2014).
- Perchikov and Bouchbinder (2014) N. Perchikov and E. Bouchbinder, Phys. Rev. E 89, 062307 (2014).
- Plimpton (1995) S. Plimpton, J. Comput. Phys. 117, 1 (1995).
The yielding transition in amorphous solids under oscillatory shear deformation (Supplementary Information)
Premkumar Leishangthem, Anshul D. S. Parmar and Srikanth Sastry
Here we provide additional information regarding the following aspects of analysis of model glasses subjected to oscillatory deformation: (i) Number of cycles required to reach the steady state, (ii) Evolution of energy with cycles, (iii) Identification of particles undergoing plastic displacements, (iv) Avalanche distributions at different strain for different strain amplitudes (v) Energy drops and avalanche sizes for uniform shear, and (vi) Probability of plastic displacement as a function of strain amplitude.
I Number of cycles required to reach the steady state
We analyse the potential energy vs. the number of cycles to probe the approach to the steady state, and denote by the indicative number of cycles needed to reach the steady state, and is obtained as a decay constant by fitting the cycle dependence of energies to the form . These fits are shown in Fig. S1 (a), (b) for (for the cases) and (for both and ) respectively. Fig. S1(c) shows that grows strongly on approaching the yield value of between and . The fit lines are guides to the eye.
II Evolution of energy with cycles
We present here the potential energy at each strain step over the cycles of deformation for = and in Fig. S2. The strain at and are represented by and . To test if the location of the energy minima coincide with the strain at zero stress, i. e. if = , we plot the energy and the stress loops in Fig. S3 for = 0.14 of N = 64000 (T=1). Though their values are close, we find (for ).

III Identification of particles undergoing plastic displacements
Here we describe how particles that are labeled “active”, that undergo plastic deformation during an energy drop, are identified, based on previous work [see, e. g. D. Fiocco, G. Foffi and S. Sastry, Phys. Rev. Lett. 025702 (2014); T. B. Schroder, S. Sastry, J. C. Dyre, and S. C. Glotzer, J. Chem. Phys. 112, 9834 (2000)]. In the presence of a plastic rearrangement, it is found that the distribution of single particle displacements displays an exponential tail, corresponding to plastic displacements, and a power law distribution at smaller values with an exponent of which may be deduced from assuming that the rest of the system undergoes an elastic deformation owing to the stresses created by the plastic deformation. As seen in Fig. S4, such an expectation is clearly satisfied at low strain amplitudes , but (a) the location of the crossover depends on the strain amplitude, and (b) the distinction becomes less clear at large strain amplitudes. We wish to include all particles that take part in plastic deformation, but to exclude those undergoing elastic displacements. As a conservative choice of cutoff, we use the cutoff that is clear and applicable for the case of , namely .
IV Avalanche distributions at different strain for different strain amplitudes
We show here the distribution of avalanche sizes that result when specific bins in the strain are considered, for different amplitudes , with results averaged over the first quadrant of cycles of strain. Fig. S5 shows the distribution of avalanche sizes in the strain window of (a) to , and (b) to , for different values of for which we sample the strain window in the course of a full cycle. We note that in both bases, the distributions fall into two categories, one with and the other with . In each category, the distributions are largely independent of the value of , but the distributions for the two categories are distinct.
V Energy drops and avalanche sizes for uniform shear
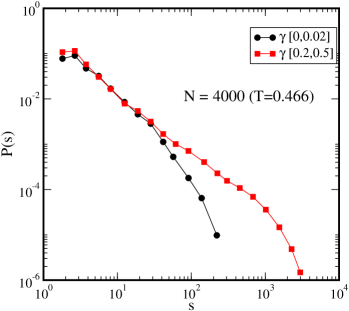
In Fig. S6 we present the mean energy drop for uniform strain, for and , for a range of system sizes for a range of system sizes. We see that the mean energy drops for the two temperatures are significantly different, but in each case show similar trends in their system size dependence. In Fig. S7, we compare, for , the mean size of avalanches and the mean energy drop, for and . The behaviour for the two cases is very different at strains below the yield strain, thus making it difficult to provide a general characterisation of the avalanches below the yield strain identified by oscillatory deformation. Further, we note that for , the energy drops and avalanche sizes below the yield strain remain high and comparable to values above yield strain. Fig. S8 shows the distributions of energy drops for two strain intervals (one below, {0, 0.02}, and one above, {0.2, 0.5}, the yield strian). For , the two distributions do not differ, whereas for , they are widely separated. The avalanche size distributions shown in Fig. S9 show the same pattern.
VI Probability of plastic displacement as a function of strain amplitude
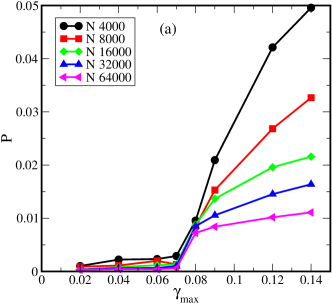
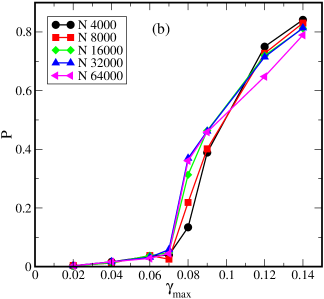
We show in Fig. S10 the average fraction of active particles, or probability , (ratio of the number of active particles and the total number of particles) for different system sizes, as a function of strain amplitude . The averages are performed over the first quadrant of the strain cycles. In Fig. S10(a) the probability is for individual drop events, averaged over all events, whereas in Fig. S10 (b) is obtained for each cycle by accumulating all particles that are active in any of the drop events that occur, and the averaging is done over all cycles. In both cases, changes sharply across the yield strain, but with different system size dependence.