On the Silicate Crystallinities of Oxygen-Rich Evolved Stars and Their Mass Loss Rates
Abstract
For decades ever since the early detection in the 1990s of the emission spectral features of crystalline silicates in oxygen-rich evolved stars, there is a long-standing debate on whether the crystallinity of the silicate dust correlates with the stellar mass loss rate. To investigate the relation between the silicate crystallinities and the mass loss rates of evolved stars, we carry out a detailed analysis of 28 nearby oxygen-rich stars. We derive the mass loss rates of these sources by modeling their spectral energy distributions from the optical to the far infrared. Unlike previous studies in which the silicate crystallinity was often measured in terms of the crystalline-to-amorphous silicate mass ratio, we characterize the silicate crystallinities of these sources with the flux ratios of the emission features of crystalline silicates to that of amorphous silicates. This does not require the knowledge of the silicate dust temperatures which are the major source of uncertainties in estimating the crystalline-to-amorphous silicate mass ratio. With a Pearson correlation coefficient of , we find that the silicate crystallinities and the mass loss rates of these sources are not correlated. This supports the earlier findings that the dust shells of low mass-loss rate stars can contain a significant fraction of crystalline silicates without showing the characteristic features in their emission spectra.
keywords:
dust, extinction — circumstellar matter — stars: evolution — stars: AGB and post-AGB — stars: mass-loss1 Introduction
Astronomical silicates consist predominantly of silicate minerals made up of cations and silicic acid radical ions (SiO) or (SiO), with the main metals being magnesium (Mg) and iron (Fe). According to their chemical structure, silicates can be classified as olivine (Fe2xMg2(1-x)SiO4) and pyroxene (Mg(1-x)FexSiO3) where . Meanwhile, silicates can also be divided into crystalline (ordered structure) and amorphous (unordered structure) based on their lattice structure. Laboratory studies show that both amorphous and crystalline silicates resonate in the infrared (IR) due to the Si–O stretching and O–Si–O bending modes originating from the silica tetrahedra. These vibrational modes of silicates dominate the emission or absorption spectra of oxygen-rich stars. More specifically, amorphous silicates reveal their presence in O-rich stars through the broad, smooth and featureless bands at 9.7 and 18 arising from the Si–O stretch and the O–Si–O bend, respectively, while crystalline silicates exhibit various distinct narrow sharp bands at 10–60 (Henning 2010, Molster & Kemper 2005, Liu & Jiang 2014).
The 9.7 and 18 amorphous silicate features of evolved stars were first detected in emission in M stars (Woolf & Ney 1969, Treffers & Cohen 1974) and then in absorption in heavily obscured stars with an extended circumstellar dust shell (Jones & Merrill 1976, Bedijn 1987). The detection of crystalline silicates in evolved stars was first made by Waters et al. (1996) who reported the 12–45 emission spectra of six oxygen-rich evolved stars obtained with the Short Wavelength Spectrometer (SWS) on board the Infrared Space Observatory (ISO). Thanks to ISO/SWS and the Infrared Spectrograph (IRS) aboard the Spitzer Space Telescope, crystalline silicates have now been seen in all evolutionary stages of evolved stars: red giants and supergiants, asymptotic giant branch (AGB) stars, post-AGB stars, planetary nebulae (PNe), and luminous blue variable (LBV) stars (see Jiang et al. 2013 and references therein).
Molster et al. (2002a,b,c) systematically investigated a sample of 17 evolved stars based on the ISO/SWS and LWS (Long Wavelength Spectrometer) spectra in the 2.4–195 wavelength range. They identified about 50 narrow bands of crystalline silicates, with distinct emission complexes at approximately 10, 18, 23, 28, 33.6, 40 and 69. The strengths and peak wavelengths of these features of crystalline silicates are experimentally shown to be affected by their iron (Fe) contents (e.g., Koike et al. [2003] found that the 33.6 feature of crystalline Mg2SiO4 becomes weaker and its peak wavelength shifts to longer wavelength up to 38.9 as the content of Fe elements increases to 100% [i.e., Fe2SiO4]; Olofsson et al. [2012] found that, with a tiny increase of 5% of Fe content from Mg2SiO4 to Mg1.9Fe0.1SiO4, the 69 crystalline olivine feature shifts to a peak wavelength longer than 70). The sensitivity of the peak wavelengths and strengths of the crystalline silicate spectral features to the Fe content convincingly shows that the crystalline silicate minerals in evolved stars are nearly Fe free as they very often show the features at 33.6 and 69, i.e., the dominant crystalline silicate species in evolved stars are Mg2SiO4 and MgSiO3 (Molster & Kemper 2005, Henning 2010, Sturm et al. 2013, Jiang et al. 2013, Blommaert et al. 2014).
The mechanism of silicate crystallization in evolved stars is still unclear. Gail & Sedlmayr (1999) modeled the dust condensation in the circumstellar envelopes of O-rich mass-losing stars. They found that, due to its high condensation temperature, Fe-free crystalline olivine could directly condense out of the stellar winds. Alternatively, a conversion from amorphous form through thermal annealing has also been frequently invoked to explain the presence of crystalline silicates in evolved stars (Molster & Kemper 2005, Henning 2010, Liu & Jiang 2014).
Apparently, the possible correlation of the silicate crystallinity with some stellar parameters would shed light on the origin of crystalline silicates in evolved stars and their crystallization mechanism. By silicate crystallinity we mean the mass fraction of silicate dust in crystalline form (e.g., see Jiang et al. 2013). Egan & Sloan (2001) speculated that the compositions of the dust condensed in the shells around evolved stars could be related to their mass loss history (e.g., episodic vs. continuous) and the structure of the shells (e.g., geometrically thin vs. geometrically thick). Molster et al. (2002c) argued that the silicate crystallinity of evolved stars is usually around 10–15% and can be much higher in systems with the presence of a disk (e.g., IRAS 09425-6040, a post-AGB star with a disk around it, has a crystallinity of 60–80%, see Molster et al. 2001). Jiang et al. (2013) reported a silicate crystallinity of 97% in IRAS 16456-3542, a planetary nebula, the highest to date ever reported for crystalline silicate sources.
The stellar mass loss rates of the mass-losing evolved stars are often considered to be one of the most important factors which determine whether or not crystalline silicates would be present in their circumstellar envelopes. Theoretical calculations have shown that amorphous silicates cannot be crystallized in stars with a low because the dust cannot be heated to temperatures high enough for crystallization, and that crystalline silicates can only form in stars undergoing substantial mass losses with a critical value of and having high dust column densities (e.g., see Tielens et al. 1998, Gail & Sedlmayr 1999, Sogawa & Kozasa 1998). The early detection of crystalline silicates in evolved stars by Molster et al. (2002,a,b,c) appeared to be consistent with this argument: those with crystalline silicates detected all have rather high mass loss rates, i.e., . More recently, Jones et al. (2012) analyzed the Spitzer/IRS spectra of 315 evolved stars and found that the mass loss rates of the stars exhibiting the crystalline silicate features at 23, 28 and 33 span over 3 dex, down to , although for most of the stars . Jones et al. (2012) investigated the possible correlation between and the silicate crystallinity by examining the relation of with the strengths of the 23, 28 and 33 features measured as their equivalent widths. They found no correlation, except a general tendency that stars with a high mass loss rate would have a higher probability of displaying crystalline silicate features. Kemper et al. (2001) performed an extensive radiative transfer calculations of the model IR emission spectra for O-rich AGB stars of mass loss rates ranging from to and of a wide range of crystallinities up to 40%. They found that crystallinity is not necessarily a function of mass-loss rate. They argued that, due to the temperature difference between amorphous and crystalline silicates which is caused by the lower visual/near-IR absorptivity of the latter because of its very low Fe content, it is possible to allow for a crystallinity of up to 40% in the circumstellar dust shell, without its IR emission spectra showing the characteristic spectral features of crystalline silicate minerals.
In this work we revisit the relation between and the silicate crystallinities of evolved stars by taking an alternative approach: unlike previous studies in which the silicate crystallinity was often measured in terms of the crystalline-to-amorphous silicate mass ratio, we characterize the silicate crystallinities with the flux ratios of the emission features of crystalline silicates to that of amorphous silicates. This does not require the knowledge of the silicate dust temperatures which are the major source of uncertainties in estimating the crystalline-to-amorphous silicate mass ratio. This paper is organized as follows: §2 describes the sample of 28 nearby O-rich stars selected for this –crystallinity correlation study. In §2.1 we model the spectral energy distributions (SEDs) of the selected sources from the optical to the far-IR and derive their mass loss rates. We derive the silicate crystallinity in §3. The results are presented and discussed in §4 and summarized in §5.
2 Sample Stars
We select a sample of 28 O-rich evolved stars (see Table 1) based on the following criteria: (1) the ISO/SWS spectra of most of these sources exhibit prominent crystalline silicate emission features; (2) they exhibit distinguished 10 and 18 amorphous silicate emission features; (3) they are relatively “local” with a distance of less than 5 kpc to remove the influence of extinction and metallicity.111In an examination of the Spitzer/IRS and ISO/SWS spectra of 217 O-rich AGB stars and 98 red supergiants, Jones et al. (2012) noticed a possible change of crystalline silicate mineralogy with metallicity, with enstatite seen increasingly at low metallicity while forsterite becomes depleted.
The ISO/SWS spectra are taken from the archive and the 2.4–45 wavelength range covers 6 out of 7 of the crystalline silicate feature complexes summarized by Molster et al. (2002a), i.e., the 10, 18, 23, 28, 33.6 and 40 complexes except the 69 complex. These archival data have already been processed by Sloan et al. (2003) in a uniform manner.
2.1 Mass Loss Rates
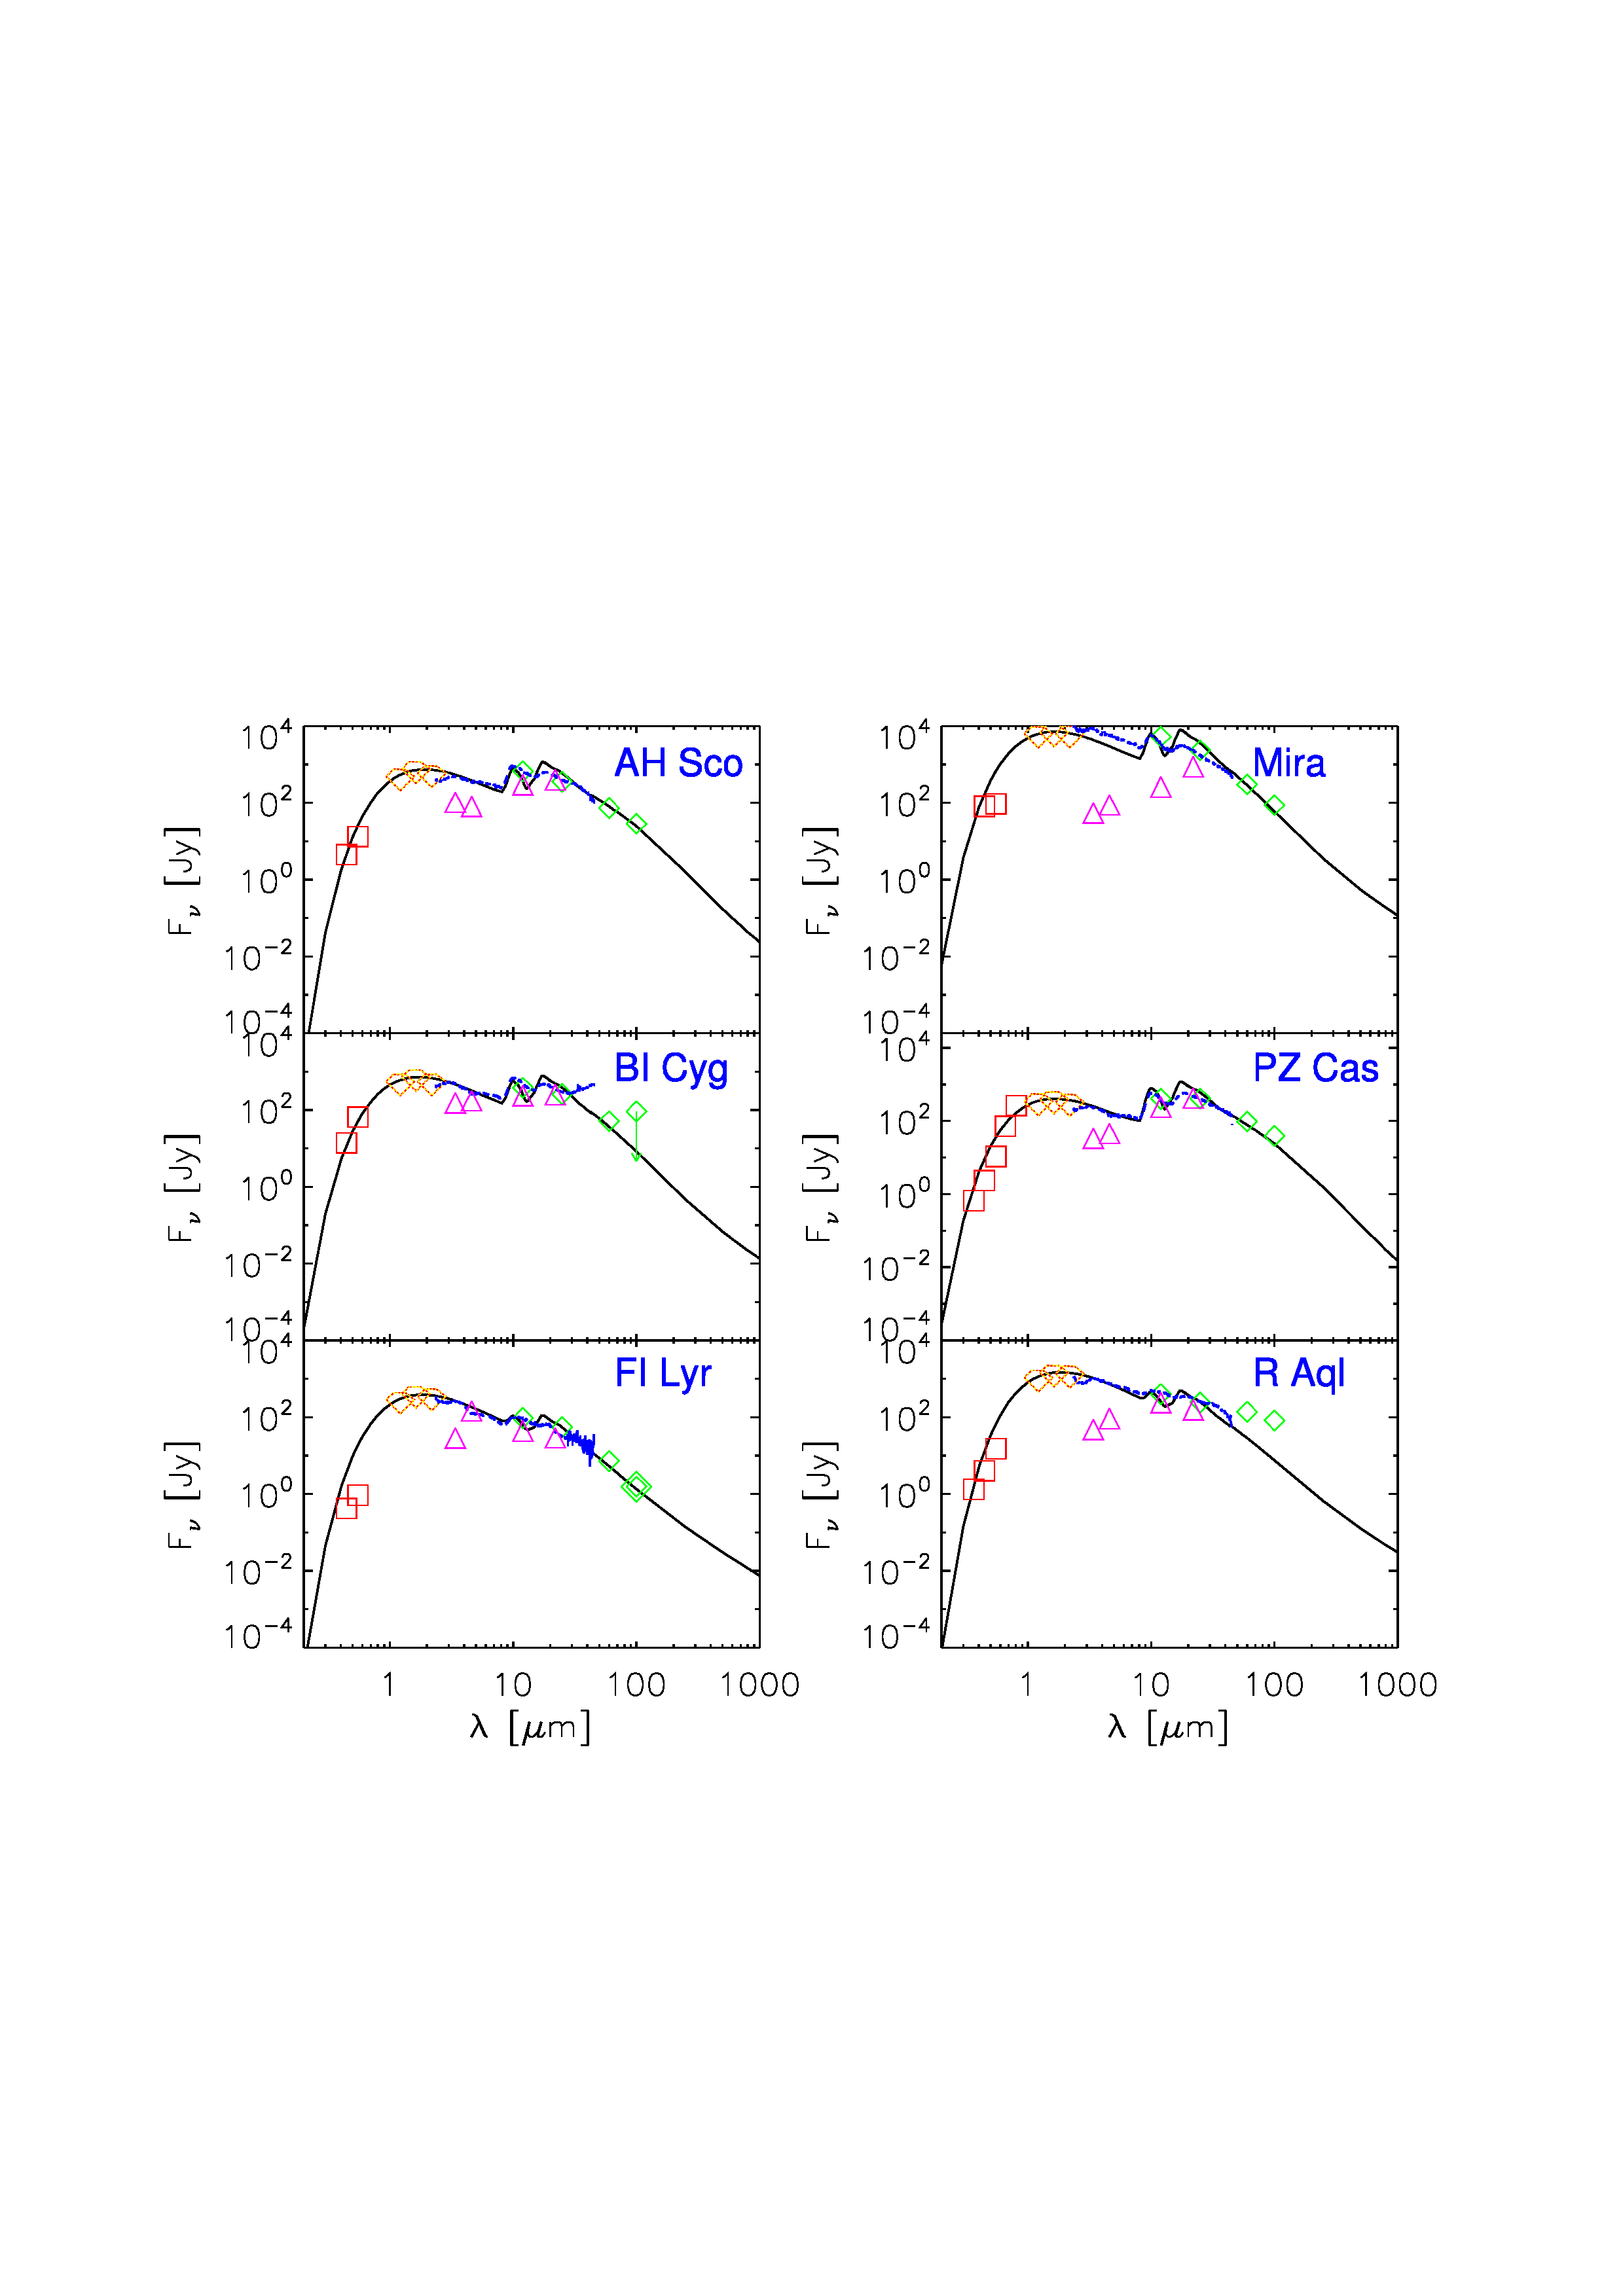
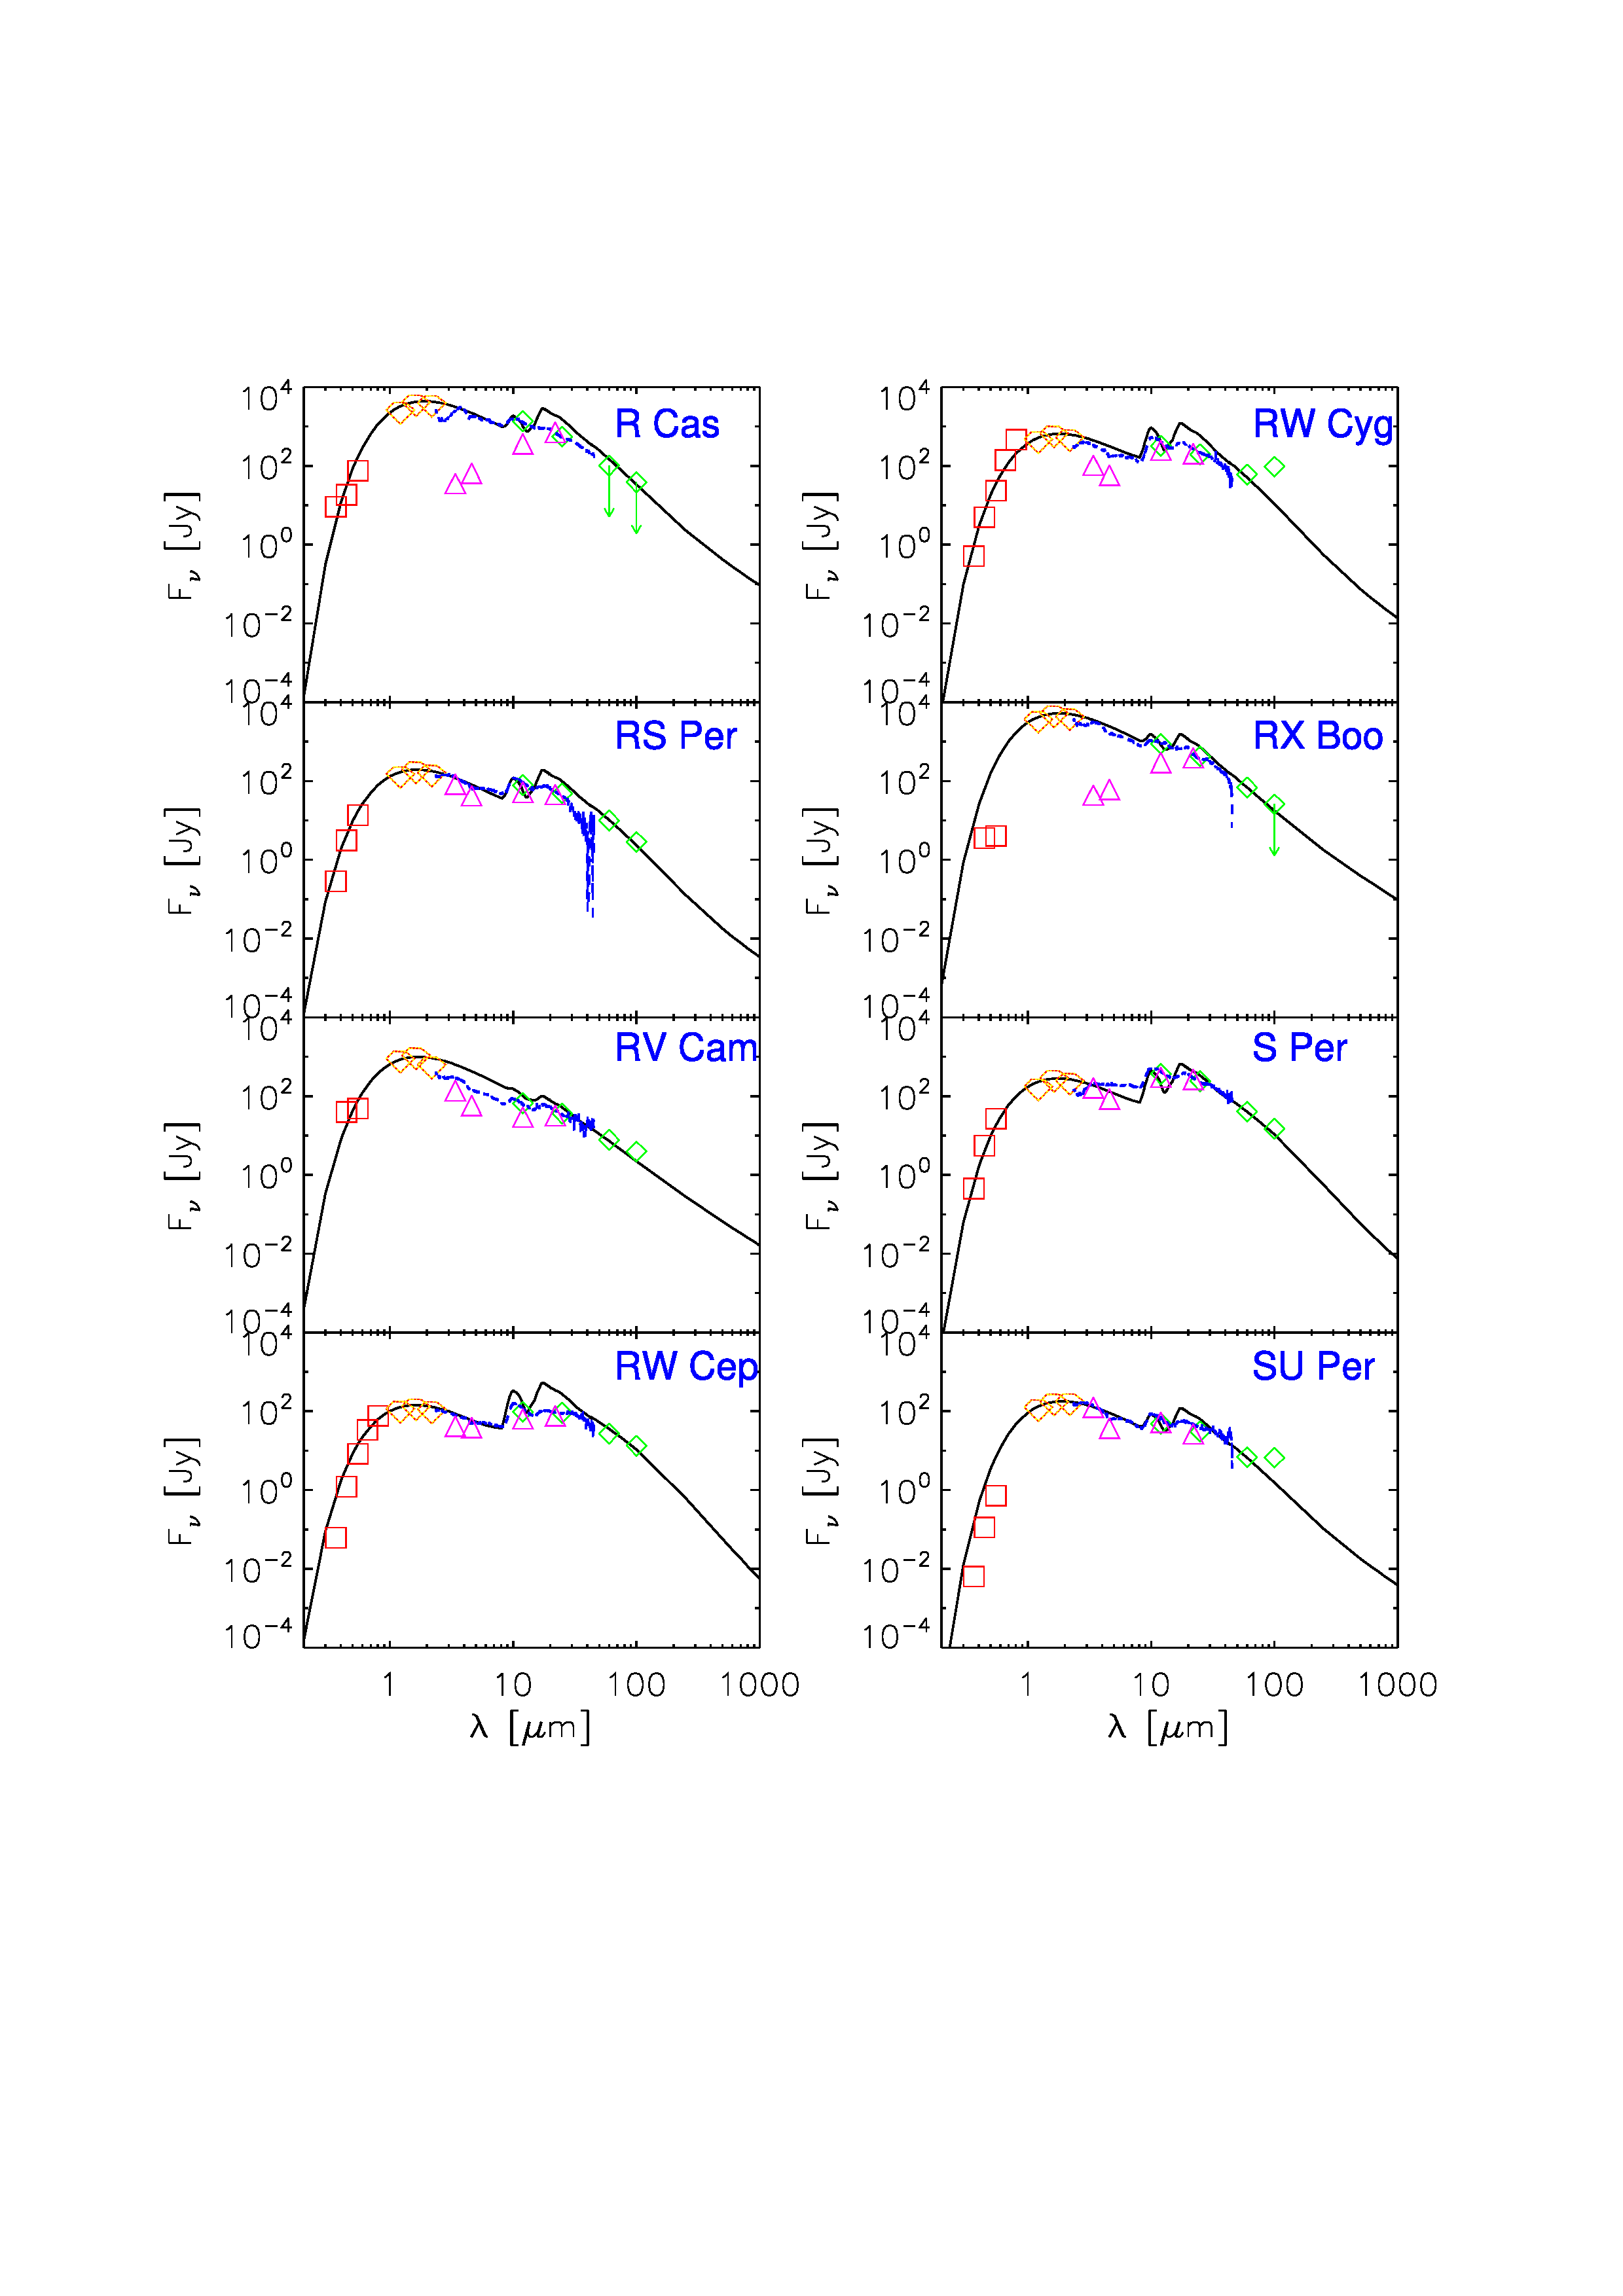
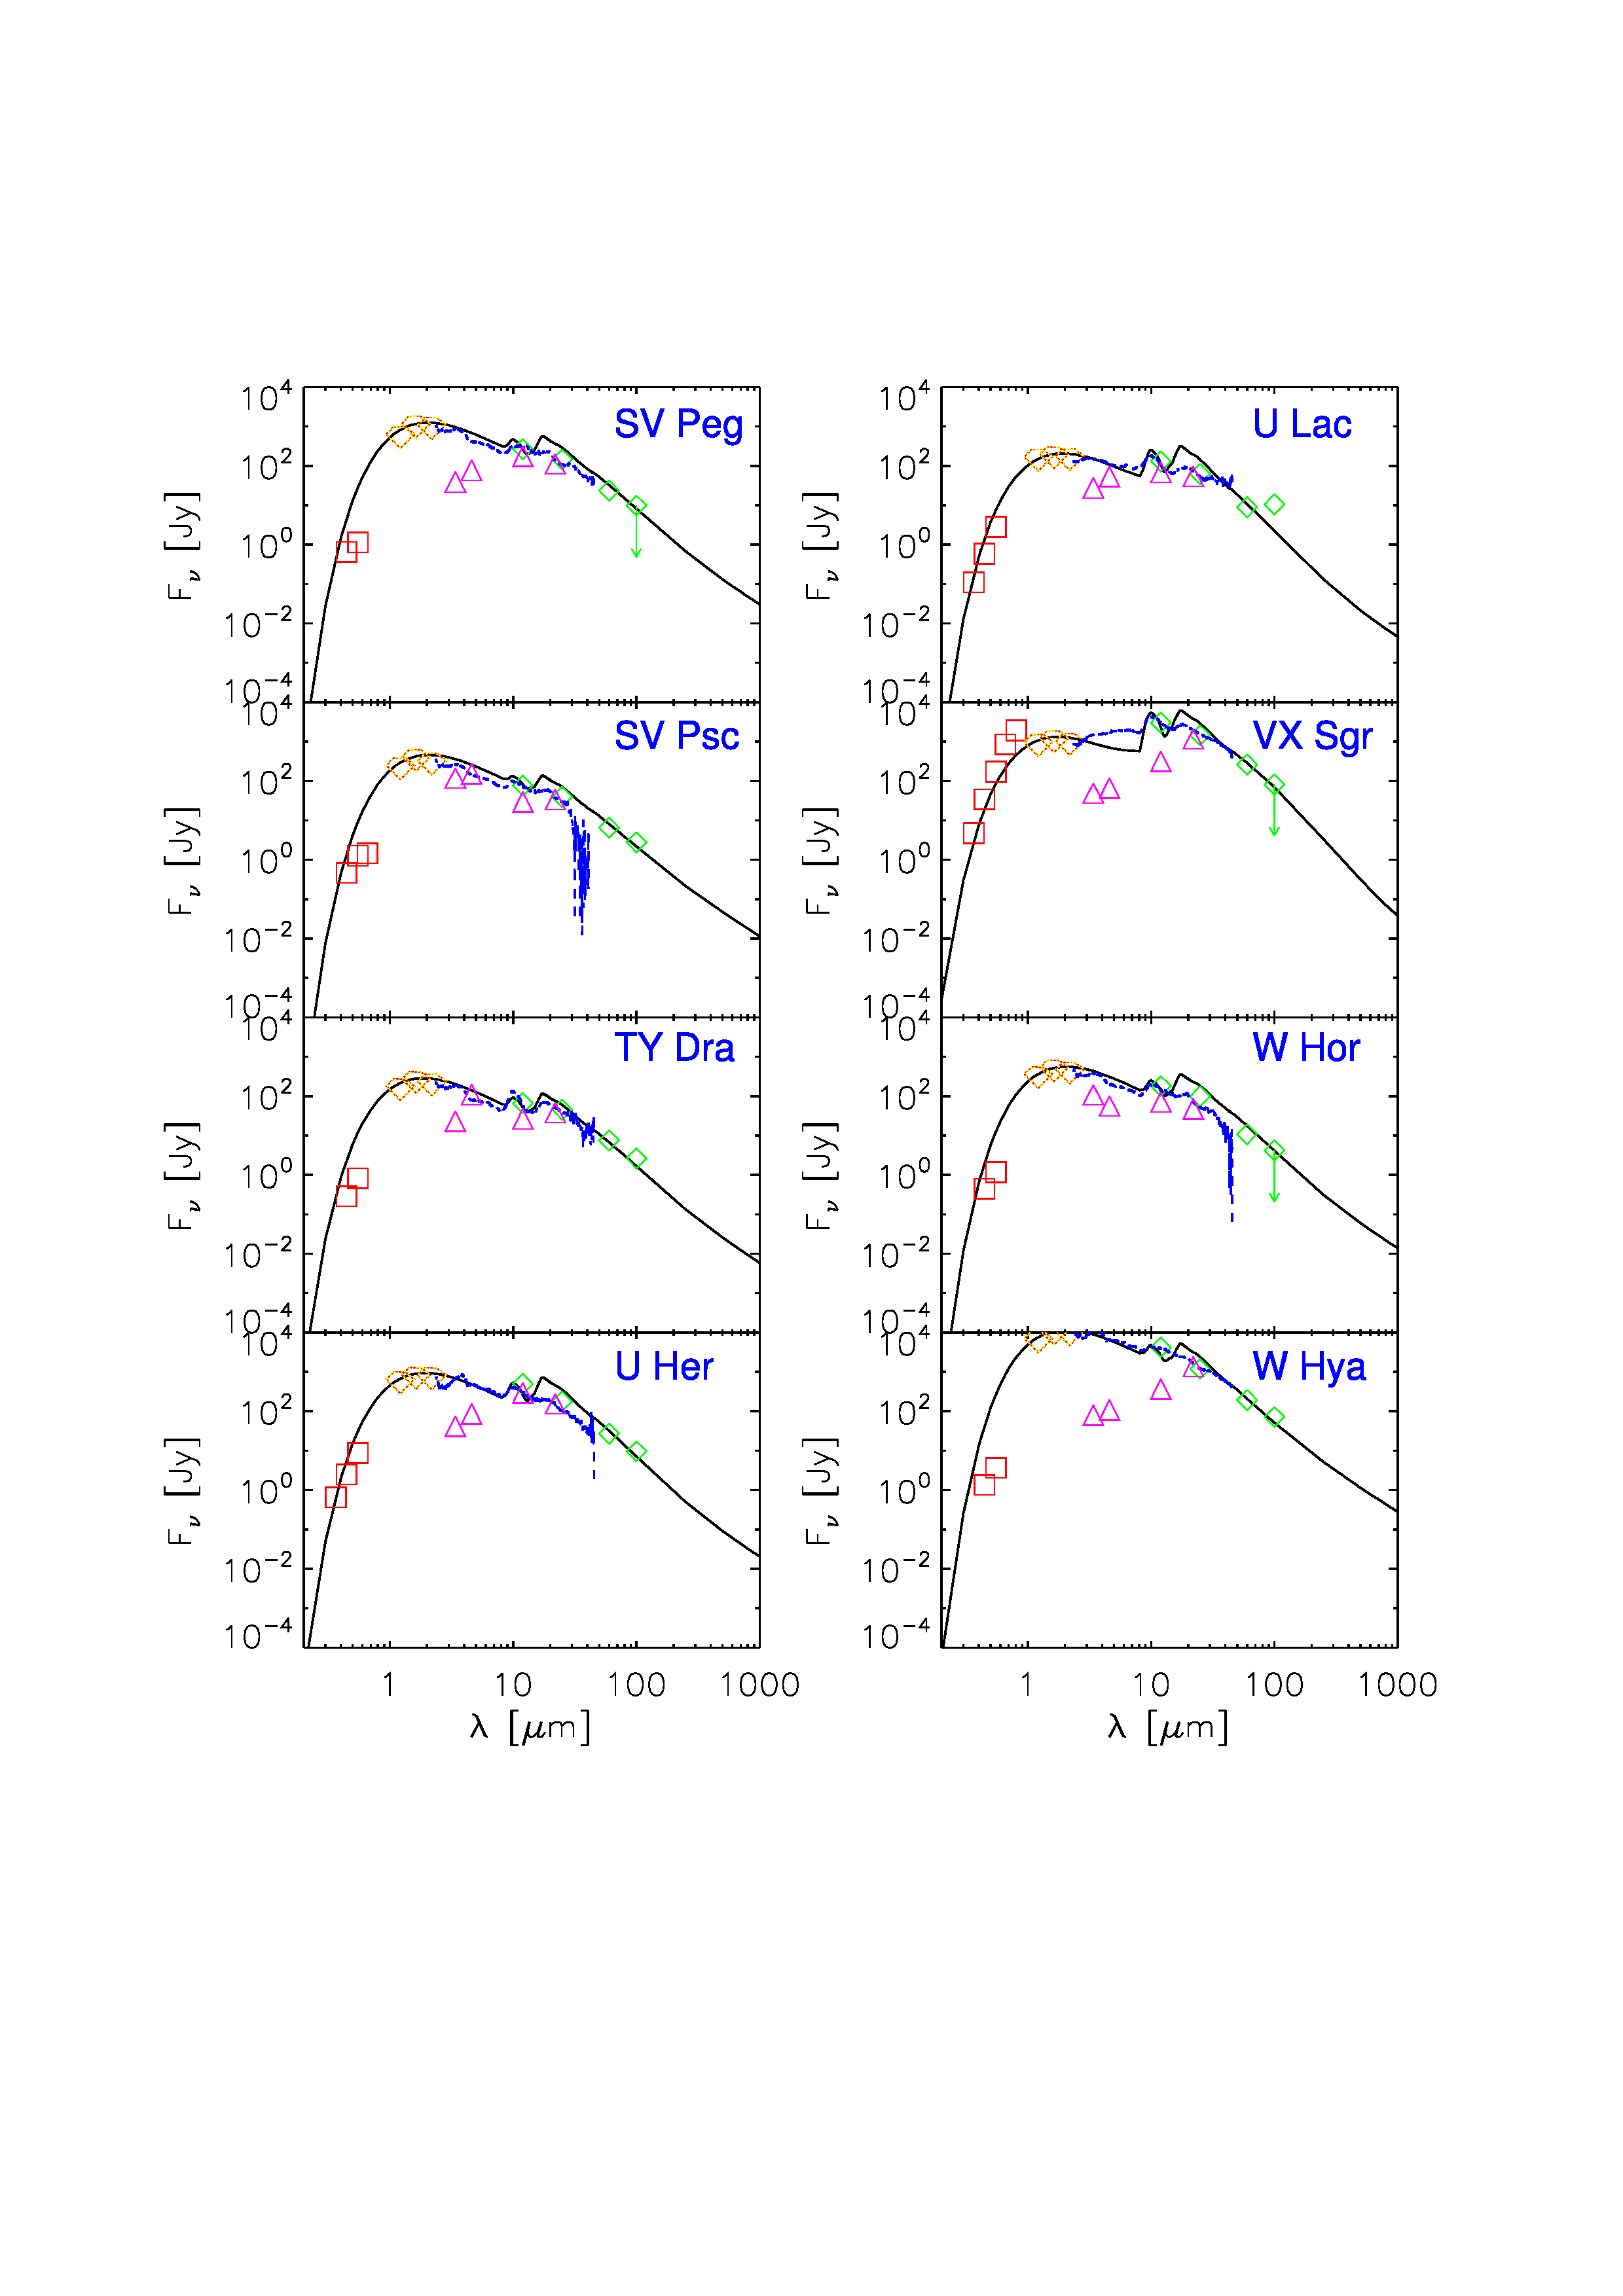
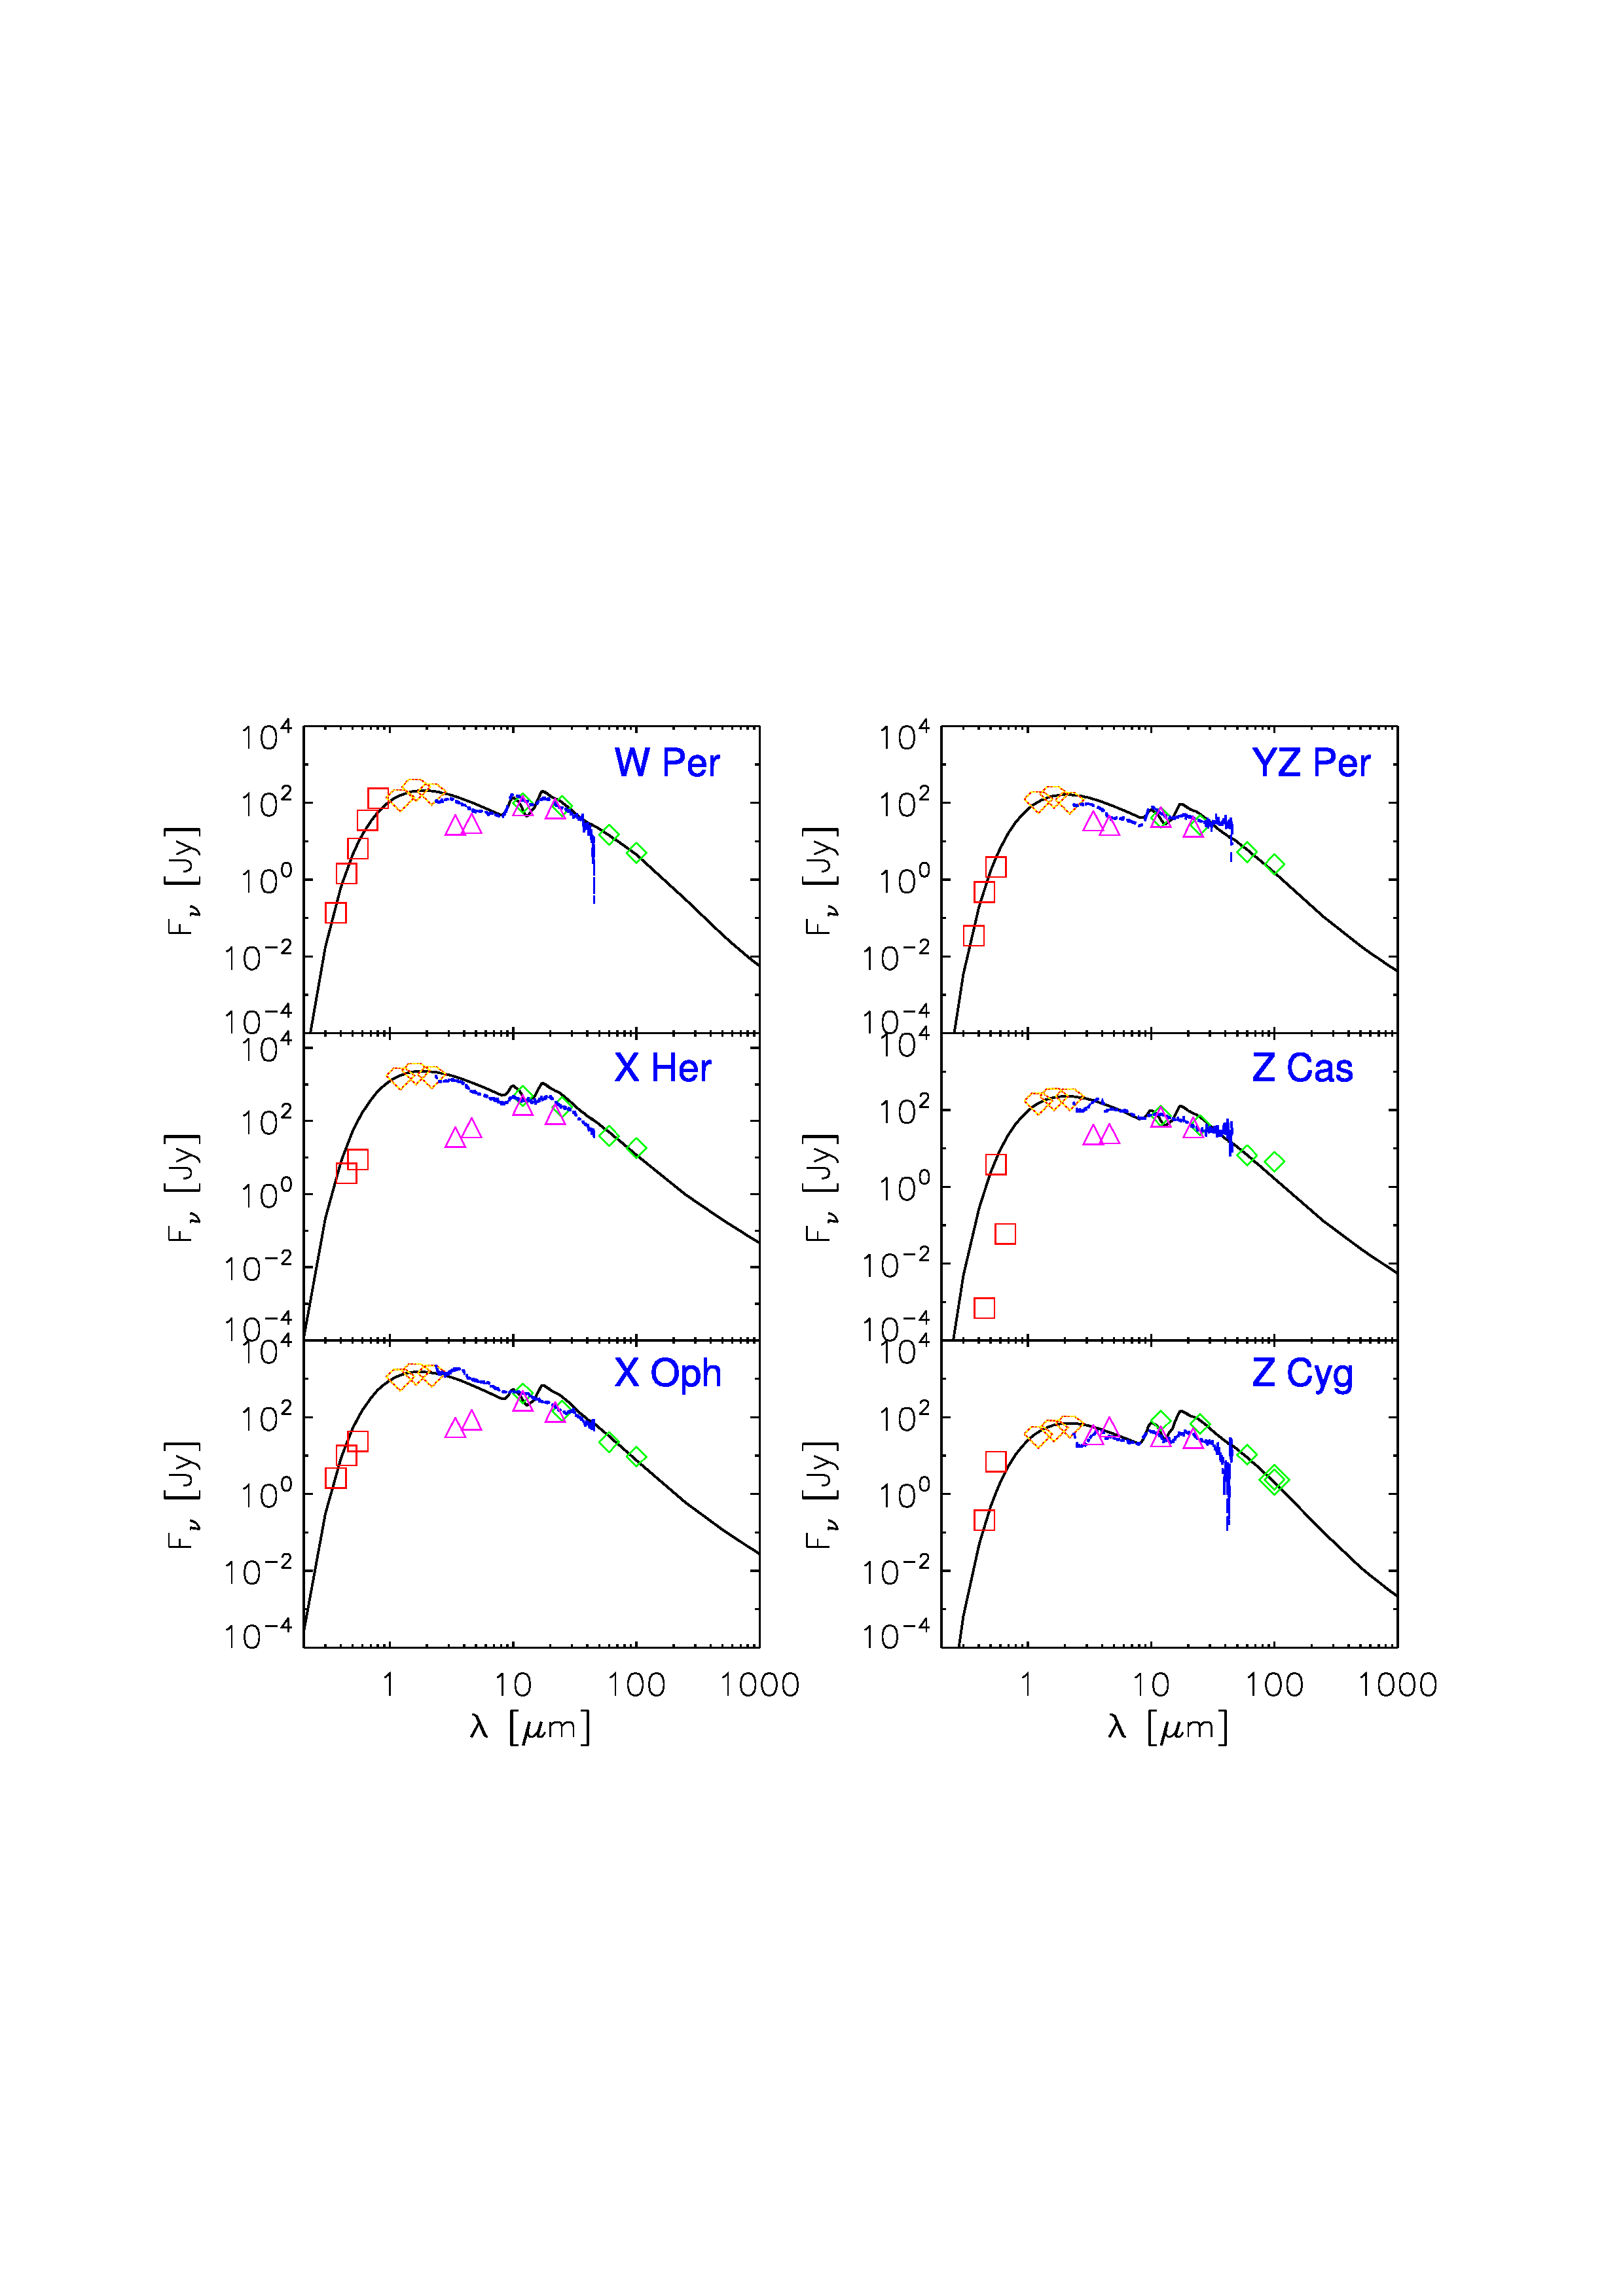
To derive the mass loss rate of each source, we employ the “2-DUST” radiative transfer code of Ueta & Meixner (2003) to model its SED from the optical to the far-IR. Although the “2-DUST” code was developed for dusty axisymmetric systems and is capable of dealing with layered dust shells formed during the AGB mass-loss phase and the subsequent post-AGB superwind phase, it can be simplified so that it is also applicable to spherical shells around AGB stars.222Ueta & Meixner (2003) designed a 2-dimensional density distribution which has (i) a spherical outer shell – the remnant of the AGB wind, (ii) a spheroidal mid-region, and (iii) an inner toroidal core created during the superwind phase – a rather brief period of equatorially-enhanced mass-loss near the end of the AGB mass-loss phase. Such a density distribution is a function of the radius of the dust shell , the latitudinal angle , and five geometric parameters (, , , , and ): (1) where is the dust mass density at radius and latitude , is the dust mass density on the polar axis at the inner edge of the shell, is the inner radius of the shell, is the outer radius of the shell, is the radius of the superwind between and the AGB wind which defines the “thickness” of the inner, axisymmetric region of the shell. By simply setting and we obtain a density function of for AGB stars which have a spherical shell and undergo constant outflow. In this work we are mainly concerned with stars which have not yet evolved to the post-AGB phase. Their circumstellar shells are commonly assumed to be spherical. If we assume a constant outflow, the dust density function has a simple form of , where is the dust mass density at radius , is the dust mass density at the inner edge of the shell, and is the inner radius of the shell. Therefore, the dust shell is described by three parameters: , , and the outer radius of the shell . The total dust mass in the shell is given by .
The input stellar parameters required by the 2DUST code are the stellar effective temperature and the stellar luminosity (see Table 2). For each source, we treat and as free parameters but requiring and which are reasonable values for AGB stars (see Sargent et al. 2011).
For the dust composition, we only consider amorphous silicate for accounting for the 9.7 and 18 amorphous silicate emission features and the continuum emission. We take the optical constants of amorphous olivine MgFeSiO4 measured by Dorschner et al. (1995). We adopt a mass density of for amorphous MgFeSiO4. For the dust size distribution, we take a MRN-type power-law distribution function of (Mathis et al. 1977) for , where is the spherical radius of the dust (we assume the dust to be spherical) with a lower and upper cutoff of and (see Sargent et al. 2010).
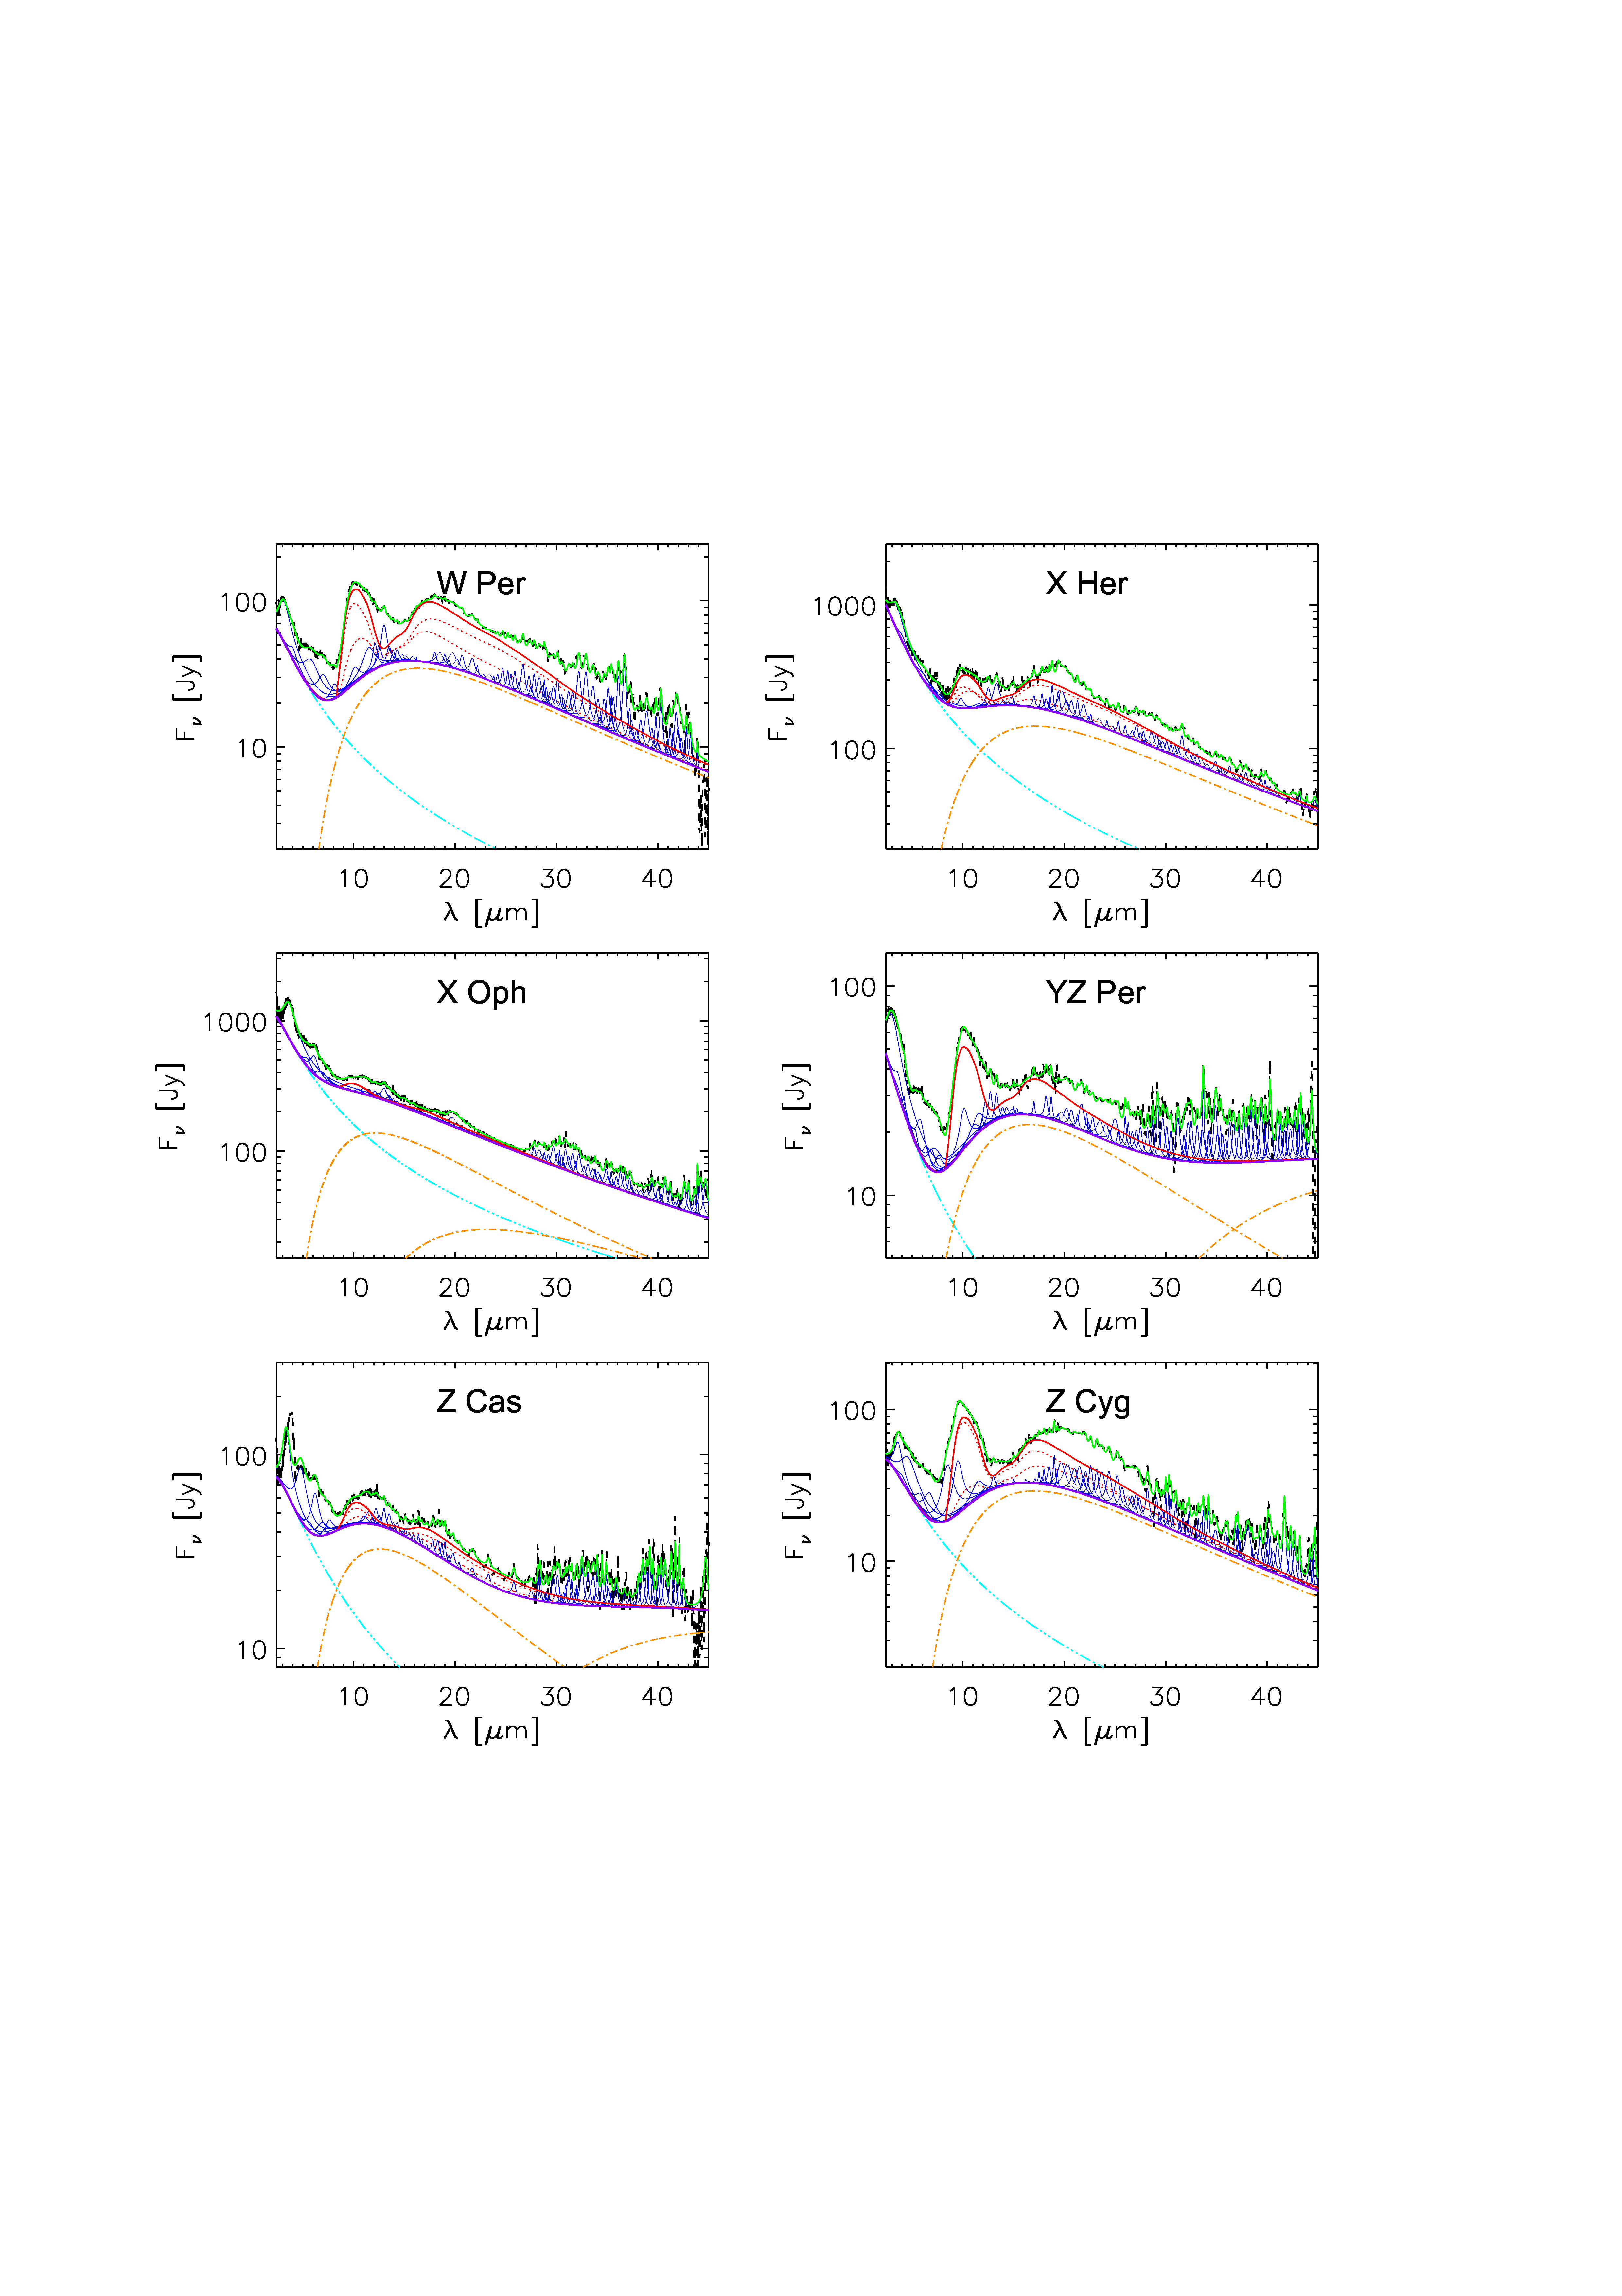
The input photometric data (see Table 1) are compiled from the literature, including the Johnson UBVRI photometry, the (1.22 m), (1.63 m), (2.19 m) 2MASS photometry (2MASS), the 4-band WISE photometry (Cutri et al. 2012) at W1 (3.4 m), W2 (4.6 m), W3 (12.0 m), and W4 (22.0 m), and the Infrared Astronomical Satellite (IRAS) photometry at 12, 25, 60 and 100 (Beichman et al. 1988). These broadband photometric data from the near-ultraviolet to the far-IR are supplemented to the ISO/SWS spectra (see Figure 1).
To correct for the interstellar extinction along the line of sight toward the stars considered here, we assume the wavelength-dependence of the extinction to be that of the Galactic average extinction law of , where is the total-to-selective extinction ratio. Let be the visual extinction and be the extinction at wavelength (which corresponds to frequency where is the speed of light). We restore the unobscured, “true” flux density from the observed, reddened flux density as follows:
| (2) |
where is taken to be the extinction law (see Cardelli, Clayton & Mathis 1989). We search for the visual extinction for each source from the NASA/IPAC Extragalactic Database (NED). If not available or uncertain in NED(when the Galactic latitude is larger than 10 degree), we derived from the observed color index of each source:
| (3) |
where is the color excess between the and bands and is the extinction-to-color excess ratio (see Wang, Li & Jiang 2015). For a given source, the color excess is obtained from
| (4) |
where and are respectively the observed and intrinsic color indices of the stars, and and are respectively the 2MASS and photometric fluxes (2MASS). In Table 3 we list the visual extinction for each source, obtained either from NED or from the observed color index.
Because the selected sources are bright, saturation can be a problem in the 2MASS and WISE photometry. The WISE/W1 and W2 bands are the most seriously affected by saturation due to their high sensitivity and the high fluxes of some sources in these two bands. Even the improved data quality in ALLWISE (Cutri et al. 2013) does not alleviate the problem, while we adopted the version of the WISE All-Sky data release (Cutri et al. 2012). Fortunately, the ISO/SWS spectrum covers the waveband of WISE, which has no problem of saturation and consequently a more reliable flux measurement and is used to judge the model SED fitting. For the IRAS photometry, some data have a high uncertainty. We label these data with “:” in Table 1 and in Figures 1–4 they are plotted as doubled-rhombus. Some measurements are just an upper limit of the flux. We label these fluxes with “U” in Table 1 and in Figures 1–4 they are plotted with a downward arrow. In the SED fitting process, the saturated WISE bands and the uncertain IRAS 100 band are not considered. For illustrative purposes, we also plot them in the figures.
We select the best-fit model by eye. In Table 4 we compare the mass loss rates derived here with that reported in the literature. They are generally consistent.
Finally, assuming an outflow velocity of (Habing & Olofsson 2003), we calculate the dust mass loss rate for each source from the SED modeling (see Table 2).
3 Crystallinity
In the literature, the silicate crystallinity is usually defined as the mass fraction of crystalline silicate, , where and are respectively the mass of the crystalline and amorphous silicate components. The silicate dust masses are often derived by fitting the observed IR emission flux density () under the assumption of an optically-thin dust shell in the IR: which sums the contribution from dust species with a mass absorption coefficient of , mass and temperature (e.g., see Molster et al. 2002c, Jones et al. 2012, Gielen et al. 2008, Jiang et al. 2013), where is the Planck function at temperature and frequency . This approach is also widely adopted in modeling the silicate emission spectra of protoplanetary and debris disks (e.g., see Sargent et al. 2006, 2009a,b; Lisse et al. 2007, 2009, 2012). One tends assume three dust species: amorphous silicate, crystalline forsterite, and crystalline enstatite. For each species, a cold component and a warm component are often assumed. The crystalline silicate mass is obtained by summing over four components (i.e., warm crystalline forsterite, cold crystalline forsterite, warm crystalline enstatite, and cold crystalline enstatite), while the amorphous silicate mass is the sum of warm and cold amorphous silicates (Suh 2004, Gielen et al. 2008, Jiang et al. 2013). The problem associated with this method is that the derived silicate crystallinity is highly sensitive to the fitted dust temperatures which are often uncertain. If the temperature is uncertain by 20%, the derived dust mass and will be uncertain by a factor of 2. Also, it is not physical to treat the temperatures of crystalline silicates as free parameters since the observed peak wavelengths and relative strengths of the crystalline silicate features already contain clues about their temperatures (Koike et al. 1993, 1999; Jäger et al. 1998).
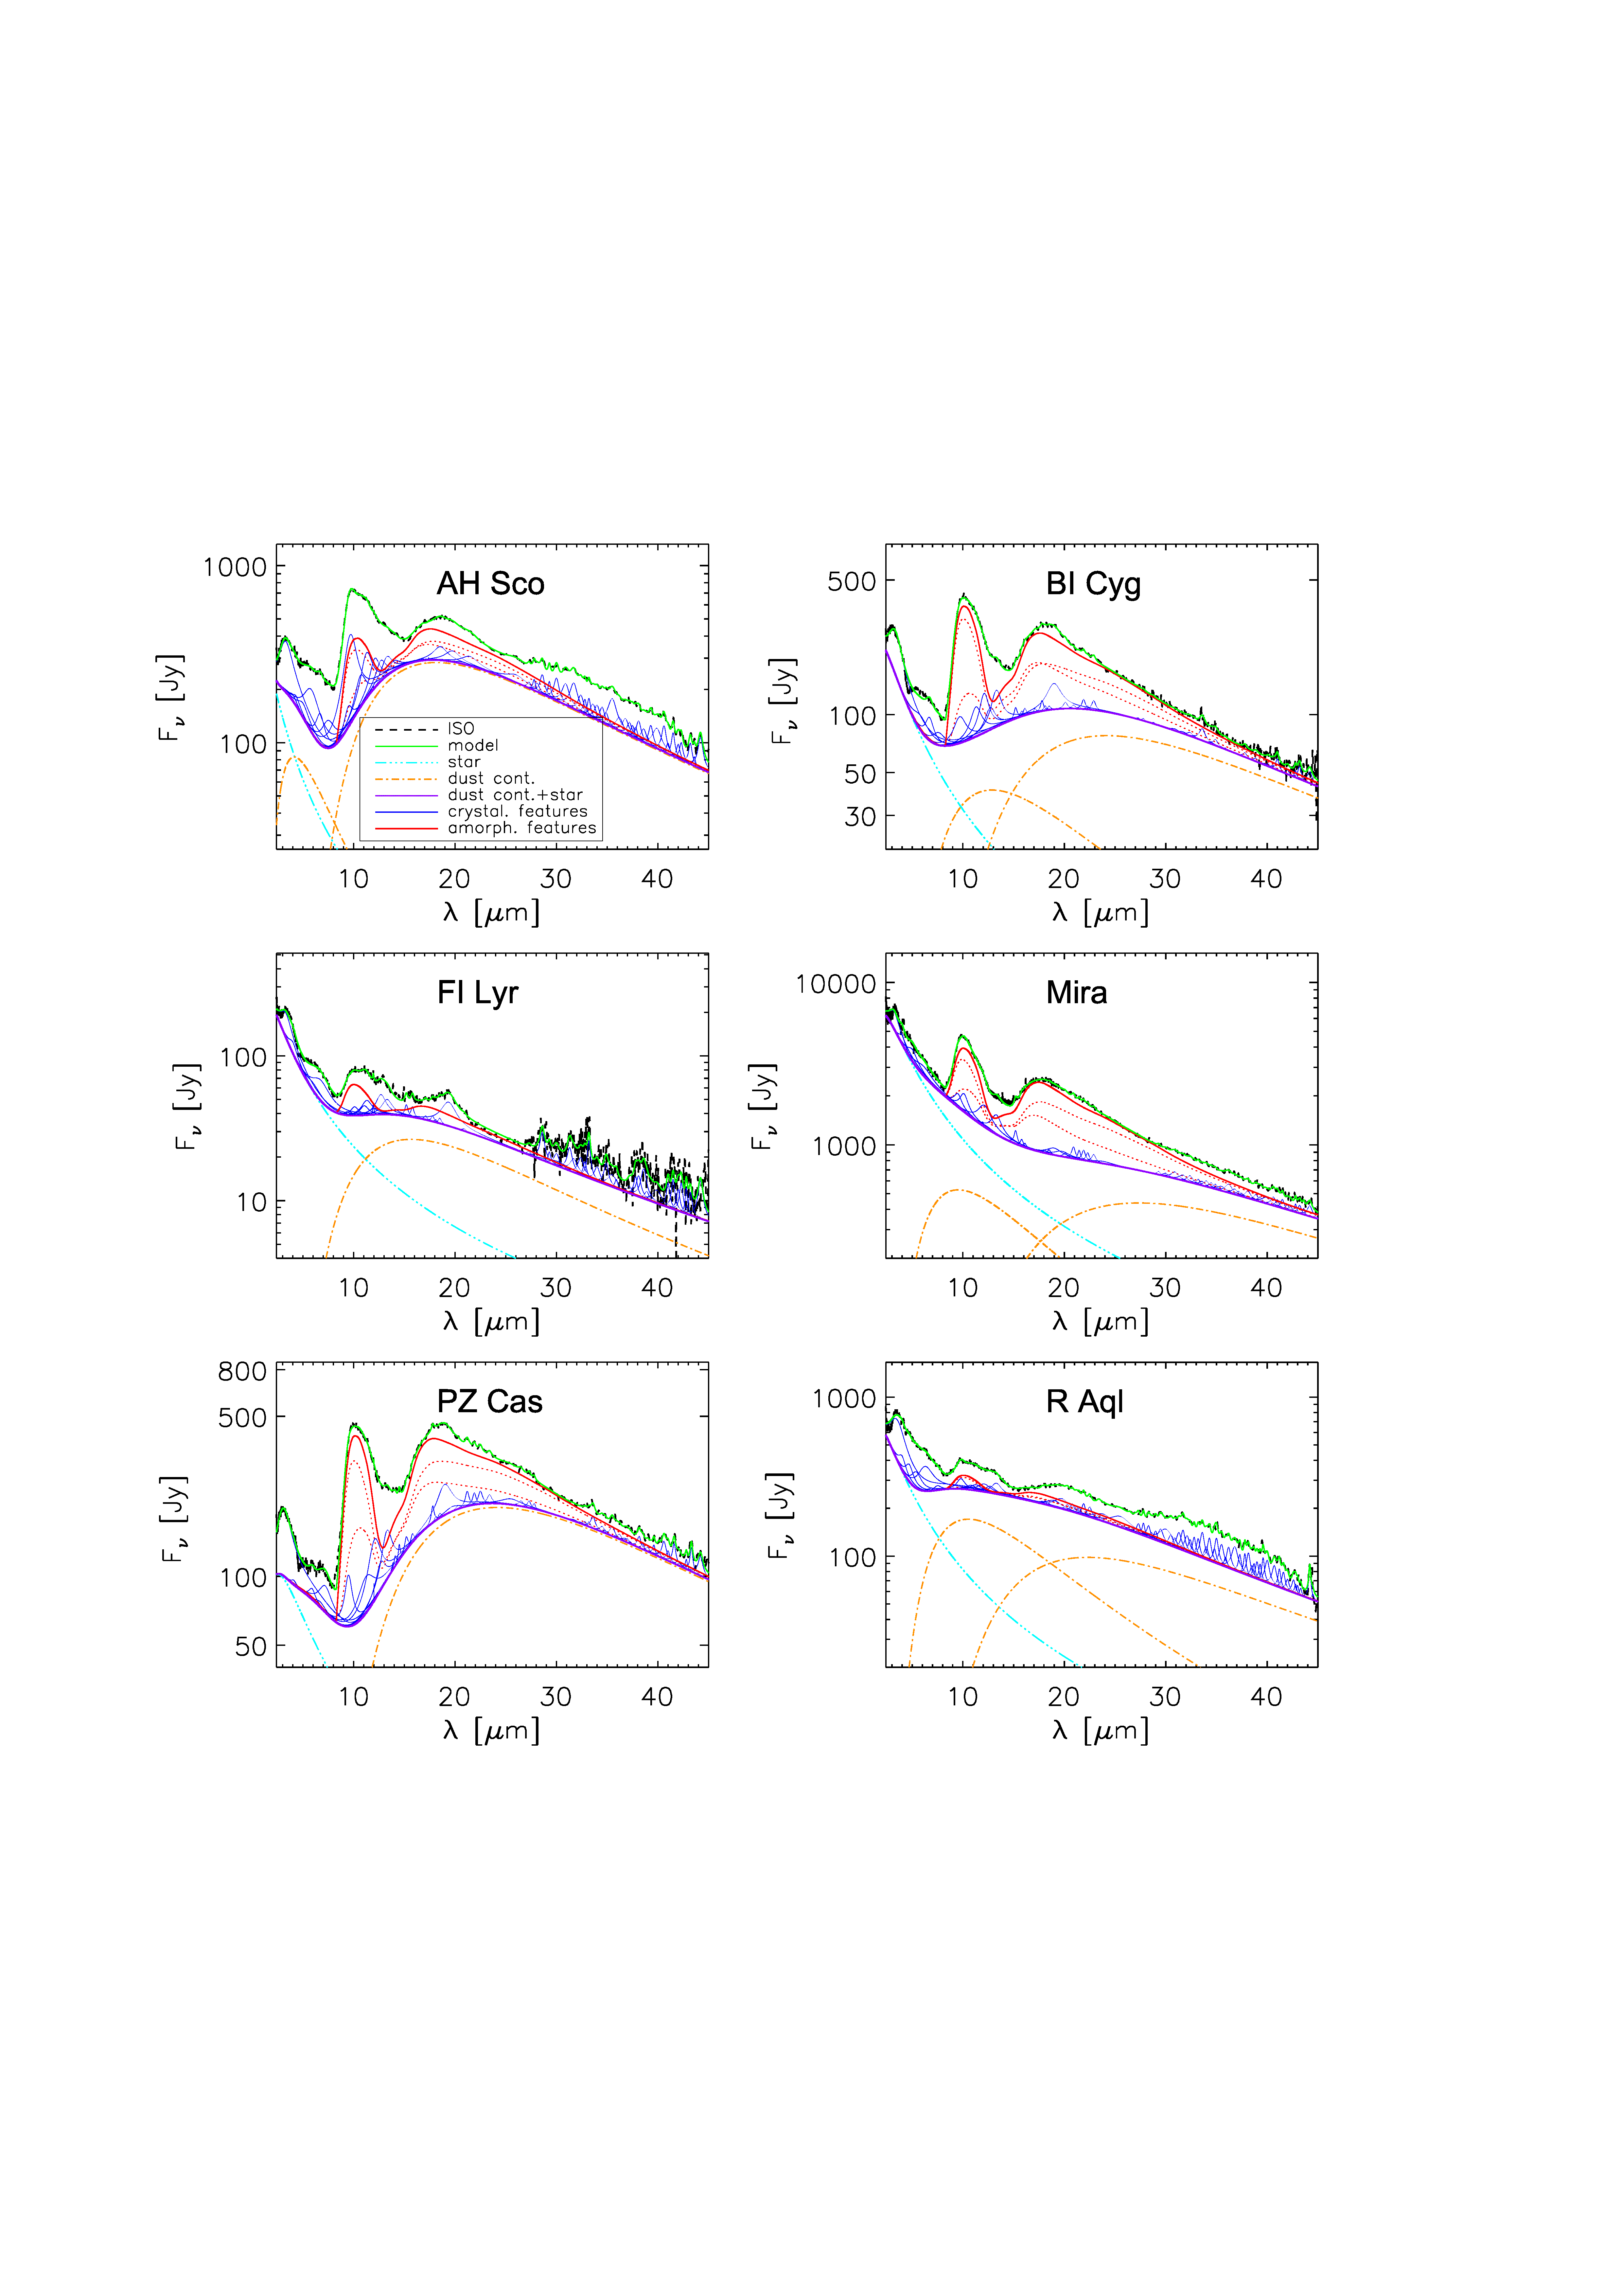
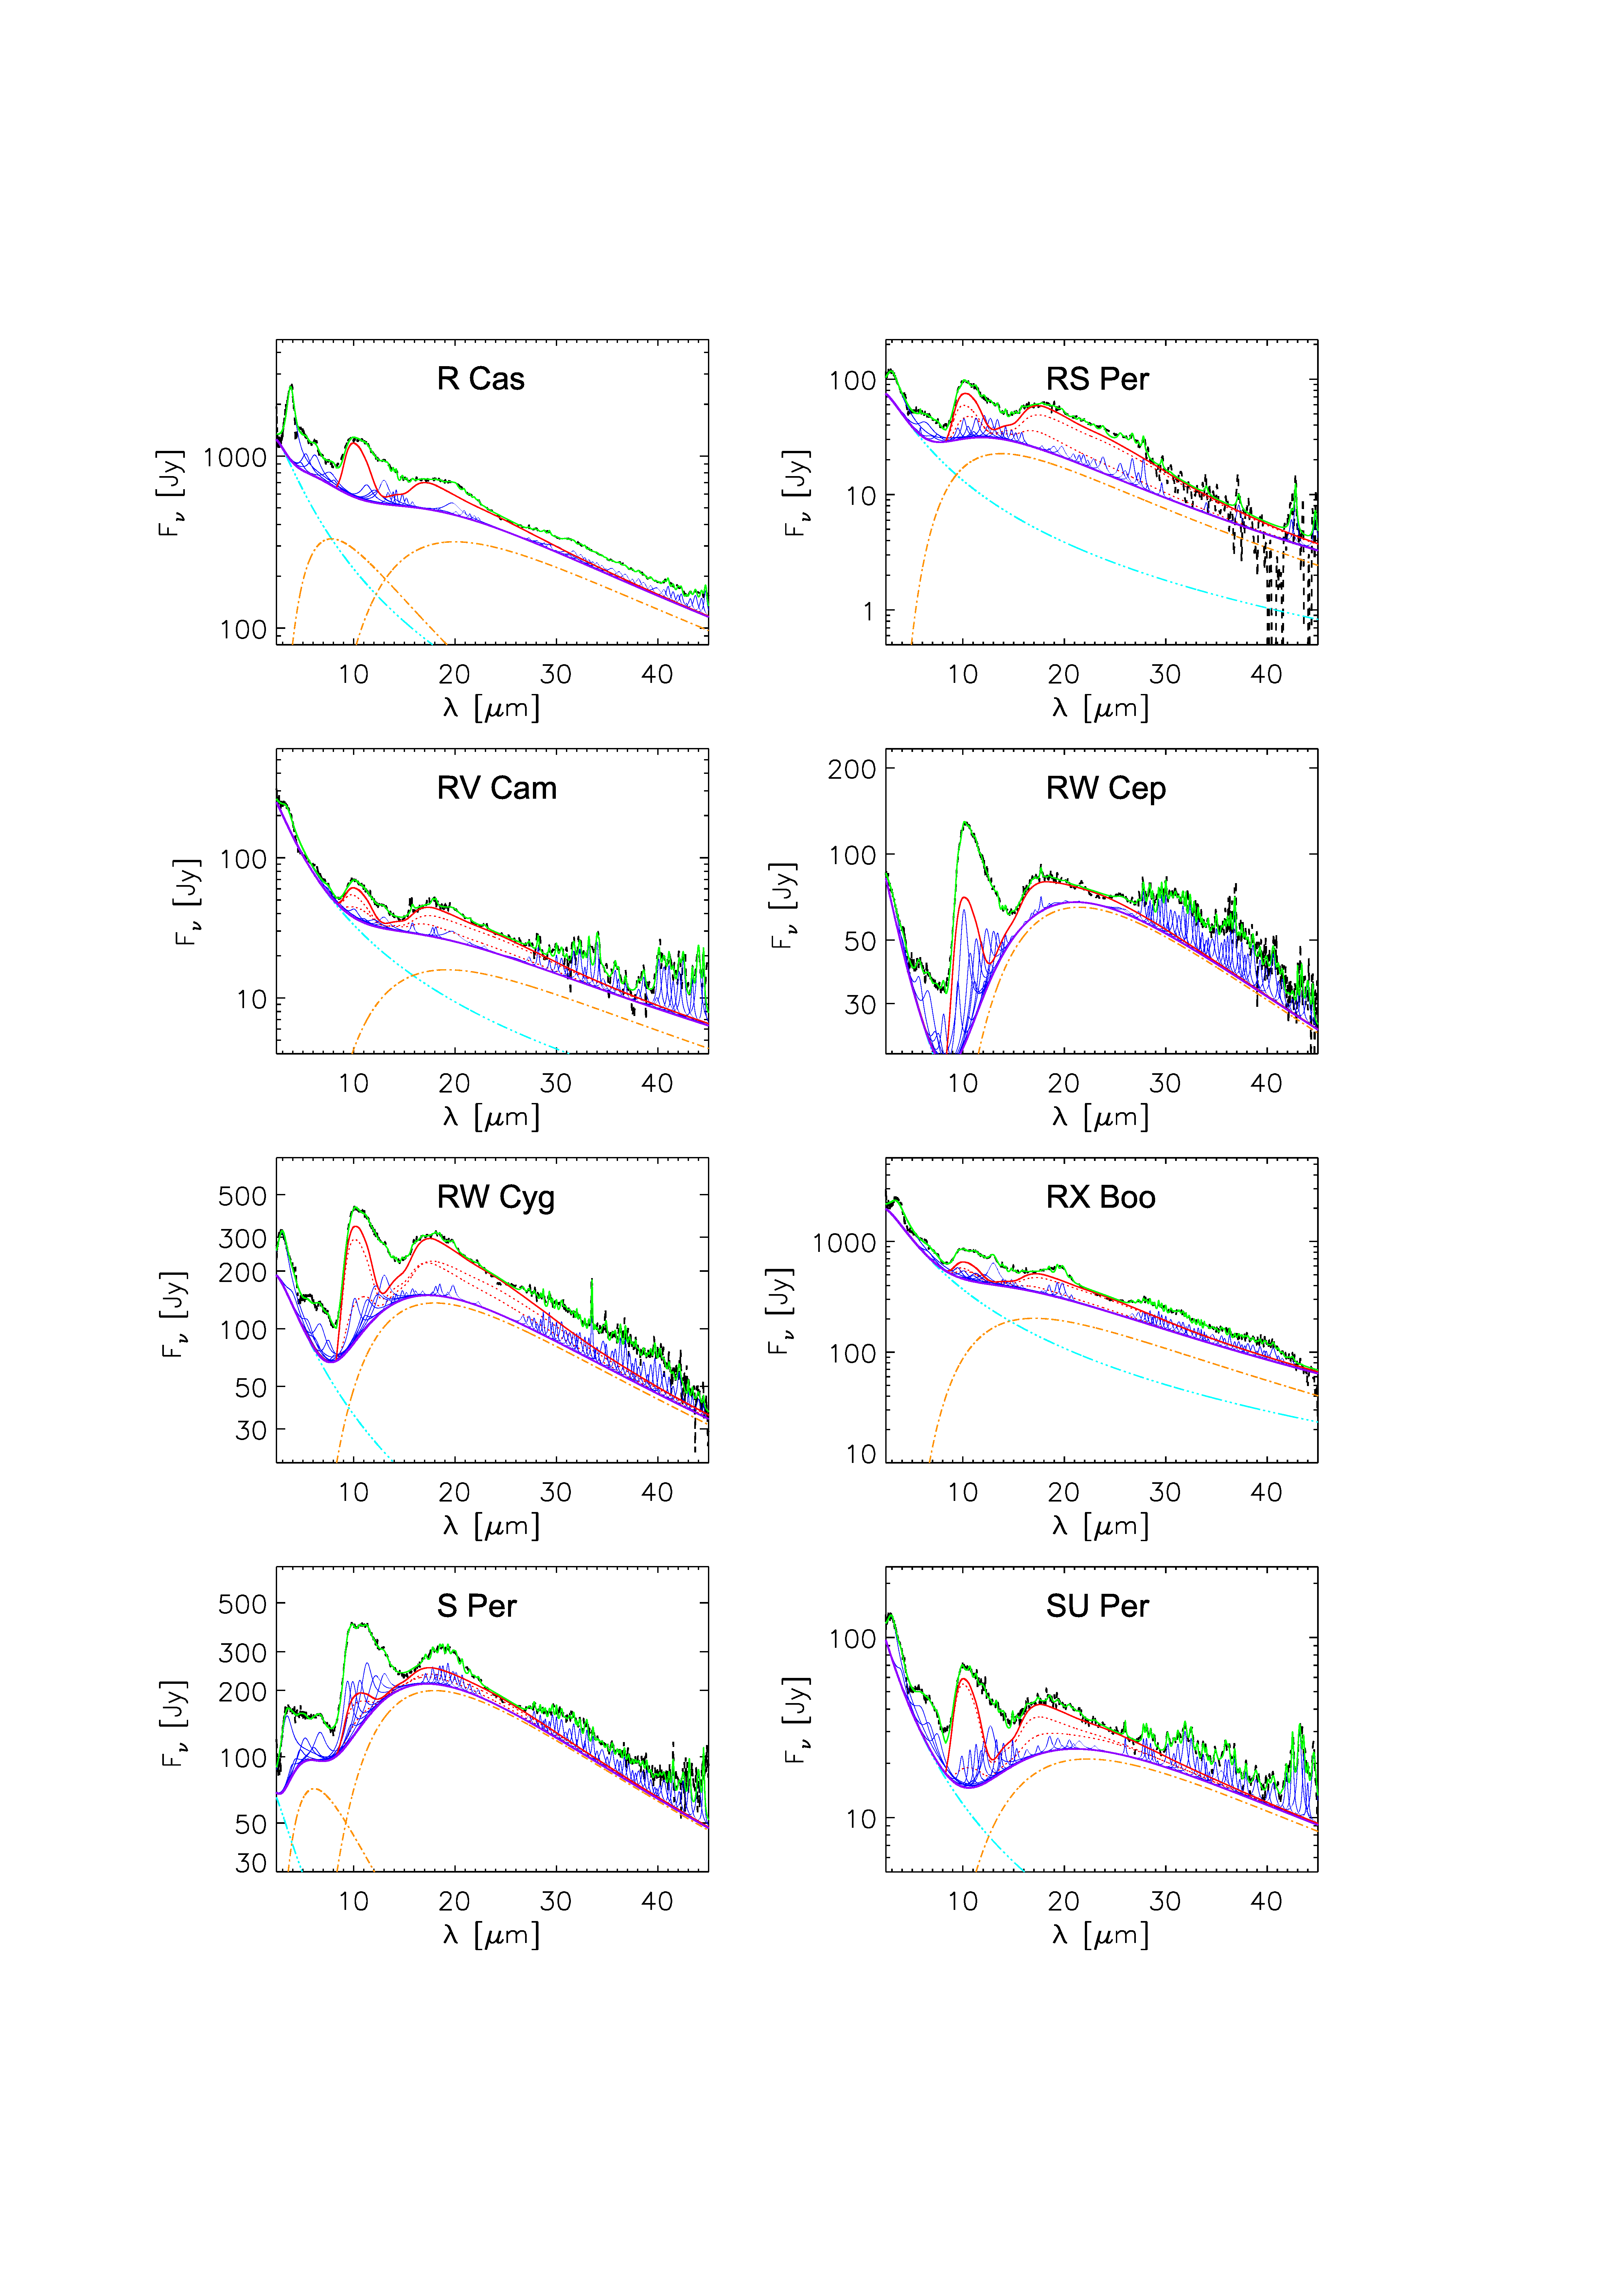
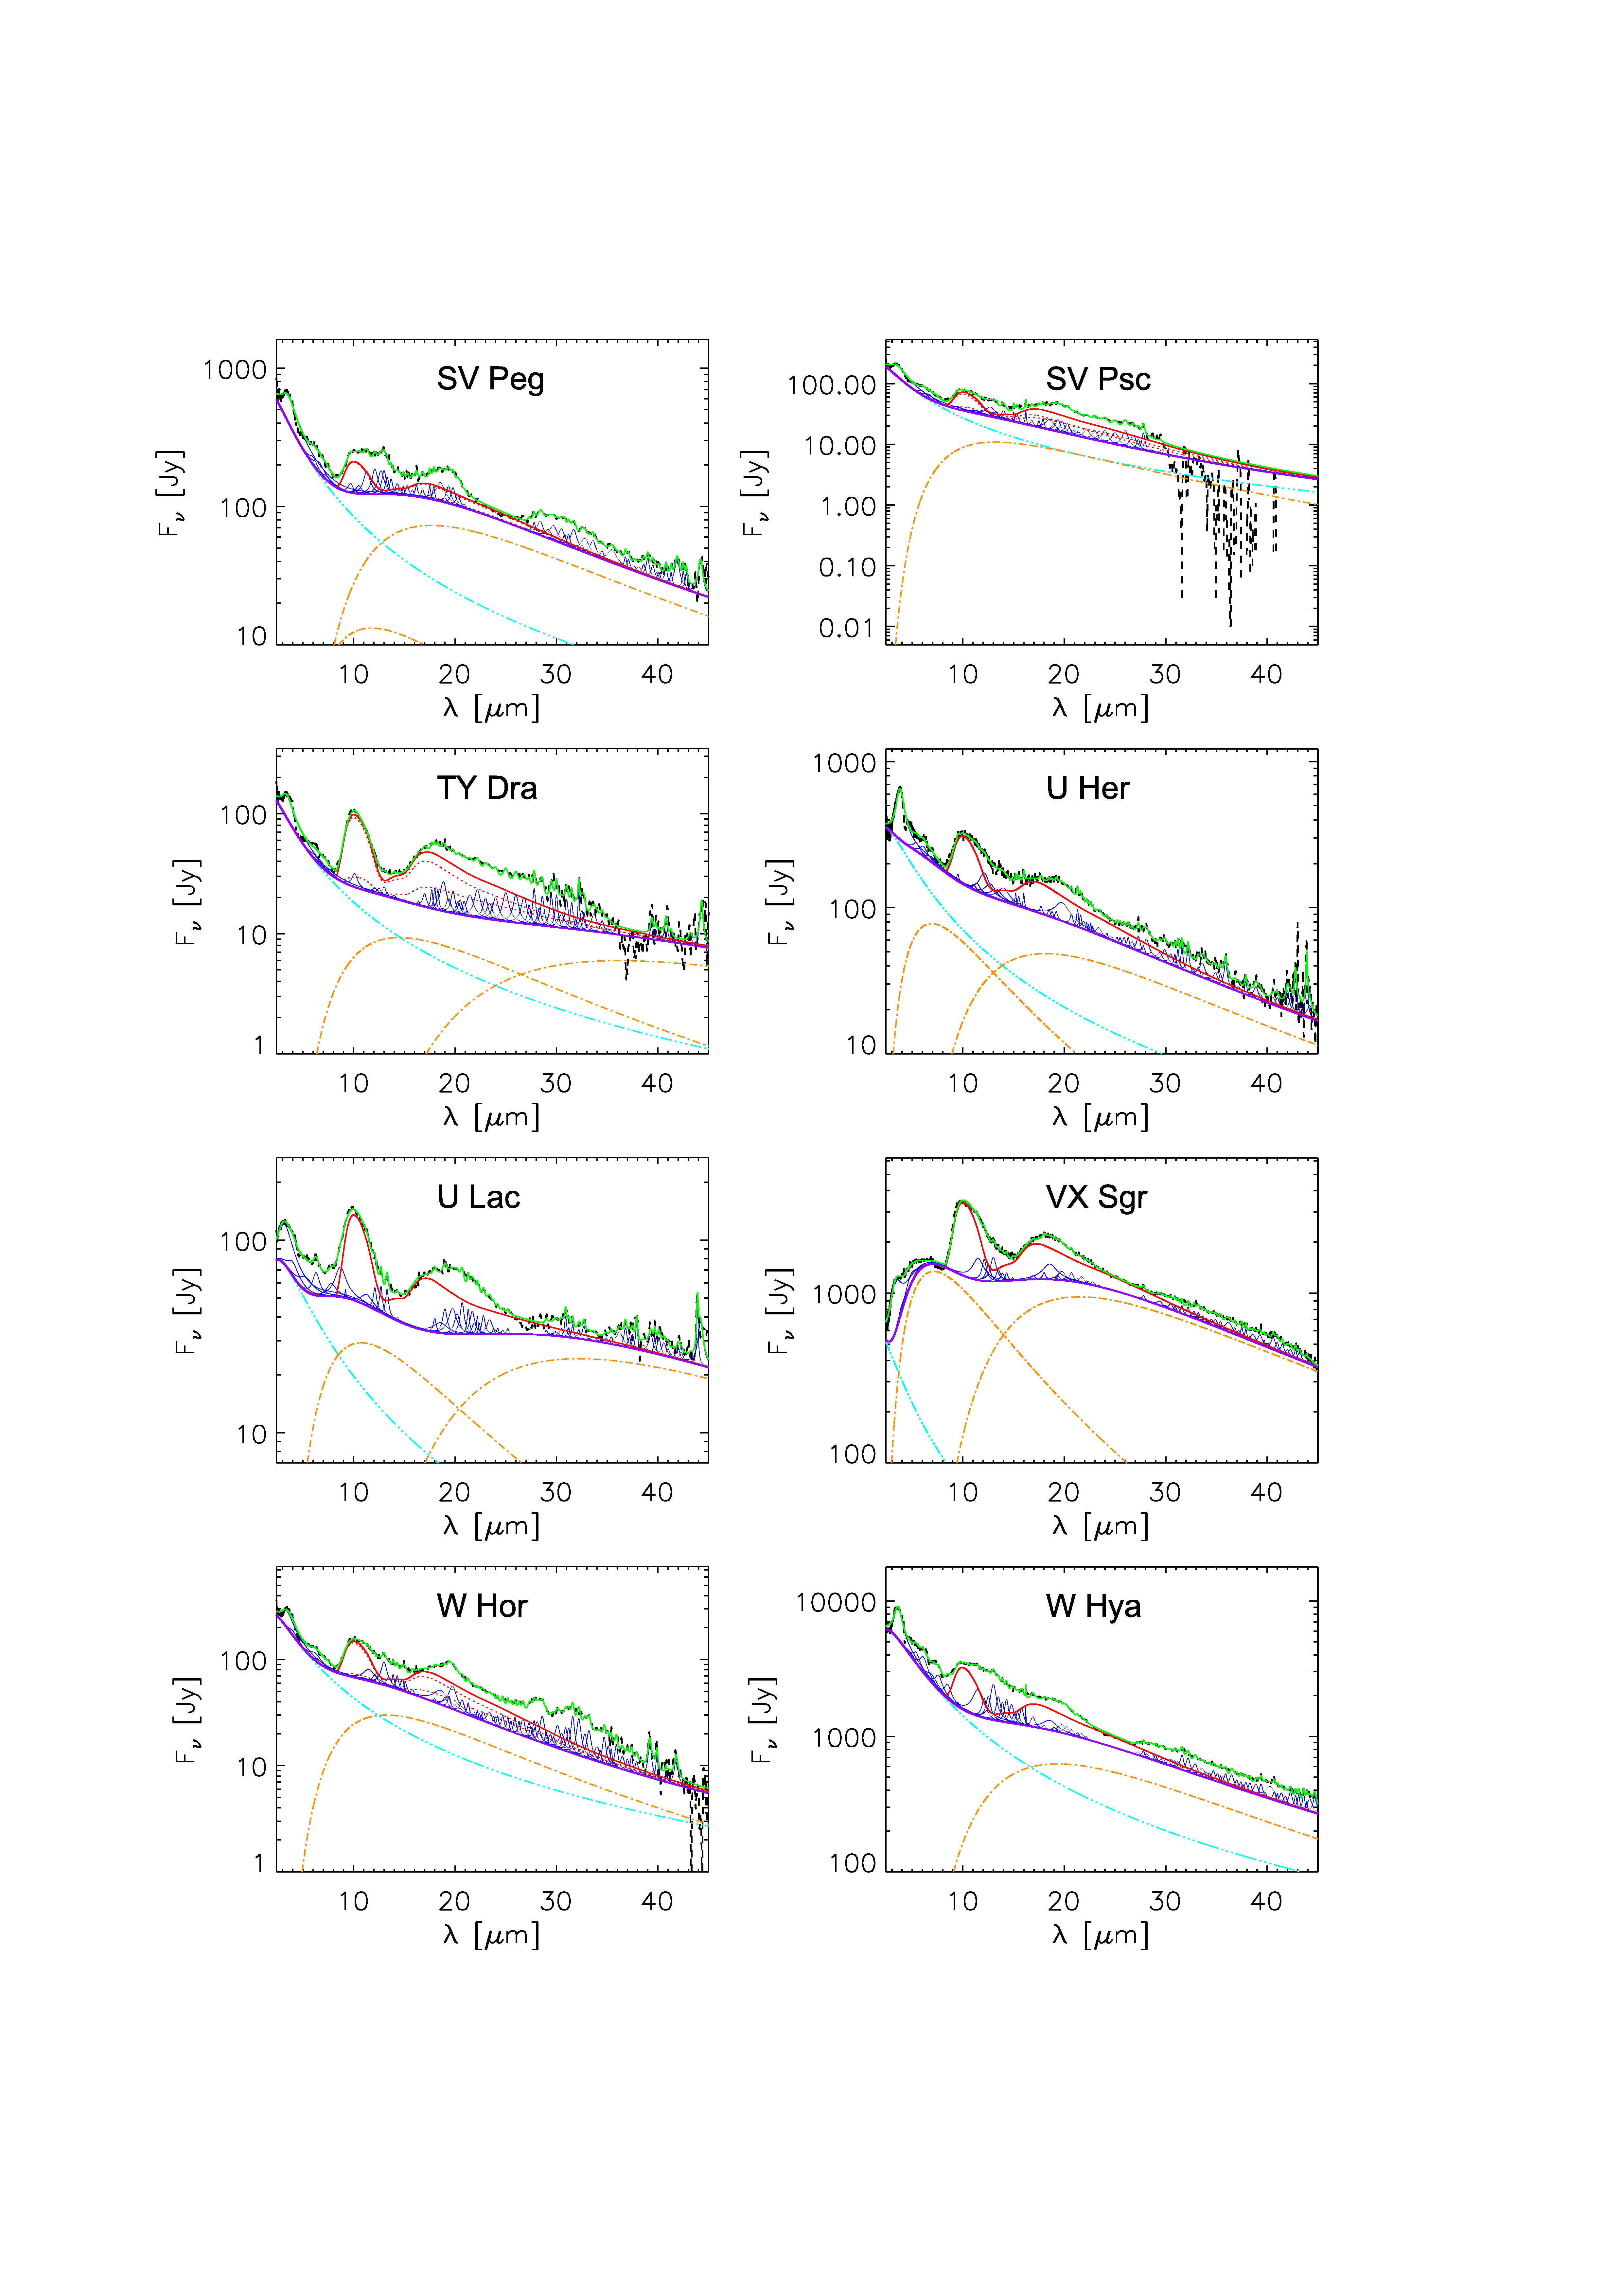
To avoid the temperature uncertainty, we take an alternative approach to characterize the silicate crystallinity: we propose to measure the degree of crystallinity, , as the ratio of the fluxes emitted in the crystalline silicate emission features to that in the amorphous silicate features. To this end, we decompose the 2.4–45 ISO/SWS spectrum of each source into four components: (i) a stellar continuum, (ii) a dust thermal emission continuum, (iii) two broad emission bands of amorphous silicates at 10 and 18, and (iv) a number of sharp emission features of crystalline silicates.
The decomposition is carried out with the PAHFIT software of Smith et al. (2007) which was originally developed for decomposing the polycyclic aromatic hydrocarbon (PAH) emission features.
We modify the PAHFIT code by considering (i) a Planck black-body of temperature 2,000–5,000 for the stellar continuum, (ii) a warm, modified black-body of 150–400 and a cold, modified black-body of 80–150 for the dust continuum, (iii) two opacity ()-based profiles for the 9.7 and 18 amorphous silicate emission features, and (iv) sharp Drude profiles for the crystalline silicate emission features with the -th Drude profile333Drude profiles are expected for classical damped harmonic oscillators (see Li 2009). They closely resemble Lorentzian profiles and are more extended than Gaussian profiles in the blue- and red-wing regions. peaking at wavelength and having a FWHM of :
where is the model flux density, , , , , and are constants, and is the central flux density of the -th Drude profile.
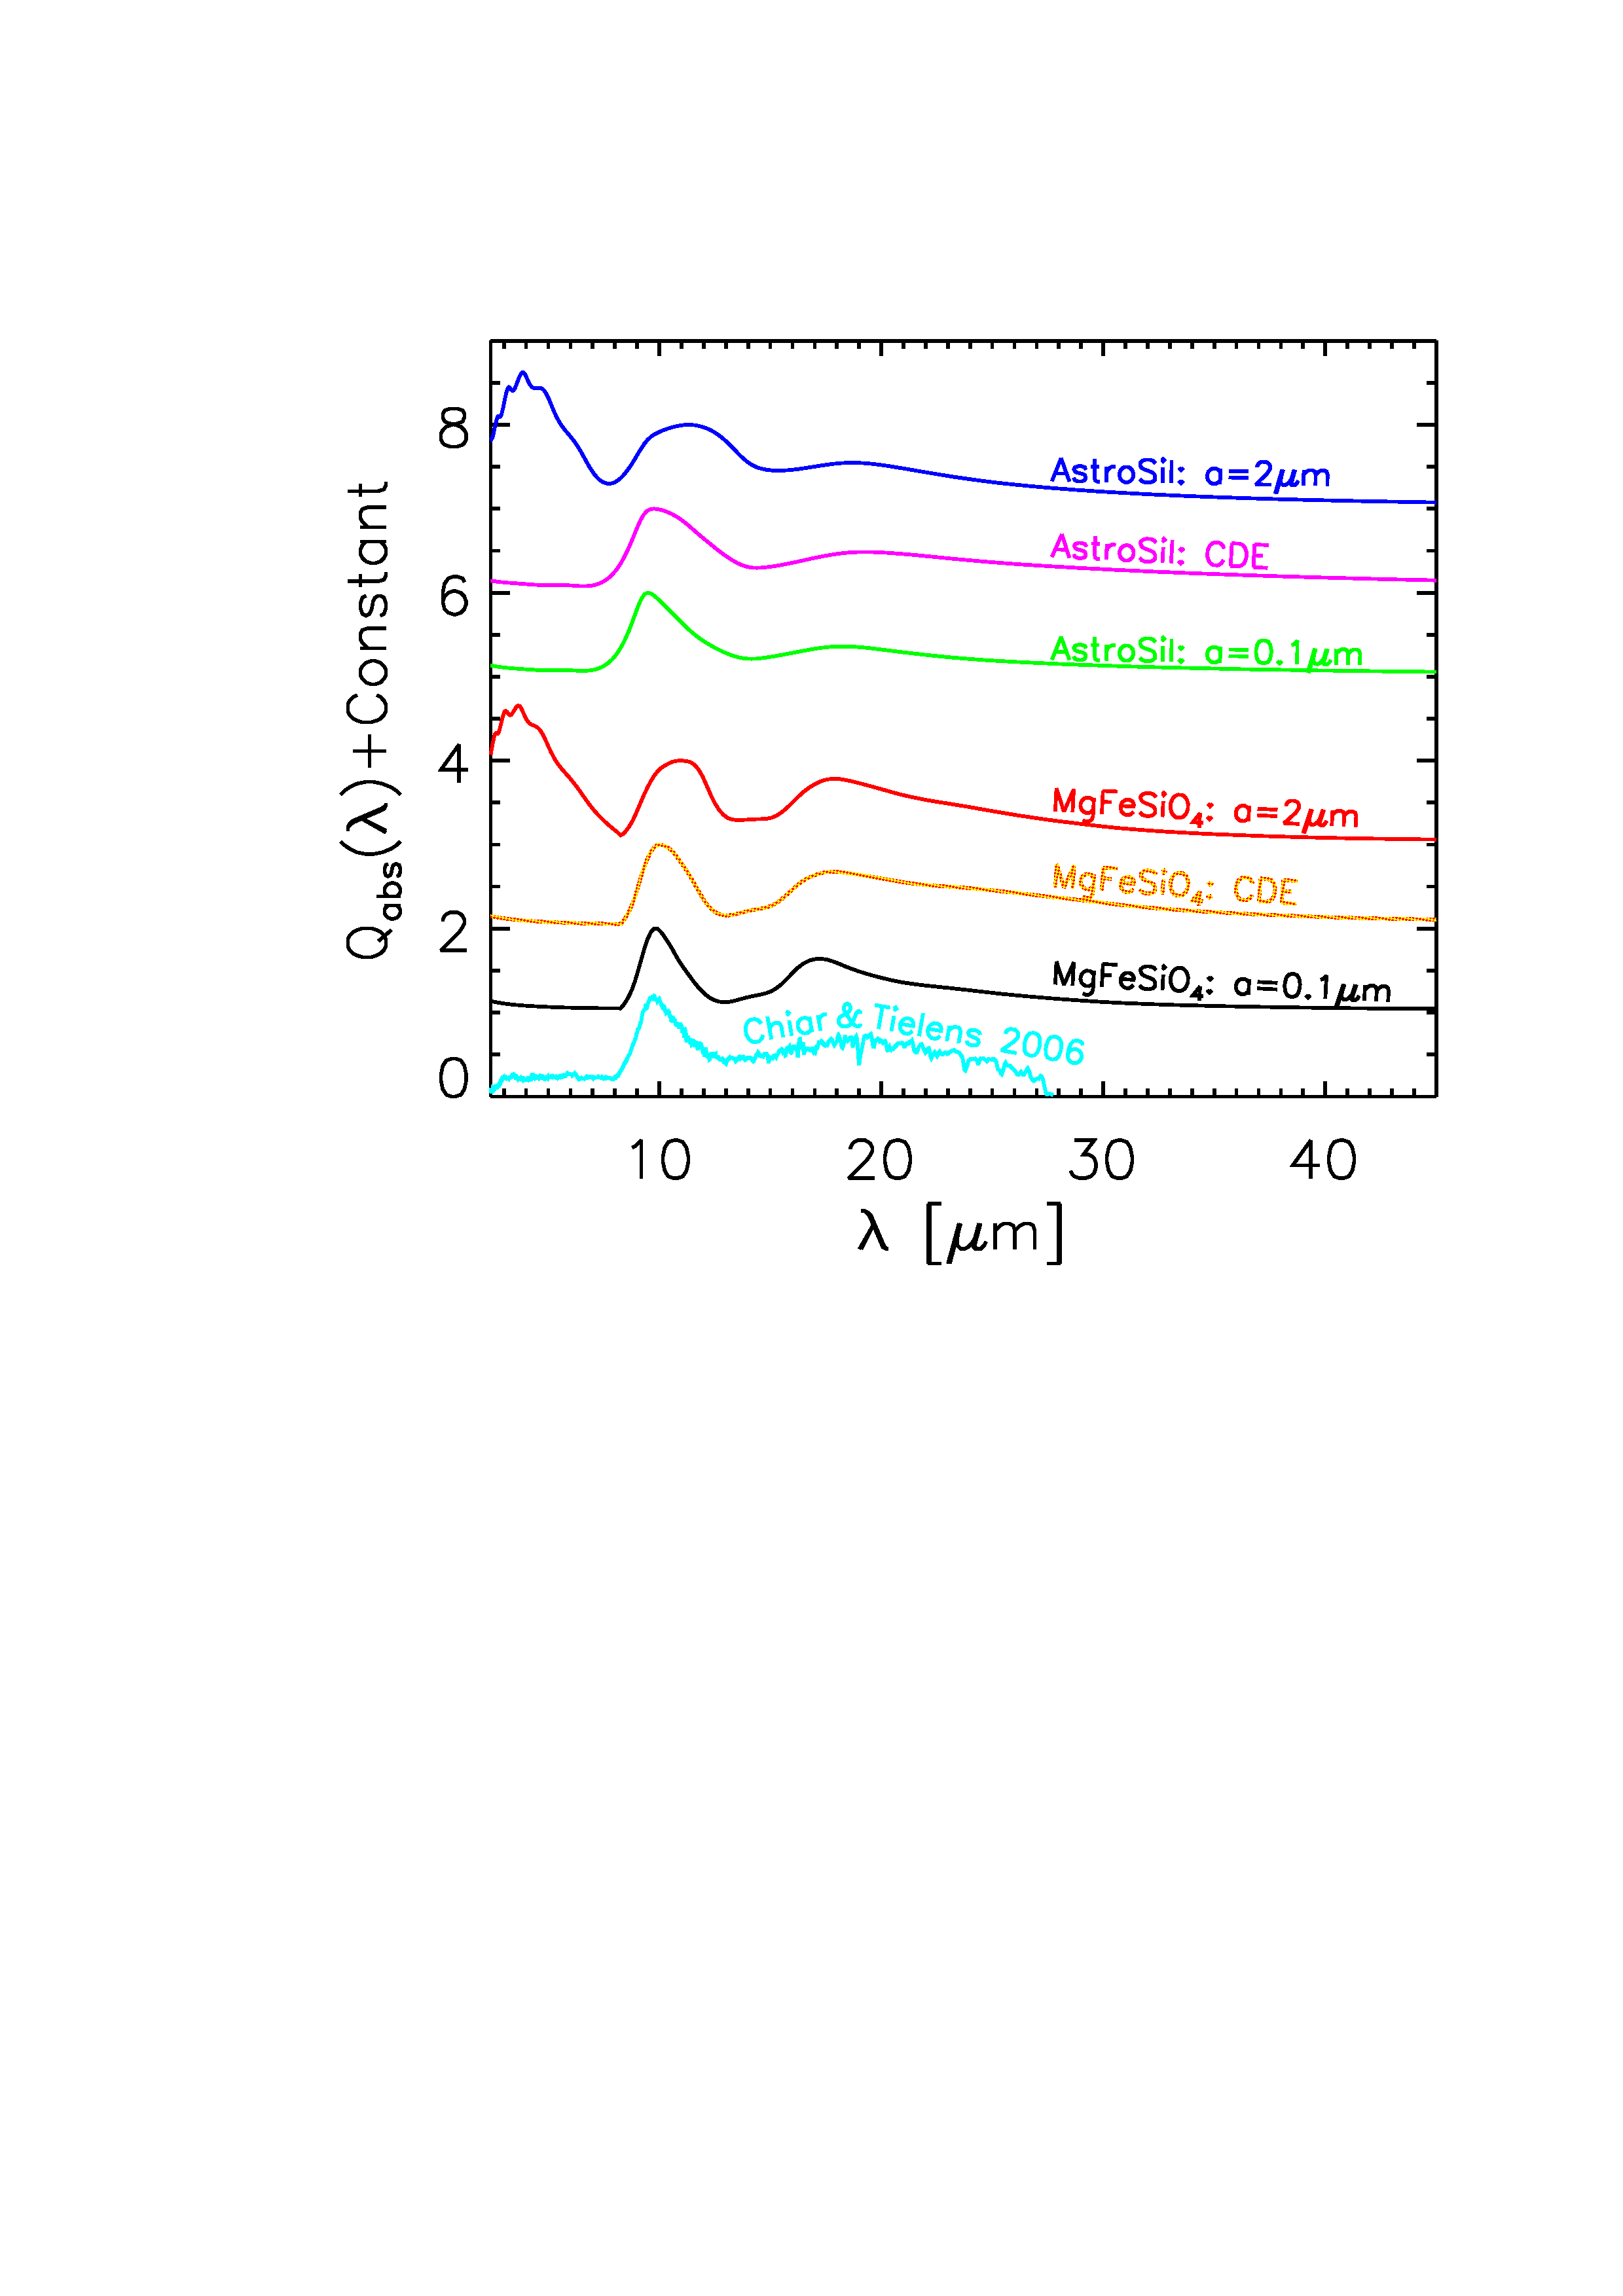
To approximate the 9.7 and 18 amorphous silicate emission features, we consider the following opacity profiles: (1) the absorption efficiency of spherical amorphous olivine MgFeSiO4 (Dorschner et al. 1995) of radii ; (2) the absorption efficiency of spherical amorphous olivine MgFeSiO4 (Dorschner et al. 1995) of radii ; (3) the absorption efficiency of amorphous olivine MgFeSiO4 (Dorschner et al. 1995) of shapes of continuous distributions of ellipsoids (CDE; Bohren & Huffman 1983); (4) the absorption efficiency of spherical “astronomical silicate” (Draine & Lee 1984) of radii ; (5) the absorption efficiency of spherical “astronomical silicate” (Draine & Lee 1984) of radii ; (6) the absorption efficiency of “astronomical silicate” (Draine & Lee 1984) of CDE shapes; and (7) the silicate absorption profile of the diffuse ISM sightline toward the WC-type Wolf-Rayet star WR 98a (Chiar & Tielens 2006). Here the absorption efficiency is related to the opacity through for spherical grains of radii and mass density of , where is calculated from Mie theory (Bohren & Huffman 1983) using the refractive indices of amorphous olivine measured by Dorschner et al. (1995) or “astronomical silicate” synthesized by Draine & Lee (1984). In Figure 5 we compare the absorption profiles of these seven types of amorphous silicates. Most appreciably, both the 9.7 and 18 silicate features become substantially wider as the dust size increases from to . For the same size, the 9.7 and 18 features of amorphous olivine MgFeSiO4 are narrower than that of “astronomical silicate”. The 9.7 and 18 features of silicate grains of CDE shapes are intermediate between that of and that of . We find that the one calculated from amorphous olivine MgFeSiO4 of CDE shapes best fit the ISO/SWS spectra. In the following, we will adopt the opacity profile of amorphous olivine MgFeSiO4 of CDE shapes. In Figures 6–9 we show the modeled silicate emission spectra for our 28 sample stars. The results for the peak wavelengths, FWHMs, and emitted fluxes of the decomposed silicate emission features are listed in Tables 6–14.
To make sure that we have picked out all the features of crystalline silicates and these features were not contaminated by molecular lines and spectral features of other dust species, such as aluminum oxide, magnesium-iron oxide, metallic iron, and melilite which could be present in the circumstellar envelopes of oxygen-rich evolved stars (e.g., see Lorentz & Pompeia 2000, Fabian et al. 2001, Posch et al. 1999, 2002, Sloan et al. 2003, Heras & Hony 2005, Verholest et al. 2009, de Vries et al. 2010, Zeidler et al. 2013, Nowotny et al. 2015), we consult the crystalline silicate features compiled by Molster et al. (2002b). In Table 15 we compare the wavelength and FWHM ranges derived in this work with that of Molster et al. (2002b) and it is found that they are generally consistent. The possible effects on the relation between the silicate crystallinity and caused by the “contamination” of amorphous Al2O3, MgxFe(1-x)O () and spinel (MgAl2O4) will be discussed in §4.
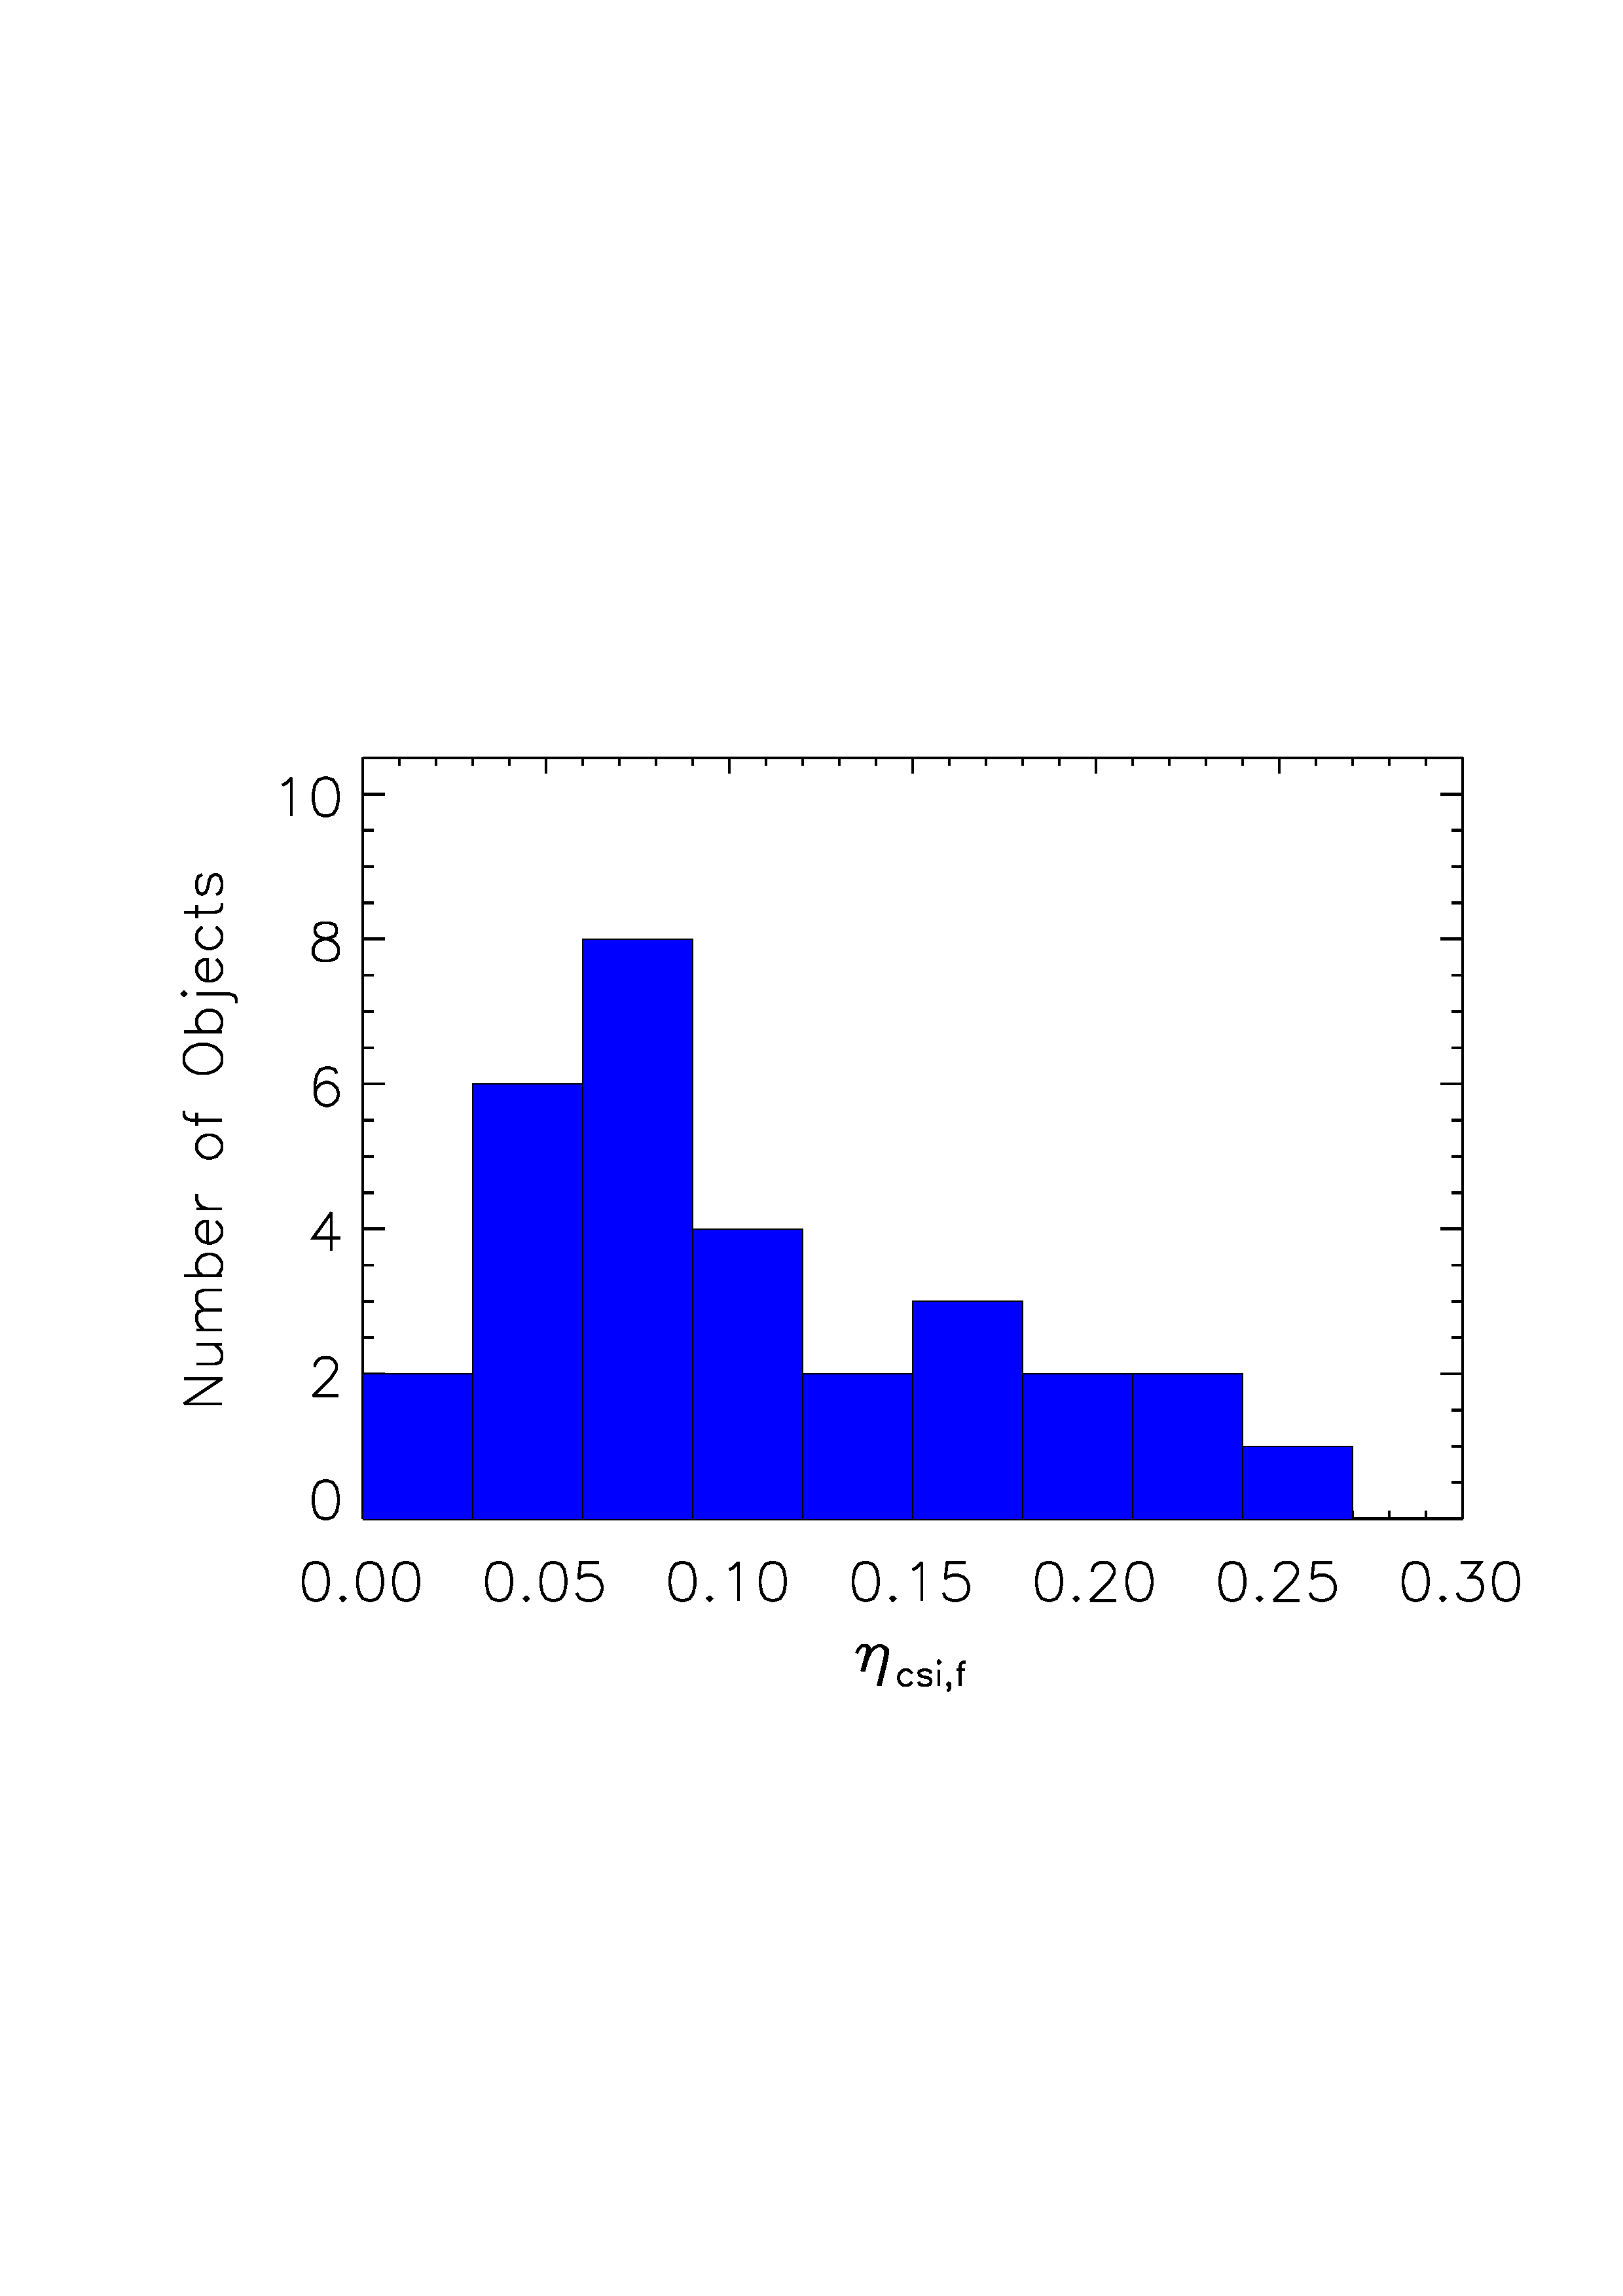
Let be the wavelength-integrated fluxes of the 10 and 18 amorphous silicate emission features, be the sum of the wavelength-integrated fluxes of all of the crystalline silicate emission features, and be the wavelength-integrated flux of the dust continuum.444In determining , we exclude the 2.4–8 wavelength range as the continuum emission in this wavelength range is likely due to iron grains, not silicates (see Kemper et al. 2002). If we assume that the dust continuum is predominantly emitted by amorphous silicates, we define the flux-based silicate crystallinity to be . In Table 2 we tabulate the derived for each source. In Figure 10 we show the silicate crystallinity () histrogram. For the majority of our sources, .
We note that the flux-based silicate crystallinity may differ from the mass-based crystallinity . If the amorphous silicate dust component is richer in its iron content than the crystalline silicate component and if both components have more or less the same spatial distribution, we expect since the iron-richer amorphous silicate component is more absorptive in the UV/visual/near-IR wavelength range and by implication, would emit more energy in the IR on a per unit mass basis.
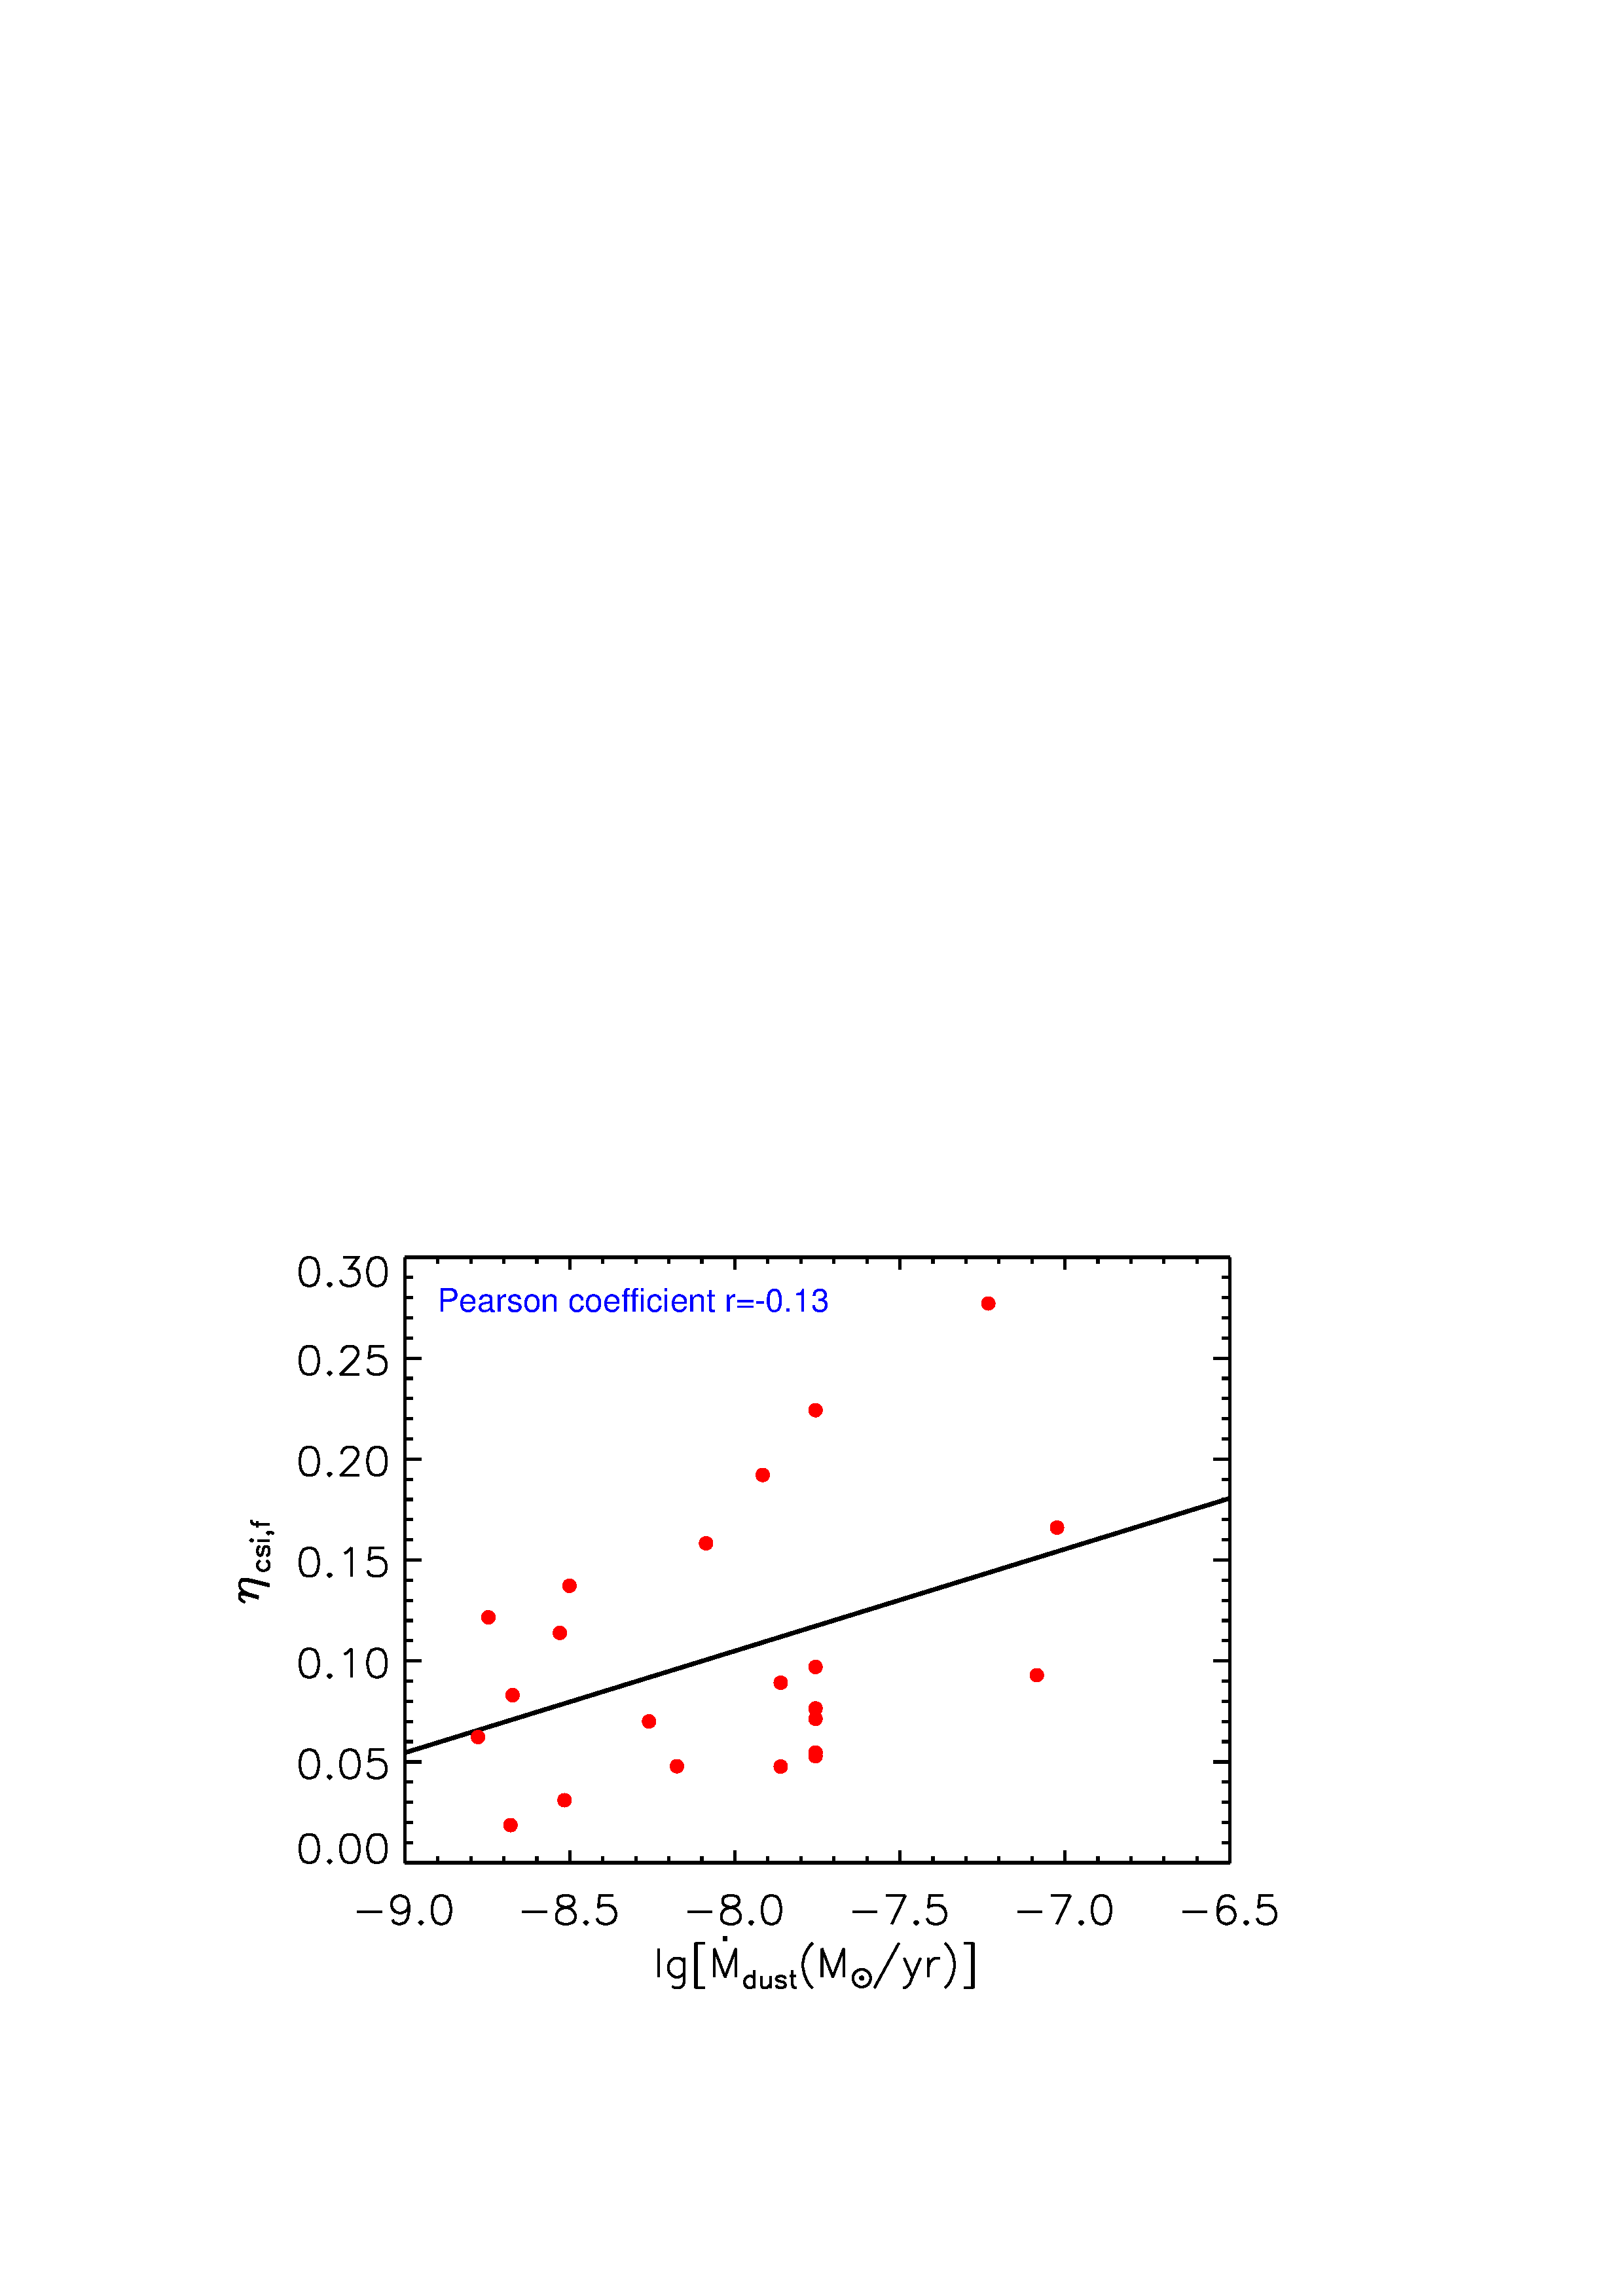
4 Crystallinities versus : Results and Discussion
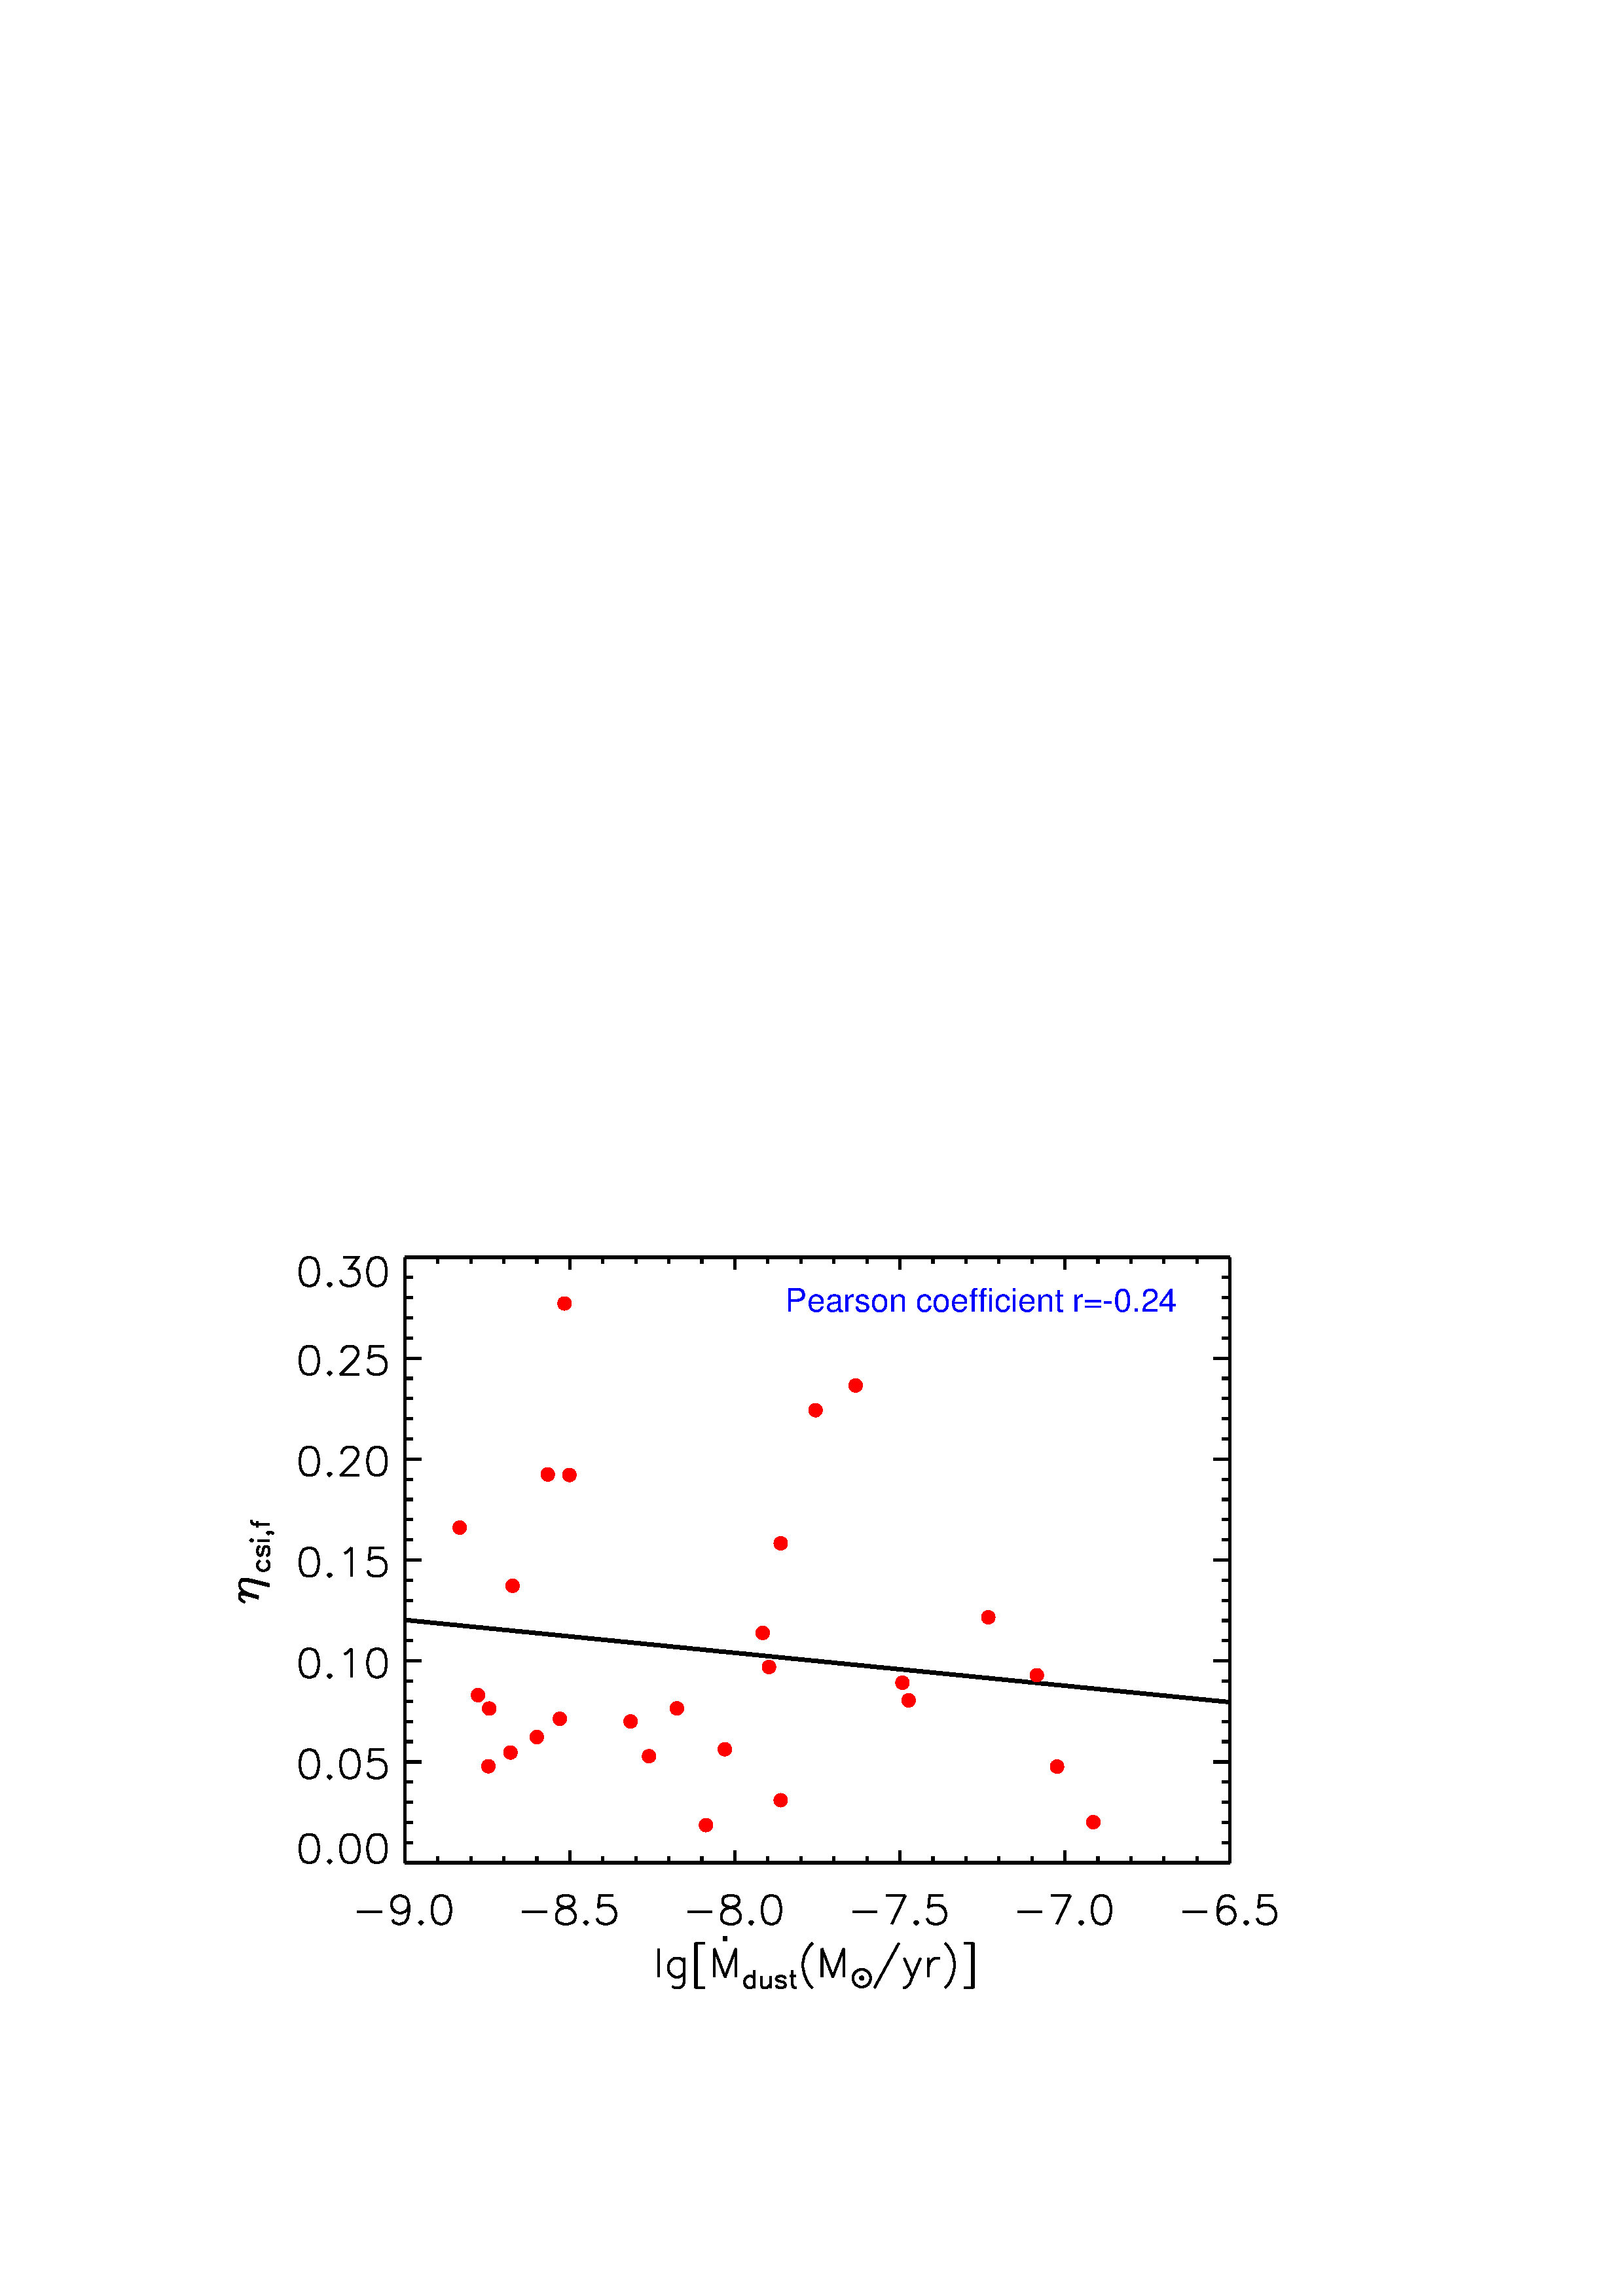
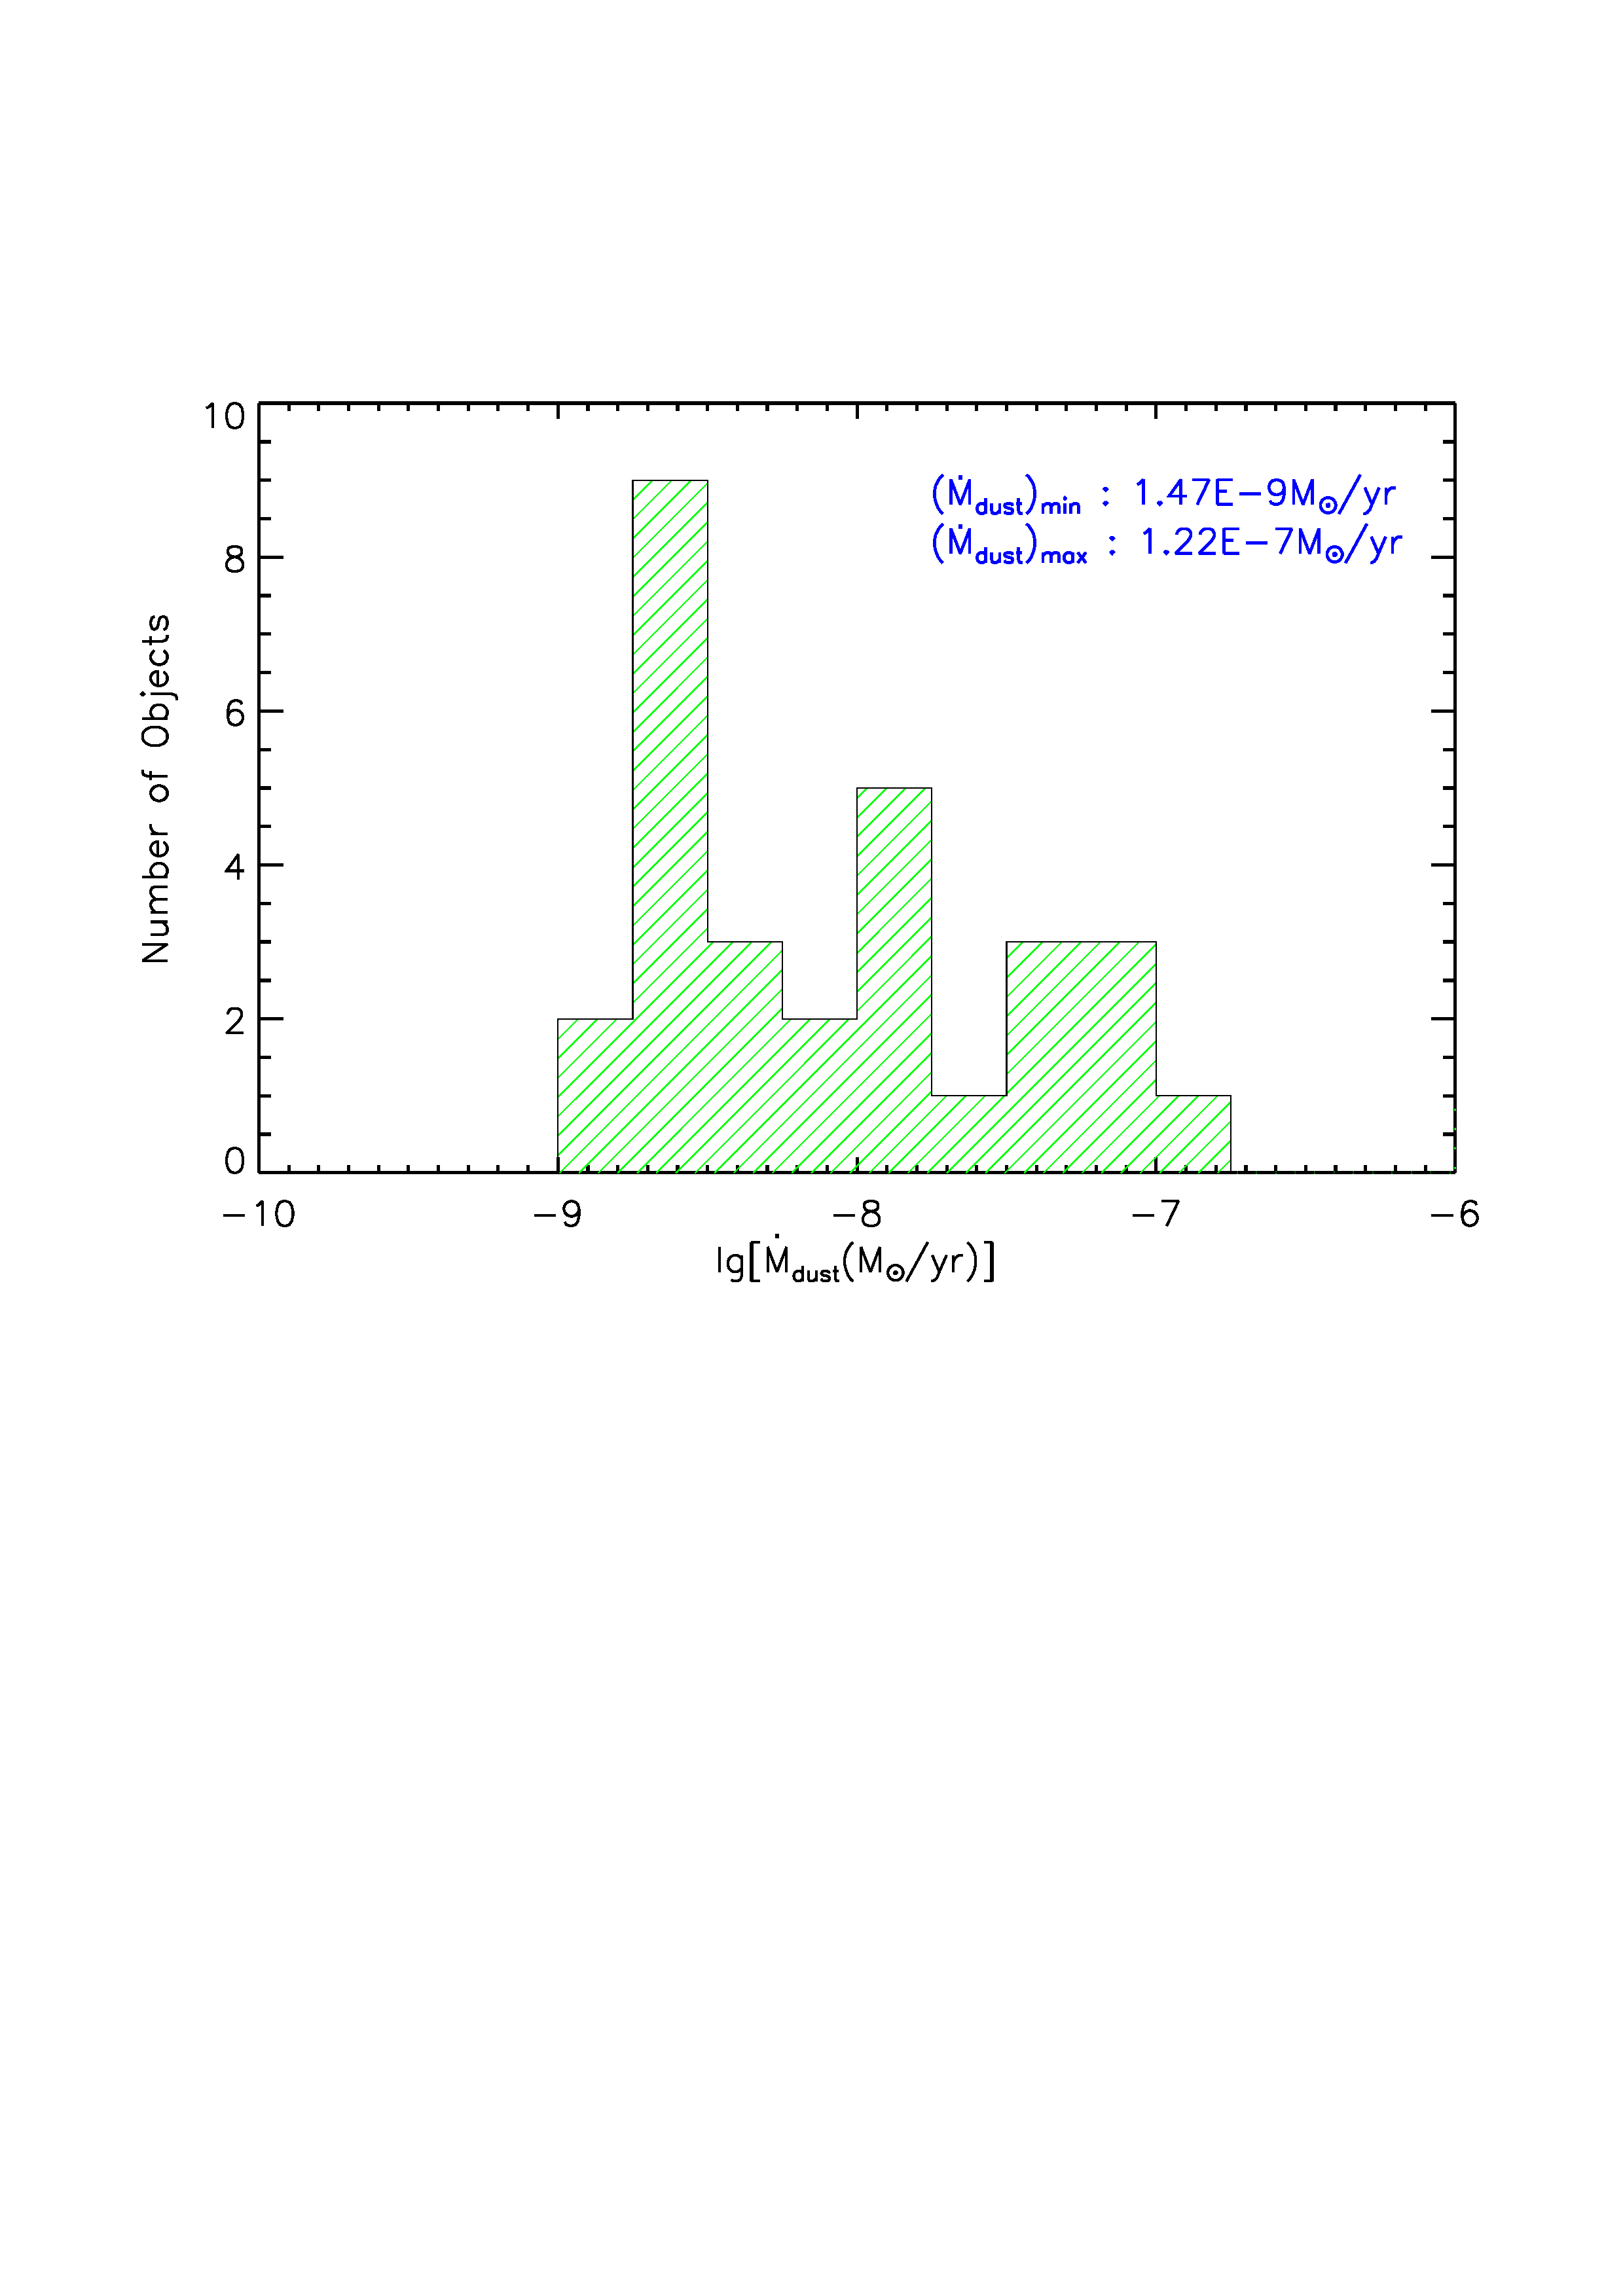
With the dust mass loss rate (see §2.1) and the silicate crystallinity (see §3) calculated for each source, we now explore whether and are correlated. As illustrated in Figure 11, with a Pearson correlation coefficient of , and are apparently not correlated. This supports the proposition of Kemper et al. (2001) but contradicts the earlier findings that the detections of crystalline silicate emission features in evolved stars appear to be restricted to objects with which corresponds to for (e.g., see Molster et al. 2002a,b,c). 555Jones et al. (2012) reported the detection of crystalline silicate emission features in stars with mass loss rates as low as . We note that they derived from fitting the observed SEDs with a large number of template SEDs created by the “Grid of Red supergiant and Asymptotic giant branch Models” (GRAMS, Sargent et al. 2011). The GRAMS model was designed to fit the SED from the optical to the mid-IR, with the Spitzer/MIPS 24 band being the longest wavelength. One would expect the GRAMS model to underestimate the actual dust mass loss rates since a substantial quantity of dust would emit in the far-IR at 60–100. However, Jones et al. (2015) found that AGB stars do not produce a significant quantity of dust in the far-IR, so using the models optimized for the mid-IR will not significantly affect the measured dust production rate. In Figure 12 we plot the histogram of the dust mass loss rates of our sample. It is seen that the dust mass loss rates of our sample are distributed over 2 dex ranging from to , with 50% of the stars having . There appears to exist a tendency that the number of stars decrease as the dust mass loss rate increases. Whether this is a real tendency of evolved stars that possess crystalline silicates, or a result of sample capacity, remains to be discussed.
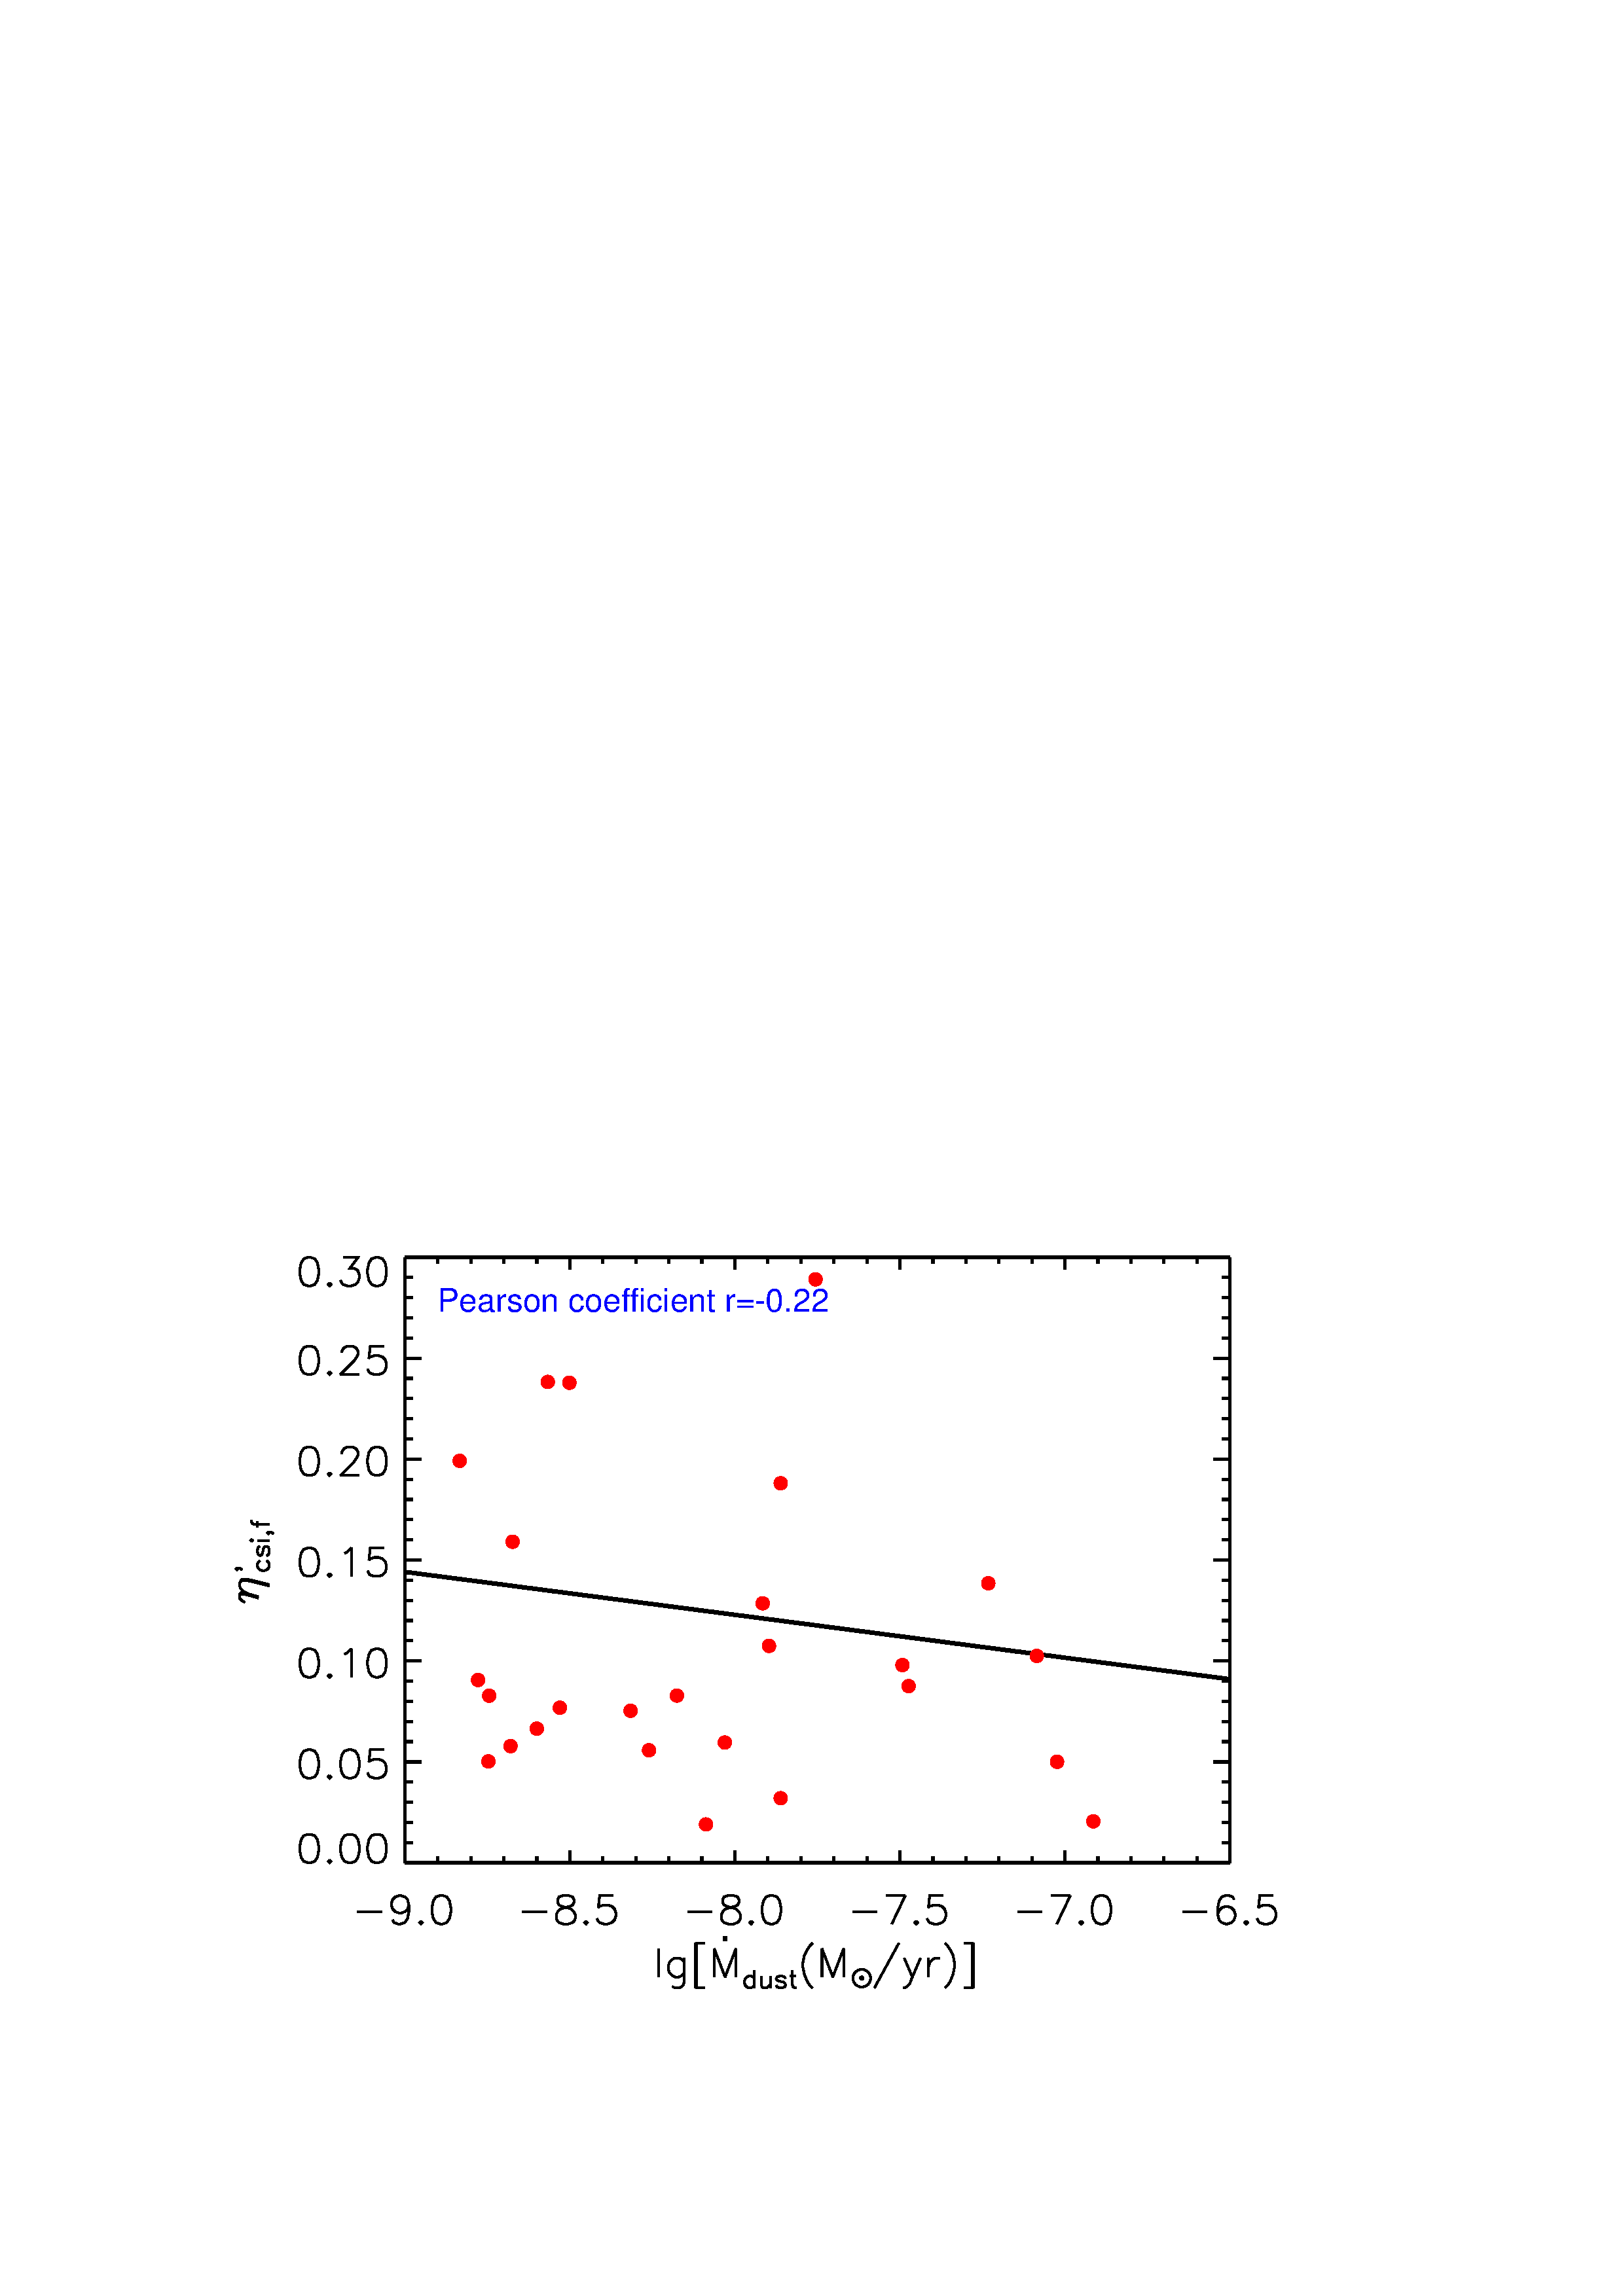
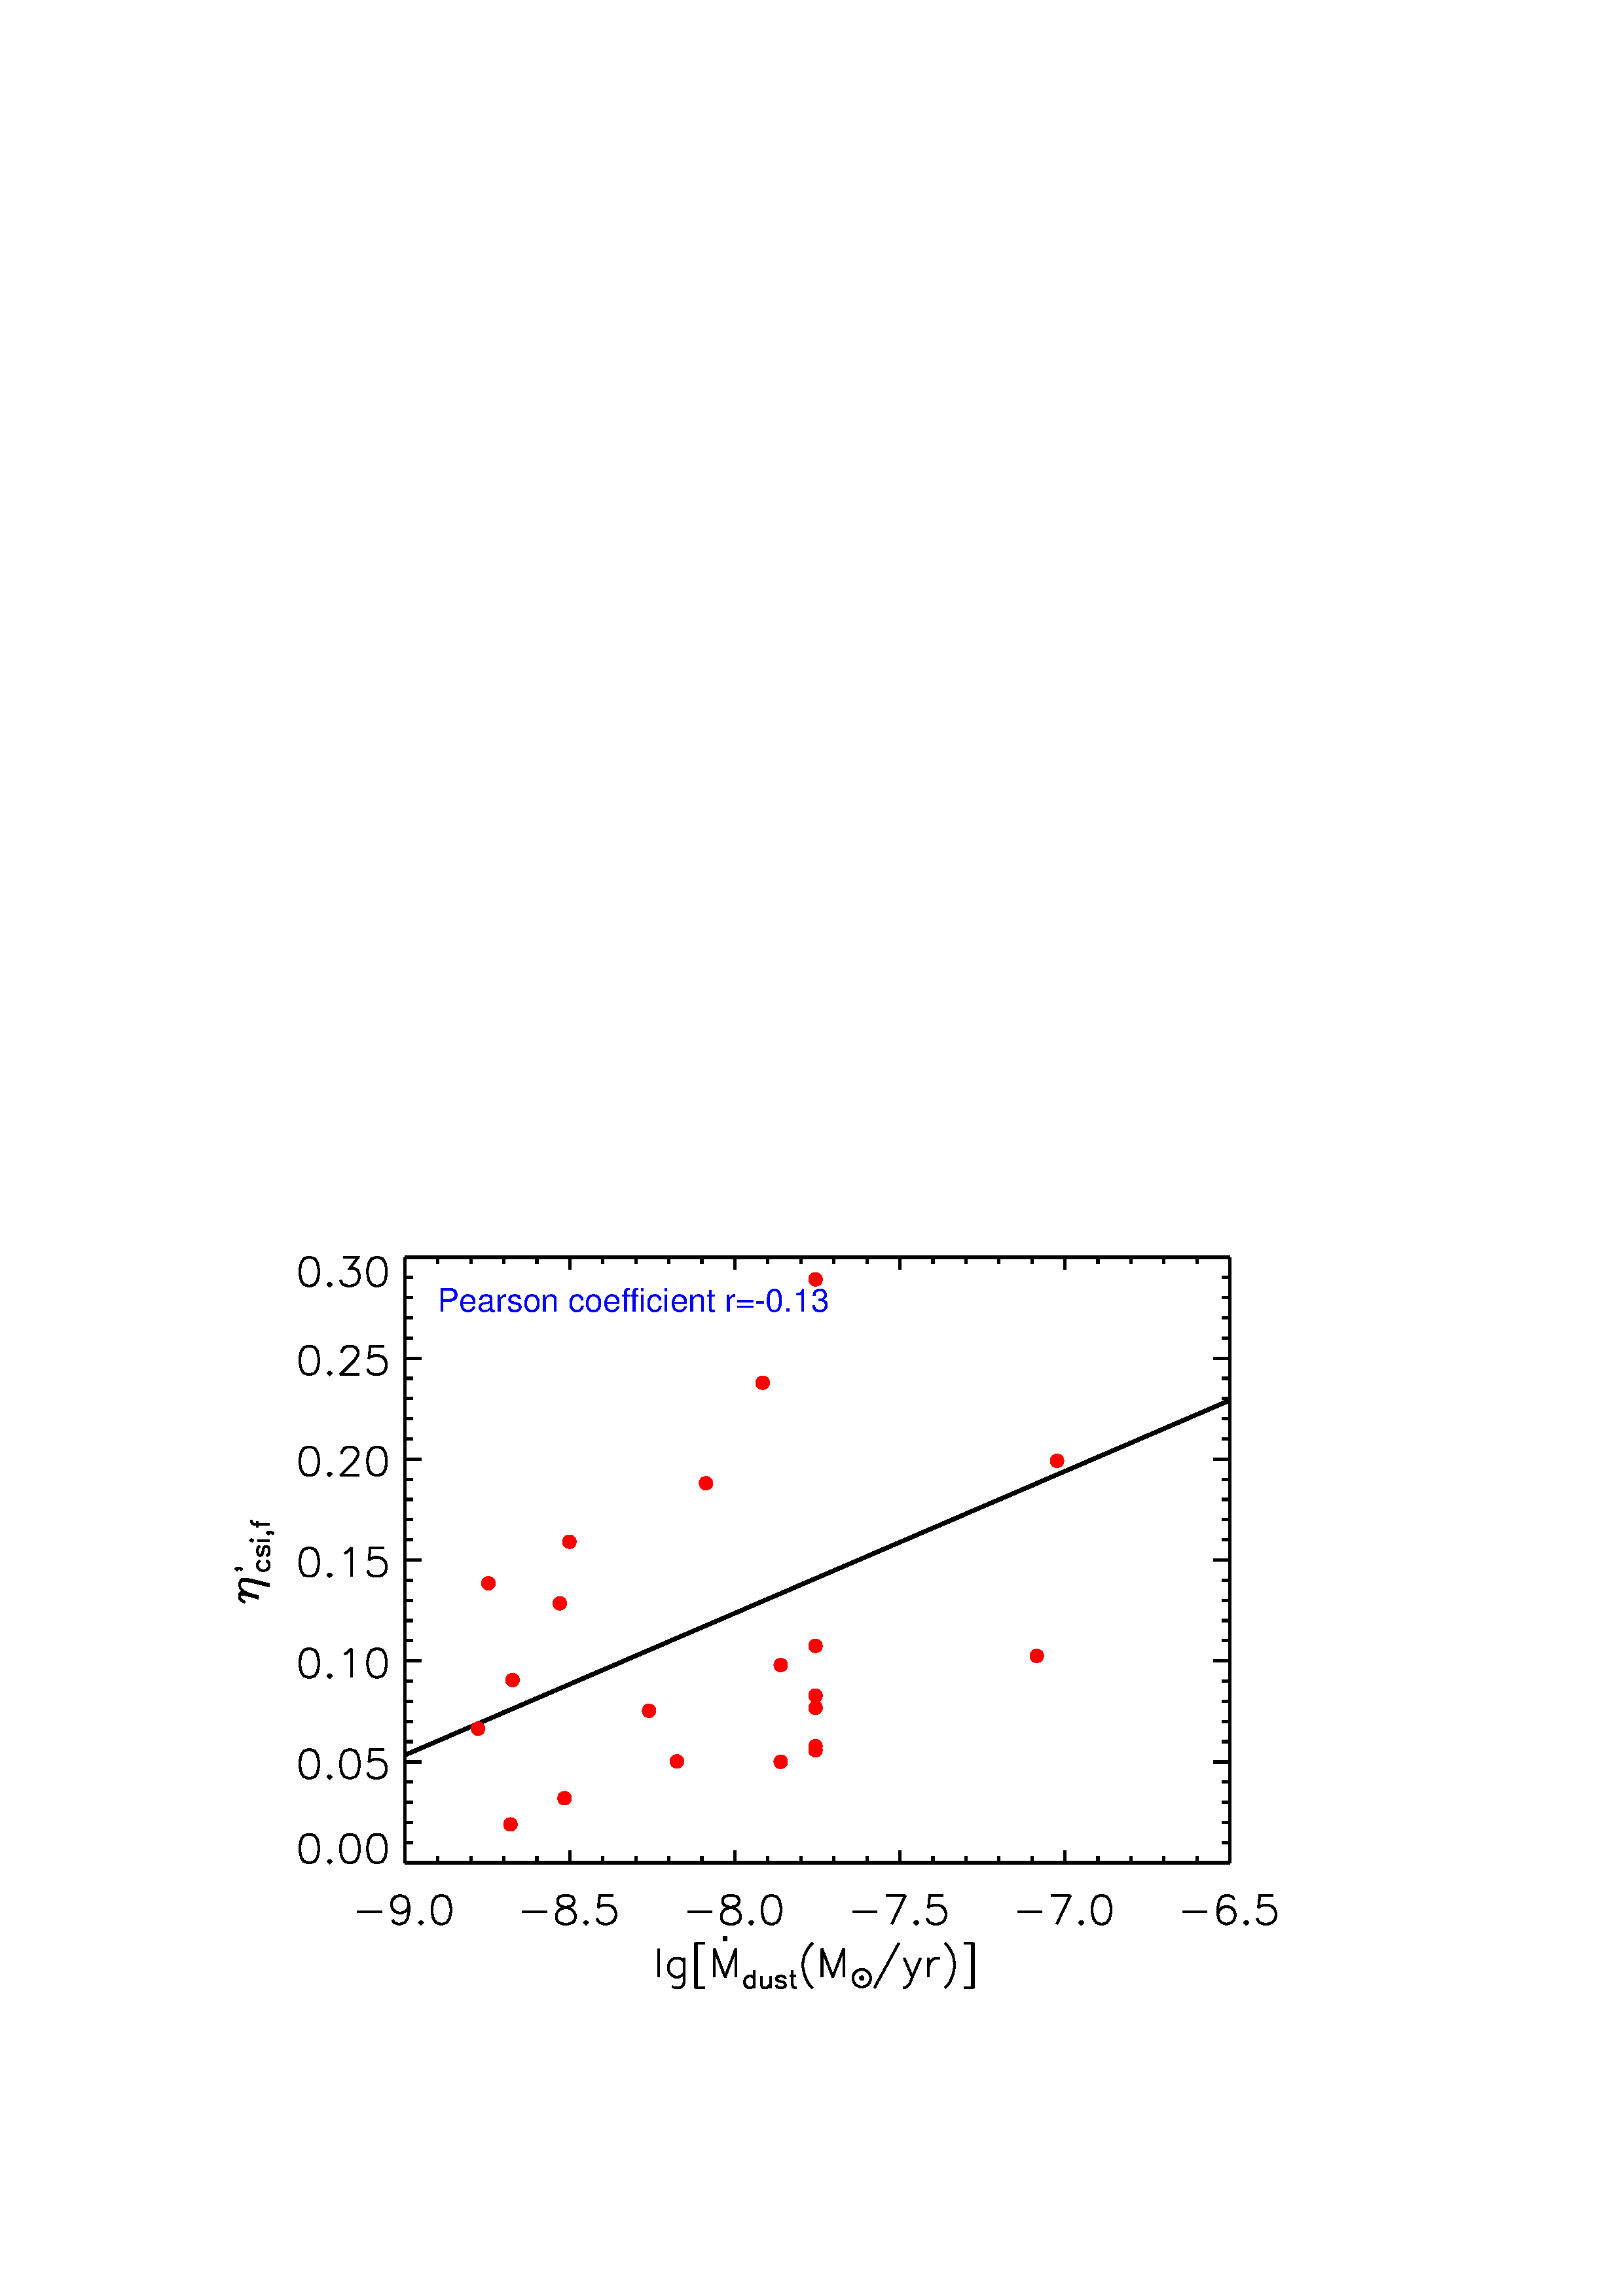
So far we have assumed that the dust thermal continuum emission is predominantly attributed to amorphous silicates. To relax this assumption, we also define the silicate crystallinity to be which only compares the fluxes emitted in the spectral features. The derived ratio is also tabulated in Table 2. Figure 13 shows that does not correlate with .
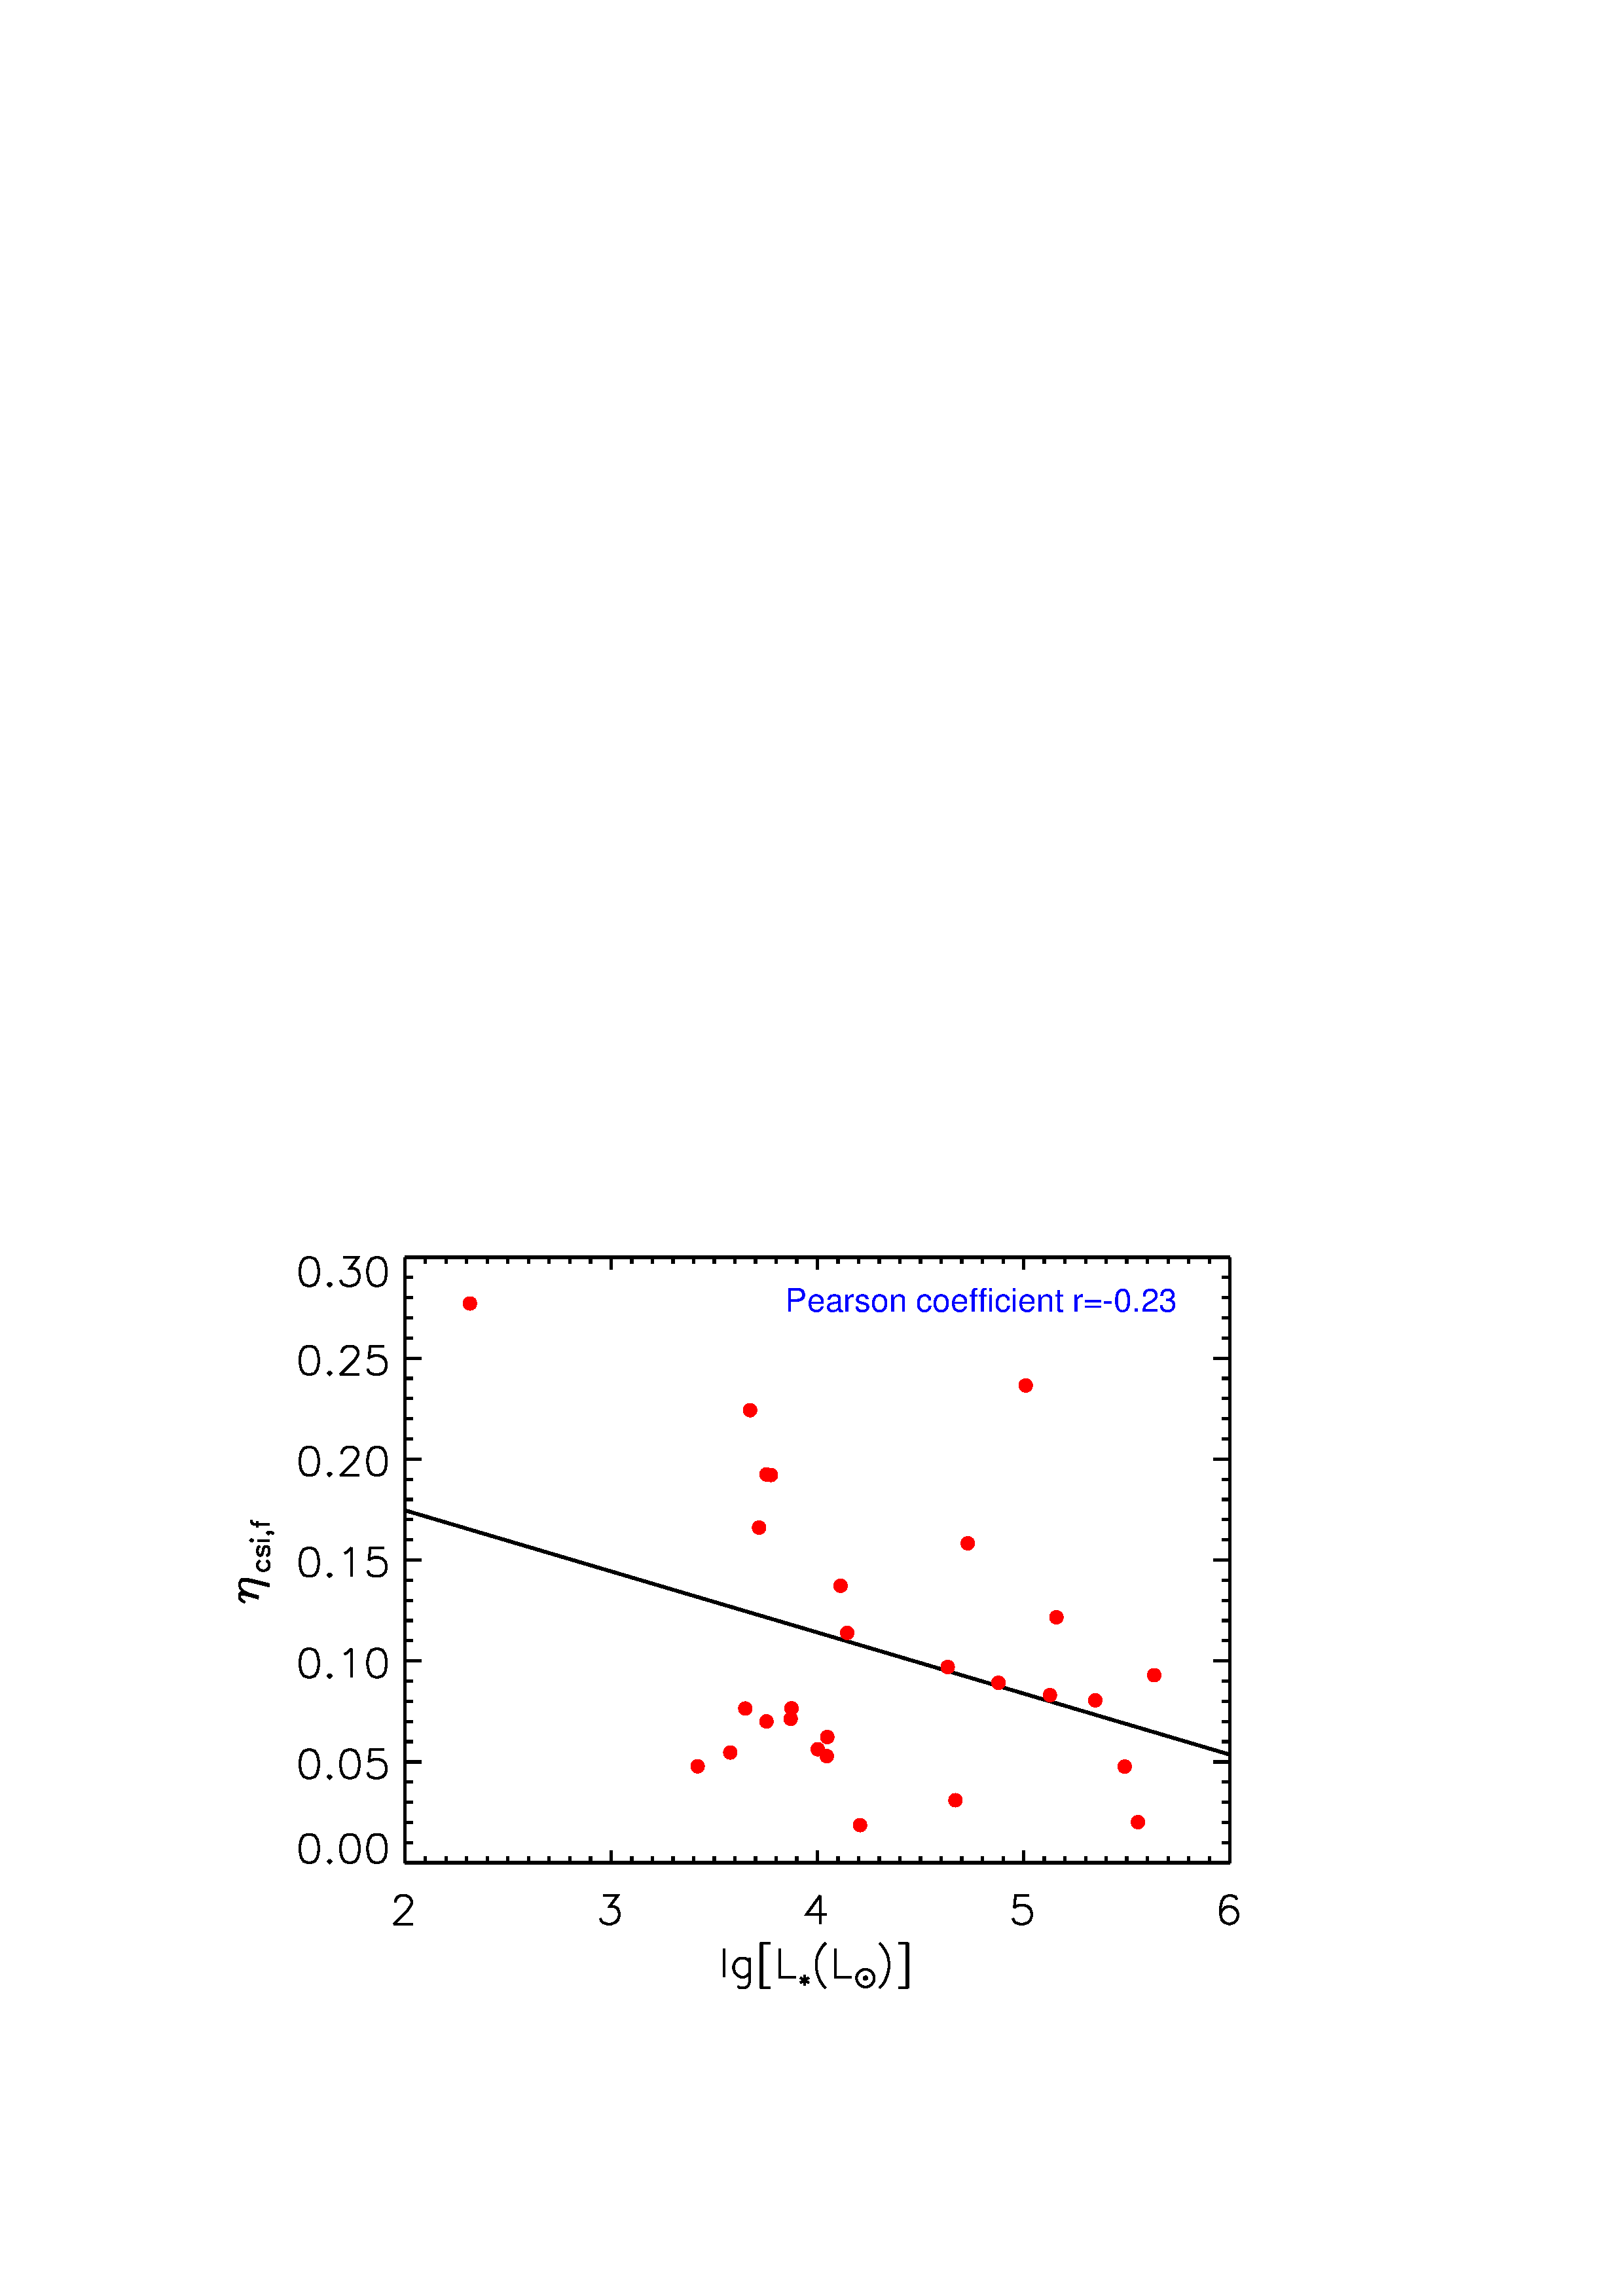
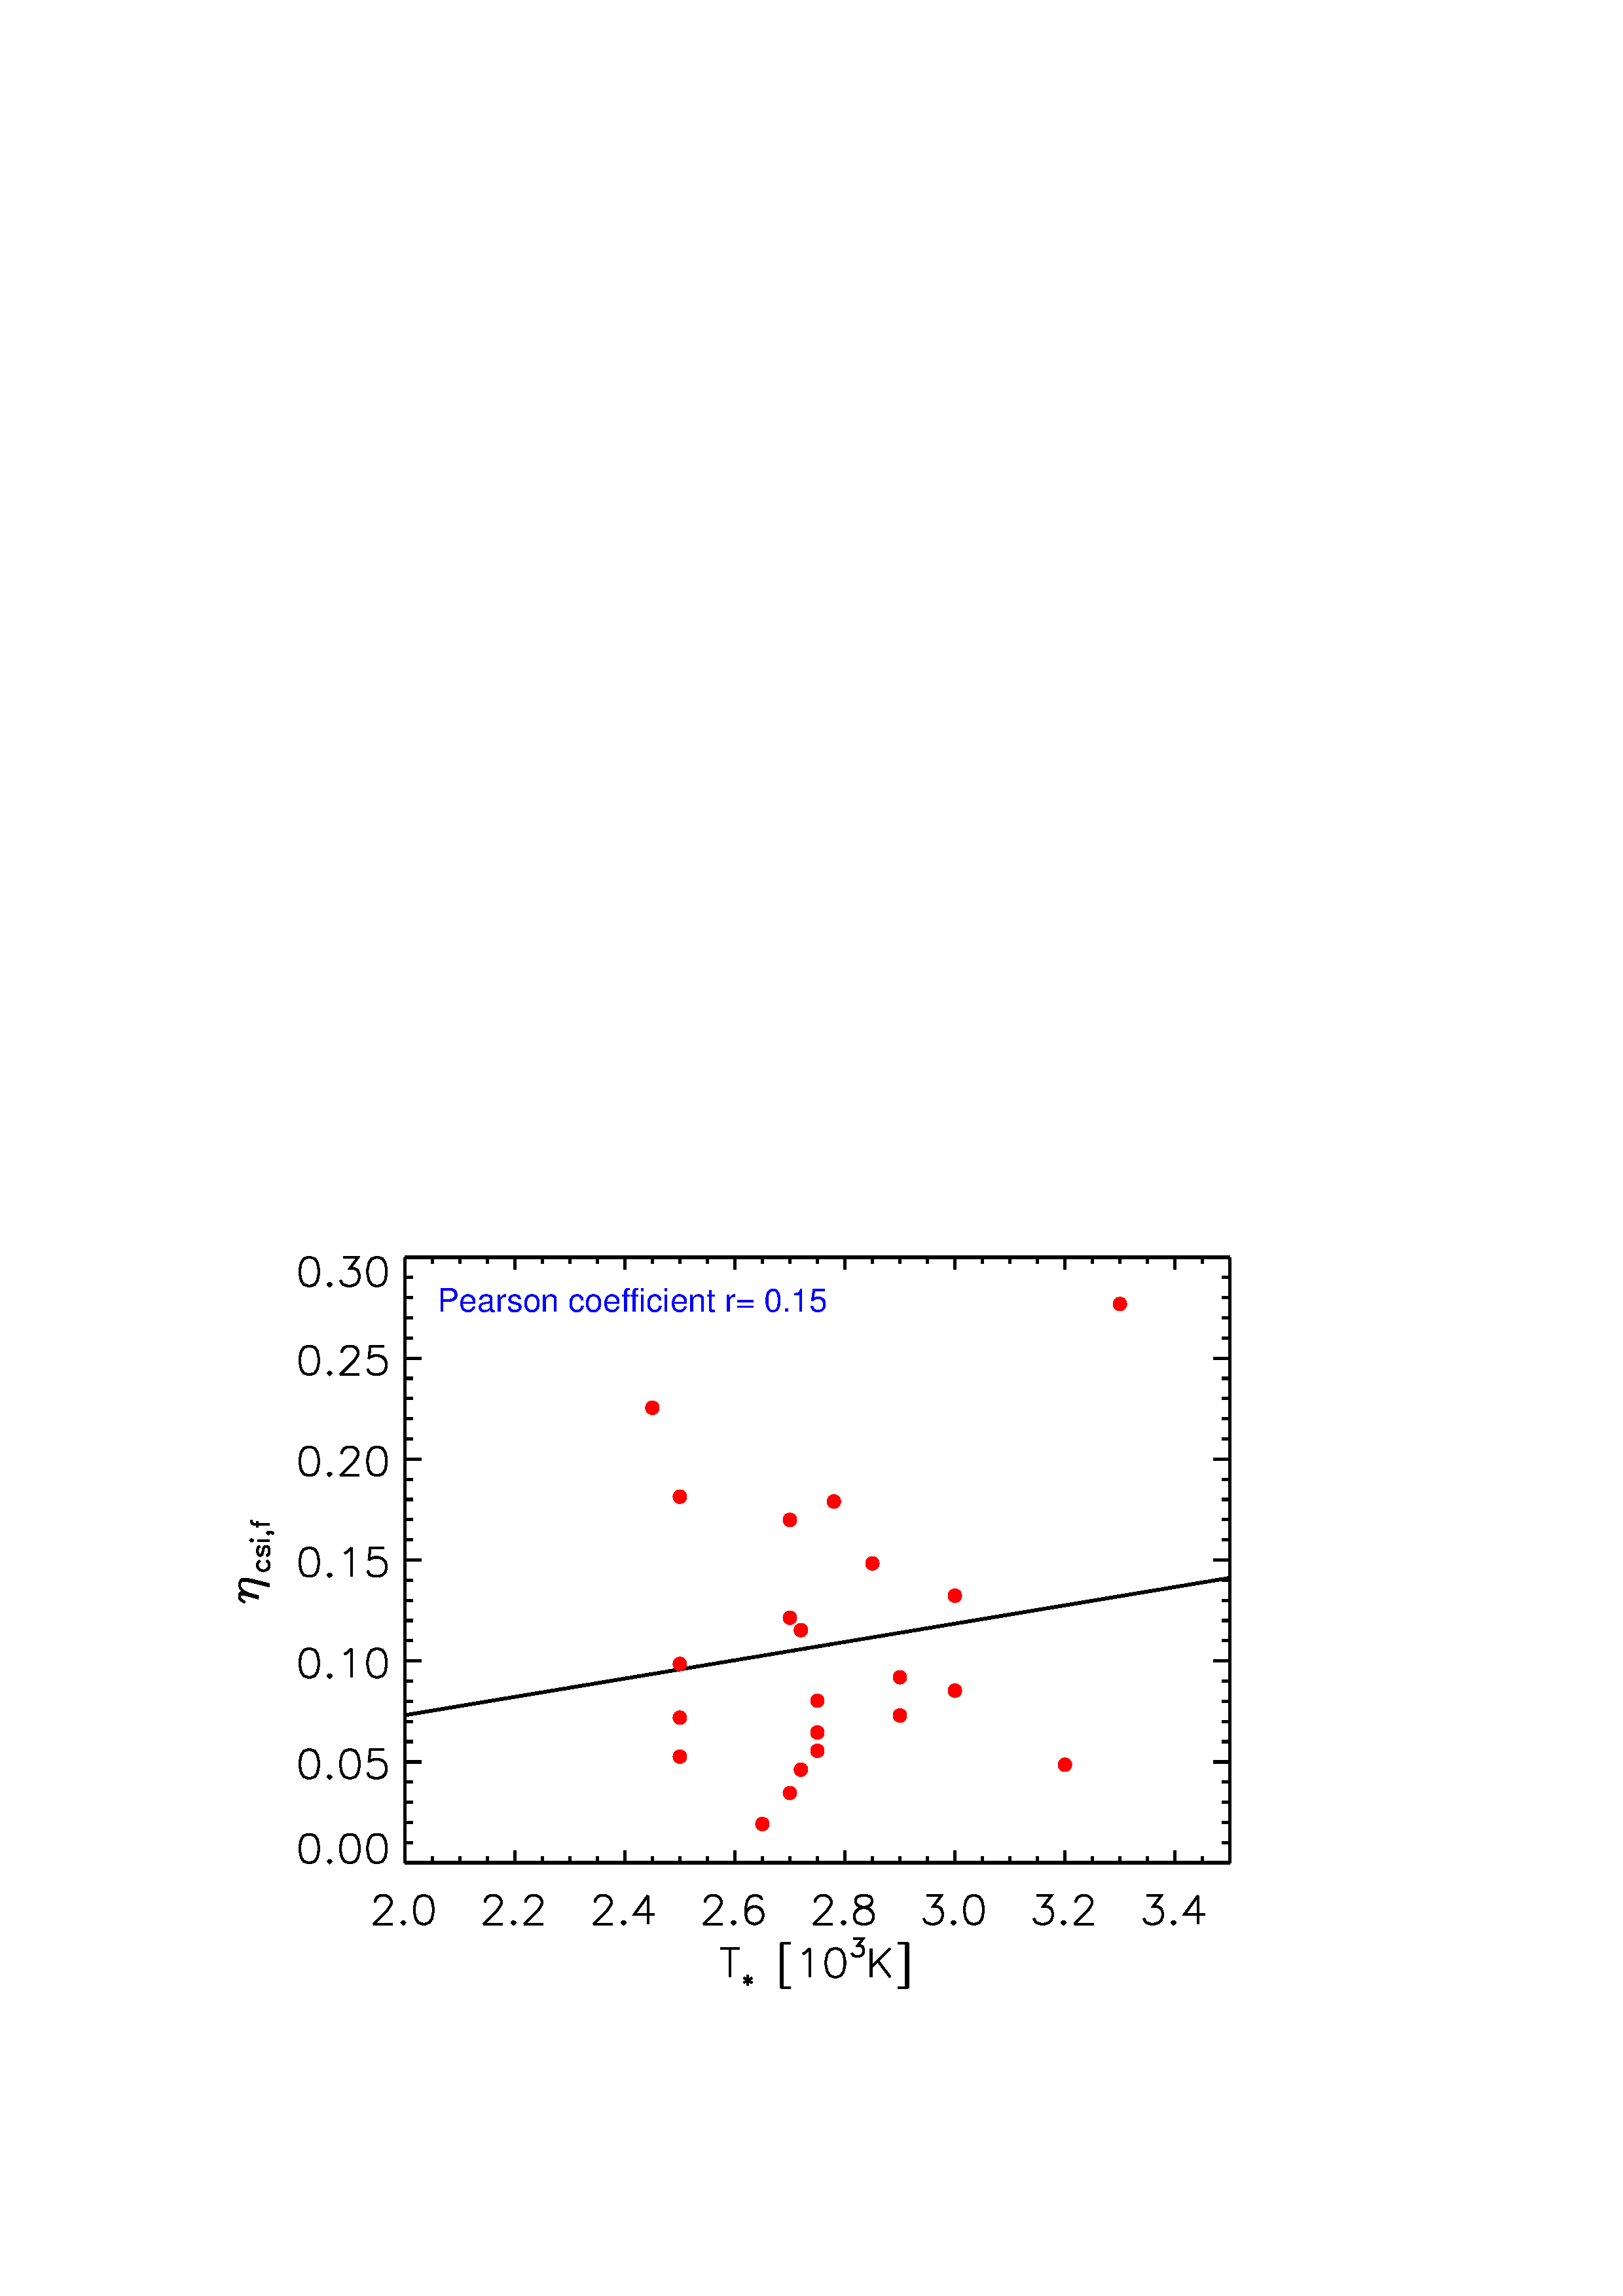
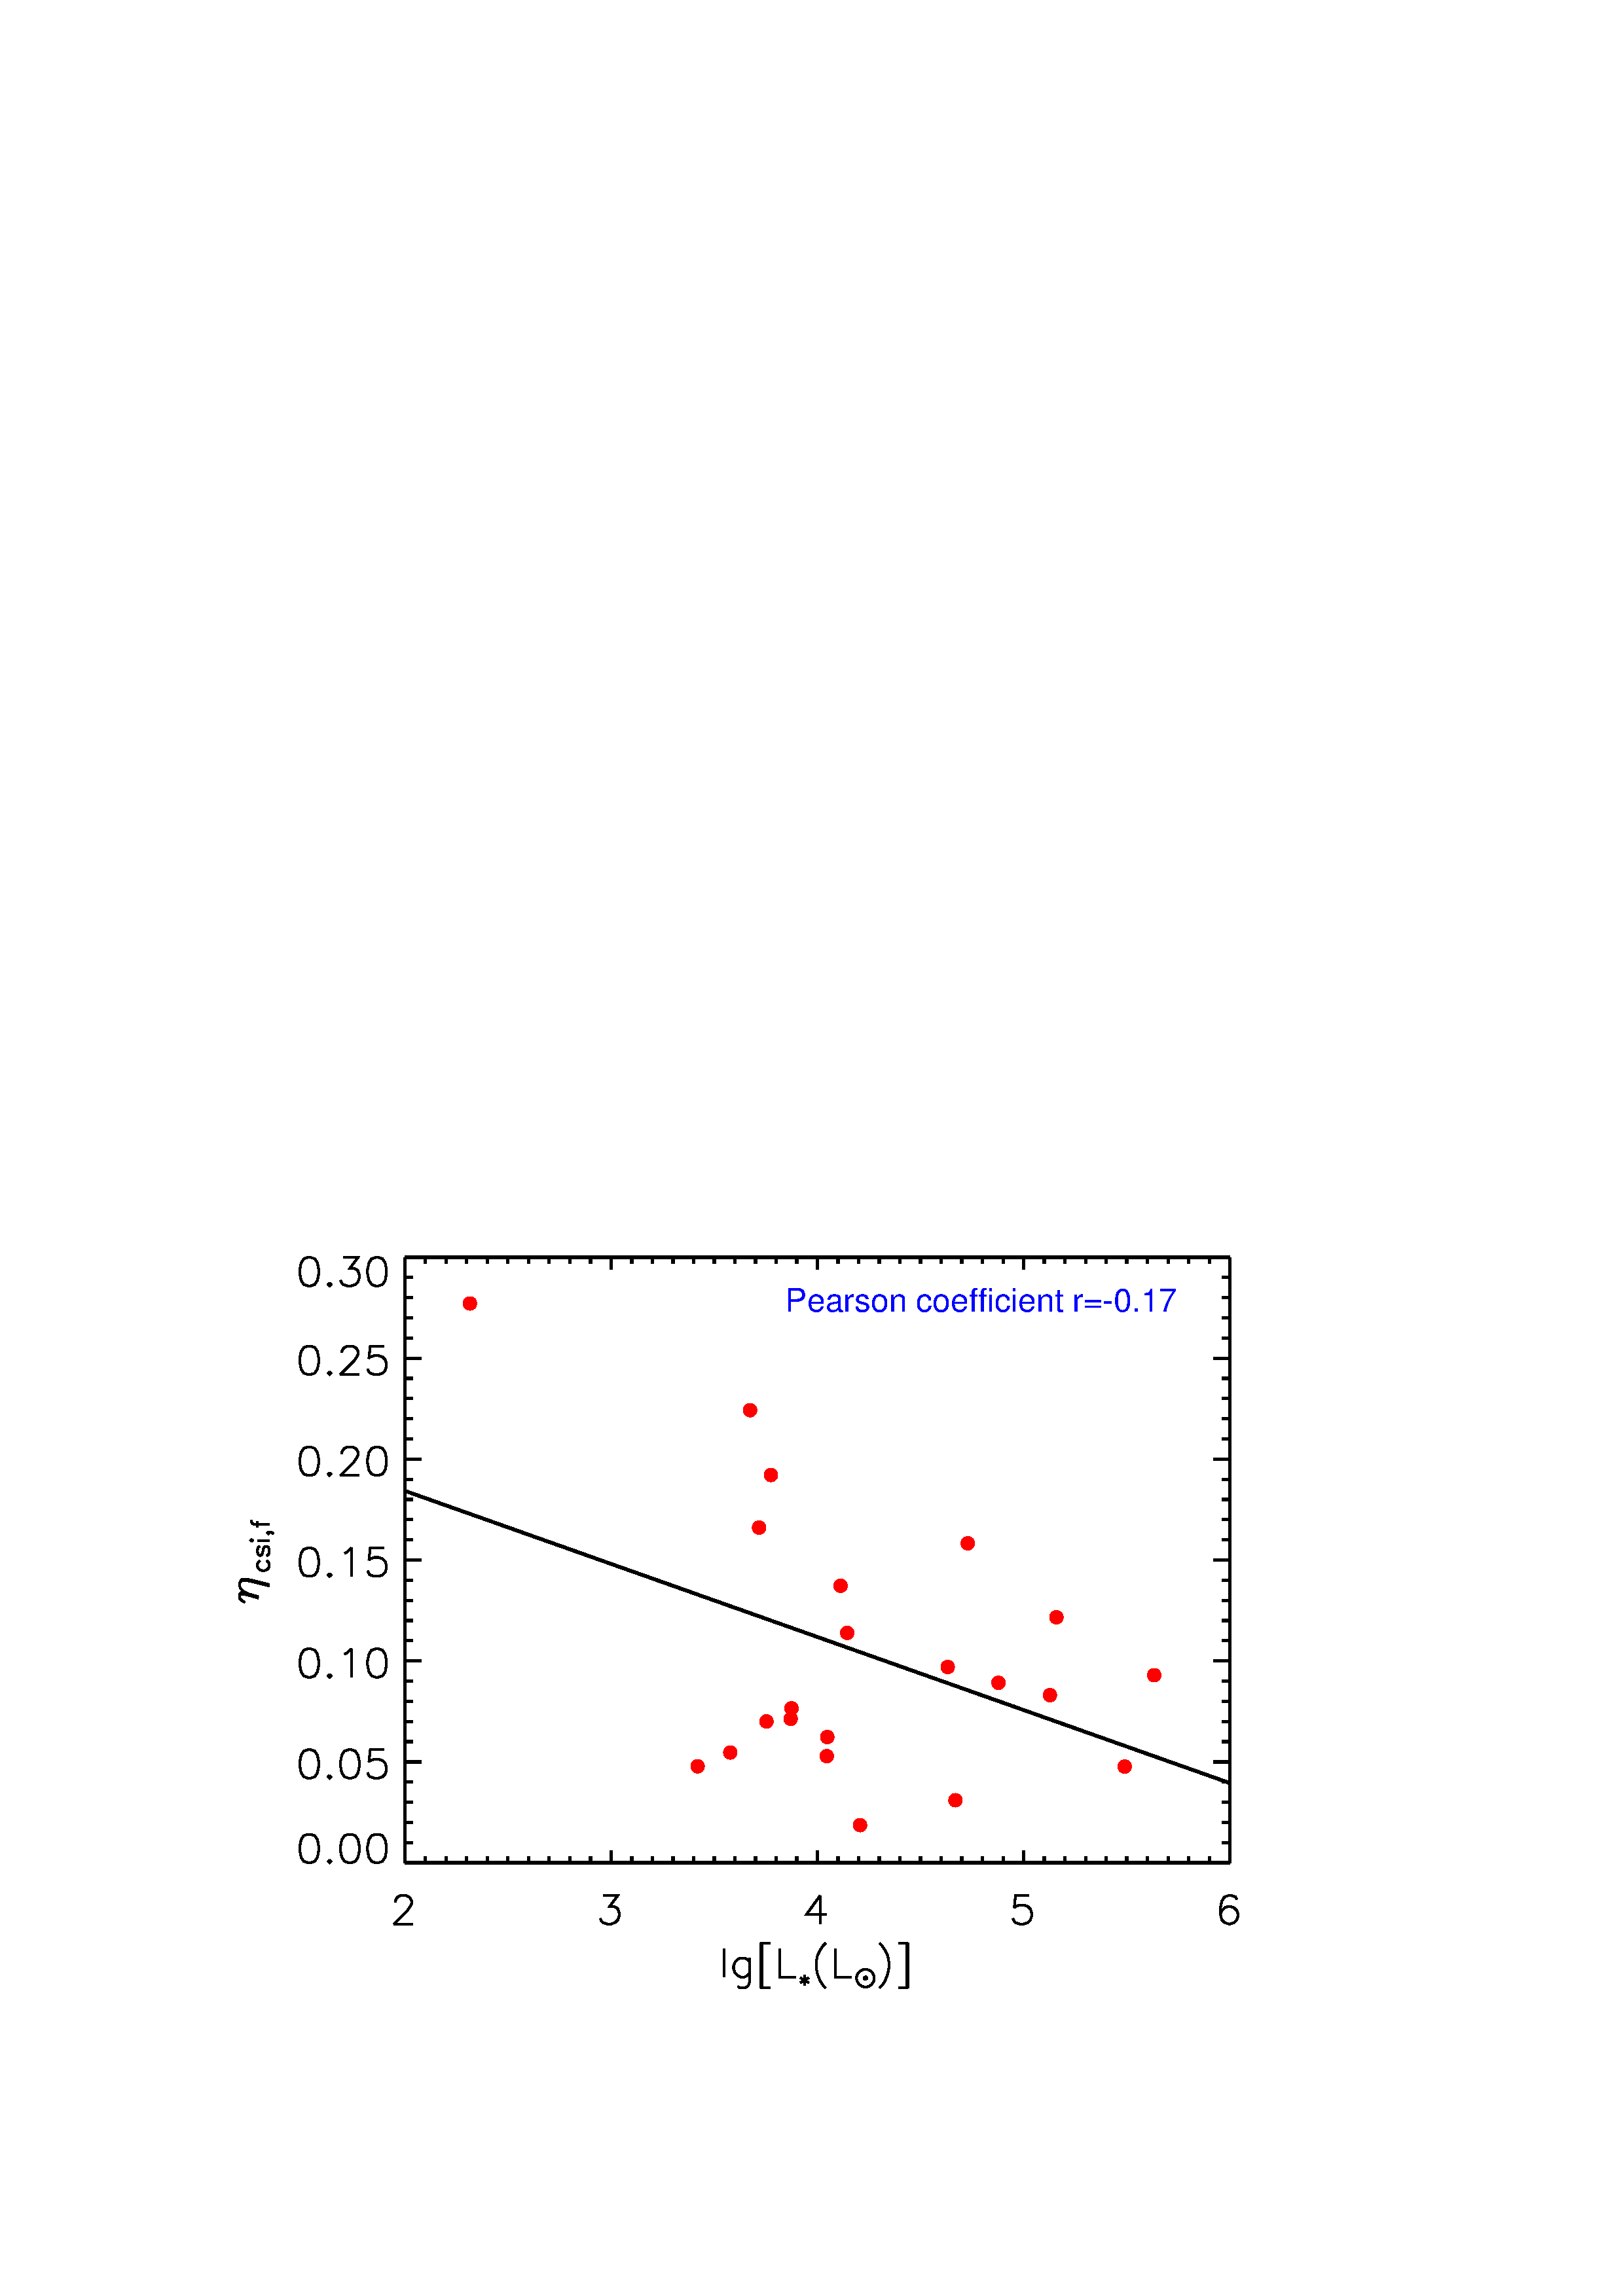
Finally, we also show that the silicate crystallinity does not correlate with the stellar temperature (see Figure 14) or the stellar luminosity (see Figure 15), in agreement with Gielen et al. (2008). The difference between this work and that of de Vries et al. (2010) and Jones et al. (2012) is that they were more concerned with the relation between the mass loss rates and individual features (e.g., the 11.3 and 33.6 emission features [de Vries et al. 2010]) or the 23, 28 and 33 complex features, while we mainly focus on the relation between the entire flux ratios and the mass loss rates.
De Vries et al. (2010) showed that the strength of the 11.3 feature does show some correlation with the mass loss rate, while Jones et al. (2012) found that at least the 23, 28 and 33 complexes do not seem to correlate with the mass loss rates of the stars.
We note that among our sample, the ISO/SWS spectra of the following six stars are rather smooth and show little crystalline silicate emission: BI Cyg (see Figure 6), Mira (see Figure 6), RS Per (see Figure 7), SV Psc (see Figure 8), VX Sgr (see Figure 8), and W Hya (see Figure 8). With these six sources excluded, we have also performed correlation studies for with (see Figure 16) and for with (see Figure 17) as well as for with (see Figure 18) and (see Figure 19). Similar to the results for the full sample of 28 objects, no correlation is found.
A visual inspection of the ISO/SWS spectra of our 28 sample stars shows that the solid-state spectral features of oxides are not apparent in the observed spectra. While the 11 feature of amorphous Al2O3 and the 19.5 feature of MgxFe1-xO (Posch et al. 2002) may be confused with the identification of some crystalline silicate features, the 13 feature of spinel (Posch et al. 1999, Fabian et al. 2001) does not seem to be present in most of our sources unless it blends with the broad 10 amorphous silicate feature and the sharp crystalline silicate features at 10.5–11.5 (see Figures 6–9). Nevertheless, we have explored the effects of the possible presence of oxides in the dust shells of our sample stars on the correlation between and by deriving the upper limits of the fluxes of the 11, 13, and 19.5 features of oxides. To this end, we take the emission profiles of amorphous Al2O3 at 11, spinel at 13 (together with a minor feature at 16.5), and MgxFe1-xO at 19.5 observed in the prototypical low-mass-loss-rate AGB star g Her (see Figure 3 of Waters 2004). We add these emission profiles in the decompositional fitting scheme (see eq. 3) described in §3 and once again decompose the ISO/SWS spectra of all 28 sources. This allows us to derive the upper limits of the total fluxes emitted by these oxide dust species and consequently, also to obtain a new set of and which are expected to be somewhat reduced compared to that derived earlier in §3. We then estimate the silicate crystallinity from the newly-determined and and correlate it with the dust mass loss rate. Similar to that derived earlier in this section, no correlation is found between and . This demonstrates that our conclusion of no correlation between the silicate crystallinity and the dust mass loss rate is not affected by ignoring the possible presence of oxides in our sample sources.
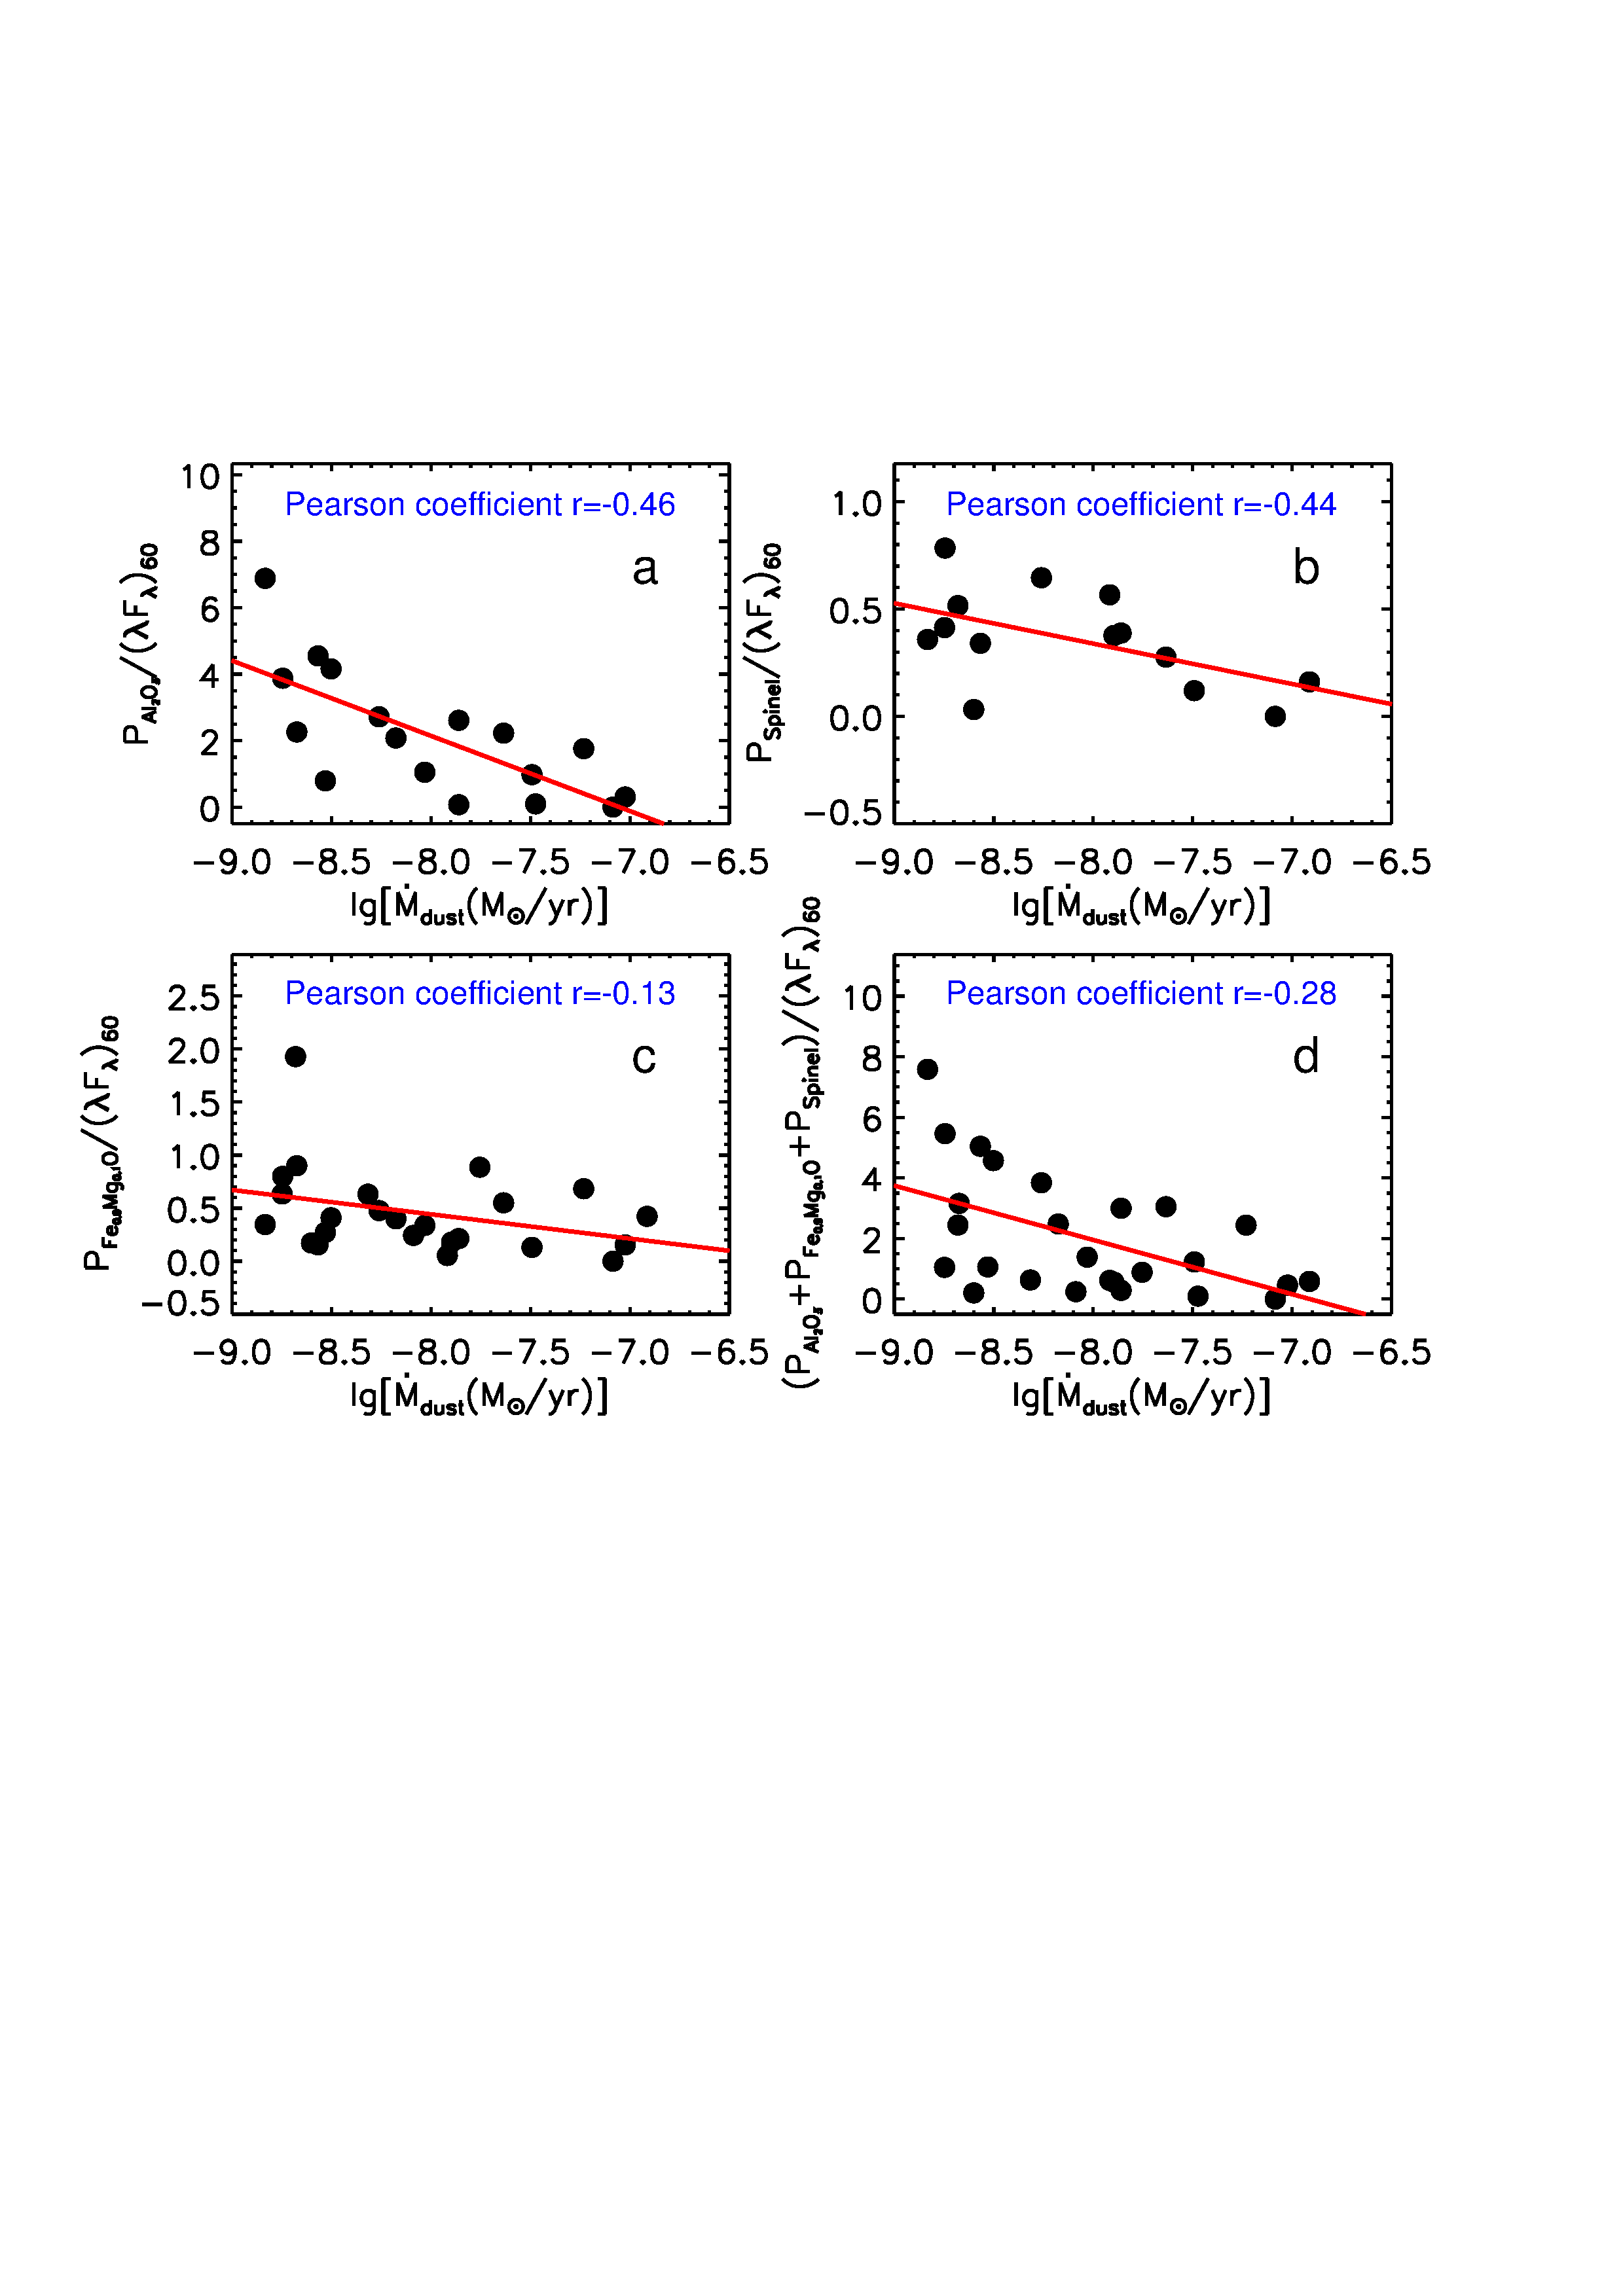
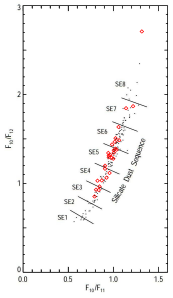
Egan & Sloan (2001) and Nowotny et al. (2015) argued for a correlation between the mass loss rates of oxygen-rich AGB stars and the mineralogical composition of their dust shells; particularly, they suggested that Al- and MgAl-oxides are predominantly seen in the shells of AGB stars with low mass-loss rates. We have also investigated the possible correlation between and the wavelength-integrated fluxes (normalized to the IRAS 60 emission) of the 11, 13 and 19.5 features of amorphous Al2O3, spinel, and MgxFe1-xO. As shown in Figure 20, they do not appear to be correlated. At most, amorphous Al2O3 and MgxFe1-xO show a weak trend of decreasing with . We have also considered all three oxide species as a whole by summing up the wavelength-integrated fluxes of all three features. Again, no correlation is found (see Figure 20d). However, we note that our sample may be biased to stars of relatively high mass loss rates, too high to allow an appreciable amount of oxide dust to be present in their dust shells. To examine this possibility, we derive the stellar-continuum-subtracted fluxes (, , and ) of the dust shells of our sample stars at 10, 11, and 12 and then plot their flux ratios and in the “silicate dust sequence” diagram (see Figure 21). Sloan & Price (1995, 1998) found that the flux ratios and of hundreds of the oxygen-rich sources detected by IRAS through the Low Resolution Spectrometer (LRS) fall along one smooth progression, which they called the “silicate dust sequence”.
As shown in Figure 21, Sloan & Price (1995, 1998) divided the silicate dust sequence into eight segments (SE1, SE2, …, SE8) and classified these segments into three groups: SE1–SE2 at the bottom end of the silicate dust sequence are dominated by stars rich in amorphous alumina, SE3–SE6 stand for stars showing “structured” silicate emission (i.e., crystalline silicates), and SE7–SE8 on the upper part of the silicate dust sequence are for stars mostly containing amorphous silicate grains (see Egan & Sloan 2001). As illustrated in Figure 21, while 25/28 of our sources fall in the crystalline-silicate-rich SE3–SE6 class, none of our sources fall in the alumina-rich SE1–SE2 class. The former confirms the source-selection criterion of “most of our sources exhibiting prominent crystalline silicate emission features” (see §2). The latter confirms that oxides are not important in the dust shells around our sources, justifying the neglect of oxides in deriving (see §3). Finally, we note that our results do not necessarily falsify Nowotny et al. (2015) who argued for a potential dependence of the dust composition on the mass loss rates as our sample stars do not cover the alumina-rich, low- SE1 and SE2 segments. In future work, it will be useful to carefully select a sample of evolved stars of which the oxide spectral features are present and exhibit a wide range of intensities.
Finally, we hypothesize that the silicate crystallinity may be related to the stellar mass loss history: one may expect more crystalline silicates in an episodic mass loss event due to the local density enhancement in regions close the star where amorphous silicates can be annealed. For stars experiencing episodic mass losses, the dust mass loss rate is not a good description of the actual mass loss history since is obtained from dividing the total dust mass of the shell by the dust outflow timescale under the assumption of a continuous mass loss process. Therefore, one would not expect a tight correlation between the silicate crystallinity and . One way to test this hypothesis is to perform high spatial resolution mid-IR imaging observations of AGB stars of high crystallinity. If silicate crystallinity is indeed associated with episodic mass loss events, one expects to see layered structures or local clumps with an enhanced dust density in the mid-IR images of the dust shells around these AGB stars.
5 Summary
We have selected 28 O-rich evolved stars in the solar neighbourhood to explore the relation between the silicate crystallinity and the stellar mass loss rate. The SED of each source from the near-UV to the far-IR has been fitted with the 2DUST model to derive its mass loss rate. Assuming the silicate crystallinity to be the ratio of the fluxes emitted in the crystalline silicate features to that in the amorphous silicate features, we have determined the silicate crystallinity for each source. With a Pearson correlation coefficient of , it is found that the silicate crystallinity does not appear to correlate with the mass loss rate. Moreover, the silicate crystallinity does not correlate with the stellar temperature or the stellar luminosity.
Acknowledgements
We dedicate this paper to the 80th birthday of Prof. Jingyao Hu who first detected the 11.3 crystalline silicate feature outside of the solar system. We thank A. Mishra, S. Wang, Y.X. Xie, Z.Z. Shao and the referee for very helpful suggestions and comments. This work is supported by NSFC through Projects 11173007, 11373015, 11533002, and 973 Program 2014CB845702.
References
- Ammons et al. (2006) Ammons, S. M., Robinson, S. E., Strader, J., et al. 2006, ApJ, 638, 1004
- Bedijn (1987) Bedijn, P. J. 1987, A&A, 186, 136
- Beichman et al. (1988) Beichman, C. A., Neugebauer, G., Habing, H. J., Clegg, P. E., & Chester, T. J. 1988, Infrared Astronomical Satellite (IRAS) Catalogs and Atlases. Volume 1: Explanatory supplement, 1
- Blommaert et al. (2014) Blommaert, J. A. D. L., de Vries, B. L., Waters, L. B. F. M., et al. 2014, A&A, 565, 109
- Bohren & Huffman (1983) Bohren, C. F., & Huffman, D. R. 1983, New York: Wiley, 1983
- Cardelli et al. (1989) Cardelli, J. A., Clayton, G. C., & Mathis, J. S. 1989, ApJ, 345, 245
- Chiar & Tielens (2006) Chiar, J. E., & Tielens, A. G. G. M. 2006, ApJ, 637, 774
- Cutri et al. (2003) Cutri, R. M., Skrutskie, M. F., van Dyk, S., et al. 2003, The IRSA 2MASS All-Sky Point Source Catalog, NASA/IPAC Infrared Science Archive
- Cutri et al. (2012) Cutri, R. M., Wright, E. L., Conrow, T., et al. 2012, Explanatory Supplement to the WISE All-Sky Data Release Products, 1
- Cutri et al. (2013) Cutri, R. M., & et al. 2013, VizieR Online Data Catalog, 2328
- de Vries et al. ((2010) de Vries, B. L., Min, M., Waters, L. B. F. M., Blommaert, J. A. D. L., & Kemper, F. 2010, A&A, 516, A86
- Dorschner et al. (1995) Dorschner, J., Begemann, B., Henning, T., Jäger, C., & Mutschke, H. 1995, A&A, 300, 503
- Draine & Lee (1984) Draine, B. T., & Lee, H. M. 1984, ApJ, 285, 89
- Engels (1979) Engels, D. 1979, A&AS, 36, 337
- Egan & Sloan (2001) Egan, M. P., & Sloan, G. C. 2001, ApJ, 558, 165
- Fabian et al. (2001) Fabian, D., Posch, T., Mutschke, H., Kerschbaum, F., & Dorschner, J. 2001, A&A, 373, 1125
- Famaey et al. (2005) Famaey, B., Jorissen, A., Luri, X., et al. 2005, A&A, 430, 165
- Frinchaboy & Majewski (2008) Frinchaboy, P. M., & Majewski, S. R. 2008, AJ, 136, 118
- Gail & Sedlmayr (1999) Gail H. P., & Sedlmayr, E. 1999, A&A, 347, 594
- Gielen et al. (2008) Gielen, C., van Winckel, H., Min, M., Waters, L. B. F. M., & Lloyd Evans, T. 2008, A&A, 490, 725
- Habing & Olofsson (2003) Habing, H.J., & Olofsson, H., eds. 2003, Asymptotic Giant Branch Stars (New York, NY: Springer)
- Henning (2010) Henning, T. 2010, ARA&A, 48, 21
- Heras & Hony (2005) Heras, A. M., & Hony, S. 2005, A&A, 439, 171
- Jaeger et al. (1998) Jäger, C., Molster, F. J., Dorschner, J., Henning, T., Mutschke, H., & Waters, L. B. F. M. 1998, A&A, 339, 904
- Jiang et al. (2013) Jiang, B. W., Zhang, K., Li, A., & Lisse, C. M. 2013, ApJ, 765, 72
- Jones & Merrill (1976) Jones, T. W., & Merrill, K. M. 1976, ApJ, 209, 509
- Jones et al. (2012) Jones, O. C. et al. 2012, MNRAS, 427, 3209
- Jones et al. (2015) Jones, O. C., Kemper, F., Srinivasan, S., & McDonald, I. 2015, Why Galaxies Care about AGB Stars III: A Closer Look in Space and Time, 497, 379
- Kim et al. (2014) Kim, J., Cho, S.-H., & Kim, S. J. 2014, AJ, 147, 22
- Knapp (1985) Knapp, G. R. 1985, ApJ, 293, 273
- Knapp & Morris (1985) Knapp, G. R., & Morris, M. 1985, ApJ, 292, 640
- Kemper et al. (2001) Kemper, F., Waters, L. B. F. M., de Koter, A., & Tielens, A. G. G. M. 2001, A&A, 369, 132
- Kemper et al. (2002) Kemper, F., de Koter, A., Waters, L. B. F. M., Bouwman, J., & Tielens, A. G. G. M. 2002, A&A, 384, 585
- Koike et al. (1993) Koike, C., Shibai, H., & Tuchiyama, A. 1993, MNRAS, 264, 654
- Koike et al. (1999) Koike, C., Tsuchiyama, A., Suto, H., et al. 1999, in Proc. of the 32nd ISAS Lunar and Planetary Symposium 32, 175
- Koike et al. (2003) Koike, C., Chihara, H., Tsuchiyama, A., et al. 2003, A&A, 399, 1101
- Li ( 2009) Li, A. 2009, in Small Bodies in Planetary Sciences (Lecture Notes in Physics vol. 758), ed. I. Mann, A. Nakamura, & T. Mukai, Springer, Chapter 6, 167
- Liu & Jiang (2014) Liu, J. M., & Jiang, B. W. 2014, Progress in Astronomy, 32, 2
- Lisse et al. (2007) Lisse, C. M., Beichman, C. A., Bryden, G., & Wyatt, M. C. 2007, ApJ, 658, 584
- Lisse et al. (2009) Lisse, C. M., Chen, C. H., Wyatt, M. C., et al. 2009, ApJ, 701, 2019
- Lisse et al. (2012) Lisse, C. M., Wyatt, M. C., Chen, C. H., et al. 2012, ApJ, 747, 93
- Little-Marenin & Little (1988) Little-Marenin, I. R., & Little, S. J. 1988, ApJ, 333, 305
- Little-Marenin & Little (1990) Little-Marenin, I. R., & Little, S. J. 1990, AJ, 99, 1173
- Lorenz-Martins & Pompeia (2000) Lorenz-Martins, S., & Pompeia, L. 2000, MNRAS, 315, 856
- Mathis et al. (1977) Mathis, J. S., Rumpl, W., & Nordsieck, K. H. 1977, ApJ, 217, 425
- Mauron & Josselin (2011) Mauron, N., & Josselin, E. 2011, A&A, 526, A156
- McDonald et al. (2012) McDonald, I., Zijlstra, A. A., & Boyer, M. L. 2012, MNRAS, 427, 343
- Molster et al. ((2002a) Molster, F. J., Waters, L. B. F. M., & Tielens, A. G. G. M. 2002a, A&A, 382, 222
- Molster et al. (2002b) Molster, F. J., Waters, L. B. F. M., Tielens, A. G. G. M., & Barlow, M. J. 2002b, A&A, 382, 184
- Molster et al. (2002c) Molster, F. J., Waters, L. B. F. M., Tielens, A. G. G. M., Koike, C., & Chihara, H. 2002c, A&A, 382, 241
- Molster et al. (2001) Molster, F. J., Yamamura, I., Waters, L. B. F. M., et al. 2001, A&A, 366, 923
- Molster et al. (2005) Molster, F J, & Kemper, F. 2005, Space Sci. Rev., 119, 3
- Nowotny et al. (2015) Nowotny, W., Gail, H.-P., Posch, T., & Aringer, B. 2015, Why Galaxies Care about AGB Stars III: A Closer Look in Space and Time, 497, 397
- Olofsson et al. (2012) Olofsson, J., Juhász, A., Henning, T., et al. 2012, A&A, 542, AA90
- Palagi et al. (1993) Palagi, F., Cesaroni, R., Comoretto, G., Felli, M., & Natale, V. 1993, A&AS, 101, 153
- Pickles & Depagne (2010) Pickles, A., & Depagne, É. 2010, PASP, 122, 1437
- Posch et al (1999) Posch, T., Kerschbaum, F., Mutschke, H., et al. 1999, A&A, 352, 609
- Posch et al (2002) Posch, T., Kerschbaum, F., Mutschke, H., Dorschner, J., & Jäger, C. 2002, A&A, 393, L7
- Richards et al. (2012) Richards, A. M. S., Etoka, S., Gray, M. D., et al. 2012, A&A, 546, A16
- Sargent et al. (2006) Sargent, B., Forrest, W. J., D’Alessio, P., et al. 2006, ApJ, 645, 395
- Sargent et al. (2009) Sargent, B. A., Forrest, W. J., Tayrien, C., et al. 2009a, ApJ, 690, 1193
- Sargent et al. (2009) Sargent, B. A., Forrest, W. J., Tayrien, C., et al. 2009b, ApJS, 182, 477
- Sargent et al. (2010) Sargent, B. A., Srinivasan, S., Meixner, M., et al. 2010, ApJ, 716, 878
- Sargent et al. (2011) Sargent, B. A., Srinivasan, S., & Meixner, M. 2011, ApJ, 728, 93
- Sloan & Price (1995) Sloan, G. C., & Price, S. D. 1995, ApJ, 451, 758
- Sloan & Price (1998) Sloan, G. C., & Price, S. D. 1998, ApJS, 119, 141
- Sloan et al. (2003) Sloan, G. C., Kraemer, K. E., Price, S. D., & Shipman, R. F. 2003, ApJS, 147, 379
- Sloan et al. (2003) Sloan, G. C., Kraemer, K. E., Goebel, J. H., & Price, S. D. 2003, ApJ, 594, 483
- Smith et al. (2007) Smith, J. D. T., Draine, B. T., Dale, D. A., et al. 2007, ApJ, 656, 770
- Sogawa & Kozasa (1998) Sogawa, H., & Kozasa, T. 1998, Frontiers Science Series No. 23: Pulsating Stars: Recent Developments in Theory and Observation, 215
- Sturm et al. (2013) Sturm, B., Bouwman, J., Henning, T., et al. 2013, A&A, 553, 5
- Suh (2004) Suh, K.-W. 2004, ApJ, 615, 485
- Tielens et al. (1998) Tielens, A. G. G. M., Waters, L. B. F. M., Molster, F. J., & Justtanont, K. 1998, Ap&SS, 255, 415
- Treffers & Cohen (1974) Treffers, R., & Cohen, M. 1974, ApJ, 188, 545
- Ueta & Meixner (2003) Ueta, T., & Meixner, M. 2003, ApJ, 586, 1338
- Verhoelst et al. (2009) Verhoelst, T., van der Zypen, N., Hony, S., et al. 2009, A&A, 498, 127
- Wang et al. (2015) Wang, S., Li, A., & Jiang, B. W. 2015, MNRAS, 454, 569
- Waters et al. (1996) Waters, L. B. F. M., Molster, F. J., de Jong, T., et al. 1996, A&A, 315, L361
- Waters (2004) Waters, L.B.F.M. 2004, Astrophysics of Dust (ASP Conf. Ser. 309), ed. A.N. Witt, G.C. Clayton, & B.T. Draine (San Francisco, CA: ASP), 229
- Woolf & Ney (1969) Woolf, N. J., & Ney, E. P. 1969, ApJ, 155, L181
- Zeidler et al. (2013) Zeidler, S., Posch, T., & Mutschke, H. 2013, A&A, 553, A81
| Star | J2000 | Type | Fν (Johnson): mag | Fν (2MASS): mag | Fν (WISE): mag | Fν (IRAS): Jy | ||||||||||||||
| ra | dec | (pc) | U | B | V | R | I | J | H | K | W1 | W2 | W3 | W4 | 12 | 25 | 60 | 100 | ||
| AH Sco | 17 11 17.02 | -32 19 30.71 | RSG | 26001 | – | 10.0 | 8.10 | – | – | 1.88 | 0.70 | 0.30 | 1.26 | 0.87 | -2.45 | -4.16 | 629.7 | 349.6 | 73.3 | 28.9 |
| BI Cyg | 20 21 21.88 | +36 55 55.77 | RSG | 15808 | – | 11.5 | 8.40 | – | – | 2.35 | 1.15 | 0.62 | 0.97 | 0.09 | -2.11 | -3.62 | 334.6 | 244.9 | 51.3 | 92.9U |
| FI Lyr | 18 42 04.83 | +28 57 29.81 | RSG | 4102 | – | 10.8 | 9.58 | – | – | 2.04 | 1.12 | 0.71 | 2.60 | 0.19 | -0.42 | -1.35 | 93.4 | 54.9 | 7.23 | 1.57: |
| Mira | 02 19 20.79 | -02 58 39.50 | AGB | 1203 | – | 7.63 | 6.54 | – | – | -0.73 | -1.57 | -2.21 | 1.87 | 0.71 | -2.38 | -5.06 | 4881.0 | 2261.0 | 300.8 | 88.4 |
| PZ Cas | 23 44 03.28 | +61 47 22.18 | RSG | 27101 | 12.8 | 11.5 | 8.90 | 6.08 | 3.90 | 2.42 | 1.53 | 1.00 | 2.44 | 1.45 | -2.27 | -4.26 | 373.0 | 398.2 | 96.5 | 39.3 |
| R Aql | 19 06 22.25 | +08 13 48.01 | AGB | 3101 | 8.06 | 7.69 | 6.09 | – | – | 0.46 | -0.36 | -0.83 | 2.11 | 0.72 | -2.23 | -3.15 | 401.7 | 244.6 | 139.7L | 83.1U |
| R Cas | 23 58 24.87 | +51 23 19.70 | AGB | 3591 | 6.71 | 6.63 | 4.80 | – | – | -0.40 | -1.40 | -1.92 | 2.36 | 1.07 | -2.73 | -4.83 | 1341.0 | 554.6 | 102.8 | 38.9 |
| RS Per | 02 22 24.30 | +57 06 34.36 | RSG | 23504 | 12.4 | 10.1 | 7.82 | – | – | 3.08 | 2.12 | 1.68 | 1.50 | 1.56 | -0.56 | -1.81 | 74.4 | 47.8 | 9.93 | 2.86 |
| RV Cam | 04 30 41.68 | +57 24 42.26 | AGB | 12195 | – | 9.65 | 8.20 | – | – | 1.67 | 0.60 | 0.41 | 1.06 | 1.27 | 0.12 | -1.39 | 58.7 | 34.6 | 7.71 | 3.95 |
| RW Cep | 22 23 07.02 | +55 57 47.62 | RSG | 1152 | 11.3 | 8.87 | 6.65 | 4.94 | 3.78 | 2.83 | 2.22 | 1.88 | 2.17 | 1.63 | -0.86 | -2.41 | 97.4 | 91.6 | 27.4 | 13.5 |
| RW Cyg | 20 28 50.59 | +39 58 54.43 | RSG | 11186 | 13.0 | 10.6 | 8.00 | 5.32 | 3.25 | 2.06 | 0.94 | 0.48 | 1.30 | 1.26 | -2.24 | -3.42 | 298.4 | 189.8 | 60.7 | 97.0U |
| RX Boo | 14 24 11.63 | +25 42 13.41 | AGB | 1693 | – | 9.23 | 8.60 | – | – | -0.59 | -1.55 | -1.96 | 2.18 | 1.15 | -2.45 | -4.16 | 846.5 | 419.3 | 69.2 | 25.8 |
| S Per | 02 22 51.71 | +58 35 11.45 | RSG | 23007 | 13.2 | 10.6 | 7.90 | – | – | 3.14 | 1.85 | 1.33 | 0.84 | 0.84 | -2.44 | -3.70 | 339.4 | 233.2 | 40.6 | 15.0 |
| SU Per | 02 22 06.90 | +56 36 14.87 | RSG | 19008 | 13.9 | 11.6 | 9.40 | – | – | 2.76 | 1.93 | 1.39 | 0.98 | 1.66 | -0.62 | -1.26 | 48.7 | 30.7 | 6.87 | 6.73U |
| SV Peg | 22 05 42.08 | +35 20 54.53 | AGB | 2509 | – | 10.1 | 9.20 | – | – | 1.11 | -0.09 | -0.55 | 2.26 | 0.87 | -1.93 | -2.83 | 264.7 | 146.2 | 23.6 | 9.94 |
| SV Psc | 01 46 35.34 | +19 05 04.52 | AGB | 3623 | – | 10.0 | 8.77 | 8.41 | – | 2.02 | 1.01 | 0.72 | 1.04 | 0.13 | -0.01 | -1.53 | 76.7 | 39.9 | 6.60 | 2.80 |
| TY Dra | 17 37 00.12 | +57 44 25.30 | AGB | 4308 | – | 10.6 | 9.30 | – | – | 2.41 | 1.47 | 1.08 | 2.82 | 0.49 | 0.11 | -1.66 | 66.3 | 45.8 | 7.56 | 2.67 |
| U Her | 16 25 47.47 | +18 53 32.86 | AGB | 46110 | 8.85 | 8.23 | 6.70 | – | – | 1.01 | 0.23 | -0.27 | 2.19 | 0.76 | -2.51 | -3.18 | 499.8 | 179.5 | 27.2 | 9.70 |
| U Lac | 22 47 43.43 | +55 09 30.30 | RSG | 8855 | 13.2 | 11.7 | 9.40 | – | – | 2.90 | 2.09 | 1.58 | 2.70 | 1.32 | -0.88 | -2.00 | 124.0 | 61.5 | 9.04 | 10.6U |
| VX Sgr | 18 08 04.05 | -22 13 26.63 | RSG | 15707 | 11.7 | 9.41 | 6.52 | 3.90 | 2.11 | 1.48 | 0.42 | -0.17 | 2.15 | 1.14 | -2.48 | -5.31 | 2738.0 | 1385.0 | 262.7 | 82.3 |
| W Hor | 02 44 14.75 | -54 18 04.11 | RSG | 3643 | – | 10.0 | 8.84 | – | – | 1.63 | 0.71 | 0.32 | 1.14 | 1.20 | -0.97 | -1.90 | 181.0 | 99.9 | 11.0 | 4.22 |
| W Hya | 13 49 02.00 | -28 22 03.49 | AGB | 1393 | – | 8.97 | 7.70 | – | – | -1.59 | -2.56 | -3.05 | 1.49 | 0.51 | -2.76 | -5.54 | 4200.0 | 1189.0 | 195.0 | 72.3 |
| W Per | 02 50 37.89 | +56 59 00.27 | RSG | 6503 | 14.8 | 12.2 | 9.62 | 6.99 | 4.75 | 3.45 | 2.00 | 2.00 | 2.78 | 1.98 | -1.06 | -2.28 | 90.6 | 78.9 | 14.9 | 5.01 |
| X Her | 16 02 39.17 | +47 14 25.28 | AGB | 1416 | – | 7.64 | 6.58 | – | – | -0.12 | -0.92 | -1.20 | 2.30 | 1.03 | -2.45 | -3.17 | 485.0 | 241.0 | 39.4 | 18.3 |
| X Oph | 18 38 21.12 | +08 50 02.75 | AGB | 2353 | 8.61 | 7.72 | 6.40 | – | – | 0.62 | -0.31 | -0.79 | 1.93 | 0.77 | -2.38 | -3.04 | 409.0 | 146.0 | 22.6 | 9.47 |
| YZ Per | 02 38 25.42 | +57 02 46.18 | RSG | 18505 | 15.0 | 12.4 | 10.0 | – | – | 3.32 | 2.30 | 2.03 | 2.47 | 2.09 | -0.36 | -1.11 | 38.9 | 26.1 | 5.28 | 2.52: |
| Z Cas | 23 44 31.59 | +56 34 52.70 | AGB | 7979 | – | 18.3 | 8.50 | 12.6 | – | 2.68 | 1.80 | 1.23 | 2.86 | 2.13 | -0.88 | -1.55 | 69.2 | 40.3 | 6.70 | 4.55U |
| Z Cyg | 20 01 27.50 | +50 02 32.69 | AGB | 9309 | – | 11.1 | 7.10 | – | – | 4.18 | 3.28 | 2.44 | 2.35 | 1.21 | -0.09 | -1.33 | 81.2 | 67.1 | 10.7 | 2.39 |
| 0 Distance to Earth. | ||||||||||||||||||||
| 1 Engels 1979 | ||||||||||||||||||||
| 2Ammons et al. 2006 | ||||||||||||||||||||
| 3Pickles & Depagne 2010 | ||||||||||||||||||||
| 4Frinchaboy & Majewski 2008 | ||||||||||||||||||||
| 5McDonald et al. 2012 | ||||||||||||||||||||
| 6Famaey et al. 2005 | ||||||||||||||||||||
| 7Richards et al. 2012 | ||||||||||||||||||||
| 8Jones et al. 2012 | ||||||||||||||||||||
| 9Kim et al. 2014 | ||||||||||||||||||||
| 10Palagi et al. 1993 | ||||||||||||||||||||
| Star | 1 | 2 | |||||||
|---|---|---|---|---|---|---|---|---|---|
| [K] | [] | [cm] | [] | [] | [] | [] | |||
| AH Sco | 2700 | 4.29E+5 | 2.1E+14 | 33.7 | 14697.0‘ | 8.41E-21 | 8.22E-8 | 0.093 | 0.102 |
| BI Cyg | 2990 | 2.22E+5 | 1.2E+14 | 40.2 | 2614.0 | 7.02E-21 | 3.36E-8 | 0.080 | 0.088 |
| FI Lyr | 2780 | 5.21E+3 | 2.2E+13 | 36.0 | 1009.1 | 1.22E-20 | 1.47E-9 | 0.166 | 0.199 |
| Mira | 3150 | 1.00E+4 | 2.3E+13 | 40.0 | 1614.6 | 3.58E-20 | 9.32E-9 | 0.056 | 0.060 |
| PZ Cas | 3200 | 3.09E+5 | 1.3E+14 | 48.4 | 25631.5‘ | 1.29E-20 | 9.47E-8 | 0.048 | 0.050 |
| R Aql | 2750 | 1.12E+4 | 3.2E+13 | 34.7 | 2779.4 | 1.00E-20 | 2.51E-9 | 0.062 | 0.066 |
| R Cas | 2700 | 4.67E+4 | 6.9E+13 | 43.1 | 1293.7 | 7.91E-21 | 1.38E-8 | 0.031 | 0.032 |
| RS Per | 3100 | 1.02E+5 | 7.7E+13 | 54.9 | 3074.2 | 6.54E-21 | 2.32E-8 | 0.236 | 0.310 |
| RV Cam | 3000 | 1.34E+5 | 9.4E+13 | 48.5 | 3396.4 | 4.02E-22 | 1.67E-9 | 0.083 | 0.091 |
| RW Cep | 3300 | 2.07E+2 | 3.1E+12 | 56.4 | 22573.6 | 5.16E-19 | 3.05E-9 | 0.277 | 0.383 |
| RW Cyg | 2900 | 7.54E+4 | 7.5E+13 | 33.3 | 1995.1 | 2.56E-20 | 3.22E-8 | 0.089 | 0.098 |
| RX Boo | 2850 | 1.29E+4 | 3.2E+13 | 35.2 | 1054.6 | 8.21E-21 | 2.12E-9 | 0.137 | 0.159 |
| S Per | 3000 | 1.44E+5 | 9.7E+13 | 42.4 | 8474.8 | 1.72E-20 | 5.86E-8 | 0.122 | 0.138 |
| SU Per | 2700 | 5.36E+4 | 7.3E+13 | 38.7 | 1937.1 | 8.55E-21 | 1.38E-8 | 0.158 | 0.188 |
| SV Peg | 2500 | 5.95E+3 | 2.8E+13 | 30.1 | 1778.5 | 2.14E-20 | 3.15E-9 | 0.192 | 0.238 |
| SV Psc | 2450 | 4.47E+3 | 2.6E+13 | 31.5 | 1261.8 | 1.37E-20 | 1.80E-9 | 0.076 | 0.083 |
| TY Dra | 2720 | 2.63E+3 | 1.6E+13 | 40.6 | 2028.8 | 2.13E-20 | 1.79E-9 | 0.048 | 0.050 |
| U Her | 2650 | 1.61E+4 | 4.2E+13 | 32.9 | 1120.6 | 2.16E-20 | 8.18E-9 | 0.019 | 0.019 |
| U Lac | 2720 | 1.39E+4 | 3.7E+13 | 27.3 | 927.4 | 6.01E-20 | 1.21E-8 | 0.114 | 0.129 |
| VX Sgr | 3150 | 3.58E+5 | 1.4E+14 | 31.2 | 6867.2 | 3.24E-20 | 1.22E-7 | 0.020 | 0.021 |
| W Hor | 2500 | 5.67E+3 | 2.8E+13 | 33.3 | 997.5 | 2.83E-20 | 4.83E-9 | 0.070 | 0.075 |
| W Hya | 2500 | 5.67E+3 | 2.8E+13 | 25.8 | 567.4 | 2.64E-20 | 2.71E-9 | 0.192 | 0.238 |
| W Per | 2750 | 7.49E+3 | 2.6E+13 | 36.8 | 16544.7 | 3.54E-20 | 6.67E-9 | 0.076 | 0.083 |
| X Her | 2750 | 3.78E+3 | 1.9E+13 | 33.4 | 1337.4 | 2.66E-20 | 2.09E-9 | 0.055 | 0.058 |
| X Oph | 2900 | 7.42E+3 | 2.4E+13 | 44.6 | 1337.1 | 1.33E-20 | 2.95E-9 | 0.071 | 0.077 |
| YZ Per | 2500 | 4.28E+4 | 7.7E+13 | 36.2 | 2171.1 | 8.29E-21 | 1.27E-8 | 0.097 | 0.107 |
| Z Cas | 2500 | 1.11E+4 | 3.9E+13 | 30.6 | 1376.6 | 1.94E-20 | 5.49E-9 | 0.053 | 0.056 |
| Z Cyg | 2450 | 4.72E+3 | 2.6E+13 | 37.9 | 1628.6 | 8.77E-20 | 1.76E-8 | 0.224 | 0.289 |
| 1 | |||||||||
| 2 | |||||||||
| Star | Sources | |||||
|---|---|---|---|---|---|---|
| AH Sco | 1.88 | 0.30 | 1.58 | 1.24 | 2.02 | 2MASS |
| BI Cyg | 2.35 | 0.62 | 1.73 | 1.04 | 4.06 | 2MASS |
| FI Lyr | 2.04 | 0.72 | – | – | 0.62 | NED |
| Mira | -0.73 | -2.21 | – | – | 0.075 | NED |
| PZ Cas | 2.42 | 1.00 | 1.42 | 0.98 | 2.59 | 2MASS |
| R Aql | 0.46 | -0.83 | 1.29 | 1.27 | 0.15 | 2MASS |
| R Cas | -0.40 | -1.92 | – | – | 0.60 | NED |
| RS Per | 3.08 | 1.68 | 1.4 | 1.04 | 2.12 | 2MASS |
| RV Cam | 1.67 | 0.41 | 1.26 | 1.18 | 0.44 | 2MASS |
| RW Cep | 2.83 | 1.88 | 0.95 | 0.65 | 1.76 | 2MASS |
| RW Cyg | 2.06 | 0.48 | 1.58 | 0.98 | 3.53 | 2MASS |
| RX Boo | -0.59 | -1.96 | – | – | 0.059 | NED |
| S Per | 3.14 | 1.33 | 1.81 | 1.07 | 4.35 | 2MASS |
| SU Per | 2.76 | 1.39 | 1.37 | 0.98 | 2.29 | 2MASS |
| SV Peg | 1.11 | -0.55 | – | – | 0.45 | NED |
| SV Psc | 2.02 | 0.72 | – | – | 0.14 | NED |
| TY Dra | 2.41 | 1.08 | – | – | 0.20 | NED |
| U Her | 1.01 | -0.27 | 1.28 | 1.27 | 0.16 | NED |
| U Lac | 2.90 | 1.58 | 1.32 | 1.04 | 1.65 | 2MASS |
| VX Sgr | 1.48 | -0.17 | 1.65 | 1.1 | 3.23 | 2MASS |
| W Hor | 1.63 | 0.32 | – | – | 0.12 | NED |
| W Hya | -1.59 | -3.05 | – | – | 0.22 | NED |
| W Per | 3.45 | 2.00 | 1.45 | 0.98 | 2.76 | 2MASS |
| X Her | -0.12 | -1.32 | – | – | 0.046 | NED |
| X Oph | 0.62 | -0.79 | 1.41 | 1.02 | 2.29 | 2MASS |
| YZ Per | 3.32 | 2.03 | 1.29 | 0.81 | 2.82 | 2MASS |
| Z Cas | 2.68 | 1.23 | 1.45 | 1.27 | 1.06 | 2MASS |
| Z Cyg | 4.18 | 2.44 | – | – | 0.32 | NED |
| Object | References | Methodology | Type | ||
|---|---|---|---|---|---|
| (/yr) | |||||
| AH Sco | 8.22 | This work | IR SED: (2DUST) | – | – |
| 3.87 | Jura & Kleinmann (1990) | (JK90)a | RSG | 200 | |
| BI Cyg | 3.36 | This work | IR SED: < (2DUST) | – | – |
| 2.30 | Mauron & Josselin (2011) | (JK90)a | RSG | 200 | |
| 3.00 | Jura & Kleinmann (1990) | (JK90)a | RSG | 200 | |
| FI Lyr | 1.47 | This work | IR SED: (2DUST) | – | – |
| 7.55 | Heras & Hony (2005) | IR SED: (DUSTY) | AGB | 47.7 | |
| Mira | 9.32 | This work | IR SED: (2DUST) | – | – |
| 6.96 | Heras & Hony (2005) | IR SED: (DUSTY) | AGB | 306.1 | |
| 1.21 | Suh (2004) | IR SED: (CSDUST3) | AGB | – | |
| 2.85 | Knapp & Morris (1985) | CO: | AGB | 200 | |
| PZ Cas | 9.47 | This work | IR SED: (2DUST) | – | – |
| 1.30 | Mauron & Josselin (2011) | (JK90)a | RSG | 200 | |
| 5.00 | Jura & Kleinmann (1990) | (JK90)a | RSG | 200 | |
| R Aql | 2.51 | This work | IR SED: < (2DUST) | – | – |
| 4.00 | Lane et al. (1987) | CO: | AGB | 200 | |
| R Cas | 1.38 | This work | IR SED: (2DUST) | – | – |
| 2.25 | Knapp & Morris (1985) | CO: | AGB | 200 | |
| RS Per | 2.32 | This work | IR SED: (2DUST) | – | – |
| 1.00 | Mauron & Josselin (2011) | (JK90)a | RSG | 200 | |
| RV Cam | 1.67 | This work | IR SED: (2DUST) | – | – |
| 1.42 | Heras & Hony (2005) | IR SED: (DUSTY) | AGB | 91.8 | |
| 1.25 | Olofsson et al. (2002) | CO: (Monte Carlo) | AGB | 200 | |
| RW Cep | 3.05 | This work | IR SED: (2DUST) | – | – |
| RW Cyg | 3.22 | This work | IR SED: < (2DUST) | – | – |
| 1.60 | Mauron & Josselin (2011) | (JK90)a | RSG | 200 | |
| 5.00 | Jura & Kleinmann (1990) | (JK90)a | RSG | 200 | |
| RX Boo | 2.12 | This work | IR SED: (2DUST) | – | – |
| 4.73 | Heras & Hony (2005) | IR SED: (DUSTY) | AGB | 69.7 | |
| 2.50 | Olofsson et al. (2002) | CO: (Monte Carlo) | AGB | 200 | |
| 1.65 | Knapp & Morris (1985) | CO: | AGB | 200 | |
| S Per | 5.86 | This work | IR SED: (2DUST) | – | – |
| 3.40 | Mauron & Josselin (2011) | (JK90)a | RSG | 200 | |
| 3.50 | Jura & Kleinmann (1990) | (JK90)a | RSG | 200 | |
| SU Per | 1.38 | This work | IR SED: < (2DUST) | – | – |
| 3.85 | Mauron & Josselin (2011) | (JK90)a | RSG | 200 | |
| 3.02 | Jura & Kleinmann (1990) | (JK90)a | RSG | 200 |
A table continued from the previous one. Object References Methodology Type (/yr) SV Peg 3.15 This work IR SED: (2DUST) – – 2.51 Heras & Hony (2005) IR SED: (DUSTY) AGB 75.7 1.50 Olofsson et al. (2002) CO: (Monte Carlo) AGB 200 SV Psc 1.80 This work IR SED: (2DUST) – – 3.31 Heras & Hony (2005) IR SED: (DUSTY) AGB 48.4 TY Dra 1.79 This work IR SED: (2DUST) – – 1.20 Olofsson et al. (2002) CO: (Monte Carlo) AGB 500 U Her 8.18 This work IR SED: (2DUST) – – 1.30 Lane et al. (1987) CO: AGB 200 U Lac 1.21 This work IR SED: < (2DUST) – – 1.15 Mauron & Josselin (2011) (JK90)a RSG 200 1.00 Jura & Kleinmann (1990) (JK90)a RSG 200 VX Sgr 1.22 This work IR SED: (2DUST) – – 1.00 Mauron & Josselin (2011) (JK90)a RSG 200 2.00 Jura & Kleinmann (1990) (JK90)a RSG 200 W Hor 4.83 This work IR SED: (2DUST) – – W Hya 2.71 This work IR SED: (2DUST) – – 6.18 Heras & Hony (2005) IR SED: (DUSTY) AGB 142.5 3.50 Olofsson et al. (2002) CO: (Monte Carlo) AGB 200 W Per 6.67 This work IR SED: (2DUST) – – 1.05 Mauron & Josselin (2011) (JK90)a RSG 200 X Her 2.09 This work IR SED: (2DUST) – – 3.00 Olofsson et al. (2002) CO: (Monte Carlo) AGB 500 X Oph 2.95 This work IR SED: (2DUST) – – 4.70 Heras & Hony (2005) IR SED: (DUSTY) AGB 130.6 YZ Per 1.27 This work IR SED: (2DUST) – – 3.25 Mauron & Josselin (2011) (JK90)a RSG 200 Z Cas 5.49 This work IR SED: < (2DUST) – – Z Cyg 1.76 This work IR SED: (2DUST) – – 8.45 Suh (2004) IR SED: (CSDUST3) AGB – a JK90 refers to the empirical formula of Jura & Kleinmann (1990) which estimates the mass loss rates from the IRAS 60 photometry. This formula is a function of the stellar effective temperature , the stellar luminosity , and the stellar mass
| AH Sco | BI Cyg | FI Lyr | ||||||
|---|---|---|---|---|---|---|---|---|
| 9.14 | 0.69 | |||||||
| 9.50 | 0.74 | 1.65E-12 | 9.50 | 0.74 | 9.50 | 0.71 | 3.25E-13 | |
| 9.70 | 1.21 | 1.02E-11 | 9.70 | 1.21 | 2.08E-12 | |||
| 10.10⋆ | 2.52 | 3.37E-11 | 10.10⋆ | 2.52 | 2.24E-11 | 10.10⋆ | 2.52 | 1.64E-12 |
| 10.70 | 1.02 | 2.10E-12 | 10.70 | 1.02 | 2.59E-13 | 10.50 | 0.94 | 2.39E-13 |
| 11.05 | 0.89 | 11.05 | 0.89 | 11.05 | 0.83 | 2.29E-13 | ||
| 11.30 | 1.08 | 5.17E-12 | 11.30 | 1.08 | 1.44E-12 | 11.30 | 1.02 | 4.42E-13 |
| 15.10 | 0.03 | 15.20 | 0.30 | 7.56E-14 | 15.20 | 0.30 | 3.56E-14 | |
| 15.80 | 0.28 | 3.43E-14 | 15.80 | 0.28 | 3.41E-14 | |||
| 16.10 | 0.29 | 4.67E-14 | 16.10 | 0.29 | ||||
| 16.80 | 0.04 | 3.31E-14 | 16.50 | 0.25 | 16.50 | 0.25 | ||
| 17.40 | 0.03 | 7.05E-15 | 17.80 | 0.27 | 6.42E-14 | 17.80 | 0.27 | 1.60E-14 |
| 17.80⋆ | 11.76 | 2.40E-12 | 17.80⋆ | 11.76 | 1.04E-11 | 17.80⋆ | 11.76 | |
| 18.10 | 0.27 | 3.75E-14 | 18.10 | 0.27 | 8.71E-15 | |||
| 18.98 | 1.42 | 18.98 | 1.42 | 7.03E-13 | 18.98 | 1.42 | 3.08E-14 | |
| 19.36 | 1.45 | 2.47E-13 | 19.36 | 1.45 | 19.36 | 1.45 | 2.30E-13 | |
| 22.30 | 0.30 | 1.50E-14 | 22.30 | 0.30 | ||||
| 22.71 | 1.74 | 2.45E-13 | 22.90 | 0.38 | 4.15E-14 | 22.90 | 0.38 | |
| 23.81 | 1.82 | 3.19E-15 | ||||||
| 23.81 | 1.82 | 23.81 | 1.82 | |||||
| 25.51 | 1.95 | 1.77E-13 | 25.51 | 1.95 | 25.51 | 1.95 | ||
| 27.80 | 0.25 | 5.02E-14 | 27.80 | 0.25 | 3.52E-15 | 27.80 | 0.25 | |
| 28.10 | 0.46 | 6.90E-14 | 28.10 | 0.46 | 28.10 | 0.46 | 1.87E-15 | |
| 28.60 | 0.43 | 1.05E-13 | 28.80 | 0.30 | 2.34E-15 | 28.80 | 0.30 | |
| 29.30 | 0.26 | 1.30E-14 | 29.30 | 0.26 | 29.30 | 0.26 | 4.56E-15 | |
| 30.90 | 0.70 | 5.96E-14 | 30.90 | 0.70 | 6.29E-15 | 30.90 | 0.70 | |
| 31.30 | 0.47 | 2.47E-14 | 31.30 | 0.47 | 31.30 | 0.47 | 1.58E-14 | |
| 32.40 | 0.53 | 9.85E-14 | 32.40 | 0.53 | 8.85E-15 | 32.40 | 0.53 | 1.35E-14 |
| 32.80 | 0.30 | 4.58E-14 | 32.80 | 0.30 | 3.42E-15 | 32.80 | 0.30 | 6.34E-15 |
| 32.80 | 0.30 | 3.42E-15 | 33.20 | 0.30 | 1.67E-14 | |||
| 33.60 | 0.55 | 7.11E-14 | 33.60 | 0.55 | 2.85E-14 | 33.60 | 0.55 | |
| 34.00 | 0.51 | 6.75E-14 | 34.00 | 0.51 | 34.00 | 0.51 | 8.89E-15 | |
| 34.90 | 0.42 | 4.38E-14 | 34.90 | 0.42 | 9.81E-15 | 34.90 | 0.42 | 8.93E-15 |
| 35.90 | 0.27 | 1.76E-15 | 35.90 | 0.27 | 1.71E-15 | 35.90 | 0.27 | 1.85E-15 |
| 36.80 | 0.61 | 5.94E-14 | 36.20 | 0.65 | 36.80 | 0.61 | ||
| 39.90 | 0.84 | 7.71E-14 | 39.90 | 0.84 | 3.83E-15 | 39.90 | 0.84 | 7.46E-15 |
| 40.60 | 0.43 | 4.82E-14 | 40.60 | 0.43 | 3.02E-15 | 40.60 | 0.43 | |
| 42.00 | 0.32 | 1.67E-14 | 42.00 | 0.32 | 2.62E-15 | 42.00 | 0.32 | 3.98E-15 |
| 43.20 | 0.32 | 2.07E-14 | 42.80 | 0.19 | 2.63E-15 | 43.20 | 0.32 | 3.77E-15 |
| 43.60 | 0.20 | 6.45E-15 | 43.60 | 0.20 | 8.89E-16 | 43.60 | 0.20 | |
| 44.20 | 0.46 | 7.47E-15 |
| Mira | PZ Cas | U Her | U Lac | ||||||||
|---|---|---|---|---|---|---|---|---|---|---|---|
| 7.80 | 0.94 | 6.72E-13 | |||||||||
| 8.70 | 1.04 | 1.41E-12 | |||||||||
| 9.50 | 0.74 | 1.20E-11 | 9.50 | 0.71 | 1.34E-12 | 9.50 | 0.17 | 1.49E-13 | 9.20 | 0.10 | 3.83E-14 |
| 10.10 | 0.81 | 1.49E-11 | 10.10 | 0.51 | 10.10 | 0.81 | 2.77E-14 | ||||
| 10.10⋆ | 2.52 | 1.80E-10 | 10.10⋆ | 2.52 | 2.57E-11 | 10.10⋆ | 2.52 | 1.58E-11 | 10.10⋆ | 2.52 | 8.37E-12 |
| 10.50 | 1.00 | 10.80 | 1.30 | 10.50 | 0.53 | 10.50 | 1.00 | ||||
| 11.05 | 0.89 | 11.05 | 0.56 | 2.42E-13 | 11.05 | 0.89 | |||||
| 11.30 | 1.08 | 11.30 | 1.70 | 1.95E-12 | 11.40 | 0.57 | 4.52E-13 | 11.30 | 1.08 | 2.50E-13 | |
| 15.20 | 0.30 | 1.23E-12 | 15.20 | 0.30 | 1.27E-13 | 15.20 | 0.11 | 5.61E-14 | 15.10 | 0.27 | |
| 15.80 | 0.28 | 5.27E-13 | 15.80 | 0.28 | 7.48E-14 | 16.00 | 0.12 | 5.79E-14 | 15.80 | 0.21 | |
| 16.10 | 0.29 | 2.72E-13 | 16.10 | 0.29 | 5.54E-15 | 16.00 | 0.12 | 5.79E-14 | |||
| 16.50 | 0.25 | 16.50 | 0.25 | 16.80 | 0.25 | 16.40 | 0.04 | ||||
| 17.80 | 0.27 | 1.11E-13 | 17.80 | 0.27 | 1.39E-13 | 17.40 | 0.03 | 16.90 | 0.41 | ||
| 17.80⋆ | 11.76 | 1.11E-10 | 17.80⋆ | 11.76 | 1.81E-11 | 17.80⋆ | 11.76 | 17.80⋆ | 11.76 | ||
| 18.10 | 0.27 | 1.82E-13 | 18.10 | 0.27 | 5.15E-14 | 17.70 | 0.24 | 3.84E-14 | 18.00 | 0.27 | 2.33E-14 |
| 18.98 | 1.42 | 1.68E-12 | 18.50 | 0.28 | 5.14E-14 | 18.80 | 0.23 | 3.12E-14 | 19.00 | 0.43 | 6.70E-14 |
| 19.36 | 1.45 | 19.36 | 1.45 | 19.40 | 0.26 | 6.24E-16 | 19.40 | 0.26 | 8.69E-15 | ||
| 22.30 | 0.30 | 3.31E-13 | 22.50 | 0.41 | 1.14E-13 | 22.40 | 0.10 | 7.54E-15 | 22.40 | 0.17 | 8.95E-15 |
| 22.90 | 0.38 | 3.28E-13 | 23.40 | 0.46 | 7.25E-14 | 22.80 | 0.10 | 7.26E-15 | 22.80 | 0.31 | 2.39E-14 |
| 23.81 | 1.82 | 3.99E-13 | 23.81 | 1.82 | 2.51E-14 | 23.81 | 0.18 | 5.01E-16 | 23.81 | 0.18 | 3.68E-15 |
| 24.70 | 0.22 | 3.30E-15 | 24.70 | 0.22 | 2.15E-15 | ||||||
| 25.51 | 1.95 | 25.51 | 1.95 | 1.40E-13 | 25.20 | 0.19 | 5.92E-15 | 25.20 | 0.19 | 2.66E-15 | |
| 26.50 | 0.44 | 3.49E-14 | 26.70 | 0.32 | 1.20E-14 | 26.70 | 0.32 | ||||
| 27.80 | 0.25 | 27.80 | 0.25 | 1.68E-14 | 27.80 | 0.25 | 9.61E-15 | 27.80 | 0.25 | ||
| 28.10 | 0.46 | 28.10 | 0.46 | 28.10 | 0.46 | 3.60E-14 | 28.10 | 0.46 | |||
| 28.80 | 0.30 | 28.80 | 0.30 | 28.80 | 0.17 | 4.05E-16 | 28.80 | 0.17 | |||
| 29.30 | 0.26 | 4.24E-14 | 29.30 | 0.26 | 29.40 | 0.49 | 1.40E-14 | 29.40 | 0.49 | 2.61E-15 | |
| 30.90 | 0.70 | 2.09E-13 | 30.90 | 0.70 | 30.50 | 0.37 | 1.41E-14 | 30.50 | 0.37 | 6.09E-15 | |
| 31.30 | 0.47 | 31.30 | 0.47 | 31.20 | 0.19 | 1.26E-14 | 31.20 | 0.19 | 3.95E-15 | ||
| 32.40 | 0.53 | 1.41E-13 | 32.40 | 0.53 | 3.83E-15 | 32.20 | 0.24 | 1.63E-14 | 32.20 | 0.24 | 4.04E-15 |
| 32.80 | 0.30 | 3.65E-14 | 32.80 | 0.30 | 7.78E-15 | 32.80 | 0.30 | 32.80 | 0.30 | ||
| 33.20 | 0.30 | 1.07E-14 | 33.20 | 0.30 | 6.65E-15 | 33.20 | 0.30 | 5.88E-16 | |||
| 33.60 | 0.55 | 8.34E-14 | 33.60 | 0.40 | 3.61E-14 | 33.60 | 0.55 | 1.94E-14 | 33.60 | 0.55 | 2.97E-15 |
| 34.00 | 0.51 | 1.01E-13 | 34.00 | 0.36 | 34.00 | 0.51 | 7.70E-15 | 34.00 | 0.51 | ||
| 34.90 | 0.42 | 6.43E-14 | 34.80 | 0.31 | 6.54E-15 | 34.90 | 0.42 | 8.40E-15 | 34.90 | 0.42 | 2.59E-15 |
| 35.90 | 0.27 | 1.09E-14 | 35.90 | 0.27 | 4.84E-15 | 35.90 | 0.27 | 1.35E-14 | 35.90 | 0.27 | |
| 36.20 | 0.65 | 1.52E-13 | 36.80 | 0.61 | 9.27E-15 | 36.20 | 0.65 | 1.70E-15 | 36.20 | 0.65 | 1.24E-14 |
| 39.90 | 0.84 | 9.34E-14 | 39.60 | 0.24 | 8.97E-15 | 39.70 | 0.18 | 39.70 | 0.18 | 3.64E-15 | |
| 40.60 | 0.43 | 7.22E-14 | 40.60 | 0.43 | 2.91E-14 | 40.60 | 0.43 | 2.96E-15 | 40.60 | 0.43 | 5.64E-15 |
| 42.00 | 0.32 | 2.49E-14 | 41.60 | 0.31 | 2.27E-14 | 42.00 | 0.32 | 6.09E-15 | 42.00 | 0.32 | 3.32E-15 |
| 42.80 | 0.19 | 2.36E-14 | 42.80 | 0.19 | 6.24E-15 | 43.20 | 0.32 | 2.20E-15 | 43.20 | 0.32 | 1.42E-15 |
| 43.60 | 0.20 | 1.74E-14 | 43.60 | 0.20 | 43.90 | 0.13 | 9.96E-15 | 43.90 | 0.13 | 8.62E-15 | |
| 44.20 | 0.46 | 4.91E-15 | 44.20 | 0.46 | 1.74E-14 |
| R Aql | R Cas | RS Per | ||||||
|---|---|---|---|---|---|---|---|---|
| 8.10 | 0.63 | 1.69E-12 | ||||||
| 9.50 | 0.74 | 6.29E-13 | ||||||
| 9.80 | 0.76 | 1.49E-12 | 10.10 | 0.80 | 10.10 | 0.80 | 8.58E-13 | |
| 10.10⋆ | 2.52 | 5.44E-12 | 10.10⋆ | 2.52 | 5.51E-11 | 10.10⋆ | 2.52 | 8.87E-13 |
| 10.80 | 1.03 | 7.88E-13 | 10.80 | 0.86 | 10.50 | 0.99 | 4.24E-13 | |
| 11.05 | 0.89 | 11.05 | 0.88 | 1.80E-13 | ||||
| 11.30 | 1.08 | 8.97E-13 | 11.30 | 1.07 | 5.70E-12 | 11.30 | 1.07 | 5.66E-13 |
| 15.20 | 0.30 | 15.20 | 0.30 | 3.59E-13 | 15.20 | 0.30 | 5.15E-14 | |
| 15.80 | 0.28 | 15.80 | 0.28 | 1.68E-13 | 15.80 | 0.28 | 5.18E-14 | |
| 16.10 | 0.29 | 16.10 | 0.29 | 16.10 | 0.29 | 2.56E-14 | ||
| 16.80 | 0.25 | 1.31E-14 | 16.50 | 0.25 | 16.50 | 0.25 | 1.25E-14 | |
| 17.80⋆ | 11.76 | 1.04E-12 | 17.80⋆ | 11.76 | 17.80⋆ | 11.76 | 3.63E-12 | |
| 17.80 | 0.27 | 3.84E-14 | 17.80 | 0.27 | 2.35E-14 | 17.80 | 0.27 | 1.75E-14 |
| 18.10 | 0.27 | 5.60E-14 | 18.10 | 0.27 | 6.92E-14 | 18.10 | 0.27 | 5.88E-15 |
| 18.98 | 1.42 | 3.96E-13 | 18.98 | 1.42 | 3.34E-13 | 18.98 | 1.42 | 6.85E-14 |
| 19.36 | 1.45 | 19.36 | 1.45 | 19.36 | 1.45 | |||
| 22.50 | 0.41 | 1.20E-13 | 22.30 | 0.30 | 7.52E-14 | 22.30 | 0.30 | 7.34E-15 |
| 23.40 | 0.46 | 4.64E-14 | 22.90 | 0.38 | 1.37E-14 | 22.90 | 0.38 | 6.02E-15 |
| 23.81 | 1.82 | 3.33E-13 | 23.81 | 1.82 | 23.81 | 1.82 | 5.90E-14 | |
| 25.50 | 1.95 | 3.72E-13 | 25.50 | 1.95 | 25.50 | 1.95 | 3.85E-14 | |
| 26.50 | 0.44 | 3.53E-14 | 27.30 | 0.33 | 2.26E-14 | 26.70 | 0.40 | 1.80E-14 |
| 27.80 | 0.25 | 4.72E-14 | 27.80 | 0.25 | 1.37E-14 | 27.80 | 0.25 | 1.49E-14 |
| 28.10 | 0.46 | 8.91E-15 | 28.10 | 0.46 | 3.94E-14 | 28.20 | 0.17 | 1.19E-15 |
| 28.80 | 0.30 | 1.06E-14 | 28.80 | 0.30 | 2.84E-14 | 28.70 | 0.13 | |
| 29.50 | 0.49 | 7.30E-14 | 29.30 | 0.26 | 3.54E-14 | 29.60 | 0.18 | 2.80E-15 |
| 30.50 | 0.41 | 4.60E-14 | 30.90 | 0.70 | 5.65E-14 | 30.50 | 0.32 | 4.01E-10 |
| 31.30 | 0.47 | 7.76E-14 | 31.30 | 0.47 | 2.79E-14 | 31.30 | 0.38 | |
| 32.10 | 0.48 | 7.32E-14 | 32.40 | 0.53 | 7.33E-14 | 32.30 | 0.29 | |
| 32.80 | 0.30 | 4.56E-14 | 32.80 | 0.30 | 3.37E-14 | 32.80 | 0.20 | |
| 33.20 | 0.30 | 4.52E-14 | 33.20 | 0.30 | 3.13E-14 | 33.00 | 0.20 | |
| 33.60 | 0.40 | 8.10E-14 | 33.60 | 0.55 | 4.71E-14 | 33.50 | 0.20 | |
| 34.00 | 0.36 | 3.66E-14 | 34.00 | 0.51 | 4.75E-14 | 34.00 | 0.26 | 1.83E-15 |
| 34.80 | 0.31 | 3.17E-14 | 34.90 | 0.42 | 2.49E-14 | 35.10 | 0.37 | |
| 35.90 | 0.27 | 1.71E-14 | 35.90 | 0.27 | 35.90 | 0.27 | ||
| 36.80 | 0.61 | 7.70E-14 | 36.20 | 0.65 | 5.39E-14 | 36.50 | 0.33 | |
| 40.00 | 0.42 | 3.65E-14 | 39.90 | 0.84 | 4.38E-14 | 39.90 | 0.42 | |
| 40.70 | 0.43 | 2.88E-14 | 40.60 | 0.43 | 2.66E-14 | 40.60 | 0.43 | |
| 42.00 | 0.32 | 1.03E-14 | 42.00 | 0.32 | 1.88E-14 | 41.80 | 0.31 | |
| 43.00 | 0.19 | 4.28E-15 | 43.20 | 0.32 | 1.91E-14 | 43.20 | 0.32 | |
| 43.60 | 0.20 | 43.70 | 0.39 | 3.19E-14 | 43.70 | 0.39 | ||
| 44.50 | 0.20 | 2.58E-15 | 44.70 | 0.27 | 3.15E-14 | 44.75 | 0.27 | 2.28E-15 |
| RV Cam | RW Cep | RW Cyg | ||||||
|---|---|---|---|---|---|---|---|---|
| 8.10 | 0.63 | 8.10 | 0.73 | 3.66E-13 | 8.10 | 0.63 | 3.25E-13 | |
| 9.50 | 0.74 | 1.21E-12 | ||||||
| 10.10 | 0.81 | 2.06E-13 | 10.20 | 0.61 | 1.09E-12 | 10.10 | 0.81 | 2.04E-12 |
| 10.10⋆ | 2.52 | 1.70E-12 | 10.10⋆ | 2.52 | 3.73E-12 | 10.10⋆ | 2.52 | 2.15E-11 |
| 10.50 | 1.00 | 10.50 | 0.79 | 5.52E-13 | 10.50 | 1.00 | 8.99E-14 | |
| 11.05 | 0.89 | 1.02E-13 | 11.10 | 1.17 | 1.72E-12 | 11.05 | 0.89 | 7.65E-13 |
| 11.30 | 1.08 | 3.50E-14 | 11.30 | 1.19 | 11.30 | 1.08 | 1.64E-12 | |
| 15.20 | 0.30 | 15.20 | 0.30 | 15.20 | 0.30 | 5.14E-14 | ||
| 15.80 | 0.28 | 2.75E-14 | 15.80 | 0.28 | 15.80 | 0.28 | 7.84E-14 | |
| 16.10 | 0.29 | 16.10 | 0.29 | 16.10 | 0.29 | 4.49E-14 | ||
| 16.50 | 0.25 | 16.50 | 0.25 | 16.50 | 0.25 | 1.26E-14 | ||
| 17.80⋆ | 11.76 | 1.28E-12 | 17.80⋆ | 11.76 | 17.80⋆ | 11.76 | 7.93E-12 | |
| 17.80 | 0.27 | 1.93E-14 | 17.80 | 0.27 | 2.22E-14 | 17.80 | 0.27 | 3.28E-14 |
| 18.10 | 0.27 | 2.16E-14 | 18.10 | 0.27 | 18.10 | 0.27 | 7.75E-14 | |
| 18.98 | 1.42 | 1.41E-15 | 18.98 | 1.42 | 9.89E-15 | |||
| 19.36 | 1.45 | 7.95E-15 | 19.36 | 1.45 | 19.30 | 0.29 | 4.09E-14 | |
| 22.30 | 0.30 | 22.30 | 0.30 | 22.30 | 0.30 | 1.34E-14 | ||
| 22.90 | 0.38 | 3.71E-15 | 22.90 | 0.38 | 22.90 | 0.38 | ||
| 23.81 | 1.82 | 23.81 | 1.82 | 23.81 | 1.82 | |||
| 25.50 | 1.95 | 25.51 | 1.95 | 25.50 | 1.95 | |||
| 26.70 | 0.40 | 26.70 | 0.40 | 1.75E-15 | 26.70 | 0.40 | 2.87E-14 | |
| 27.80 | 0.25 | 27.80 | 0.25 | 2.97E-14 | 27.80 | 0.25 | 2.42E-14 | |
| 28.20 | 0.17 | 6.21E-15 | 28.45 | 0.17 | 2.19E-14 | 28.10 | 0.25 | 1.48E-14 |
| 28.70 | 0.13 | 28.70 | 0.13 | 9.91E-15 | 28.70 | 0.13 | 2.13E-14 | |
| 29.30 | 0.18 | 2.91E-15 | 29.60 | 0.18 | 2.12E-14 | 29.60 | 0.18 | 1.95E-14 |
| 30.50 | 0.32 | 7.91E-15 | 30.50 | 0.32 | 2.94E-14 | 30.50 | 0.32 | 4.16E-14 |
| 31.30 | 0.38 | 31.30 | 0.38 | 2.66E-14 | 31.30 | 0.38 | 3.05E-14 | |
| 32.30 | 0.29 | 1.28E-14 | 32.30 | 0.29 | 3.26E-14 | 32.30 | 0.29 | 2.72E-14 |
| 32.80 | 0.20 | 4.07E-15 | 32.80 | 0.20 | 1.79E-14 | 32.80 | 0.20 | 1.57E-14 |
| 33.20 | 0.20 | 1.05E-14 | 33.20 | 0.20 | 1.52E-14 | 33.20 | 0.20 | 1.71E-14 |
| 34.00 | 0.26 | 1.45E-14 | 33.40 | 0.10 | 5.89E-15 | 33.50 | 0.10 | 4.06E-14 |
| 34.20 | 0.15 | 5.52E-15 | 34.20 | 0.15 | 6.19E-15 | 34.20 | 0.15 | 3.02E-15 |
| 35.00 | 0.26 | 7.88E-10 | 35.00 | 0.26 | 1.67E-14 | 34.90 | 0.21 | 1.60E-14 |
| 35.80 | 0.27 | 5.24E-15 | 36.10 | 0.22 | 1.76E-14 | 35.80 | 0.27 | 1.97E-14 |
| 36.80 | 0.22 | 2.11E-15 | 36.80 | 0.22 | 2.75E-14 | 36.30 | 0.22 | 2.52E-14 |
| 39.90 | 0.42 | 3.30E-15 | 39.90 | 0.42 | 1.40E-14 | 39.90 | 0.24 | 3.81E-15 |
| 40.60 | 0.43 | 1.18E-14 | 40.60 | 0.43 | 2.08E-14 | 40.60 | 0.43 | 1.81E-14 |
| 41.50 | 0.31 | 5.34E-15 | 41.50 | 0.31 | 8.27E-15 | 41.50 | 0.31 | 6.84E-15 |
| 43.40 | 0.20 | 3.89E-15 | 43.00 | 0.10 | 3.48E-15 | 43.00 | 0.10 | 2.03E-15 |
| 44.00 | 0.33 | 1.34E-14 | 44.00 | 0.33 | 9.50E-15 | 44.00 | 0.33 | 4.17E-15 |
| 44.50 | 0.13 | 4.70E-15 | 44.50 | 0.13 | 3.63E-15 | 44.50 | 0.13 | 1.28E-15 |
| RX Boo | S Per | SU Per | ||||||
|---|---|---|---|---|---|---|---|---|
| 9.50 | 0.74 | 2.68E-12 | 9.40 | 0.70 | 3.50E-12 | 9.40 | 0.70 | |
| 10.10 | 0.81 | 2.26E-12 | 9.70 | 0.87 | 8.61E-13 | 9.90 | 0.74 | 3.22E-13 |
| 10.10⋆ | 2.52 | 1.74E-11 | 10.10⋆ | 2.52 | 8.21E-12 | 10.10⋆ | 2.52 | 3.01E-12 |
| 10.50 | 1.00 | 1.32E-13 | 10.60 | 0.80 | 2.24E-12 | 10.70 | 1.28 | 6.75E-13 |
| 11.05 | 0.89 | 1.25E-12 | 11.20 | 1.68 | 2.85E-12 | |||
| 11.30 | 1.08 | 3.50E-12 | 11.30 | 1.02 | 2.77E-12 | 11.30 | 0.68 | 1.52E-13 |
| 15.20 | 0.30 | 2.08E-13 | 15.20 | 0.30 | 15.10 | 0.27 | 6.67E-10 | |
| 15.80 | 0.28 | 1.21E-13 | 15.80 | 0.28 | 16.00 | 0.26 | 7.38E-15 | |
| 16.10 | 0.29 | 2.12E-14 | 16.10 | 0.29 | 16.30 | 0.42 | 3.68E-14 | |
| 16.50 | 0.25 | 16.50 | 0.25 | 16.80 | 0.25 | 1.16E-14 | ||
| 17.80⋆ | 11.76 | 1.09E-11 | 17.80⋆ | 11.76 | 2.03E-12 | 17.80⋆ | 11.76 | 5.55E-13 |
| 17.80 | 0.27 | 6.62E-14 | 17.80 | 0.27 | 1.61E-13 | 17.40 | 0.26 | 2.55E-14 |
| 18.10 | 0.27 | 1.25E-13 | 18.10 | 0.27 | 1.04E-13 | |||
| 19.30 | 0.29 | 4.60E-13 | 18.80 | 0.28 | 2.00E-13 | 19.00 | 0.43 | |
| 19.80 | 0.45 | 6.82E-13 | 19.30 | 0.29 | 2.27E-13 | 19.40 | 0.44 | 2.47E-14 |
| 22.30 | 0.30 | 22.30 | 0.30 | 4.03E-14 | 22.00 | 0.50 | ||
| 22.90 | 0.38 | 22.90 | 0.38 | 23.00 | 0.45 | 6.22E-15 | ||
| 23.81 | 1.82 | 23.81 | 1.82 | 23.81 | 0.61 | |||
| 25.50 | 1.95 | 25.50 | 1.95 | |||||
| 26.70 | 0.40 | 5.99E-14 | 26.70 | 0.40 | 4.24E-10 | |||
| 27.80 | 0.25 | 8.16E-14 | 27.80 | 0.25 | 3.67E-14 | 27.80 | 0.17 | 6.08E-15 |
| 28.10 | 0.25 | 7.46E-14 | 28.10 | 0.25 | 1.34E-14 | 28.10 | 0.17 | 6.85E-15 |
| 28.70 | 0.13 | 2.90E-14 | 28.70 | 0.13 | 1.31E-14 | 28.80 | 0.17 | 3.26E-15 |
| 29.60 | 0.18 | 5.50E-14 | 29.60 | 0.27 | 4.98E-14 | 29.20 | 0.13 | |
| 30.50 | 0.32 | 7.22E-14 | 30.50 | 0.32 | 5.44E-14 | 30.80 | 0.28 | 5.58E-15 |
| 31.30 | 0.38 | 7.97E-14 | 31.30 | 0.38 | 4.72E-14 | 31.20 | 0.28 | 1.02E-14 |
| 32.30 | 0.29 | 5.23E-14 | 32.30 | 0.29 | 4.45E-14 | 31.90 | 0.38 | 2.26E-14 |
| 32.80 | 0.20 | 2.56E-14 | 32.80 | 0.20 | 1.78E-14 | 32.50 | 0.34 | 1.62E-14 |
| 33.20 | 0.20 | 3.00E-14 | 33.00 | 0.25 | 3.83E-14 | 33.10 | 0.25 | 5.15E-15 |
| 33.80 | 0.10 | 1.18E-14 | 33.60 | 0.20 | 2.59E-14 | 33.70 | 0.25 | 6.30E-15 |
| 34.00 | 0.26 | 2.08E-14 | 34.00 | 0.26 | 1.54E-14 | 34.00 | 0.15 | 2.61E-15 |
| 34.90 | 0.21 | 34.90 | 0.21 | 2.41E-15 | 34.90 | 0.31 | 5.92E-15 | |
| 35.80 | 0.27 | 2.31E-14 | 36.00 | 0.27 | 1.72E-14 | 35.90 | 0.27 | 6.93E-15 |
| 36.30 | 0.22 | 2.58E-14 | 36.70 | 0.22 | 1.85E-14 | 36.20 | 0.33 | 7.93E-15 |
| 39.90 | 0.24 | 1.17E-14 | 39.70 | 0.24 | 6.68E-15 | 39.90 | 0.84 | |
| 40.60 | 0.43 | 3.13E-14 | 40.60 | 0.43 | 2.26E-14 | 40.60 | 0.43 | 4.47E-15 |
| 42.10 | 0.32 | 1.65E-15 | 41.50 | 0.19 | 1.86E-14 | 41.90 | 0.25 | 4.65E-15 |
| 43.00 | 0.10 | 43.10 | 0.19 | 2.07E-14 | 43.20 | 0.32 | 1.75E-14 | |
| 44.00 | 0.33 | 44.00 | 0.33 | 2.85E-14 | 44.00 | 0.20 | 3.22E-15 | |
| 44.50 | 0.13 | 44.50 | 0.13 | 1.82E-14 | 44.60 | 0.40 | 1.22E-14 |
| SV Peg | SV Psc | TY Dra | ||||||
|---|---|---|---|---|---|---|---|---|
| 9.50 | 0.74 | 9.50 | 0.74 | 1.39E-13 | ||||
| 9.70 | 1.21 | 1.82E-12 | 10.10 | 0.81 | 10.10 | 0.81 | 1.93E-13 | |
| 10.10⋆ | 2.52 | 5.74E-12 | 10.10⋆ | 2.52 | 2.99E-12 | 10.10⋆ | 2.52 | 5.90E-12 |
| 10.50 | 1.00 | 6.25E-13 | 10.50 | 1.00 | 10.50 | 1.00 | ||
| 11.05 | 0.89 | 6.39E-14 | 11.05 | 0.89 | 11.05 | 0.89 | ||
| 11.30 | 1.08 | 2.09E-12 | 11.30 | 1.08 | 1.35E-13 | 11.30 | 1.08 | |
| 15.30 | 0.28 | 1.39E-13 | 15.30 | 0.28 | 4.52E-14 | 15.30 | 0.28 | |
| 15.80 | 0.26 | 8.93E-14 | ||||||
| 16.20 | 0.24 | 1.24E-13 | 16.20 | 0.10 | 2.28E-14 | |||
| 16.80 | 0.25 | 8.00E-14 | 16.80 | 0.25 | 1.42E-14 | 16.40 | 0.17 | |
| 17.50 | 0.18 | 7.82E-14 | 17.50 | 0.18 | 1.39E-14 | 17.70 | 0.19 | 2.24E-14 |
| 17.80⋆ | 11.76 | 2.88E-12 | 17.80⋆ | 11.76 | 1.05E-12 | 17.80⋆ | 11.76 | 1.67E-12 |
| 17.90 | 0.19 | 8.34E-14 | 17.90 | 0.19 | 2.35E-14 | 18.00 | 0.19 | 1.48E-14 |
| 19.00 | 0.43 | 7.30E-14 | 19.00 | 0.43 | 3.42E-14 | 18.85 | 0.57 | 9.38E-14 |
| 19.36 | 0.44 | 2.07E-13 | 19.36 | 0.44 | 5.34E-14 | 19.36 | 0.44 | 1.27E-14 |
| 22.00 | 0.50 | 22.20 | 0.57 | 2.72E-14 | 22.20 | 0.57 | 1.51E-14 | |
| 23.00 | 0.45 | 23.00 | 0.45 | 1.95E-14 | 23.00 | 0.45 | 5.40E-15 | |
| 23.40 | 0.53 | 6.41E-15 | ||||||
| 23.81 | 0.61 | 24.00 | 0.54 | 2.72E-14 | 24.00 | 0.54 | 4.58E-15 | |
| 25.00 | 0.56 | 2.38E-14 | 25.00 | 0.56 | 5.08E-15 | |||
| 26.80 | 0.52 | 1.98E-14 | 26.80 | 0.52 | ||||
| 27.80 | 0.25 | 2.34E-14 | 27.80 | 0.25 | 1.17E-14 | 27.80 | 0.25 | 5.97E-15 |
| 28.40 | 0.55 | 5.58E-14 | 28.40 | 0.55 | 28.30 | 0.34 | 7.89E-15 | |
| 28.60 | 0.60 | 2.93E-14 | 28.60 | 0.60 | 9.04E-10 | 28.60 | 0.30 | 7.64E-15 |
| 29.70 | 0.76 | 7.26E-14 | 29.50 | 0.31 | 9.71E-10 | 29.50 | 0.31 | 5.71E-15 |
| 30.50 | 0.55 | 4.99E-14 | 30.50 | 0.55 | 30.50 | 0.55 | 2.56E-14 | |
| 31.20 | 0.28 | 2.11E-14 | 30.80 | 0.28 | 31.00 | 0.28 | 1.87E-14 | |
| 32.50 | 0.34 | 1.14E-14 | 32.20 | 0.14 | 32.20 | 0.14 | 4.55E-15 | |
| 32.80 | 0.74 | 5.04E-14 | 32.80 | 0.74 | 32.70 | 0.25 | 5.73E-15 | |
| 33.30 | 0.20 | 33.00 | 0.15 | 4.37E-15 | ||||
| 33.60 | 0.55 | 3.65E-14 | 33.60 | 0.55 | 33.70 | 0.56 | 1.29E-14 | |
| 34.00 | 0.15 | 3.52E-15 | 34.00 | 0.15 | 34.00 | 0.15 | 2.89E-15 | |
| 34.90 | 0.31 | 4.20E-15 | 35.10 | 0.16 | 35.10 | 0.47 | 1.02E-14 | |
| 35.90 | 0.27 | 35.80 | 0.27 | 35.90 | 0.59 | 6.32E-10 | ||
| 36.20 | 0.33 | 6.89E-15 | 36.60 | 0.33 | 36.60 | 0.33 | 5.01E-10 | |
| 39.90 | 0.30 | 4.81E-15 | 39.90 | 0.30 | 39.80 | 0.18 | 5.01E-10 | |
| 40.40 | 0.12 | 1.29E-15 | 40.40 | 0.12 | 40.40 | 0.12 | ||
| 41.90 | 0.44 | 2.18E-14 | 41.70 | 0.25 | 41.70 | 0.25 | ||
| 43.20 | 0.32 | 1.53E-15 | 42.80 | 0.19 | 43.20 | 0.32 | ||
| 43.80 | 0.20 | 43.80 | 0.20 | 43.80 | 0.20 | |||
| 44.20 | 0.40 | 2.00E-14 | 44.20 | 0.40 | 44.30 | 0.27 | 9.94E-15 |
| VX Sgr | W Hor | W Hya | ||||||
|---|---|---|---|---|---|---|---|---|
| 8.10 | 0.63 | 8.10 | 0.63 | 8.50 | 0.64 | 2.36E-11 | ||
| 10.10⋆ | 2.52 | 2.12E-10 | 10.10⋆ | 2.52 | 7.22E-12 | 10.10⋆ | 2.52 | 1.65E-10 |
| 10.50 | 1.00 | 10.50 | 1.00 | 10.50 | 1.00 | |||
| 11.05 | 0.89 | 11.05 | 0.89 | 1.51E-13 | 11.05 | 0.89 | 1.57E-12 | |
| 11.50 | 1.10 | 1.73E-11 | 11.50 | 1.10 | 6.59E-13 | 11.50 | 1.10 | 3.12E-11 |
| 15.10 | 0.27 | 1.69E-13 | 15.10 | 0.27 | 6.31E-14 | 15.10 | 0.34 | 2.13E-12 |
| 15.80 | 0.21 | 15.80 | 0.21 | 1.79E-14 | 15.80 | 0.36 | 2.85E-12 | |
| 16.40 | 0.04 | 16.20 | 0.04 | 3.52E-13 | ||||
| 16.90 | 0.41 | 4.45E-13 | 16.40 | 0.04 | 16.90 | 0.41 | 1.41E-12 | |
| 17.80⋆ | 11.76 | 17.80⋆ | 11.76 | 1.20E-12 | 17.80⋆ | 11.76 | ||
| 18.00 | 0.27 | 5.61E-13 | 18.00 | 0.27 | 1.44E-14 | 18.00 | 0.27 | 3.06E-13 |
| 19.00 | 0.43 | 3.47E-13 | 19.00 | 0.43 | 5.17E-14 | 19.00 | 0.43 | 4.66E-13 |
| 19.40 | 0.26 | 3.03E-13 | 19.40 | 0.26 | 4.13E-14 | 19.40 | 0.26 | 2.50E-13 |
| 22.40 | 0.17 | 7.83E-14 | 22.40 | 0.17 | 6.89E-15 | 22.40 | 0.17 | |
| 22.80 | 0.31 | 1.35E-13 | 22.80 | 0.31 | 1.57E-14 | 22.80 | 0.31 | |
| 24.20 | 0.18 | 23.80 | 0.18 | 8.02E-15 | 23.81 | 0.18 | ||
| 24.70 | 0.22 | 24.70 | 0.22 | 1.26E-14 | 24.70 | 0.22 | ||
| 25.20 | 0.19 | 25.20 | 0.19 | 1.03E-14 | 25.20 | 0.19 | ||
| 26.70 | 0.32 | 26.70 | 0.32 | 2.04E-14 | 26.70 | 0.32 | ||
| 27.80 | 0.25 | 7.05E-14 | 27.50 | 0.29 | 1.17E-14 | 27.50 | 0.29 | 2.47E-14 |
| 28.10 | 0.46 | 28.10 | 0.46 | 2.55E-14 | 28.10 | 0.46 | 1.20E-13 | |
| 28.60 | 0.43 | 28.80 | 0.17 | 2.75E-15 | 28.80 | 0.17 | 2.79E-14 | |
| 29.40 | 0.49 | 1.14E-13 | 29.70 | 0.36 | 8.70E-15 | 29.70 | 0.36 | 1.29E-13 |
| 30.50 | 0.37 | 1.16E-13 | 30.50 | 0.50 | 1.79E-14 | 30.50 | 0.50 | 1.97E-13 |
| 31.20 | 0.19 | 6.60E-14 | 31.20 | 0.33 | 1.74E-14 | 31.20 | 0.33 | 1.30E-13 |
| 32.20 | 0.24 | 1.02E-13 | 32.20 | 0.39 | 2.95E-14 | 32.20 | 0.39 | 2.68E-13 |
| 32.80 | 0.30 | 8.85E-14 | 32.80 | 0.39 | 1.64E-14 | 32.90 | 0.39 | 1.90E-13 |
| 33.20 | 0.30 | 1.00E-13 | 33.20 | 0.40 | 1.80E-14 | 33.20 | 0.40 | 7.72E-14 |
| 33.60 | 0.55 | 1.23E-13 | 33.60 | 0.55 | 7.19E-15 | 33.60 | 0.55 | 1.69E-13 |
| 34.00 | 0.51 | 8.95E-14 | 34.00 | 0.51 | 8.92E-15 | 34.00 | 0.51 | 1.16E-13 |
| 34.90 | 0.42 | 1.07E-13 | 35.10 | 0.32 | 7.27E-15 | 35.10 | 0.32 | 8.71E-14 |
| 35.90 | 0.27 | 2.32E-14 | 35.90 | 0.27 | 6.44E-15 | 35.90 | 0.27 | 9.22E-14 |
| 36.20 | 0.65 | 1.92E-13 | 36.50 | 0.38 | 4.44E-15 | 36.50 | 0.38 | 1.24E-13 |
| 39.70 | 0.18 | 2.55E-14 | 39.90 | 0.18 | 3.04E-15 | 39.80 | 0.24 | 2.96E-14 |
| 40.60 | 0.43 | 1.06E-13 | 40.50 | 0.43 | 3.57E-10 | 40.70 | 0.24 | 4.36E-14 |
| 42.00 | 0.32 | 3.22E-14 | 41.80 | 0.31 | 4.37E-15 | 41.80 | 0.31 | 3.75E-14 |
| 43.20 | 0.32 | 3.42E-14 | 43.10 | 0.19 | 43.10 | 0.19 | 4.04E-14 | |
| 43.90 | 0.13 | 1.02E-14 | 43.60 | 0.20 | 43.90 | 0.13 | 1.80E-14 | |
| 44.20 | 0.46 | 1.46E-14 | 44.70 | 0.34 | 44.70 | 0.34 | 6.97E-14 |
| W Per | X Her | X Oph | ||||||
|---|---|---|---|---|---|---|---|---|
| 8.10 | 0.63 | 2.33E-13 | 8.10 | 0.63 | ||||
| 9.50 | 0.17 | 9.20E-14 | ||||||
| 10.10 | 0.81 | 3.03E-13 | 9.80 | 0.51 | 8.13E-13 | 10.10 | 0.81 | 3.31E-13 |
| 10.10⋆ | 2.52 | 6.78E-12 | 10.10⋆ | 2.52 | 7.46E-12 | 10.10⋆ | 2.52 | 3.04E-12 |
| 10.50 | 1.00 | 10.50 | 1.00 | 10.50 | 1.00 | 6.46E-13 | ||
| 11.05 | 0.89 | 11.05 | 0.89 | 11.05 | 0.89 | 8.40E-13 | ||
| 11.50 | 1.10 | 6.41E-13 | 11.50 | 1.10 | 3.51E-13 | 11.50 | 1.10 | 1.10E-12 |
| 15.10 | 0.34 | 1.16E-14 | 15.10 | 0.34 | 15.10 | 0.34 | 7.55E-14 | |
| 15.80 | 0.36 | 3.08E-15 | 15.90 | 0.17 | 15.90 | 0.17 | 2.84E-14 | |
| 16.20 | 0.04 | 1.07E-15 | 16.10 | 0.07 | 16.10 | 0.07 | 3.23E-10 | |
| 16.90 | 0.41 | 16.40 | 0.15 | 16.40 | 0.15 | |||
| 17.00 | 0.23 | 1.38E-13 | 17.50 | 0.11 | ||||
| 17.80⋆ | 11.76 | 4.17E-12 | 17.80⋆ | 11.76 | 1.15E-11 | 17.80⋆ | 11.76 | |
| 18.00 | 0.27 | 3.18E-14 | 18.20 | 0.27 | 1.48E-13 | 18.20 | 0.27 | 3.69E-14 |
| 18.50 | 0.67 | 7.54E-14 | 18.80 | 0.20 | 2.60E-13 | 18.80 | 0.20 | 2.52E-14 |
| 19.40 | 0.26 | 1.66E-14 | 19.80 | 0.74 | 7.13E-13 | 19.40 | 0.26 | 2.85E-14 |
| 22.40 | 0.17 | 2.22E-15 | 22.40 | 0.17 | 2.95E-14 | 22.40 | 0.17 | 3.84E-10 |
| 22.80 | 0.31 | 3.68E-15 | 22.80 | 0.31 | 1.87E-15 | 22.80 | 0.31 | |
| 23.81 | 0.18 | 3.34E-15 | 23.81 | 0.18 | 4.22E-15 | 23.81 | 0.18 | |
| 24.70 | 0.22 | 1.35E-14 | 24.80 | 0.22 | 1.44E-14 | 24.80 | 0.22 | |
| 25.20 | 0.19 | 1.11E-14 | 25.30 | 0.19 | 3.29E-14 | 25.30 | 0.19 | |
| 26.70 | 0.32 | 3.00E-14 | 26.70 | 0.32 | 3.38E-14 | 26.70 | 0.32 | |
| 27.50 | 0.29 | 8.63E-15 | 27.50 | 0.29 | 3.66E-14 | 27.50 | 0.29 | 1.48E-14 |
| 28.10 | 0.46 | 3.58E-15 | 28.30 | 0.42 | 2.33E-14 | 28.10 | 0.46 | 5.23E-10 |
| 28.80 | 0.17 | 9.27E-15 | 28.80 | 0.17 | 28.80 | 0.17 | 1.73E-14 | |
| 29.70 | 0.36 | 1.43E-14 | 29.70 | 0.36 | 3.22E-14 | 29.70 | 0.36 | 6.28E-14 |
| 30.70 | 0.23 | 5.06E-15 | 30.70 | 0.23 | 3.74E-15 | 30.70 | 0.23 | 1.59E-14 |
| 31.20 | 0.33 | 1.15E-14 | 31.20 | 0.33 | 2.70E-14 | 31.20 | 0.33 | 4.02E-14 |
| 32.20 | 0.39 | 3.16E-14 | 32.20 | 0.39 | 3.45E-14 | 32.20 | 0.39 | 5.63E-14 |
| 32.90 | 0.39 | 3.06E-14 | 32.70 | 0.29 | 1.76E-14 | 32.70 | 0.29 | 2.09E-14 |
| 33.20 | 0.40 | 3.70E-15 | 33.10 | 0.30 | 1.99E-14 | 33.10 | 0.30 | 2.51E-14 |
| 33.60 | 0.40 | 2.00E-14 | 33.60 | 0.40 | 1.28E-14 | 33.60 | 0.40 | 2.54E-14 |
| 34.10 | 0.36 | 1.18E-14 | 34.10 | 0.36 | 7.87E-15 | 34.10 | 0.36 | 1.87E-14 |
| 35.10 | 0.32 | 1.63E-14 | 34.90 | 0.31 | 1.52E-14 | 34.90 | 0.31 | 2.27E-14 |
| 35.90 | 0.27 | 2.30E-15 | 35.90 | 0.27 | 5.39E-15 | 35.90 | 0.27 | 1.36E-14 |
| 36.70 | 0.28 | 2.51E-14 | 36.70 | 0.28 | 4.62E-15 | 36.70 | 0.28 | 1.81E-14 |
| 39.80 | 0.18 | 3.67E-15 | 39.80 | 0.18 | 5.70E-15 | 39.80 | 0.18 | 3.43E-15 |
| 40.70 | 0.24 | 7.06E-10 | 40.70 | 0.24 | 2.81E-15 | 40.70 | 0.24 | 1.44E-14 |
| 41.80 | 0.31 | 7.89E-15 | 41.80 | 0.31 | 41.70 | 0.25 | 2.98E-15 | |
| 43.20 | 0.19 | 2.00E-15 | 43.20 | 0.19 | 2.97E-15 | 43.00 | 0.19 | 9.74E-15 |
| 43.60 | 0.20 | 43.60 | 0.20 | 43.60 | 0.20 | 7.02E-15 | ||
| 44.70 | 0.34 | 44.70 | 0.34 | 4.84E-15 | 44.70 | 0.34 | 2.08E-14 |
| YZ Per | Z Cas | Z Cyg | ||||||
|---|---|---|---|---|---|---|---|---|
| 8.50 | 1.02 | 1.82E-12 | ||||||
| 9.30 | 0.03 | 9.50 | 0.17 | 9.50 | 0.85 | 1.12E-12 | ||
| 10.10 | 0.81 | 3.27E-13 | 10.10 | 0.81 | 3.65E-15 | 10.10 | 0.81 | |
| 10.10⋆ | 2.52 | 3.42E-12 | 10.10⋆ | 2.52 | 7.58E-13 | 10.10⋆ | 2.52 | 6.12E-12 |
| 10.50 | 1.00 | 10.50 | 1.00 | 10.50 | 1.00 | |||
| 11.05 | 0.89 | 1.11E-13 | 11.05 | 0.89 | 9.14E-14 | 11.05 | 0.89 | |
| 11.50 | 1.10 | 1.73E-13 | 11.50 | 1.10 | 3.01E-13 | 11.50 | 1.10 | 2.57E-13 |
| 15.30 | 0.18 | 5.37E-15 | 15.50 | 0.28 | 1.41E-14 | 15.10 | 0.18 | |
| 15.90 | 0.17 | 15.90 | 0.17 | 9.26E-15 | 15.50 | 0.28 | ||
| 16.20 | 0.15 | 16.20 | 0.15 | 2.34E-15 | 16.20 | 0.15 | 1.37E-15 | |
| 16.40 | 0.15 | 16.70 | 0.15 | 6.69E-15 | 16.50 | 0.20 | ||
| 17.60 | 0.13 | 17.80 | 0.21 | 1.80E-14 | 17.50 | 0.13 | 1.14E-14 | |
| 17.80⋆ | 11.76 | 17.80⋆ | 11.76 | 8.19E-13 | 17.80⋆ | 11.76 | 1.28E-12 | |
| 18.20 | 0.27 | 2.37E-14 | 18.30 | 0.27 | 2.44E-14 | 18.00 | 0.16 | 1.90E-14 |
| 18.70 | 0.20 | 1.71E-14 | 19.00 | 0.17 | 1.67E-14 | 19.00 | 0.17 | 4.50E-14 |
| 19.40 | 0.17 | 3.92E-15 | 19.40 | 0.17 | 6.25E-15 | 19.70 | 0.68 | 1.28E-13 |
| 22.40 | 0.17 | 4.73E-15 | 22.40 | 0.17 | 22.10 | 0.40 | 5.21E-14 | |
| 22.80 | 0.31 | 1.19E-14 | 22.80 | 0.31 | 23.20 | 0.31 | 4.60E-14 | |
| 23.50 | 0.63 | 2.18E-14 | 23.30 | 0.28 | 6.30E-15 | 23.70 | 0.57 | 7.49E-14 |
| 24.10 | 0.54 | 1.74E-14 | 24.10 | 0.33 | ||||
| 24.50 | 0.18 | 4.55E-15 | 24.50 | 0.18 | 24.40 | 0.44 | 5.87E-14 | |
| 25.00 | 0.60 | 2.55E-14 | 25.30 | 0.30 | 25.20 | 0.42 | 4.77E-14 | |
| 26.00 | 0.20 | 9.75E-15 | 27.00 | 0.24 | 26.30 | 0.63 | 2.86E-14 | |
| 27.50 | 0.29 | 9.47E-15 | 27.50 | 0.33 | 2.63E-15 | 27.40 | 0.33 | 1.49E-14 |
| 28.20 | 0.25 | 8.17E-15 | 28.20 | 0.17 | 5.70E-15 | 28.20 | 0.30 | 2.07E-14 |
| 28.80 | 0.17 | 28.90 | 0.13 | 1.22E-15 | 29.10 | 0.22 | 1.16E-14 | |
| 29.70 | 0.36 | 1.69E-14 | 29.70 | 0.36 | 1.13E-14 | 29.70 | 0.18 | 5.41E-15 |
| 30.70 | 0.23 | 30.50 | 0.23 | 2.42E-15 | 30.50 | 0.18 | 9.99E-15 | |
| 31.20 | 0.33 | 1.49E-14 | 31.20 | 0.33 | 1.09E-14 | 31.00 | 0.23 | 1.01E-14 |
| 32.20 | 0.39 | 1.47E-14 | 32.00 | 0.14 | 3.10E-15 | 32.30 | 0.15 | 4.94E-15 |
| 32.50 | 0.29 | 1.13E-14 | 32.50 | 0.29 | 1.37E-14 | 32.80 | 0.30 | 4.82E-15 |
| 33.10 | 0.30 | 9.67E-15 | 33.10 | 0.30 | 1.03E-14 | 33.20 | 0.15 | 4.17E-15 |
| 33.60 | 0.40 | 1.30E-14 | 33.60 | 0.40 | 1.19E-14 | 33.50 | 0.25 | 6.05E-15 |
| 34.20 | 0.26 | 4.79E-15 | 34.00 | 0.15 | 6.33E-15 | 34.20 | 0.15 | 7.52E-15 |
| 34.90 | 0.31 | 1.57E-14 | 34.90 | 0.16 | 4.85E-15 | 34.90 | 0.42 | 6.34E-15 |
| 35.90 | 0.27 | 4.45E-15 | 35.90 | 0.27 | 4.42E-15 | 35.90 | 0.27 | 4.16E-15 |
| 36.70 | 0.28 | 7.45E-15 | 36.30 | 0.27 | 2.30E-10 | 36.90 | 0.17 | 3.99E-15 |
| 40.00 | 0.30 | 3.11E-15 | 39.80 | 0.12 | 39.90 | 0.24 | 3.73E-15 | |
| 40.70 | 0.24 | 40.70 | 0.24 | 7.11E-15 | 40.60 | 0.43 | 4.86E-15 | |
| 41.70 | 0.25 | 3.96E-15 | 41.70 | 0.13 | 6.23E-15 | 41.70 | 0.19 | 9.46E-15 |
| 43.10 | 0.13 | 2.93E-15 | 42.70 | 0.26 | 42.70 | 0.19 | 3.79E-15 | |
| 43.90 | 0.07 | 3.73E-10 | 43.60 | 0.20 | 43.20 | 0.13 | 2.27E-15 | |
| 44.70 | 0.34 | 44.70 | 0.34 | 9.59E-15 | 44.70 | 0.13 | 2.89E-15 |
| This work | Molster et al. | (2002b) | |||||||||
|---|---|---|---|---|---|---|---|---|---|---|---|
| 8.14 | 7.80 | 8.50 | 0.70 | 0.63 | 1.02 | 8.30 | 8.20 | 8.40 | 0.42 | 0.41 | 0.43 |
| 8.99 | 8.70 | 9.14 | 0.81 | 0.69 | 1.04 | 9.14 | 9.12 | 9.17 | 0.30 | 0.24 | 0.68 |
| 9.46 | 9.20 | 9.50 | 0.53 | 0.03 | 0.85 | 9.45 | 9.45 | 9.46 | 0.19 | 0.15 | 0.25 |
| 10.01 | 9.70 | 10.20 | 0.82 | 0.51 | 1.21 | 9.80 | 9.77 | 9.84 | 0.17 | 0.14 | 0.29 |
| 10.10⋆ | 10.10 | 10.10 | 2.52 | 2.52 | 2.52 | 10.10⋆ | 9.59 | 10.61 | 2.56 | 1.30 | 3.77 |
| 10.55 | 10.50 | 10.80 | 0.98 | 0.53 | 1.30 | 10.70 | 10.57 | 10.90 | 0.28 | 0.11 | 0.66 |
| 11.06 | 11.05 | 11.20 | 0.88 | 0.01 | 1.68 | 11.05 | 11.04 | 11.06 | 0.05 | 0.03 | 0.11 |
| 11.36 | 11.30 | 11.50 | 1.07 | 0.57 | 1.70 | 11.40 | 11.33 | 11.50 | 0.48 | 0.38 | 0.86 |
| 15.19 | 15.00 | 15.50 | 0.28 | 0.03 | 0.46 | 15.20 | 15.00 | 15.42 | 0.26 | 0.13 | 0.73 |
| 15.81 | 15.50 | 16.00 | 0.28 | 0.12 | 1.19 | 15.90 | 15.69 | 16.06 | 0.43 | 0.24 | 0.65 |
| 16.14 | 16.00 | 16.40 | 0.21 | 0.04 | 0.42 | 16.20 | 16.10 | 16.37 | 0.16 | 0.08 | 0.62 |
| 16.60 | 16.40 | 16.90 | 0.25 | 0.04 | 0.68 | 16.50 | 16.49 | 16.50 | 0.11 | 0.11 | 0.11 |
| 17.80⋆ | 17.80 | 17.80 | 11.76 | 11.76 | 11.76 | 17.50⋆ | 16.79 | 18.46 | 2.10 | 0.81 | 3.66 |
| 17.60 | 16.90 | 17.80 | 0.24 | 0.03 | 0.61 | 17.50 | 17.43 | 17.61 | 0.18 | 0.13 | 0.36 |
| 18.08 | 17.70 | 18.40 | 0.26 | 0.16 | 0.44 | 18.00 | 17.90 | 18.16 | 0.48 | 0.28 | 1.24 |
| 18.92 | 18.50 | 19.30 | 0.69 | 0.17 | 1.42 | 18.90 | 18.43 | 19.17 | 0.62 | 0.36 | 1.20 |
| 19.41 | 19.30 | 19.80 | 0.74 | 0.17 | 1.45 | 19.50 | 19.36 | 19.75 | 0.40 | 0.14 | 0.86 |
| 22.30 | 22.00 | 22.50 | 0.34 | 0.10 | 1.06 | 22.40 | 22.26 | 22.51 | 0.28 | 0.16 | 0.55 |
| 22.92 | 22.71 | 23.40 | 0.43 | 0.10 | 1.74 | 23.00 | 22.82 | 23.14 | 0.48 | 0.28 | 0.72 |
| 23.65 | 23.30 | 23.90 | 0.73 | 0.18 | 1.82 | 23.70 | 23.45 | 23.81 | 0.79 | 0.54 | 1.29 |
| 23.83 | 22.90 | 24.20 | 0.95 | 0.18 | 1.82 | 23.89 | 23.88 | 23.90 | 0.18 | 0.13 | 0.25 |
| 24.64 | 24.40 | 24.80 | 0.27 | 0.18 | 0.73 | 24.50 | 24.16 | 24.65 | 0.42 | 0.16 | 1.04 |
| 25.32 | 24.80 | 25.51 | 1.13 | 0.19 | 1.95 | 25.00 | 24.83 | 25.14 | 0.32 | 0.25 | 0.53 |
| 26.68 | 26.00 | 27.30 | 0.41 | 0.20 | 1.11 | 26.80 | 26.71 | 26.93 | 0.37 | 0.21 | 0.47 |
| 27.71 | 27.40 | 27.80 | 0.28 | 0.17 | 0.54 | 27.60 | 27.46 | 27.79 | 0.49 | 0.28 | 1.18 |
| 28.17 | 28.00 | 28.50 | 0.37 | 0.08 | 0.64 | 28.20 | 27.97 | 28.45 | 0.42 | 0.23 | 0.90 |
| 28.76 | 28.60 | 29.10 | 0.25 | 0.13 | 0.60 | 28.80 | 28.68 | 28.88 | 0.24 | 0.19 | 0.42 |
| 29.52 | 29.20 | 29.85 | 0.33 | 0.13 | 0.79 | 29.60 | 29.37 | 29.90 | 0.89 | 0.58 | 1.99 |
| 30.62 | 30.40 | 30.90 | 0.43 | 0.18 | 0.70 | 30.60 | 30.48 | 30.77 | 0.32 | 0.18 | 0.81 |
| 31.22 | 30.80 | 31.30 | 0.37 | 0.19 | 0.89 | 31.20 | 31.12 | 31.27 | 0.24 | 0.21 | 0.36 |
| 32.24 | 31.90 | 32.50 | 0.36 | 0.14 | 0.63 | 32.20 | 32.06 | 32.51 | 0.46 | 0.24 | 0.75 |
| 32.75 | 32.50 | 32.90 | 0.32 | 0.20 | 0.74 | 32.80 | 32.56 | 33.03 | 0.60 | 0.36 | 1.00 |
| 33.10 | 32.71 | 33.30 | 0.32 | 0.15 | 0.74 | 32.97 | 32.96 | 32.99 | 0.20 | 0.11 | 0.28 |
| 33.61 | 33.40 | 34.00 | 0.42 | 0.10 | 0.60 | 33.60 | 33.45 | 33.71 | 0.70 | 0.52 | 1.15 |
| 34.06 | 34.00 | 34.40 | 0.34 | 0.15 | 0.51 | 34.10 | 33.93 | 34.36 | 0.36 | 0.17 | 0.74 |
| 34.94 | 34.80 | 35.10 | 0.33 | 0.16 | 0.47 | 34.90 | 34.67 | 35.35 | 1.36 | 0.63 | 1.88 |
| 35.90 | 35.80 | 36.10 | 0.30 | 0.22 | 0.65 | 35.90 | 35.76 | 36.20 | 0.53 | 0.37 | 0.88 |
| 36.52 | 36.20 | 36.90 | 0.41 | 0.17 | 0.65 | 36.50 | 36.44 | 36.72 | 0.39 | 0.25 | 0.97 |
| 39.84 | 39.60 | 40.00 | 0.41 | 0.12 | 0.89 | 39.80 | 39.44 | 40.36 | 0.74 | 0.21 | 2.57 |
| 40.59 | 40.40 | 40.70 | 0.36 | 0.12 | 0.49 | 40.50 | 40.34 | 40.80 | 0.93 | 0.53 | 1.53 |
| 41.83 | 41.50 | 42.20 | 0.30 | 0.13 | 0.51 | 41.80 | 41.52 | 42.11 | 0.72 | 0.42 | 1.73 |
| 43.07 | 42.70 | 43.40 | 0.24 | 0.10 | 0.45 | 43.00 | 42.55 | 43.07 | 0.89 | 0.51 | 1.59 |
| 43.76 | 43.20 | 44.00 | 0.22 | 0.07 | 0.39 | 43.80 | 43.30 | 44.05 | 0.78 | 0.41 | 3.01 |
| 44.53 | 44.20 | 45.00 | 0.32 | 0.13 | 0.54 | 44.70 | 44.39 | 45.13 | 0.58 | 0.42 | 1.16 |