Statistical and Computational Guarantees of Lloyd’s Algorithm and Its Variants
Abstract
Clustering is a fundamental problem in statistics and machine learning. Lloyd’s algorithm, proposed in 1957, is still possibly the most widely used clustering algorithm in practice due to its simplicity and empirical performance. However, there has been little theoretical investigation on the statistical and computational guarantees of Lloyd’s algorithm. This paper is an attempt to bridge this gap between practice and theory. We investigate the performance of Lloyd’s algorithm on clustering sub-Gaussian mixtures. Under an appropriate initialization for labels or centers, we show that Lloyd’s algorithm converges to an exponentially small clustering error after an order of iterations, where is the sample size. The error rate is shown to be minimax optimal. For the two-mixture case, we only require the initializer to be slightly better than random guess.
In addition, we extend the Lloyd’s algorithm and its analysis to community detection and crowdsourcing, two problems that have received a lot of attention recently in statistics and machine learning. Two variants of Lloyd’s algorithm are proposed respectively for community detection and crowdsourcing. On the theoretical side, we provide statistical and computational guarantees of the two algorithms, and the results improve upon some previous signal-to-noise ratio conditions in literature for both problems. Experimental results on simulated and real data sets demonstrate competitive performance of our algorithms to the state-of-the-art methods.
1 Introduction
Lloyd’s algorithm, proposed in 1957 by Stuart Lloyd at Bell Labs [40], is still one of the most popular clustering algorithms used by practitioners, with a wide range of applications from computer vision [3], to astronomy [45] and to biology [26]. Although considerable innovations have been made on developing new provable and efficient clustering algorithms in the past six decades, Lloyd’s algorithm has been consistently listed as one of the top ten data mining algorithms in several recent surveys [55].
Lloyd’s algorithm is very simple and easy to implement. It starts with an initial estimate of centers or labels and then iteratively updates the labels and the centers until convergence. Despite its simplicity and a wide range of successful applications, surprisingly, there is little theoretical analysis on explaining the effectiveness of Lloyd’s algorithm. It is well known that there are two issues with Lloyd’s algorithm under the worst case analysis. First, as a greedy algorithm, Lloyd’s algorithm is only guaranteed to converge to a local minimum [43]. The -means objective function that Lloyd’s algorithm attempts to minimize is NP-hard [14, 41]. Second, the convergence rate of Lloyd’s algorithm can be very slow. Arthur and Vassilvitskii [6] construct a worst-case showing that Lloyd’s algorithm can require a superpolynomial running time.
A main goal of this paper is trying to bridge this gap between theory and practice of Lloyd’s algorithm. We analyze its performance on the Gaussian mixture model [47, 52], a standard model for clustering, and consider the generalization to sub-Gaussian mixtures, which includes binary observations as a special case. Specifically, we attempt to address following questions to help understand Lloyd’s algorithm: How good does the initializer need to be? How fast does the algorithm converge? What separation conditions do we need? What is the clustering error rate and how it is compared with the optimal statistical accuracy?
Despite the popularity of Lloyd’s algorithm as a standard procedure for the k-means problem, to the best of our knowledge, there is little work in statistics to understand the algorithm. Some efforts have been made by computer scientists to develop effective initialization techniques for Lloyd’s algorithm [7, 46, 4]. Their main focus is to find polynomial-time approximation scheme of the k-means objective function rather than to identify the cluster labels of data points, which is often the primary interest for many applications. It is worthwhile to emphasize that when the signal-to-noise ratio is not sufficiently large, a small k-means objective function value does not necessarily guarantee a small clustering error. Furthermore, the error rate is different from the optimal error of an exponential form. Recently, some fascinating results by Kumar and Kannan [37] and Awasthi and Sheffet [8] show that under certain strong separation conditions, the Lloyd’s algorithm initialized by spectral clustering correctly classifies all data points with high probability. However, they focus on the strong consistency results and the clustering error rate of the Lloyd’s algorithm remains unclear. It is desirable to have a systematic study of Lloyd’s algorithm under various separation conditions such that the strong consistency can be included as a special case.
Lloyd’s algorithm is an iterative procedure. Its analysis can be challenging due to dependence between iterative steps. In the statistics literature, various two-stage estimators, or more precisely, two-step estimators, have been proposed to successfully solve some very important non-convex problems, for example, sparse principle analysis [10, 54], community detection [22, 23], mixture of linear regression [11, 58] and crowdsourcing [60, 21]. For all those problems, under a strong assumption that the initial estimator is consistent, one-step update in the second stage usually leads us to a minimax optimal estimator. However, as observed in various simulation or real data studies in [60] and [22], the initial estimator may perform poorly, and more iterations in the second stage keeps driving down the clustering error. Unfortunately, due to some technical difficulties, theoretical analyses in [60] and [22] restrict to one-step iteration.
1.1 Our contributions
In this paper, we give a considerably weak initialization condition under which Lloyd’s algorithm converges to the optimal label estimators of sub-Gaussian mixture model. While previous results [37, 8] focus on exact recovery (strong consistency) of the labels, we obtain the clustering error rates of Lloyd’s algorithm under various signal-to-noise levels. As a special case, we obtain exact recovery with high probability when the signal-to-noise level is bigger than . The signal-to-noise ratio condition for exact recovery is weaker than the state-of-the-art result [8]. In contrast to previous two-stage (two-step) estimators, our analyses go beyond one-step update. We are able to show a linear convergence to the statistical optimal error rate for Lloyd’s algorithms and its two variants for community detection and crowdsourcing.
We illustrate our contributions here by considering the problem of clustering two-component spherical Gaussian mixtures, with symmetric centers and and variance . See Section 2 for more details. Let be the sample size and be the normalized signal-to-noise ratio. We establish the following basin of attractions of Lloyd’s algorithm.
Theorem 1.1.
Assume and for a sufficiently large constant . For symmetric, two-component spherical Gaussian mixtures, given any initial estimator of labels with clustering error
Lloyd’s algorithm converges linearly to an exponentially small rate after iterations, which is the minimax rate as w.h.p.
The results above are extended to general number of clusters and to (non-spherical) sub-Gaussian distributions under an appropriate initialization condition and a signal-to-noise ratio condition, which, to the best of our knowledge, are the weakest conditions in literature.
Now we discuss the contributions of this paper in detail. Our contributions are three folds. First, we give statistical guarantees of Lloyd’s algorithm. Starting with constant clustering error, by an appropriate initializer, such as spectral clustering, we show an exponentially small clustering error rate of Lloyd’s algorithms, under a weak signal-to-noise ratio condition. We also provide a rate-matching lower bound to show that Lloyd’s algorithm initialized by spectral clustering is minimax optimal. When the clusters sizes are of the same order and the distance between different centers are of the same order, our signal-to-noise condition reduces to , where is the minimum Euclidean distances between two different cluster centers. Previous results on Lloyd’s algorithms focus on exact recovery of the labels and they assume sample size [37, 8]. The best known signal-to-noise ratio condition is [8]. Our condition is weaker by a factor. Moreover, our results also hold for the high-dimensional case where could be larger than .
Second, we provide computational guarantees of Lloyd’s algorithm. We prove a linear convergence rate of Lloyd’s iterations given a label initializer of constant clustering error. The linear convergence rate depends on the signal-to-noise ratio. Larger signal-to-noise ratio leads to faster convergence rate. Counterexamples are constructed in the appendix to show that the basin of attractions we establish in Theorem 1.1 and in the general case are almost necessary. It is worthwhile to point out that the initialization condition in Theorem 1.1 is just slightly stronger than random guess. As implied by the minimax lower bound (Theorem 3.3), a necessary condition for consistently estimating the labels is . In addition, when , we are able to prove a random initialization scheme works with high probability.
Third, we develop new proof techniques for analyzing two-stage estimators. Previous analyses usually require the first stage’s estimator to be consistent to achieve the minimax optimal rates [60, 22]. In contrast, we only need a constant clustering error of the first stage estimator by introducing a new technique to analyze random indicator functions. In addition, we are able to improve previous signal-to-noise ratio conditions in community detection and crowdsourcing by considering two variants of Lloyd’s algorithms. Simulated and real data experiments show our algorithms are competitive as compared to the state-of-the-art algorithms for both problems.
1.2 Related work on Gaussian mixture models
The study of Gaussian mixture model [47] has a long and rich history. We give a very brief review here. In the original paper of Pearson [47], methods of moments estimators were first proposed, followed by the work of [18, 39]. They all involve solving high-order moments equations, which is computationally challenging as the sample size or the dimensionality grows. Recently, third-order moments was proved to be sufficient by using tensor decomposition techniques [12, 5, 28]. However, their sample size requirement is in high-order polynomial of and thus can not be extended to the high-dimensional case. Another line of research focuses on spectral projections and their variants. By using different dimension reduction technique, they keep improving the separation condition for general Gaussian mixture models [42, 1, 33, 44, 25] and spherical Gaussian mixture models [53]. These works almost all focus on estimating the centers. Little is known about the convergence rate of estimating the cluster labels.
Another popular algorithm for Gaussian mixture model is the EM algorithm [19]. [57] analyzed the local convergence of EM for well-separated Gaussian mixtures. [15] showed that a two-round variant of EM algorithm with a special initializer is consistent under a strong separation condition that . Recently, a lot of attention has been gained on the computational guarantees of EM algorithm. Two component, symmetric Gaussian mixture is most widely studied due to its simple structure. For this model, [9] first proves the linear convergence of EM if the center is initialized in a small neighborhood of the true parameters, which implies an exponentially small error rate of labels after one-step label update. [36] extends their basin of attraction to be the intersection of a half space and a ball near the origin. More recently, [56, 16] prove the global convergence of the EM algorithm given infinite samples. While these results are encouraging, it is unclear whether their technique can be generalized to the -mixtures or non-Gaussian cases. [30] provides some interesting negative results of EM algorithms. When , counterexamples are constructed to show there is no general global convergence of EM algorithm by uniformly initializing the centers from data points.
1.3 Organization and Notation
The rest of this paper is organized as follows. We introduce the sub-Gaussian mixture problem and Lloyd’s algorithm in Section 2. Section 3 gives statistical and computational guarantees of Lloyd’s algorithm, and discusses their implications when using spectral initialization. In Section 4, we consider two variants of Lloyd’s algorithms for community detection and crowdsourcing and establish their theoretical properties. A number of experiments are conducted in Section 5 that confirm the sharpness of our theoretical findings and demonstrate the effectiveness of our algorithms on real data. In Section 6, we discuss our results on random initialization and the error of estimating centers. Finally, we present the main proofs in Section 7, with more technical part of the proofs deferred to the appendix.
Throughout the paper, let for any positive integer . For any vector , is the norm of . is the indicator function. Given two positive sequences and , means there is a universal constant such that for all , and define vice versa. We write if and . Denote if as
2 Model and Lloyd’s algorithm
In this section, we first introduce the mixture of sub-Gaussians, a standard model for -means, then briefly review Lloyd’s algorithm, followed by introducing spectral clustering algorithms as a way of initialization.
2.1 Mixture of sub-Gaussians
Suppose we observe independent samples from a mixture of sub-Gaussian distributions,
| (1) |
where are the underlying labels, and are unknown centers of those distributions. We assume the noise are independent zero mean sub-Gaussian vectors with parameter , i.e.
| (2) |
A special case of model (1) is the symmetric, two-component mixture model, in which the two centers are and . We observe from the following generative model,
| (3) |
where and are independent Gaussian noise with covariance matrix . Here with a little abuse of notation, we also use to denote the underlying labels. As arguably the simplest mixture model, this special model has recently gained some attention in studying the convergence of EM algorithm [9, 36, 56]. Other examples of model (1) are planted partition model [42] for random graphs, stochastic block model [27] for network data analysis and Dawid-Skene model [17] for crowdsourcing (see Section 4 for more tails).
For these clustering problems, our main goal is to recover the unknown labels rather than to estimate the centers . Note that the cluster structure is invariant to the permutations of label symbols. We define the mis-clustering rate of estimated labels as
| (4) |
where is the collection of all the mappings from to .
2.2 Lloyd’s Algorithm
Lloyd’s algorithm was originally proposed to solve the following -means problem. Given vectors and an integer , the goal is to find points to minimize the following objective function
| (5) |
The problem above is equivalent to find and such that
| (6) |
From a statistical point of view, (6) is the maximum likelihood estimator of model (1) with spherical Gaussian noise. It has been proved by Pollard [50, 48] the strong consistency and central limit theorem of using (5) to estimate the centers .
Lloyd’s algorithm is simply motivated by the following observation of (6). If we fix , is the index of the center that is closest to, and if we fix , is the sample mean of those with . If we start with an initial estimate of centers or labels, we can iteratively update the labels and centers. Therefore, we have the following Lloyd’s algorithm.
-
1.
Get an initial estimate of the centers or the labels.
-
2.
Repeat the following iteration until convergence.
-
2a.
For ,
(7) -
2b.
For ,
(8)
-
2a.
For model (3), since the centers are parametrized by a single vector , the center update step (7) can be simplified to
| (9) |
Lloyd’s algorithm is guaranteed to converge because it is a greedy algorithm that keeps decreasing the value of objective function (6). However, it may only converge to a local minimum and thus a good initializer is needed. One possible way of initializing Lloyd’s algorithm is to use spectral methods. Note that the signal matrix in model (1) is low rank. Spectral methods first do a de-noising step by projecting the data onto the subspace spanned by its top singular vectors, which approximately preserves the clustering structure. Since solving the -means problem is NP-hard in general [14], we run an approximated -means algorithm [51] on the projected data matrix, whose running time is polynomial in and . There are many versions of spectral clustering algorithms and here is the pseudo code of the one used in this paper.
-
1.
Compute the SVD of the data matrix . Let be the first columns of .
-
2.
Project onto , i.e. let for .
-
3.
Run a -approximation algorithm [51] for -means problem on the columns of projected matrix .
We refer this algorithm as spectral clustering algorithm henceforth. A lot of progress has been made in studying theoretical properties of this spectral clustering algorithm. For more details, we refer to [34, 8] and references therein.
3 Clustering sub-Gaussian mixtures
In this section, we present the results of using Lloyd’s algorithm to clustering sub-Gaussian mixtures. In Section 3.1, we give the convergence results of Lloyd’s algorithm to the symmetric, two component mixture model (3). Then we extend it to the general mixture model (1) in Section 3.2. A minimax lower bound is established in Section 3.3.
3.1 Two mixtures
A key quantity in determining the basin of attraction of Lloyd’s algorithm is the following normalized signal-to-noise ratio
where . Here we normalize the signal-to-noise ratio by because the statistical precision of estimating is at the order of . If , information theoretically we could not distinguish between two centers with positive probability, even when the labels are known. Let be the mis-clustering rate at the iteration of Lloyd’s algorithm, and be the estimated centers at step , . We have the following theorem that characterizes the behavior of .
Theorem 3.1.
Assume and for a sufficiently large constant . For any given (data dependent) initializer satisfying
| (10) |
with probability , we have
| (11) |
with probability greater than , and
| (12) |
with probability greater than . Moreover, if as , the error rate in (12) can be improved to .
The proof of Theorem 3.1 is given in Section 7. We will first show that after a few iterations, the mis-clustering ratio is sufficiently small (for example, smaller than 1/8) by proving , then prove mis-clustering rate of Lloyd’s algorithm is exponentially small with an exponent determined by the signal-to-noise ratio. Note that the mis-clustering rate only takes discrete values in . If , (12) implies , and thus Theorem 3.1 guarantees a zero clustering error after Lloyd’s iterations with high probability.
By Theorem 3.1, the convergence of Lloyd’s algorithm has three stages. In the first iteration, it escapes from a small neighborhood around and achieves an error rate for a small constant . Then it has a linear convergence rate, which depends on the signal-to-noise ratio. Finally, similar to other two-stage estimators [60, 22], once the the mis-clustering rate is sufficiently small, it converges to the optimal statistical precision of the problem after one or more iterations.
As we shall see in Section 3.3, a necessary condition for consistently estimating the labels is . Therefore, our condition on the initializer is just slightly stronger than the random initialization error . Balakrishnan et al. [9] studied the convergence of EM algorithm under the same model. They require an initializer under the assumption that is sufficiently large. Here we replace by a factor close to in Theorem 3.1. More specifically, the factor in the initialization condition is determined by the signal-to-noise ratio. The stronger the signal-to-noise ratio is, the weaker initialization condition we need.
3.2 mixtures
Now we consider general number of mixtures. To better present our results, we first introduce some notation. For all , let be the true cluster and be the estimated cluster at iteration . Define , and . The mis-clustering rate at iteration can be written as
We define a cluster-wise mis-clustering rate at iteration as
The first term in the maximum operator of definition of can be understood as the false positive rate of cluster and the second term is the true negative rate of cluster . It is easy to see the relationship that .
Let be the signal strength. For , let be the estimated center of cluster at iteration . Define our error rate of estimating centers at iteration as
Besides signal-to-noise ratio, there are other two factors that determine the convergence of Lloyd’s algorithm, the maximum signal strength and the minimum cluster size. As argued by [30], when one cluster is very far away from other clusters, local search may fail to find the global optimum, which indicates initialization should depend on the maximum signal strength. Since the cluster sizes influence the accuracy to estimate centers, we a lower bound on the size of the smallest clusters. Define and . Similar to the two-cluster case, we define a normalized signal-to-noise ratio
| (13) |
Now we are ready to present our results for the mixtures.
Theorem 3.2.
Assume and for a sufficiently large constant . Given any (data dependent) initializer satisfying
| (14) |
with probability , we have
| (15) |
for some constant with probability greater than , and
| (16) |
with probability greater than . Moreover, if and as , the exponent in (16) can be improved to .
In Theorem 3.2, we establish similar results as in the two-mixture case. The initialization condition (14) here is slightly stronger due to the asymmetry. Similarly, after initialization that satisfies (14), the convergence has three stages. It first escapes from a small neighborhood of , then converges linearly, and finally it achieves an exponentially small mis-clustering rate after iterations.
From Theorem 3.2, Lloyd’s algorithm does not require to know or to estimate the covariance structure of Gaussian mixtures. Likelihood-based algorithms, such as EM algorithm and methods of moments, need to estimate the covariance structure. Lloyd’s algorithm works for any general sub-Gaussian mixtures satisfying (2), and thus is robust to different models. This demonstrates a key advantage of using Lloyd’s algorithm than other likelihood-based algorithms.
Theoretically, the initialization condition (14) in Theorem 3.2 is sharp in a sense that we give a counterexample in Section A.5 showing that Lloyd’s algorithm may not converge when or .
Now let us give a sufficient condition for the spectral clustering initializer to fall into the basin of attraction (14). By Claim 1 in Section 3.2 of [34] and Lemma 7.1, for each center , there is a center returned by spectral clustering algorithm such that with probability greater than , which implies the following corollary.
Corollary 3.1.
Assume and as . Let be the output of Lloyd’s algorithm initialized by spectral clustering algorithm after iterations. Then
| (17) |
with probability greater than .
This corollary gives a sufficient separation (signal-to-noise ratio) condition for clustering sub-Gaussian mixtures. When and all the cluster sizes are of the same order, our separation condition simplifies to . When there are finite number of clusters ( is finite), our separation condition further simplifies to . To our knowledge, this is the first result to give an explicit exponentially small error rate for estimating the labels. Previous studies mostly focus on exact recovery of the cluster labels and have no explicit statistical convergence rate. Furthermore, our results hold for all the range of , while previous results all require .
Previously, the best known separation condition on the Lloyd-type algorithm is , under the assumption that [8]. Corollary 3.1 improves it by a factor. For Gaussian mixtures, among all algorithms including Lloyd’s algorithm, the best known separation condition is under the assumption that [1]. Our condition is weaker when the cluster sizes are of the same order. When is finite, our condition is weaker by a factor. As we shall see in Section 5, is usually small in practice and can often be regarded as a constant.
3.3 Minimax lower bound
To show that the mis-clustering rate rate in Corollary 3.1 cannot be improved, we present a rate matching lower bound in this section. Define a parameter space as follows,
| (18) |
We have the following minimax lower bound.
Theorem 3.3.
(Lower Bound) For model (1), assume independent gaussian noise , then when ,
If , for some constant .
This lower bound result shows that if the signal-to-noise ratio is at the constant order, the worst case mis-clustering rate is lower bounded by a constant. In other words, a necessary condition for consistently estimating the labels is . To achieve strong consistency, we need . Theorem 3.3 indicates the necessity of separation conditions in estimating the labels. Previous results that use methods of moments to estimate the cluster centers [28, 5], on the contrary, do not require separation conditions. This reveals the difference between estimating the cluster centers and the labels.
4 Applications
In this section, we generalize the results in Section 3 to community detection and crowdsourcing by considering two variants of Lloyd’s algorithm.
4.1 Community Detection
We have a network of communities. There are nodes in the network and is the community assignment. We observe a symmetric adjacency matrix with zero diagonals, which is generated by the following stochastic block model [27] (SBM thereafter),
for , where and are unknown parameters. The SBM is a special case of the Planted Partition Model [42] in the theoretical computer science literature. As in [22], we use a single parameter to control the community sizes, namely, there is a such that for all . The goal of community detection is to estimate community structure using the adjacency matrix . Note that only takes different values, and the SBM can be viewed as a special case of model (1) with and , ignoring the fact that is symmetric with zero diagonals.
When and are of an order of , the SBM satisfies the sub-Gaussian noise condition (2) and we have and . Initialized by the spectral clustering algorithm, let be the labels returned by running Lloyd’s algorithm on the rows of adjacency matrix with iterations. By considering the fact that is symmetric with zero diagonals, we can slightly modify the proof of Corollary 3.1 to obtain the following result.
Corollary 4.1.
Assume and as , then
| (19) |
with probability tending to .
We omit the proof of Corollary 4.1. A more interesting case of the SBM is the sparse case when and , in which the sub-Gaussian assumption (2) does not hold. By utilizing the community structure, we consider the following variants of Lloyd’s algorithm.
-
1a.
calculate the degree of each node .
-
1b.
trim the adjacency matrix .
| (20) | |||||
| (21) |
As pointed out by [13], under the sparse setting of , the trimmed adjacency matrix is a better estimator of than under the spectral norm. Therefore, we run spectral clustering on the to get an initial estimator of . Then we update the labels node by node. For the -th node in the network, we estimate its connecting probability to community (defined as ) based on our previous estimated labels. Then we assign its label to be the that maximizes , which is expected to be close to or , depending on whether . The following theorem gives a theoretical guarantee of the CommuLloyd algorithm.
Theorem 4.1.
Assume , for a sufficiently large constant . Let be the mis-clustering rate at iteration of the CommuLloyd algorithm. Then for any initializer satisfies with probability , we have
| (22) |
with probability greater than .
The proof of Theorem 4.1 is given in Section B of the appendix. We show the linear convergence of CommuLloyd algorithm given the first stage group-wise mis-clustering rate . In fact, this initialization assumption can be relaxed to . To better present our results, we simplify it to . By Lemma 7 in [22] and Theorem 3.1 in [8], we can guarantee a group-wise initialization error of when . Therefore, we obtain an exponentially small error rate under the signal-to-noise ratio condition
Theorem 4.1 provides theoretical justifications of the phenomenon observed in the numerical experiments of [22]. More iterations achieve better mis-clustering rate. The Lloyd iterations enjoy similar theoretical performance as the likelihood based algorithm proposed in [22]. While they require a global initialization error to be , we require a cluster-wise initialization error to be smaller than . Moreover, the CommuLloyd algorithm is computationally much more efficient than Algorithm 1 in [22], which requires obtaining different initializers and hence running SVD on the network times. Theoretically, we relax the assumption in [22] that and is a constant, and we improve the best known signal-to-noise ratio condition[22] by a factor. When is a constant and as , we are able to match the minimax rate obtained in [59].
4.2 Crowdsourcing
Crowdsourcing is an efficient and inexpensive way to collect a large amount of labels for supervised machine learning problems. We refer to [60, 21] and references therein for more details. The following Dawid-Skene model is the most popular model considered in the crowdsourcing literature.
Suppose there are workers to label items. Each item belongs to one of the categories. Denote by the true labels of items and by the label of worker given to item . Our goal is to estimate the true labels using . Dawid-Skene model assumes that the workers are independent and that given , the labels given by worker are independently drawn from a multinomial distribution with parameter , i.e.,
for all . Dawid-Skene model can be seen as a special case of the mixture model (1) via the following transformation. For , let
Then given , we have with . By defining , our observations can be decomposed as the following signal-plus-noise model (1) with
Therefore, we consider the following variants of the Lloyd’s algorithm in Algorithm 2. We iteratively estimate workers’ accuracy and items’ labels. Iterations (24) and (25) are actually Lloyd’s iteration (7) and (8) under the transformed Dawid-Skene model. Iterations (24) and (25) are also closely related to the EM update for Dawid-Skene model [60]. (24) is the same as the M-step. In (25), we first use least squares to approximate the log-likelihood function of multinomial distributions, then we do a hard labeling step instead of soft labeling in the E-step of EM algorithm.
| (23) |
| (24) | |||||
| (25) |
As suggested by Corollary 3.1, we could use spectral clustering to initialize the labels. But the majority voting initializer, as described in the first step of Algorithm 2, is a more natural and commonly used initializer of crowdsourcing. By regarding all the workers have the same accuracy, it simply estimates the labels by aggregating the results of every worker with equal weights. The majority voting initializer is computationally more efficient than spectral methods. We have the following result of the majority voting estimator.
Theorem 4.2.
Under the Dawid-Skene model, the majority voting initializer satisfies
| (26) |
with probability greater than , where
The proof of Theorem 4.2 is given in Section C.2. To our knowledge, this theorem is the first theoretical characterization of the Majority Voting estimator under the general Dawid-Skene model. measures the collective accuracy of workers on estimating one of the labels. If there are two labels and that are confusing for most of the workers, the value of is small and majority voting estimator may not have good performance. Under the special case of one-coin model, where and for , we have
as long as . That is, for Majority Voting estimator to be consistent, the accuracy of workers giving true labels only needs to be better than random guess.
With Theorem 4.2 and Theorem 3.2, we are able to to obtain an error rate upper bound of Algorithm 2. It can be proved that the sub-Gaussian parameter of is 2 (see the proof of Corollary 4.2 for more details). Define Then we have the following corollary of Theorem 3.2.
Corollary 4.2.
Assume , and for a sufficiently large constant . Let be the estimated labels returned by running Algorithm 2. We have
| (27) |
with probability greater than .
The proof of Theorem 4.2 is given in Section C.2. We achieve an exponentially small error rate for estimating the labels under Dawid-Skene model. By Theorem 4.2 in [21], we can achieve the minimax optimal rate by an additional likelihood based Neyman-Pearson testing step followed by Algorithm 2. Previous provable results [60, 21] assume for all , which is quite restrictive since a very good worker could have for some . By considering least square update (25), we successfully get rid of this assumption. In contrast to algorithms that using spectral methods as initializer [60], Theorem 4.2 does not need an eigenvalue condition on the confusion matrix.
5 Numerical Analysis
5.1 Gaussian Mixture Model
5.1.1 Simulation
In this section, we provide simulation results that are designed to test our theoretical findings in Theorem 3.2. As predicted by Theorem 3.2, there are three stages of the convergence of Lloyd’s algorithm. Given an initial estimator of the labels with error smaller than , Lloyd’s algorithm escapes from a small neighborhood of in the first iteration. Then it has a geometrically decay mis-clustering rate during the second stage. Finally, it converges to the statistical precision of the problem and achieves an exponentially small error. In all the results reported below, we plot the logarithm of the mis-clustering rate versus the iteration count. Each curve plotted is an average of independent trails.
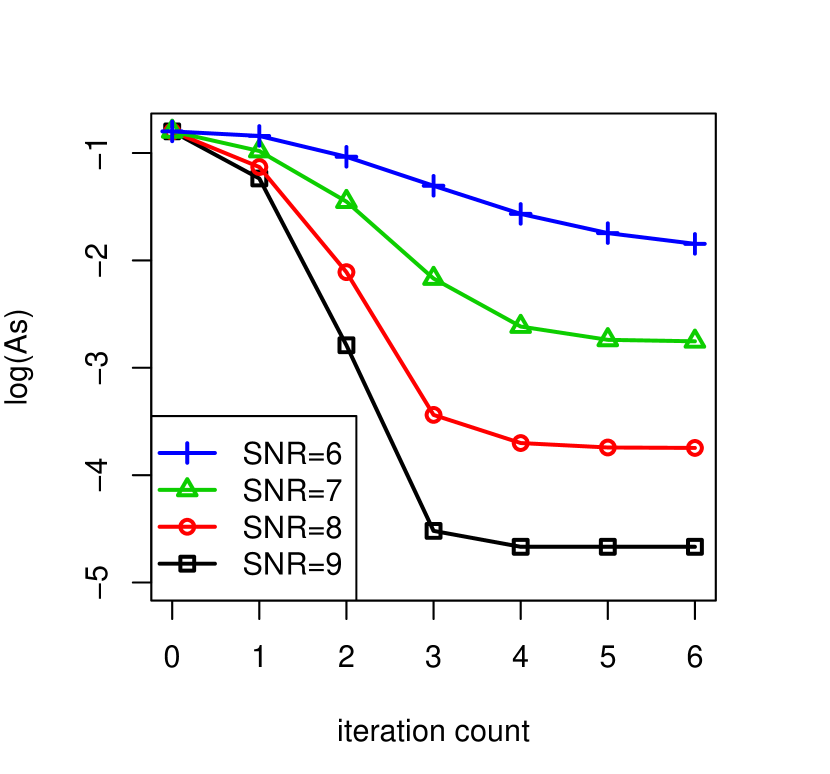
In the first simulation, we independently generate samples from a mixture of spherical Gaussians. Each cluster has data points. The centers of those gaussians are orthogonal unit vectors in with . The four curves in Figure 1(a) corresponds to four choices of the standard deviation with . We use the same initializer with a group-wise mis-clustering rate of for all the experiments. As shown by plots in Figure 1(a), there is a linear convergence of the log mis-clustering rate at the first 2 iterations and then the convergence slows down. After four iterations, the log mis-clustering rate plateaus roughly at the level of . Moreover, we observe in Figure 1(a) that the convergence rate increases as increases, as expected from Theorem 3.2.
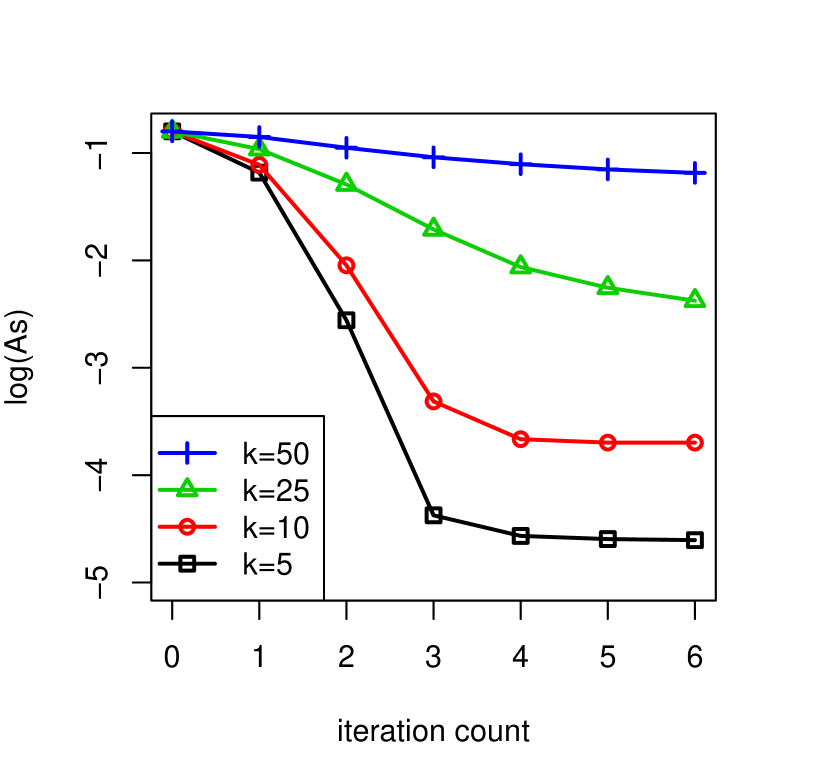
The second experiment investigates the role of in the convergence of Lloyd’s algorithm. We first randomly generate centers that are orthogonal unit vectors in . Then we add independent gaussian noise to each coordinate of those centers to get samples for each cluster. In total, we have independent samples from a mixture of spherical Gaussian distributions. We set the same initializer as in the first simulation to make a group-wise mis-clustering rate of . As observed in Figure 1(b), the larger the , the slower Lloyd’s algorithm converges. This agrees with the phenomena predicted by Theorem 3.2. It is interesting to observe that when is large, Lloyd’s algorithm does not converge to the optimal mis-clustering rate in Figure 1(b). When the value of is doubled, the convergence rate of slows down roughly by half, which matches the -term in (15).
5.1.2 Gene Microarray Data
To demonstrate the effectiveness of Lloyd’s algorithm on high dimensional clustering problem, we use six gene microarray data sets that were preprocessed and analyzed in [20, 24]. In each data set, we are given measurements of the expression levels of genes for people. There are several underlying classes (normal or diseased) of those people. Our goal is to cluster them based on their gene expression levels, with the number of groups given. One common feature of those six data sets is that the dimensionality is much larger than the number of samples . As shown in Table 1, while is usually smaller than two hundreds, the number of genes can be as large as ten thousands.
We compare three different methods on these six data sets. RandLloyd is Lloyd’s algorithms initialized by randomly drawing rows of the original data as centers. SpecLloyd runs RandLloyd on the first eigenvectors of the data, followed by Lloyd’s iterations on the original data. IF-HCT-PCA, proposed in [32], does a variable selection step first and then applies spectral clustering on selected variables. All three methods need random initializations at the -means step and thus have algorithmic randomness. We randomly initialize centers for 30 times and use the initializer that give us the minimum -means objective value.
| Date set | k | n | d | IF-HCT-PCA | SpecLloyd | RandLloyd |
|---|---|---|---|---|---|---|
| Brain | 5 | 42 | 5597 | .262 | .119 | .262(.04) |
| Leukemia | 2 | 72 | 3571 | .069 | .028 | .028 |
| Lung(1) | 2 | 181 | 12533 | .033 | .083 | .098 |
| Lymphoma | 3 | 62 | 4026 | .069 | .177 | .016 |
| Prostate | 2 | 102 | 6033 | .382 | .422 | .422 |
| SRBCT | 4 | 63 | 2308 | .444 | .492 | .492 |
In Table 1, we report the average mis-clustering rate rates over 30 independent experiments. We also report the standard deviation if it is larger than .01. As we can see, RandLloyd is comparable to other two methods on these gene microarray data. It achieves the best clustering error rate when the clustering task is relatively easy (signal-to-noise ratio is strong), for example, Leukemia and Lymphoma data sets. Note that both IF-HCT-PCA and SpecLloyd have a dimension reduction step. This agrees with the phenomena suggested by Theorem 3.2 that Lloyd’s algorithm also works on the high dimensional setting when the signal-to-noise ratio is strong enough.
5.2 Community Detection
In this section, we report the results of empirical studies to compare the CommuLloyd algorithm proposed in Section 4.1 with other methods. In particular, we compare to spectral clustering (Spec) and spectral clustering with one step refinement studied in [22]. Since the algorithm in [22] is motivated by the maximum likelihood estimator, we refer it to as Spec+MLE.
5.2.1 Simulation
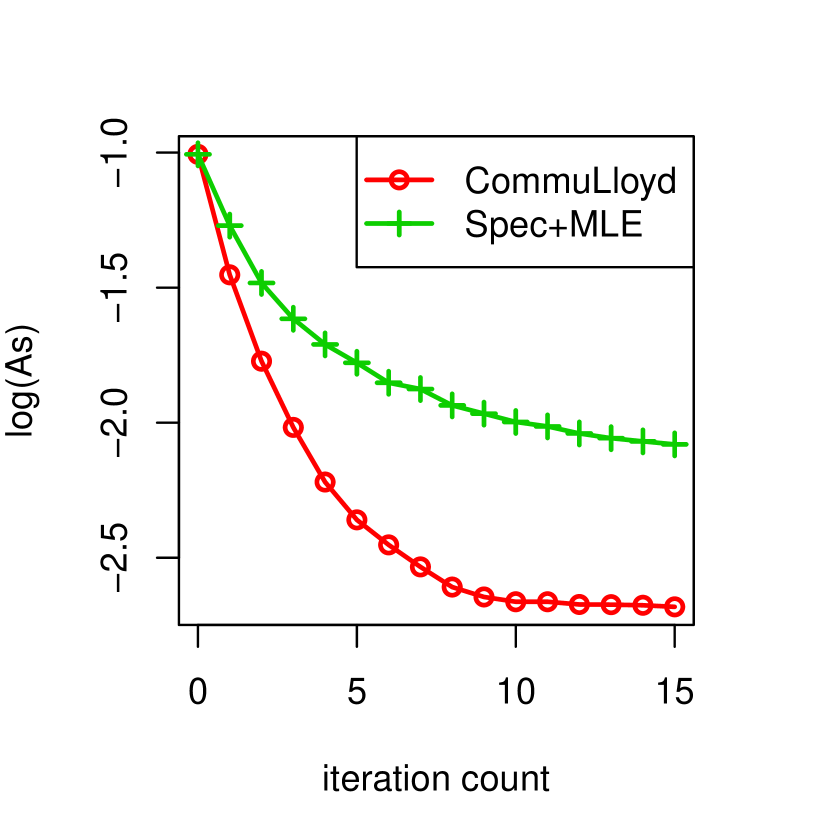
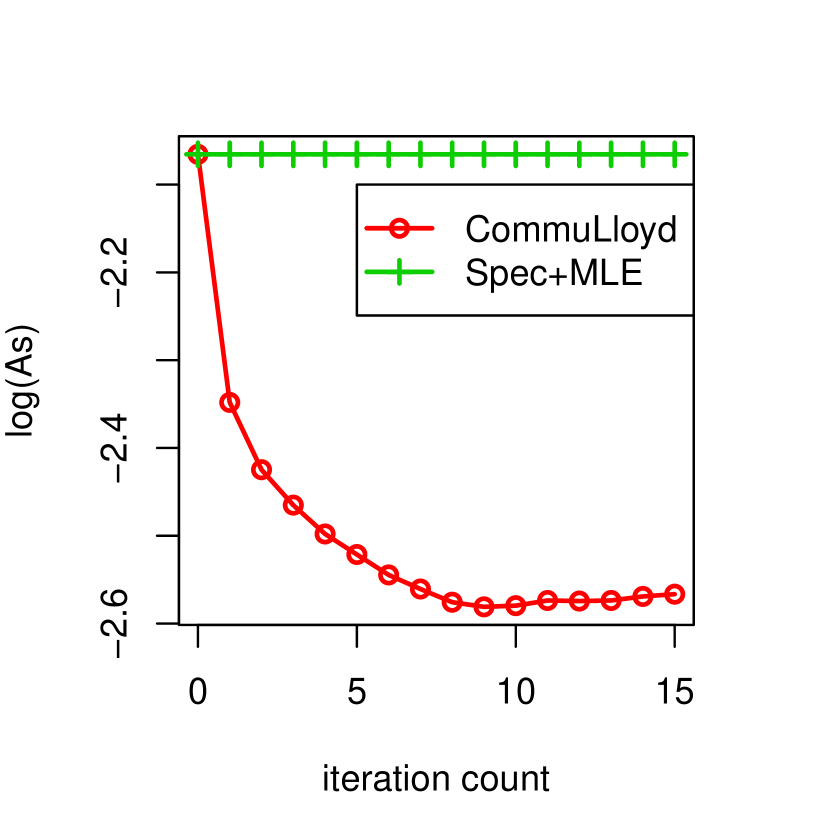
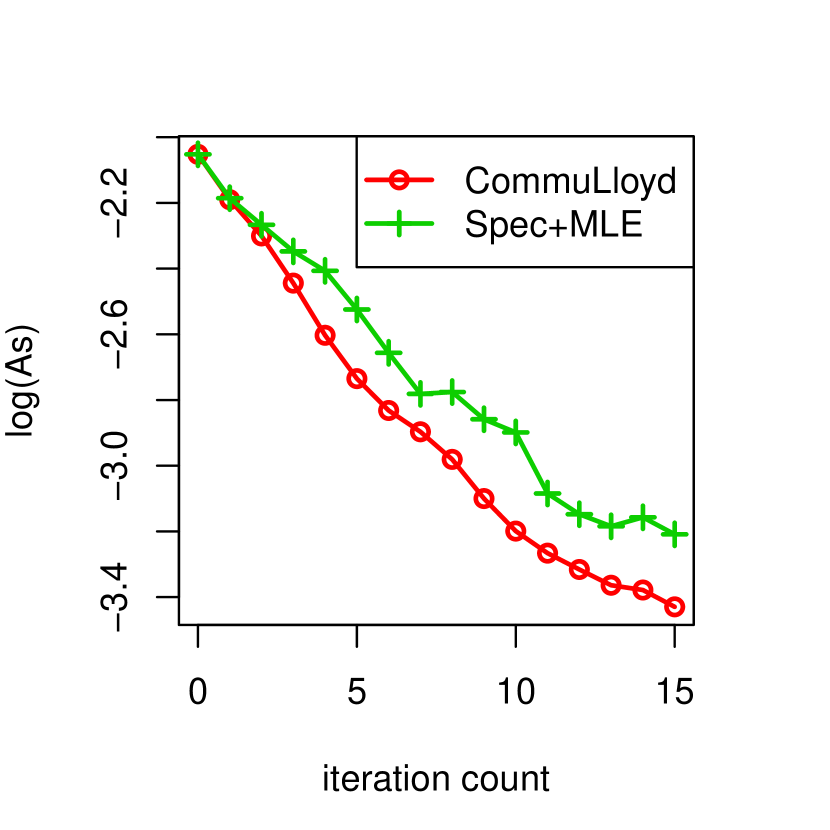
Using the same settings as in [22], we generate data from SBM under three different scenarios: (1) dense network with equal size communities; (2) sparse network with equal size communities; and (3) dense network with unequal size communities. The detailed set-up of three simulations is described in Table 2. We conduct each experiment with 10 independent repetitions and report the average results of each algorithm in Figure 2.
For all the experiments, we use spectral clustering methods in [38] as our initializer and plot the logarithm mis-clustering rate versus the Lloyd iteration or MLE iteration counts. Iteration 0 represents the spectral clustering initializer. As shown by Figure 2, CommuLloyd significantly outperforms spectral clustering and spectral clustering with one step MLE refinement under all three settings. Surprisingly, it is even better than multiple steps MLE refinements. In panel (a), MLE refinements converge to a sub-optimal mis-clustering rate, and in panel (b), it does not improve the spectral clustering initializer. This phenomenon may be due to the stronger initialization condition for MLE refinements in [22], while in Theorem 4.1, CommuLloyd needs only a constant-error initializer to converge to the optimal mis-clustering rate rate. The convergence rate of CommuLloyd for the these two cases, however, is faster than the linear convergence predicted by Theorem 4.1. As for the unbalance case in panel (c), CommuLloyd and MLE has similar performance and they both exhibit a linear convergence rate.
| Setting | n | k | Within | Between | Community Size |
|---|---|---|---|---|---|
| Balanced Case | 2000 | 10 | 0.20 | 0.11 | equal |
| Sparse Case | 2000 | 4 | 0.019 | 0.005 | equal |
| Unbalanced Case | 1000 | 4 | 0.35 | 0.22 | 100,200,300,400 |
5.2.2 Political Blog Data
We now examine the performance of Algorithm 2 on a political blog dataset [2]. Each node in this data represents a web blog collected right after the 2004 US presidential election. Two nodes are connected if one contains a hyperlink to the other, and we ignore the direction of the hyperlink. After pre-processing [35], there are 1222 nodes and 16714 edges. Depending on whether liberal or conservative, the network naturally has two communities. We use the label given in [2] as our ground truth.
Table 3 reports the number of mis-labeled nodes of our algorithm on political blog dataset. Started from spectral clustering with an error rate of 437/1222, CommuLloyd achieves 56/1222 error rate after three iterations. After that, it fluctuates between 55 and 56 mis-labeled nodes. Our algorithm slightly outperforms the state-of-the-art algorithm SCORE [31], which reports an error rate of 58/1222.
| Methods | Spec | Spec+MLE(1st) | Spec+MLE(10th) | SCORE | CommuLloyd |
|---|---|---|---|---|---|
| No.mis-clustered | 437 | 132 | 61 | 58 | 56 |
5.3 Crowdsourcing
In this section, we compare CrowdLloyd algorithm with three other crowdsourcing methods: (1) Opt-D&S, which is Spectral methods with one step EM update proposed in [60], (2) MV, the majority voting estimator and (3) MV+EM, which is majority voting estimator followed by EM updates. Among those four algorithms, Opt-D&S, MV and CrowdLloyd have provable error rates.
When there are ties, the majority voting estimator is not clearly defined. To avoid algorithmic randomness, we return the first label index when there are ties for CrowdLloyd and MV estimator. Since EM algorithm takes soft labels as input, we use weights rather than hard label of majority voting estimator in MV+EM. In practice, there are usually missing data. We denote by as the category of missing data and modify the label update step in CrowdLloyd as
| (28) |
5.3.1 Simulation
We follow the same setting as in the experiments of [60], where there are workers and items. Each item belongs to one of the categories. For worker , the diagonal entries of his or her confusion matrix are independently and uniformly drawn from the interval . We set for all and . To simulate missing entries, we assume each entry is observed independently with probability .
We replicate experiments independently for 10 times and report the average results in Table 4. Among three provable algorithms, CrowdLloyd is consistently better than Opt D&S (1st iteration) and MV under different missing levels. CrowdLloyd, MV+EM and Opt D&S (10th iteration) have almost identical performance. As expected, CrowdLloyd is slightly worse because it does not use likelihood function to update the confusion matrices. As discussed before, an additional Neyman-Pearson testing step followed by CrowdLloyd algorithm would give the same output as EM updates.
| Methods | |||
|---|---|---|---|
| Opt D&S (1st iteration) | 0.06 | 1.32 | 10.32 |
| Opt D&S (10th iteration) | 0.07 | 1.10 | 8.22 |
| MV | 2.14 | 8.56 | 18.97 |
| MV + EM | 0.07 | 1.10 | 8.17 |
| CrowdLloyd | 0.07 | 1.14 | 8.19 |
5.3.2 Real Data
We now compare CrowdLloyd algorithm to other three algorithms on five real crowdsourcing data sets: (1) bird dataset is a binary task of labeling two bird species, (2) recognizing textual entailment (RTE) dataset contains a set of sentence pairs and the task is to label whether the second sentence can be inferred from the first one, (3) TREC dataset is a binary task of assessing the quality of information retrieval in TREC 2011 crowdsourcing track, (4) dog dataset is a subset of Stanford dog dataset that requires labeling one of the four dog breeds, and (5) web dataset is a set of query-URL pairs for workers to label on a relevance scale from 1 to 5.
The mis-clustering rates of four methods are summarized in Table 5. CrowdLloyd slightly outperforms the other three on four of those five data sets. One possible explanation is that the least squares update works for general sub-Gaussian distributions and thus is potentially more robust than the likelihood based EM update.
| # | Date set | Opt D&S | MV | MV+EM | CrowdLloyd |
|---|---|---|---|---|---|
| 1 | Bird | 10.09 | 24.07 | 11.11 | 12.04 |
| 2 | RTE | 7.12 | 8.13 | 7.34 | 6.88 |
| 3 | TREC | 29.80 | 34.86 | 30.02 | 29.19 |
| 4 | Dog | 16.89 | 19.58 | 16.66 | 15.99 |
| 5 | Web | 15.86 | 26.93 | 15.74 | 14.25 |
6 Discussion
6.1 Random Initialization
In this section, we explore the condition under which random initialization converges to the global optimum. Here we consider the symmetric two-mixture model (3). Note that Theorem 3.1 holds for any initializer (could be data dependent) satisfying condition (10). If we have a data independent initializer, condition (10) can be weakened and we have the following result on random initialization of the labels.
Theorem 6.1.
Assume
for a sufficiently large constant . Suppose we independently draw random initializers. Then Lloyd’s algorithm initialized by one of them can correctly classifies all the data points with probability greater than .
The proof of Theorem 6.1 is given in appendix. Klusowski and Brinda [36] showed similar results for EM algorithm under the condition that . We improve their condition to by choosing . Recently, Xu et al. [56] and Daskalakis et al. [16] proved the global convergence of EM algorithm on the population likelihood function. However, it is not clear what signal-to-noise ratio condition they need for the finite sample analysis. Moreover, our results can be generalized to -mixtures and the sub-Gaussian case, but [36], [56] and [16] all restrict their analyses to the two mixture Gaussian case.
As for the general mixture case, one popular way to initialize Lloyd’s algorithm is to initialize centers by sampling without replacement from the data. However, when , Jin et al. [30] show even for well-separated () spherical Gaussian mixtures, EM algorithm, initialized by above strategy, convergences to bad critical points with high probability. They prove it by constructing a bad case of two cluster of centers that are very far away with each other. We expect similar results for Lloyd’s algorithm.
6.2 Convergence of the centers
As a byproduct of Theorem 3.2, we obtain the convergence rate of estimating Gaussian mixture’s centers using Lloyd’s algorithm.
Theorem 6.2.
Assume and for a sufficiently large constant . Then given any initializer satisfying
| (29) |
with probability , we have
| (30) |
for some constant with probability greater than .
We show a linear convergence rate of estimating the centers. When the labels are known, the minimax optimal rate of estimating the centers under Euclidean distance is . Thus, we obtain the optimal rate under the condition that , , and .
7 Proofs
This section is devoted to prove Theorem 3.1. The proofs of other theorems are collected in the appendix.
7.1 Preliminaries
We rewrite the symmetric two-mixture model (3) as
| (31) |
where . To facilitate our proof, we present four lemmas on the concentration behavior of . Their proofs are given in Section D of the appendix.
Lemma 7.1.
For any , define . Then,
| (32) |
with probability greater than .
Lemma 7.2.
Let . Then we have and with probability greater than
Lemma 7.3.
The maximum eigenvalue of is upper bounded by with probability greater than .
Lemma 7.4.
For any fixed , , and , we have
Let be the intersection of high probability events in Lemma 7.1, Lemma 7.2, Lemma 7.3 and label initialization condition (10). Then . For the center initialization condition, we refer to the proof of Theorem 3.2 in the appendix for more details. In the following, we deterministically analyze the error of estimating centers and labels on event .
Error of the centers
We first decompose the error of estimating into two parts, where the first part comes from the error of estimating labels , and the second part is due to the stochastic error ,
Using (31) and the fact that , we obtain
| (33) |
where , and .
Error of the labels
Now we analyze the error of . The iteration of is equivalent to
which gives us . From (33),
Applying Lemma 7.1 with , we obtain
which, together with Lemma 7.2, implies
Consequently, on event , we have
| (34) |
where . Now we are ready to prove Theorem 3.1. In the following, we are going to prove (11) and (12) separately based on two different decompositions of the RHS of (34).
7.2 Proof of (11) in Theorem 3.1
Using the fact that for any and , we obtain
with and . Taking an average of the equation above over , we have , where
| (35) | |||||
| (36) |
Upper Bound
Note that only takes discrete values . Let us define and
for . For any fixed , are independent Bernoulli random variables, then Hoeffding’s inequality implies
Thus by union bound, we have
| (37) |
Now it remains to upper bound the expectation of . Since is sub-Gaussian with parameter , Chernoff’s bound yields
| (38) |
Consider the event
Equation (37) together with (38) implies . Therefore,
| (39) |
with probability greater than .
Upper Bound
Lemma 7.3 implies
where stands for the maximum eigenvalue of the symmetric matrix . By the Cauchy-Schwarz inequality, Lemma 7.1 and Lemma 7.2, we have
Since , we obtain
| (40) |
Recall that . Combining (39) and (40), we have
on event . Let . From above inequality and the assumption that it can be proved by induction that for all when and . Consequently, we have for all . Plugging this bound of into above inequality completes the proof.
7.3 Proof of (12) in Theorem 3.1
By (11) in Theorem 3.1 and the fact that when ,
which implies for all . Then when , (34) implies
To get a better upper bound for mis-clustering rate, we further decompose as . Following similar arguments as in the proof of Theorem 3.1(a), we obtain , where is defined in (35) with , and are defined as follows,
| (41) | |||||
| (42) |
From (38), when and , . Analogous to (40), we have
on event . Choosing , and in Lemma 7.4 yields
Combine the pieces and note that ,
| (43) | |||||
Then, by induction, we have
when . Setting and applying Markov’s inequality, we obtain
If , a choice of gives us the desired result. Otherwise, since only takes discrete values , choosing , we have
Therefore, the proof of (12) is complete. When , we can slightly modify the proof to get the improved error exponent. For more details, we refer to the proof of Theorem 3.2 in Section A.
Appendix A Proof of sub-Gaussian mixtures
A.1 Preliminaries
Let us begin by introducing some notaion. For any , define . Recall that and , let us define
Then we have and . In the rest of the proof, we will sometimes drop the upper index of , and when there is no ambiguity. Also, we suppress the dependence of by writing as .
Analogous to Lemma 7.1 - Lemma 7.4, we have following technical lemmas on the concentration behavior of sub-Gaussian random vectors .
Lemma A.1.
| (44) |
with probability greater than .
Lemma A.2.
| (45) |
with probability greater than .
Lemma A.3.
For any fixed , , and ,
Lemma A.4.
| (46) |
with probability greater than .
Lemma A.5.
For any fixed and , we have
| (47) |
for all with probability greater than .
A.2 Two Key Lemmas
The following two lemmas give the iterative relationship between the error of estimating centers and the error of estimating labels. Let be the intersection of high probability events in Lemma A.1, Lemma A.2 Lemma A.4, Lemma A.5 and the initialization condition (14). Then we have . In the rest part of the proof, if not otherwise stated, we all condition on the event and the following analysis are deterministic.
Lemma A.6.
On event , if , then we have
| (48) |
Lemma A.7.
On event , if and , then
| (49) |
Proof of Lemma A.6.
For any , define . The error of estimated centers at step can be written as
According to our label update step, we have for any . This means for any , is closer to than , so is the average of . Thus, we have
Consequently, triangle inequality gives us
which, combined with Lemma A.1 and the definition of , yields
Taking a weighted sum over , we get
where the Last inequality is due to Cauchy-Schwartz and the fact that . Note that . Triangle inequality and Lemma A.5 imply
Since , we have
| (50) |
Combining the pieces, we obtain
| (51) | |||||
Therefore, we get the first term in (48). To prove the second term, we decompose differently.
| (52) | |||||
Then, the error of can be upper bounded as
By triangle inequality,
| (53) |
This, together with Lemma A.1 and (50), implies
| (54) |
for all . The proof is complete.
∎
Proof of Lemma A.7.
For any ,
| (55) | |||||
Triangle inequality implies
Using the fact that when , we obtain
| (56) |
Denote by for . Then,
Taking a sum over and using Markov’s inequality on the second term, we obtain
| (57) |
Note that are independent Bernoulli random variables. By Lemma A.5, the first term in RHS of (57) can be upper bounded by
| (58) |
By Lemma A.2, the second term in RHS of (57) can be upper bounded by
| (59) |
Combining (57), (58) and (59) and using the fact that , we get
Consequently,
| (60) |
Since and , the RHS of (60) is smaller that when . Thus,
for all and we have
| (61) |
which, together with (60), implies
Under the assumptions that , we have the desired result (49). ∎
A.3 Proof of Theorem 3.2
Proof of (15) in Theorem 3.2.
From Lemma A.6, a necessary condition for is . Setting in Lemma A.7, we have . Plugging it into Lemma A.6 gives us , under the assumption that . Then it can be easily proved by induction that and for all . Consequently, Lemma A.6 yields
which, combined with (49), implies
for some constant . Here we have chosen in Lemma 49 to get the first inequality. ∎
Proof of (16) in Theorem 3.2.
From the proof of Lemma A.6, the error of estimating at iteration can be written as , with
| (62) |
In addition, by Lemma A.6 and Lemma A.7, there is a constant such that
for all . Therefore, when is large enough, we have
for all . Then by (56), we have
where
In order to prove that attains convergence rates (16), we first upper bound the expectation of and then derive the high probability bound using Markov’s inequality. Similar to the two-mixture case, we need to upper bound the inner product more carefully. Note that are deterministic sets, we could use concentration equalities to upper bound and parts separately.
Let for and we decompose into three terms.
where and will be specified later and . Taking a sum over and , we obtain
with
| (63) | |||||
| (64) | |||||
| (65) |
Let us first consider the expectation of . Using Chernoff’s bound, we have
Thus,
with .
We use Markov Inequality to upper bound . Markov’s inequality and Lemma A.2 give us
(62) implies
Here the second inequality is due to the fact that . And we choose in the last equality.
Finally, we upper bound the expectation of . Given , we have
Choosing , in Lemma A.3, and
we obtain , where we have used the assumption that and . Thus,
Combining the pieces, we have
with . Here only prove the case that . For the finite case, all the in the following proof can be substituted by a small constant.
when . By Markov’s inequality, for any ,
| (66) |
If , choose and we have
Otherwise, since only takes discrete values of , choosing in (66) leads to
The proof is complete. ∎
A.4 Proof of Lower Bounds
The key difficulty in proving the lower bound is to deal with infinitum of all label permutations. Here we adapt the proof idea from [23]. We define a subset of the parameter space, in which a large portion of the labels in each cluster are fixed. Then any permutation other than identity gives us bigger mis-clustering rate.
Proof of Theorem 3.3.
For any , let us define . Let satisfying with . It is easy to check the existence of . For each , we choose a subset of with cardinality , denoted by . Define and
| (67) |
A key observation is that for any , we have and
| (68) |
for all . Thus, for all . Then following the same arguments in the proof of Theorem 2 in [23], we can obtain
| (69) |
Here denote the probability distribution of our data given . By Neyman-Pearson Lemma, the infimum of the right hand side of (69) is achieved by the likelihood ratio test
Thus,
Since are independent , . Let be the cumulative function of random variable. By calculating the derivatives, it can be easily proved that
Then when , we have
Consequently,
The proof is complete. ∎
A.5 A counterexample
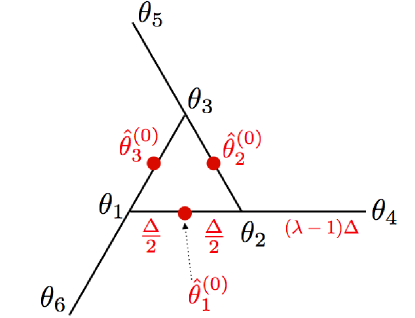
Now we give a counterexample to show that the initialization condition in Theorem 3.2 is almost necessary. Consider a noiseless case with 6 equal size clusters, as showed in Figure 3. Suppose for and for . We are given an initializer that mixes cluster and cluster , , with data points from cluster and data points from cluster for some integer . Consequently, the estimated (initialized) center lies in the middle of two true centers. For the next label update step, since there are ties, we may assign half points at to cluster and another half to cluster and the estimated centers remain the same as before. Therefore, is a stationary point for Lloyd’s algorithm and it may not convergence to the true centers. We would like to note that this counterexample is a worst case in theoretical analysis, which may not happen in practice.
A.6 Proofs of Random Initialization
Proof of Theorem 6.1.
For a data independent initializer, we have the following result.
Lemma A.8.
For any , if we have a data independent initializer satisfying
| (70) |
the conclusion of Theorem 3.1 continues to hold with probability greater than .
Given Lemma A.8, let us study the condition under which completely random initialization falls into the basin of attraction (70). When we randomly assign initial labels, we have with probability greater than 0.3. We can boost this probability to by independently drawing different random initializers. Recall our loss function (4). We can assume . Otherwise, we may flip all the labels in the initial step. Combining this with condition (70), we have the following corollary.
Now it remains to prove Lemma A.8. We focus on the first iteration. By (33), we have with . Then
Since the initializer is data independent, are independent of . Chernoff’s bound implies
with probability greater than . Consequently, we obtain
| (71) |
where . By Chernoff’s bound and Hoeffding’s inequality, the first term in the RHS of (71) can be upper bounded by
with probability greater than . Markov’s inequality and proof of Lemma 7.3 give us
with probability greater than . From (80), we have with probability greater than . Combining the pieces, we obtain
| (72) |
with probability greater than . Under the condition that
we have with probability greater than . Then using the result of Theorem 3.1, the proof is complete. ∎
Appendix B Proofs of Community Detection
B.1 Proof of Theorem 4.1
We use the same notation as in the Gaussian case. Let be the true cluster and be the estimated cluster at iteration . And we will drop the dependency of when there is no ambiguity in the context. is the mis-clustering rate at iteration and is the group-wise mis-clustering rate at iteration . Similar to the analysis of Gaussian mixture model, the proof consists of two steps. We first prove that given with for a sufficiently large constant , we have for all with high probability. Then we prove the mis-clustering rate geometrically decays to the rate (22).
Given , we decompose (20) as follows.
Consequently, the error of estimating at iteration can be upper bounded as
| (73) | |||||
where the second inequality is due to our induction assumption that and . Union bound implies
| (74) |
Now we give two upper bounds on the sum of indicator variables uniformly over . There proofs are deferred to Section B.2.
Lemma B.1.
Given with cardinality greater than and such that for a sufficiently large constant . There is an universal constant such that with probability greater than ,
| (75) |
holds for all with .
Lemma B.2.
Given with cardinality greater than and such that for a sufficiently large constant . There is an universal constant such that with probability greater than ,
| (76) |
holds for all with .
In Lemma B.1 and Lemma B.2, we present results for the upper tail . By slightly modifying the proof, the same results hold for the lower tail . Taking an sum over in (74) and using Lemma B.2, we obtain
with probability greater than . Consequently,
with probability greater than . Here we have used the fact that . Using similar arguments, we obtain the same high probability upper bound for . Therefore, we have
with probability greater than . When , we choose . Since , we have when . For , we choose and it is straight forward to prove by induction that for all , with probability greater than , provided .
B.2 Proof of Lemma B.1 and Lemma B.2
For any fixed with , let
By Bernstein’s inequality, the success probability of is upper bounded by
for some universal constant and . Here the last inequality is due to the fact that . Note that are independent Bernoulli random variables. By Bennett’s inequality (see Lemma 9 in [22]), for any ,
| (77) | |||||
where
To prove (75) holds for all with , we need a chaining argument. For , define and
Then with . Union bound implies
Note that . Given and , there are at most possible choices of . Thus, the cardinality of is upper bounded by
Combining this with (77), we obtain
and
for all , where we have used the assumption that for a sufficiently large constant . Thus,
By our assumption, we have . Consequently, . Therefore, the proof Lemma B.1 is complete. Lemma B.2 follows from almost identical arguments except that we choose .
Appendix C Proofs of Crowdsourcing
C.1 Proof of Theorem 4.2
Suppose , then Chernoff bound gives us
for all . Since is from a multinomial distribution , we have
where and . Here inequality (a) is due to the fact that for all . Choosing yields
where . Then using Markov’s inequality, we have
for all . A choice of completes the proof.
C.2 Proof of Corollary 4.2
Let us first calculate the sub-Gaussian parameter of . For any and with ,
For any fixed , define a Multinoulli random variable such that
Recall the definition of that . Then,
where the last inequality is because is a bounded random variable. Consequently, we have
Therefore, the sub-Gaussian parameter of is upper bounded by 2.
Appendix D Proofs of Technical Lemmas
To help readers better understand the results, we first give proofs for spherical Gaussians and then extend it to the general sub-Gaussians. Without loss of generality, we assume in this section.
D.1 Proofs for spherical Gaussians
We denote by the normal random vectors with mean zero and covariance matrix . For , we have the following two facts on its moment generating functions.
| (78) |
| (79) |
Proof of Lemma 7.1.
For any fixed , . By (79), we have
for . Then Chernoff’s bound yields
| (80) |
Choosing and ,
Since there are subsets of , an union bound argument gives us
∎
Proof of Lemma 7.2.
Proof of Lemma 7.3.
Let . Then
Let be the unit ball in and be a -net of such that for any , there is a satisfying . Then we have [49, Lemma 4.1] and
Taking a supreme over on both sides and rearranging, we get
| (81) |
For any fixed , . Then by (79),
where we have set . Then (81) and union bound give us
A choice of and yields the desired result. ∎
Proof of Lemma 7.4.
For each , define . Then,
| (82) |
is an isotopic Gaussian random vector with variance smaller than on every direction. By (78) and (79), for any independent and ,
for all . Since and are independent, Chernoff bound implies
for . Choosing yields
| (83) |
From (80), a choice of gives us
Setting , we obtain
| (84) |
with probability greater than . Combining (D.1), (83) and (84) completes the proof. ∎
D.2 Proofs of sub-Gaussians
Proof of Lemma A.1.
For any fixed , is a dimensional random vector satisfying
for all . By [29, Theorem 2.1], we have
| (85) |
Note that there are at most possible choices of . Using the union bound completes the proof. ∎
Proof of Lemma A.2.
Proof of Lemma A.3.
Similarly to the proof of Lemma 7.4, we upper bound as
Since and are independent sub-Gaussian random vectors, we have
for , where . Here the last inequality is due to [29, Remark 2.3]. Then 83) also holds for sub-Gaussian random vectors. Applying [29, Theorem 2.1] on , we have
for . Following the same arguments as in the proof of Lemma 7.4, the proof is complete. ∎
Proof of Lemma A.5.
Let . Then are independent Bernoulli random variables. Hoeffding’s inequality implies
with probability greater than . Using Chernoff bound and the sub-Gaussian property of , we have
where we set in the last equality. By union bound and the fact that , we get the desired result. ∎
References
- [1] Dimitris Achlioptas and Frank McSherry. On spectral learning of mixtures of distributions. In International Conference on Computational Learning Theory, pages 458–469. Springer, 2005.
- [2] Lada A Adamic and Natalie Glance. The political blogosphere and the 2004 us election: divided they blog. In Proceedings of the 3rd international workshop on Link discovery, pages 36–43. ACM, 2005.
- [3] Pankaj K Agarwal and Nabil H Mustafa. k-means projective clustering. In Proceedings of the twenty-third ACM SIGMOD-SIGACT-SIGART symposium on Principles of database systems, pages 155–165. ACM, 2004.
- [4] Ankit Aggarwal, Amit Deshpande, and Ravi Kannan. Adaptive sampling for k-means clustering. In Approximation, Randomization, and Combinatorial Optimization. Algorithms and Techniques, pages 15–28. Springer, 2009.
- [5] Animashree Anandkumar, Daniel Hsu, and Sham M Kakade. A method of moments for mixture models and hidden markov models. In COLT, volume 1, page 4, 2012.
- [6] David Arthur and Sergei Vassilvitskii. How slow is the k-means method? In Proceedings of the twenty-second annual symposium on Computational geometry, pages 144–153. ACM, 2006.
- [7] David Arthur and Sergei Vassilvitskii. k-means++: The advantages of careful seeding. In Proceedings of the eighteenth annual ACM-SIAM symposium on Discrete algorithms, pages 1027–1035. Society for Industrial and Applied Mathematics, 2007.
- [8] Pranjal Awasthi and Or Sheffet. Improved spectral-norm bounds for clustering. In Approximation, Randomization, and Combinatorial Optimization. Algorithms and Techniques, pages 37–49. Springer, 2012.
- [9] Sivaraman Balakrishnan, Martin J Wainwright, and Bin Yu. Statistical guarantees for the em algorithm: From population to sample-based analysis. arXiv preprint arXiv:1408.2156, 2014.
- [10] T Tony Cai, Zongming Ma, Yihong Wu, et al. Sparse pca: Optimal rates and adaptive estimation. The Annals of Statistics, 41(6):3074–3110, 2013.
- [11] Arun Tejasvi Chaganty and Percy Liang. Spectral experts for estimating mixtures of linear regressions. In ICML (3), pages 1040–1048, 2013.
- [12] Joseph T Chang. Full reconstruction of markov models on evolutionary trees: identifiability and consistency. Mathematical biosciences, 137(1):51–73, 1996.
- [13] Peter Chin, Anup Rao, and Van Vu. Stochastic block model and community detection in the sparse graphs: A spectral algorithm with optimal rate of recovery. arXiv preprint arXiv:1501.05021, 2(4), 2015.
- [14] Sanjoy Dasgupta. The hardness of k-means clustering. Department of Computer Science and Engineering, University of California, San Diego, 2008.
- [15] Sanjoy Dasgupta and Leonard Schulman. A probabilistic analysis of em for mixtures of separated, spherical gaussians. Journal of Machine Learning Research, 8(Feb):203–226, 2007.
- [16] Constantinos Daskalakis, Christos Tzamos, and Manolis Zampetakis. Ten steps of em suffice for mixtures of two gaussians. arXiv preprint arXiv:1609.00368, 2016.
- [17] Alexander Philip Dawid and Allan M Skene. Maximum likelihood estimation of observer error-rates using the em algorithm. Applied statistics, pages 20–28, 1979.
- [18] Neil E Day. Estimating the components of a mixture of normal distributions. Biometrika, 56(3):463–474, 1969.
- [19] Arthur P Dempster, Nan M Laird, and Donald B Rubin. Maximum likelihood from incomplete data via the em algorithm. Journal of the royal statistical society. Series B (methodological), pages 1–38, 1977.
- [20] Marcel Dettling. Bagboosting for tumor classification with gene expression data. Bioinformatics, 20(18):3583–3593, 2004.
- [21] Chao Gao, Yu Lu, and Dengyong Zhou. Exact exponent in optimal rates for crowdsourcing. arXiv preprint arXiv:1605.07696, 2016.
- [22] Chao Gao, Zongming Ma, Anderson Y Zhang, and Harrison H Zhou. Achieving optimal misclassification proportion in stochastic block model. arXiv preprint arXiv:1505.03772, 2015.
- [23] Chao Gao, Zongming Ma, Anderson Y Zhang, and Harrison H Zhou. Community detection in degree-corrected block models. arXiv preprint arXiv:1607.06993, 2016.
- [24] Gavin J Gordon, Roderick V Jensen, Li-Li Hsiao, Steven R Gullans, Joshua E Blumenstock, Sridhar Ramaswamy, William G Richards, David J Sugarbaker, and Raphael Bueno. Translation of microarray data into clinically relevant cancer diagnostic tests using gene expression ratios in lung cancer and mesothelioma. Cancer research, 62(17):4963–4967, 2002.
- [25] Moritz Hardt and Eric Price. Tight bounds for learning a mixture of two gaussians. In Proceedings of the Forty-Seventh Annual ACM on Symposium on Theory of Computing, pages 753–760. ACM, 2015.
- [26] Ralf Herwig, Albert J Poustka, Christine Müller, Christof Bull, Hans Lehrach, and John O’Brien. Large-scale clustering of cdna-fingerprinting data. Genome research, 9(11):1093–1105, 1999.
- [27] Paul W Holland, Kathryn Blackmond Laskey, and Samuel Leinhardt. Stochastic blockmodels: First steps. Social networks, 5(2):109–137, 1983.
- [28] Daniel Hsu and Sham M Kakade. Learning mixtures of spherical gaussians: moment methods and spectral decompositions. In Proceedings of the 4th conference on Innovations in Theoretical Computer Science, pages 11–20. ACM, 2013.
- [29] Daniel Hsu, Sham M Kakade, Tong Zhang, et al. A tail inequality for quadratic forms of subgaussian random vectors. Electron. Commun. Probab, 17(52):1–6, 2012.
- [30] Chi Jin, Yuchen Zhang, Sivaraman Balakrishnan, Martin J. Wainwright, and Michael Jordan. Local maxima in the likelihood of gaussian mixture models: Structural results and algorithmic consequences. arXiv preprint arxiv:1609.00978, 2016.
- [31] Jiashun Jin et al. Fast community detection by score. The Annals of Statistics, 43(1):57–89, 2015.
- [32] Jiashun Jin and Wanjie Wang. Important feature pca for high dimensional clustering. arXiv preprint arXiv:1407.5241, 2014.
- [33] Ravindran Kannan, Hadi Salmasian, and Santosh Vempala. The spectral method for general mixture models. In International Conference on Computational Learning Theory, pages 444–457. Springer, 2005.
- [34] Ravindran Kannan and Santosh Vempala. Spectral algorithms. Found. Trends Theor. Comput. Sci., pages 157–288, 2009.
- [35] Brian Karrer and Mark EJ Newman. Stochastic blockmodels and community structure in networks. Physical Review E, 83(1):016107, 2011.
- [36] Jason M Klusowski and WD Brinda. Statistical guarantees for estimating the centers of a two-component gaussian mixture by em. arXiv preprint arXiv:1608.02280, 2016.
- [37] Amit Kumar and Ravindran Kannan. Clustering with spectral norm and the k-means algorithm. In Foundations of Computer Science (FOCS), 2010 51st Annual IEEE Symposium on, pages 299–308. IEEE, 2010.
- [38] Jing Lei and Alessandro Rinaldo. Consistency of spectral clustering in sparse stochastic block models. arXiv preprint arxiv:1312.2050, 2013.
- [39] Bruce G Lindsay and Prasanta Basak. Multivariate normal mixtures: a fast consistent method of moments. Journal of the American Statistical Association, 88(422):468–476, 1993.
- [40] Stuart Lloyd. Least squares quantization in pcm. IEEE transactions on information theory, 28(2):129–137, 1982.
- [41] Meena Mahajan, Prajakta Nimbhorkar, and Kasturi Varadarajan. The planar k-means problem is np-hard. In International Workshop on Algorithms and Computation, pages 274–285. Springer, 2009.
- [42] Frank McSherry. Spectral partitioning of random graphs. In Foundations of Computer Science, 2001. Proceedings. 42nd IEEE Symposium on, pages 529–537. IEEE, 2001.
- [43] Glenn W Milligan. An examination of the effect of six types of error perturbation on fifteen clustering algorithms. Psychometrika, 45(3):325–342, 1980.
- [44] Ankur Moitra and Gregory Valiant. Settling the polynomial learnability of mixtures of gaussians. In Foundations of Computer Science (FOCS), 2010 51st Annual IEEE Symposium on, pages 93–102. IEEE, 2010.
- [45] I Ordovás-Pascual and J Sánchez Almeida. A fast version of the k-means classification algorithm for astronomical applications. Astronomy & Astrophysics, 565:A53, 2014.
- [46] Rafail Ostrovsky, Yuval Rabani, Leonard J Schulman, and Chaitanya Swamy. The effectiveness of lloyd-type methods for the k-means problem. In 2006 47th Annual IEEE Symposium on Foundations of Computer Science (FOCS’06), pages 165–176. IEEE, 2006.
- [47] Karl Pearson. Contributions to the mathematical theory of evolution. Philosophical Transactions of the Royal Society of London. A, 185:71–110, 1894.
- [48] David Pollard. A central limit theorem for k-means clustering. The Annals of Probability, pages 919–926, 1982.
- [49] David Pollard. Empirical processes: theory and applications. In NSF-CBMS regional conference series in probability and statistics, pages i–86. JSTOR, 1990.
- [50] David Pollard et al. Strong consistency of -means clustering. The Annals of Statistics, 9(1):135–140, 1981.
- [51] Mingjun Song and Sanguthevar Rajasekaran. Fast algorithms for constant approximation k-means clustering. Trans. MLDM, 3(2):67–79, 2010.
- [52] D Michael Titterington, Adrian FM Smith, and Udi E Makov. Statistical analysis of finite mixture distributions. Wiley,, 1985.
- [53] Santosh Vempala and Grant Wang. A spectral algorithm for learning mixture models. Journal of Computer and System Sciences, 68(4):841–860, 2004.
- [54] Zhaoran Wang, Huanran Lu, and Han Liu. Nonconvex statistical optimization: Minimax-optimal sparse pca in polynomial time. arXiv preprint arXiv:1408.5352, 2014.
- [55] Xindong Wu, Vipin Kumar, J Ross Quinlan, Joydeep Ghosh, Qiang Yang, Hiroshi Motoda, Geoffrey J McLachlan, Angus Ng, Bing Liu, S Yu Philip, et al. Top 10 algorithms in data mining. Knowledge and information systems, 14(1):1–37, 2008.
- [56] Ji Xu, Daniel Hsu, and Arian Maleki. Global analysis of expectation maximization for mixtures of two gaussians. arXiv preprint arXiv:1608.07630, 2016.
- [57] Lei Xu and Michael I Jordan. On convergence properties of the em algorithm for gaussian mixtures. Neural computation, 8(1):129–151, 1996.
- [58] Xinyang Yi, Constantine Caramanis, and Sujay Sanghavi. Alternating minimization for mixed linear regression. In ICML, pages 613–621, 2014.
- [59] Anderson Y Zhang and Harrison H Zhou. Minimax rates of community detection in stochastic block models. arXiv preprint arXiv:1507.05313, 2015.
- [60] Yuchen Zhang, Xi Chen, Denny Zhou, and Michael I Jordan. Spectral methods meet em: A provably optimal algorithm for crowdsourcing. In Advances in neural information processing systems, pages 1260–1268, 2014.