Fermi Surface Reconstruction in the Electron-doped Cuprate Pr2-xCexCuO4-δ;
A transport study
Abstract
We report extensive resistivity, Hall, and magnetoresistance measurements on thin films of the electron-doped cuprate Pr2-xCexCuO4-δ (PCCO), as a function of doping, temperature and magnetic field. The doping dependence of the resistivity and Hall number at low temperatures are characteristic of a system near a quantum phase transition or a Fermi Surface Reconstruction (FSR) point. The spin magnetoresistance drops to zero near the critical point. The data presented in this paper were compiled during the 2004-2007 period but were never published in this comprehensive form. Because of the recent interest in very similar results now being found in the normal state of hole-doped cuprates, we believe the results of our older, mostly unpublished, work will be of interest to the present community of cuprate researchers. In particular, Fig.11 shows the large change in Hall number at the FSR point in Pr2-xCexCuO4-δ, similar to that found recently in YBa2Cu3O7-δ and La2-xSrxCuO4 (See Badoux et al. (2016) and Collignon et al. (2016)). Also, Fig.6 illustrates how the resistivity upturn is affected by the FSR. The cause of the resistivity upturn has been attributed to the loss of carriers at doping below the FSR in the hole-doped cuprates (see Laliberte et al. (2016)), however, this scenario does not explain the data for Pr2-xCexCuO4-δ. The upturn in n-doped cuprates is more-likely due to a combination of carrier decrease and a change in the scattering rate below the FSR Finkelman et al. (2010). The change in spin scattering below the FSR is illustrated by Fig.18 in this paper. Chen et al. Chen et al. (2009) have developed a model based on spin scattering that is able to explain qualitatively the resistivity upturn in all the cuprates.
I Introduction
The electron doped (n-doped) cuprates, (RE2-xCexCuO4-δ with RE=Nd, Pr, La, Sm), superconductors offer a unique system for studying the low temperatures normal state properties of a high Tc cuprate. In most of the high Tc cuprates a very high field, usually inaccessible, is needed to quench superconductivity. The normal state is thus obscured by the occurrence of superconductivity. In the n-doped cuprates the normal state is accessible at modest magnetic fields . Moreover, there is now compelling evidence that a quantum phase transition occurs as a function of doping slightly above optimum doping: the normal state Hall coefficient of Pr2-xCexCuO4-δ at 350mK exhibits an abrupt change at Dagan et al. (2004). This possibly singular behavior is accompanied by significant changes in the temperature dependence of the normal state resistivity below 20K. It was also found that the spin related magnetoresistance suddenly vanishes for at T=1.5K. This magnetoresistance appears in the region of the doping-temperature phase diagram where , or an upturn in the resistivity appears, thus suggesting that the upturn partially originates from spin scattering processes that vanish at the quantum critical point Dagan et al. (2005a). The broad antiferromagnetic region from x=0 to just above x=0.15 found in the phase diagram of the n-doped cuprates Luke et al. (1990),Kang et al. (2003),Fujita et al. (2004),Skanthakumar et al. (1992) suggests that the quantum critical point found in ref.Dagan et al. (2004) can be associated with the disappearance of the antiferromagnetic phase as the doping is increased at T=0.
Tunneling measurements give evidence for a normal state tunneling gap for dopings within the superconducting dome Kleefisch et al. (2001),Biswas et al. (2001) this gap was reported to vanish near x=0.17.Alff et al. (2003) However, Dagan et al. Dagan et al. (2005b) reported that this gap persists up to x=0.19 and for overdoped samples its behavior follows the doping dependence of Tc.
Extensive optical measurements of Pr2-xCexCuO4-δ as a function of doping revealed the signature of a density wave gap that vanishes above a critical doping, .Onose et al. (2001),Zimmers et al. (2005),Zimmers et al. (2007) Consistent with the quantum critical point found from transport Dagan et al. (2004) and with the neutron scattering measurements.Luke et al. (1990),Kang et al. (2003),Fujita et al. (2004),Skanthakumar et al. (1992) Pengcheng Dai et al. Dai et al. (2005) studied the electron-doped compound Pr0.8LaCe0.12CuO4-δ as a function of the oxygen content by means of neutron scattering. They found that the Nèel temperatures of the three dimensional ordered antiferromagnetism and of a quasi two dimensional spin density wave modulation vanish close to optimum oxygen content. Dai et al. Dai et al. (2005) suggested that superconductivity and antiferromagnetism coexist near a quantum critical point . By contrast Motoyama et al. Motoyama et al. (2007) have found that the spin correlation length remains finite at doping levels while at low temperatures it diverges near where superconductivity onsets. From these results they concluded that superconductivity and antiferromagnetism do not coexist but are separated by a quantum phase transition at . Angular magnetoresistance measurements Yu et al. (2006) were found to be consistent with ref.Dagan et al. (2004). Recent quantum oscillations measurements on Nd2-xCexCuO4-δ found an abrupt change in the oscillation frequency Helm et al. (2009) at the same doping level found in Ref.Dagan et al. (2004). The discrepancy between the transport measurements and the recent neutron scattering data regarding the location of the quantum critical point may be reconciled using a recent contribution suggesting that due to the occurrence of superconductivity the quantum critical point is shifted towards lower doping levels. When superconductivity is muted by a magnetic field the QCP shifts back to higher dopings.Sachdev (2003)
Angle resolved photoemission spectroscopy (ARPES) experiments on Nd2-xCexCuO4 show a remarkable change in the Fermi surface as a function of doping, going from a small electron pocket at in underdoped (x=0.04) to a large hole-like Fermi surface at optimal doping (x=0.15) Armitage et al. (2002),Matsui et al. (2005). The normal state transport properties of the cuprates for TTc do not follow the behavior expected for conventional metals (Fermi liquid ). For example, the Hall coefficient has a strong temperature dependence and the ab-plane resistivity varies as T (for p-type), T2 (for n-type) up to temperatures greater than 250K.
Evidence for a quantum phase transition in the hole-doped (p-type) cuprates has been reportedTallon and Loram (2001),Balakirev et al. (2003),Panagopoulos et al. (2002). However, there are major differences between the hole-doped and the n-doped cuprates: a) the phase diagram of the electron-doped (n-type) cuprates shows an antiferromagnetic phase that starts at x=0 and persists up to, possibly into, the superconducting dome, b) the transport properties are significantly different between these two types of cuprates as will be elaborated below, c) the pseudogap phase Timusk and Statt (1999) of unknown origin that is found in underdoped hole-doped samples is apparently absent on the electron-doped side. Theoretical work explained the differences in magnetic behavior between p-doped and n-doped cuprates by weaker electrons correlations, which are doping dependent in the latter Kyung et al. (2004).
In various quantum critical models there are definite predictions for the behavior of the resistivity and the Hall effect at temperatures above the quantum critical point and for doping concentrations near xc Chakravarty et al. (2002),Rosch (1999),Rosch (2000),Lin and Millis (2005),Fenton and Schofield (2005). Evidence for some of these predictions have been found in other correlated systems such as heavy fermions Mathur et al. (1998),Sidorov et al. (2002). In the cuprates, other suggestive evidence for a quantum phase transition at an under the superconducting dome has come from the observation of a low T normal state ”insulator” to metal crossover as a function of doping in both n-and p-type materials Boebinger et al. (1996),Fournier et al. (1998).
In this paper we review the results from references Dagan et al. (2004),Dagan et al. (2005a) and present new data: Hall and resistivity measurements in extended doping and temperature ranges, and field and temperature dependences of the orbital and spin magnetoresistance . We discuss the new data in the framework of the quantum critical point scenario and the other available models.
II Samples preparation and characterization.
Pr2-xCexCuO4-δ c-axis oriented films of various cerium doping concentrations were deposited from stoichiometric targets on (100) oriented SrTiO3 substrates using the pulsed laser deposition technique with conditions similar to those reported by Maiser et al. Maiser et al. (1998). The films’ thickness is approximately 3000Å. Rutherford back scattering measurements were used to determine the thickness of the films. The minimum-channeling yield obtained was 7-20 percents indicating a good epitaxial growth. The low residual resistivity (see Figure 1) and sharp Tc (see Figure 2) indicate that the films are of better quality than the best previously reported pulse laser deposition films Fournier et al. (1998) and comparable to molecular beam epitaxy grown films Naito et al. (1997). Since the oxygen content has an influence on both the superconducting and normal state properties of the material Jiang et al. (1994),Higgins et al. (2006),Kang et al. (2007) we took extra care in optimizing the annealing process for each Ce concentration. For the overdoped samples annealing at 720∘C and pressure of 30 micro-Torr results initially in a fast increase of Tc. Upon further annealing the films, both the transition temperature and width decrease with time until approaching a saturation point at time,, where no changes in these parameters are detected. Annealing for much longer time, , may result in material decomposition, holes of about 1 micron size are detected on the film’s surface. We used as the annealing time for our films. We found that increases with increasing Ce doping and that roughly , with being the films’ thickness, as expected for a diffusion process. Since oxygen is diffusing, its travel distance is proportional to the square root of time. Taking that distance as the thickness of the film, , one gets or . For optimally doped and underdoped Pr2-xCexCuO4-δ we had to simply maximize Tc and avoid decomposition spots detectable in an optical microscope. is typically 15 minutes for optimally doped samples. For the non-superconducting sample film we used the same annealing conditions as for . The saturation of the resistivity and critical temperature as a function of annealing time at suggests that the film reached equilibrium with the chambers atmosphere. By maintaining constant annealing pressure and temperature we keep similar oxygen content in all our films. Moreover, it has been recently established that oxygen is a dopant (working in opposite way to Ce) and causes disorder in the sample Higgins et al. (2006). The systematic dependence of Tc, and of on the Ce doping suggests that the oxygen content in all these films is indeed similar since all these quantities are very sensitive to the oxygen content. The films were patterned using a mechanical mask and ion milling technique to form Hall bars 6.5mm long and 0.5mm wide.
III Measurements.
Resistivity and Hall voltage were measured with a Quantum Design ”PPMS” system up to a magnetic field of 14T and down to a temperature of 0.35K. The field was applied perpendicular to the plane of the film, i.e. parallel to the c-axis. At low temperatures the Hall coefficient was measured by taking field scans from -14T to 14T, a field at which the Pr2-xCexCuO4-δ is well in the normal state even at 0.35K. Any magnetoresistance component from misalignment of the Hall bar shape was removed by subtracting -H from +H data in the usual way. At TT100K a narrower field range was used. Above 100K the temperature was scanned at 14T and the Hall voltage was calculated from the difference between these measurements. When needed the field was aligned parallel to the ab planes (H) with an accuracy better than 0.25∘. Measurements in the National High Magnetic Field Lab (NHMFL) were taken in a 32.4 T resistive magnet and at temperatures ranging from 1.5 K to 20 K. To exclude eddy current heating effects we ensured that the data was reproducible, symmetric for positive and negative magnetic fields and independent of the sweeping rate. We measure the ab-plane resistivity with a standard 4-probe technique.
IV Results and discussion.
IV.1 Resistivity
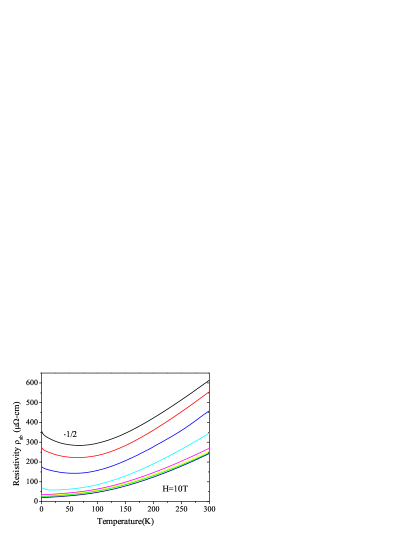
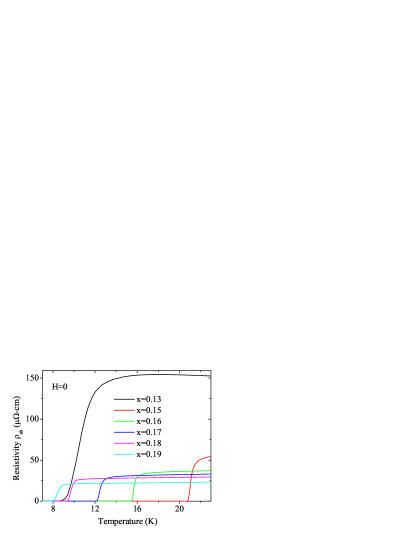
In Figure 1 we show the ab-plane resistivity versus temperature at 10T for . First, we note the decrease in the resistivity as the Ce concentration is increased. Another feature appearing in films is a sign change in (an upturn). The temperature at which the upturn appears decreases with increasing doping. Figure 2 shows the resistive superconducting transition where Tc has the expected doping dependence Maiser et al. (1998). All the films have sharp transitions. The transition width, Tc, measured as the width at half maximum of the peak in , is: Tc=0.3-0.6 K in optimum and overdoped Pr2-xCexCuO4-δ (increasing with increasing Ce doping), and Tc=2.2 K for x=0.13, all much sharper than previously reported pulse laser deposition films.
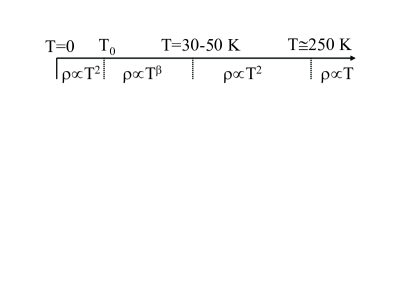
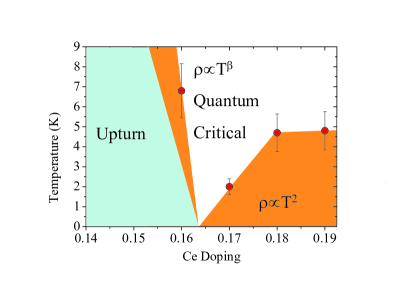
At the high temperatures (above 250K) the resistivity is roughly linear with temperature. In the intermediate temperature range (from say 30-50K to around 200K) is proportional to T Onose et al. (2001). We note that this behavior is not the usual Fermi liquid behavior expected at much lower temperatures. As the temperature is decreased from around 30 K the temperature dependence of the resistivity changes again from T2 to Tβ (with ) and then to T2 again at the lowest temperatures (below T). The different temperature regions are schematically illustrated in Figure 3. The low temperature region is the focus of this section.
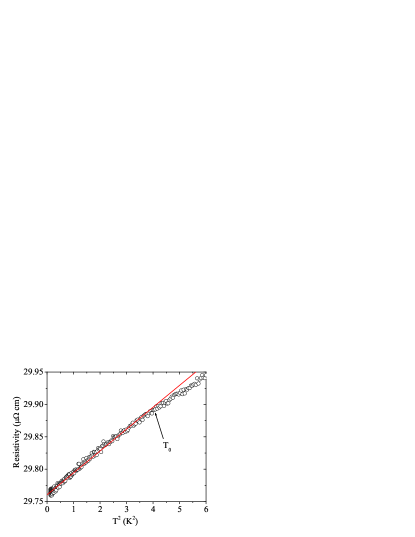
At very low temperatures the temperature dependence is Fermi Liquid like, T2. In Figure 4 we plot the resistivity versus T2 for the sample. T0 is defined as the temperature at which the data deviate from the linear fit. We shall discuss the slope of the line later on. The T2 region starts below T and for x=0.19, 0.18, 0.17 and 0.16 respectively (for the low temperature behavior is obscured by the upturn). Between the two T2 regions we find a different temperature dependence with exponent .
Near a quantum critical point one expects a quantum fluctuations region in the doping-temperature phase diagram Sachdev (1999). This region becomes narrower as the temperature is lowered. It has a shape of a funnel pointing towards the quantum critical point . This is clearly seen, for example, in heavy fermion materials Custers et al. (2003). In our case such a funnel shape region with (and maybe ) with a crossover to T2 behavior at low temperatures is expected. A major experimental complication in our case is the chemical doping as a control parameter. Such a control parameter cannot be easily tuned as for the case of heavy fermions where the control parameter is pressure or magnetic field.
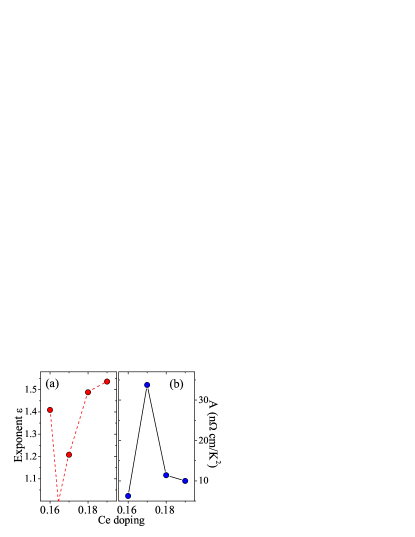
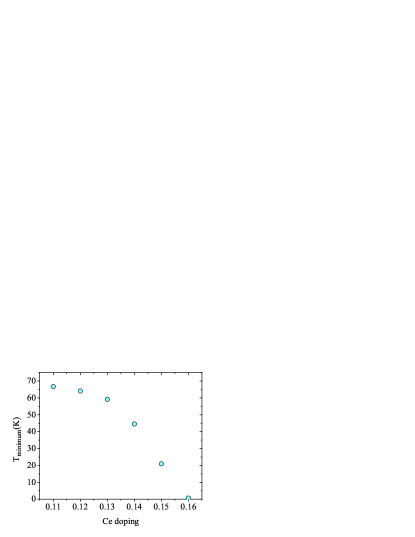
We fit the low temperature range (0.35 K to 20 K) of the resistivity data from Figure 1 to the form , with C, and independent of temperature. The exponent, , obtained from the fits is presented in figure 5. It has a strong doping dependence and gets closer to 1 as we decrease the Ce doping from 0.19 to 0.17. Decreasing the Ce doping further to x=0.16 results in an increase in to 1.4. The behavior of the resistivity at low temperatures is consistent with a quantum phase transition for several reasons: first, the doping dependence of the fitting parameter, . Since we fit our data from 0.35K to 20K we pick up the T2 region at very low temperatures and the Tβ quantum critical region. The fit is a weighted average over these two regions. The weight of each region changes with the distance from the quantum critical point . As one approaches the quantum critical point should get closer to , exactly at the quantum critical point . The doping dependence of obtained from the fit over the same temperature range for the various doping levels (Fig.5a) suggests that in a ”funnel-shape” region in the doping-temperature phase diagram a linear, or close to linear, in T resistivity occurs. This is the behavior expected for transport properties in the quantum critical fluctuation region at finite temperatures above a quantum critical point Custers et al. (2003),Varma et al. (2002),Chakravarty et al. (1989). Second, the low temperature T2 region below T0 becomes larger as we move away from the quantum critical point . This is expected assuming that the Tε region is governed by quantum fluctuations. Third, in figure 5, we plot the coefficient obtained when we fit the data to the form for the low temperature T2 region, below T0, as a function of doping. Since the resistivity is continuous, the coefficient should diverge as one approaches a quantum critical point . We find a large increase in for x=0.17, the doping at which has its smallest value. Finally, we note that the temperature of minimum resistivity where an upturn appears in behaves in a similar way (see figure 6; it decreases with increasing doping and vanishes on the overdoped side.
The various regions of resistivity behavior in the doping-temperature phase diagram are illustrated in figure 7. The data points are T0 the temperature below which a T2 behavior is observed as inferred from the deviation from the linear fit in figure 4.
The exponent at the quantum critical point itself doesn’t have to be 1. But Fournier et al.Fournier et al. (1998) found a linear in T resistivity from 10K down to 40mK in one of their x=0.17 Pr2-xCexCuO4-δ films, a film that had T K, somewhere between our and samples. It is possible that Fournier et al. hit in their Ce=0.17 film. Note that depends on both Ce and oxygen and therefore samples made by different groups can differ slightly in Ce concentration for the same carrier concentration. Also, as shown by A. Rosch Rosch (1999),Rosch (2000) disorder can affect the exponent in the quantum critical point region. Based on the value of the residual resistivity, the films of Fournier et al.Fournier et al. (1998) have different disorder than ours. Taking Fournier’s data into account appears to approach 1 around in our films.
In summary, above 100 K the resistivity follows similar temperature dependence for all doping levels.Dagan and Greene (2007) For we identify a low temperature behavior characteristic of a quantum phase transition at .
IV.2 Hall measurements.
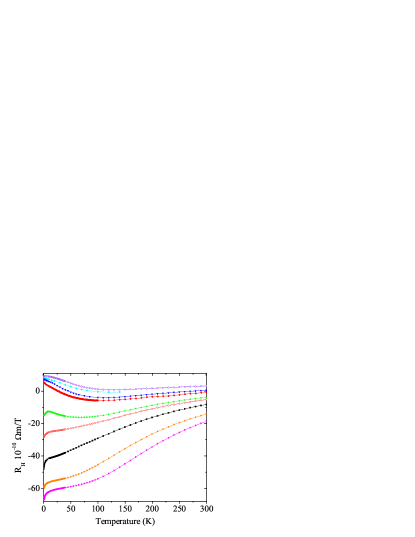
In Figure 8 we show RH as a function of temperature for various doping levels. At high temperatures (T100 K) RH has a strong temperature dependence for all doping levels. Even for the extreme ones: x=0.19, x=0.11, RH changes by factors of 4 and 2 respectively when the temperature is decreased from 300K to 100K. The sign of RH, which in a simple metal corresponds to the type of charge carrier, also changes with doping. It is also changing with temperature for . The temperature dependence of RH (along with other transport properties) was previously interpreted as evidence for two types of carriers for Ce concentrations near optimum doping () Fournier et al. (1997),Gollnik and Naito (1998). For the strong temperature dependence of RH persists even at temperatures as low as T K. Armitage et al.Armitage et al. (2002) have shown that the Fermi surface is changing from electron pockets at low doping levels to a partially gapped hole like Fermi surface at optimum doping. It is possible that the Fermi surface completely reconnects at .Matsui et al. (2007) Indeed, we observe no sign changes with temperature for and for . However, the strong temperature dependence persists even for our most overdoped sample () and the most undersoped one () where the Fermi surface is supposed to be completely hole like or electron like respectively.
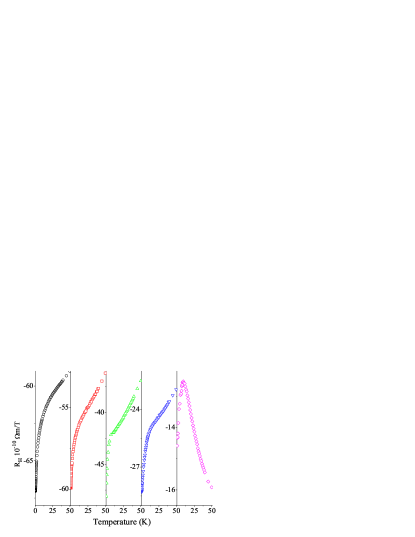
Another interesting feature seen in figure 9 for samples with is a sharp decrease in RH by about 10 below K. All these samples exhibit an upturn, an increase in resistivity with decreasing temperature. It has been suggested that weak localization is responsible for the upturn in resistivity at low temperatures Fournier et al. (2000). However, no first order corrections are expected for RH in the case of weak localization Lee and Ramakrishnan (1985). This suggests a decrease in the number of carriers at low temperatures. One has to assume that partial gapping of the Fermi surface occurs at low temperatures for underdoped Pr2-xCexCuO4-δ . The Hall number decreases by about 15 for and by about 8 for when the temperature is decreased from 10 K to 0.35 K.
In Figure 10 we show RH at 0.35 K as a function of cerium doping for to (circles). (Most data points but the x=0.14 were taken from Dagan et al. (2004)The squares are data taken from Ref.Onose et al. (2001). N. P. Ong Ong (1991) demonstrated that RH reflects the area swept by the mean free path vector while going around the Fermi surface. Therefore, the abrupt change in RH at 0.35 K is an indication of a significant reorganization of the Fermi surface , which we believe may result from a quantum phase transition between two phases in the normal state Dagan et al. (2004). From the RH behavior at 0.35 K we identify one phase at low where RH changes rapidly and another phase at high where RH varies more slowly. The quantum critical point occurs where the slope of RH versus doping changes suddenly around .
The quantum critical point that we precisely determine from RH (and from resistivity) is consistent with the doping trends seen in the magnetic Luke et al. (1990),Kang et al. (2003),Fujita et al. (2004),Skanthakumar et al. (1992) optical Zimmers et al. (2005),Zimmers et al. (2007) ,and ARPES Armitage et al. (2002) measurements. In view of the ARPES results, the change of sign is probably due to an increase of hole like contribution on the Fermi surface with increasing doping. But the quantum critical point occurs presumably, when the partial gapping of the Fermi surface disappears, which may occur at slightly higher doping. Our (found from the Hall data) agrees within error with the quantum critical point we find from the analysis. Recently, P. Li et al. have found similar results from their analysis of the low temperature thermopower in Pr2-xCexCuO4-δ Li et al. (2007). We also note that no special features are seen in either the resistivity or the Hall coefficient at , in contrast with the expected behavior in the case of a quantum critical point at that doping as suggested by Motoyama et al. Motoyama et al. (2007).


If we naively calculate the hall coefficient,, we do not get a simple relation to the Ce doping. For comparison, in Figure 10 the red dashed line is and the dotted line is with the elementary charge is the unit cell volume. Onose et al. Onose et al. (2001) pointed out that for the underdoped regime the Hall number behaves roughly as . However, for we obtained , different than the expected 0.11 value. On the overdoped side decreases with increasing doping. The positive sign of RH suggests a hole like Fermi surface, which is consistent with the increasing value of RH with increasing Ce doping and with the ARPES experiments. However, the value of RH does not follow behavior as one would naively expect from a simple electron counting even for x=0.19 where the measured Hall number is electrons per copper, very different from the expected value of 0.81. Lin and MillisLin and Millis (2005) used a mean field theory to calculate the Hall coefficient of an n-doped two dimensional system undergoing a spin density wave transition at . They showed that below the Fermi surface rearranges leading to changes in RH. Qualitatively our data agrees with Lin and Millis’s calculation. From our Hall data and the data of Ref.Onose et al. (2001) it appears that , the doping at which the hole pockets disappear, is around . However, as Lin and Millis pointed out, the numbers obtained are rather different than the theoretical prediction, which is not far off from the simple and dependence as one moves away from the critical point towards the underdoped or overdoped regions respectively. To explain the difference between theory and experiment they raised the possibility that the doping might be off. In that case the sample and samples should have ”theoretical doping” of 0.01 and 0.35 respectively. This seems unlikely since these two samples still superconduct and one does not expect the superconducting dome to extend to such extreme doping levels.
To conclude this part, we have shown that the Hall coefficient undergoes a change in its doping dependence at . This change is related to a reorganization of the Fermi surface due to a quantum phase transition. The qualitative behavior resembles the calculations of Lin and Millis for a density wave scenario. Yet, a few observations remain a puzzle: the sharp decrease of RH for at T10 K down to 0.35 K and the discrepancy between the measured RH at low temperatures and the theoretical prediction away from the quantum critical region: for and for .
IV.3 Magnetoresistance.
In this section we shall focus on the low temperature behavior of the magnetoresistance . The normal state of the n-doped cuprates is characterized by negative magnetoresistance at low temperatures. Fournier et al. Fournier et al. (2000) interpreted the upturn in resistivity, as well as the negative magnetoresistance , as a result of two dimensional weak localization by disorder. In contrast, Sekitani et al. Sekitani et al. (2003) suggested that the resistivity upturn and the negative magnetoresistance are due to scattering off Cu2+ Kondo impurities induced by residual apical oxygen. In the p-doped cuprates, for example, negative magnetoresistance was found in underdoped La2-xSrxCuO4 Ando et al. (1995). Other work was mainly focused on in-plane magnetoresistance anisotropy in lightly doped La2-xSrxCuO4 Ando et al. (2003), Pr1.3La0.7CexCuO4 Lavrov et al. (2004) or non superconducting Pr1.85Ce0.15CuO4-δ Fournier et al. (2004). We have recently reported Dagan et al. (2005a) that the negative magnetoresistance is comprised of two contributions: spin scattering that vanishes at the quantum critical point and orbital magnetoresistance . Here we shall elaborate on the behavior of these two magnetoresistance components.


In figure 12 we show the field dependence of the normalized resistivity for various doping levels. In these measurements the field is applied along the direction, perpendicular to the films’ surface at 1.5 K. We note a negative magnetoresistance existing throughout the whole doping range. For convenience the data was normalized with , the zero field extrapolation of a polynomial fit . With and as constants. The overdoped samples (left panel) exhibit smaller magnetoresistance . The low field behavior is obscured by the superconductivity. Seikitani et al. Sekitani et al. (2003) have shownb that for overdoped samples the negative magnetoresistance can be reduced significantly by reducing disorder in the sample. By applying the field along the direction we probe both the orbital and the spin components of the magnetoresistance . Assuming a two dimensional material the former is sensitive only to the axis component while the latter is approximately isotropic Dagan et al. (2005a). In figure 13 the magnetoresistance of the non-superconducting sample is shown. In figure 13a the magnetoresistance is shown as a function of field applied parallel to the planes. Assuming a two dimensional material, this measurement probes only the spin magnetoresistance. The solid line is a linear fit to the data. We note that the negative spin magnetoresistance is linear in field. At low fields, T it becomes quadratic in field (a linear in field behavior at low fields would result in a singularity at ).
In figure 13b we show the resistivity as a function of the axis field component as the sample is rotated in a constant field of T. Since the amplitude of the field and hence the spin magnetoresistance are kept constant, this measurement is sensitive only to the orbital magnetoresistance . We note a very strong angular dependence of the orbital magnetoresistance . The solid line is a fit to with and constants and the angle between the film surface and the magnetic field direction. The excellent fit suggests that the orbital magnetoresistance in this sample is logarithmic with field as expected for weak localization. However, the amplitude of the orbital magnetoresistance is huge (close to 10 percent) compared to the small effect expected for a two dimensional weak localization Lee and Ramakrishnan (1985).


The temperature dependence of the orbital magnetoresistance can be measured by subtracting out the spin magnetoresistance from the total one. , with and the resistivity at a certain temperature and field applied parallel to the planes and -axis respectively. In figure 14 at 14T is plotted as a function of temperature (circles). The spin magnetoresistance at 14T normalized with the zero field resistivity is also shown (hollow squares) in figure 14.
The non superconducting sample is the only sample where a full rotation and parallel field dependence of the magnetoresistance can be studied at low temperatures. For the superconducting samples the effects of superconductivity persist for parallel fields as high as 32T. For that reason the contribution of the spin magnetoresistance can be inferred only from a comparison between rotations in field and field sweeps parallel to the direction as we did in Ref.Dagan et al. (2005a). In figure 15 the normalized resistivity at 1.5K is plotted as a function of the axis field component. In this measurement the the sample is rotated at a constant field of 32.4T. The total field and hence the spin magnetoresistance are kept constant. This measurement is therefore sensitive only to the orbital magnetoresistance . For convenience the resistivity is normalized with its value at a axis field component of 32.4 T (the maximum value). Starting from the underdoped sample x=0.11 the orbital magnetoresistance quickly decreases with increasing doping, becoming almost zero for x=0.13, 0.14 and increases back at x=0.15.


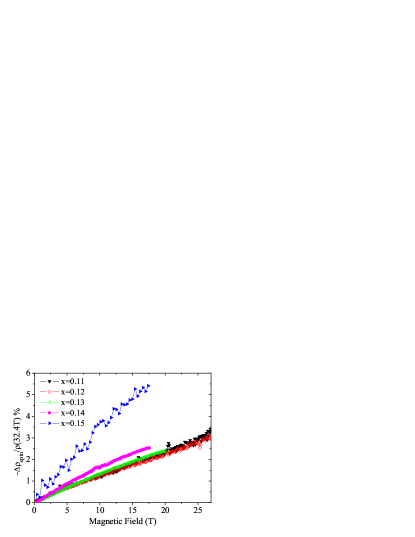
To approximate the spin magnetoresistance for the superconducting samples we use the following reasoning: assume that we apply a field ; the orbital magnetoresistance at that field can be subtracted out by measuring . Hence, the spin magnetoresistance of a field with an amplitude of is: . Here we assumed that the spin magnetoresistance is linear with field all the way up to 32.4T. The spin magnetoresistance obtained from this procedure is plotted for the various doping levels in figure 16 at 1.5 K. We note that the spin magnetoresistance is almost constant as a function of doping up to then it increases at and suddenly vanishes. The most striking result found in these measurements is the sudden disappearance of the spin magnetoresistance at and 1.5 K. This result is independent of any assumption on the field dependence of the spin magnetoresistance . In figure 17 we show the resistivity as a function of axis field component when the field is applied along the axis (black circles) (in that case it is also the total applied field) and when the sample is rotated in a constant field of 32.4 T (hollow squares). Both measurements were taken at 1.5 K for sample. As explained above the difference between these two measurements is due to the spin magnetoresistance . We arbitrarily chose a axis field component of 16.2 T (or 30 degrees to the planes for the case of rotation at 32.4 T) and measured the normalized difference between these two measurements, marked in red arrow: . As we reported previously Dagan et al. (2005a) for doping levels and higher the field sweep and the rotation in field show the same magnetoresistance as a function of axis field component. This is because at these doping levels the magnetoresistance is solely due to orbital effects. In figure 18, is plotted as a function of doping for all the samples measured. The spin magnetoresistance peaks at x=0.15 and then vanishes suddenly for overdoped samples. The sudden disappearance of the spin magnetoresistance is consistent with the existence of quantum critical point on the slightly overdoped side.
To summarize this part, a spin magnetoresistance exists for and the field dependence of this magnetoresistance is linear at and quadratic at low fields. This rules out Kondo scattering as a reason for the spin magnetoresistance . In that case the magnetoresistance is expected to have a logarithmic dependence on the magnetic field. It is therefore reasonable to relate this magnetoresistance to the antiferromagnetic order existing at these doping levels Luke et al. (1990). Scenarios such as scattering off magnetic droplets have been proposed Dagan et al. (2005a), but have received no theoretical support up to date. The sharp peak in the spin magnetoresistance near optimum doping could be due to scattering off quantum fluctuations and it is another possible evidence for a quantum phase transition .
The orbital magnetoresistance fits and as predicted for weak localization. However, this effect is rather large for samples; much larger than the ”standard” weak localization effect.
V Summary
We have presented resistivity, Hall, and magnetoresistance measurements on Pr2-xCexCuO4-δ . The singular behavior of the Hall coefficient, the change in the low temperature dependence of the resistivity and the sudden disappearance of the spin magnetoresistance fit into the proposed quantum critical point scenario Dagan et al. (2004). Recent thermopower measurements have led to similar conclusions Li et al. (2007). The nature of the phase transition cannot be determined from our experiments, but other experiments suggest that the transition is from an antiferromagnetic phase to a paramagnetic one. A partial gap opening was observed by Zimmers et al. in optical conductivity measurements on Pr2-xCexCuO4-δ Zimmers et al. (2005). They interpreted their data using a spin density wave model with a gap that vanishes at a critical doping consistent with the quantum critical point that we report here. Muon spin rotation measurements found that the antiferromagnetic phase persists up to and may be into the superconducting dome.Luke et al. (1990) Neutron scattering experiments show that antiferromagnetic phase exists above a critical field for optimally doped samples.Kang et al. (2003),Fujita et al. (2004), but no such phase was found for overdoped samples Fujita et al. (2004). We can therefore assume that the transition is due to the disappearance of a spin density wave gap followed by Fermi surface rearrangement Lin and Millis (2005). We also note that we do not find any signatures for a quantum phase transition at in our transport measurements, in contrast with Ref.Motoyama et al. (2007).
For the antiferromagnetic phase the Fermi surface is electron-like at low temperatures. It is possible that the hole-like regions seen in ARPES Armitage et al. (2002) do not reach the Fermi edge. The steep decrease in RH at low temperatures () for is a possible evidence for this scenario. If this is indeed the case, the difference between the Fermi edge and the hole band is of a few meV and it is only weakly doping dependent. At higher temperatures hole-like excitations are thermally excited and the two types of carriers contribute to the conductivity. At the quantum phase transition or slightly above it the Fermi surface becomes hole-like and its shape changes slowly with doping (compared with the strong doping dependence of the Fermi surface in the antiferromagnetic phase). The agreement between the number of carriers obtained from the low temperature Hall and thermopower measurements by Li et al. Li et al. (2007) is remarkable. Although Li et al. have used a very simple single band model to extract the number of carriers, the obtained number is similar to that of the Hall measurements. It is therefore possible that even for the overdoped side () a single band (the hole one) dominates at low temperatures. At higher temperatures thermally excited electrons contribute to the complicated temperature dependence of the Hall coefficient. However, it is still unclear why there is such a significant difference between the low temperature Hall coefficient and the expected theoretical values away from the critical pointLin and Millis (2005). Other issues that need to be resolved are: a) the origin of the peculiar T2 resistivity region at high temperatures; b) the origin of the spin magnetoresistance ; and c) the mechanism that results in such a large orbital magnetoresistance .
Acknowledgements.
This work was supported by NSF grant number NSF DMR-1410665 and by the Bi-National Science foundation . A portion of this work was performed at the National High Magnetic Field Laboratory, which is supported by NSF Cooperative Agreement No. DMR- 0084173, by the State of Florida, and by the DOE. We thank A. J. Millis, A. V. Chubukov, G. Blumberg, P. Li, W. Yu, J. S. Higgins for useful discussions and M. M. Qazilbash, A. Biswas, M. C. Barr, W. M. Fisher and R. Beck for their assistance.References
- Badoux et al. (2016) S. Badoux, W. Tabis, F. Laliberté, G. Grissonnanche, B. Vignolle, D. Vignolles, J. Béard, D. Bonn, W. Hardy, R. Liang, et al., Nature 531, 210 (2016).
- Collignon et al. (2016) C. Collignon, S. Badoux, S. Afshar, B. Michon, F. Laliberte, O. Cyr-Choiniere, J.-S. Zhou, S. Licciardello, S. Wiedmann, N. Doiron-Leyraud, et al., arXiv preprint arXiv:1607.05693 (2016).
- Laliberte et al. (2016) F. Laliberte, W. Tabis, S. Badoux, B. Vignolle, D. Destraz, N. Momono, T. Kurosawa, K. Yamada, H. Takagi, N. Doiron-Leyraud, et al., arXiv preprint arXiv:1606.04491 (2016).
- Finkelman et al. (2010) S. Finkelman, M. Sachs, G. Droulers, N. Butch, J. Paglione, P. Bach, R. Greene, and Y. Dagan, Physical Review B 82, 094508 (2010).
- Chen et al. (2009) W. Chen, B. M. Andersen, and P. Hirschfeld, Physical Review B 80, 134518 (2009).
- Dagan et al. (2004) Y. Dagan, M. M. Qazilbash, C. P. Hill, V. N. Kulkarni, and R. L. Greene, Physical Review Letters 92, 167001 (2004).
- Dagan et al. (2005a) Y. Dagan, M. C. Barr, W. M. Fisher, R. Beck, T. Dhakal, A. Biswas, and R. L. Greene, Physical Review Letters 94, 057005 (2005a).
- Luke et al. (1990) G. M. Luke, L. P. Le, B. J. Sternlieb, Y. J. Uemura, J. H. Brewer, R. Kadono, R. F. Kiefl, S. R. Kreitzman, T. M. Riseman, C. E. Stronach, et al., Phys. Rev. B 42, 7981 (1990).
- Kang et al. (2003) H. J. Kang, P. Dai, J. W. Lynn, M. Matsuura, J. R. Thompson, S.-C. Zhang, D. N. Argyriou, Y. Onose, and Y. Tokura, Nature 423, 522 (2003).
- Fujita et al. (2004) M. Fujita, M. Matsuda, S. Katano, and K. Yamada, Physical Review Letters 93, 147003 (2004).
- Skanthakumar et al. (1992) S. Skanthakumar, J. W. Lynn, J. L. Peng, and Z. Y. Li, Jour. Mag. Mat. 104-107, 519 (1992).
- Kleefisch et al. (2001) S. Kleefisch, B. Welter, A. Marx, L. Alff, R. Gross, and M. Naito, Phys. Rev. B 63, 100507 (2001).
- Biswas et al. (2001) A. Biswas, P. Fournier, V. N. Smolyaninova, R. C. Budhani, J. S. Higgins, and R. L. Greene, Phys. Rev. B 64, 104519 (2001).
- Alff et al. (2003) L. Alff, Y. Krockenberger, B. Welter, M. Schonecke, R. Gross, D. Manske, M. Naito, et al., Nature 422, 698 (2003).
- Dagan et al. (2005b) Y. Dagan, M. M. Qazilbash, and R. L. Greene, Physical Review Letters 94, 187003 (2005b).
- Onose et al. (2001) Y. Onose, Y. Taguchi, K. Ishizaka, and Y. Tokura, Phys. Rev. Lett. 87, 217001 (2001).
- Zimmers et al. (2005) A. Zimmers, J. M. Tomczak, R. P. S. M. Lobo, N. Bontemps, C. P. Hill, M. C. Barr, Y. Dagan, R. L. Greene, A. J. Millis, and C. C. Homes, Europhys. Lett. 70, 225 (2005).
- Zimmers et al. (2007) A. Zimmers, L. Shi, D. Schmadel, W. Fisher, R. Greene, H. Drew, M. Houseknecht, G. Acbas, M.-H. Kim, M.-H. Yang, et al., Physical Review B 76, 064515 (2007).
- Dai et al. (2005) P. Dai, H. J. Kang, H. A. Mook, M. Matsuura, J. W. Lynn, Y. Kurita, S. Komiya, and Y. Ando, Physical Review B 71, 100502 (2005).
- Motoyama et al. (2007) E. M. Motoyama, G. Yu, I. M. Vishik, O. P. Vajk, P. K. Mang, and M. Greven, Nature 445, 186 (2007).
- Yu et al. (2006) W. Yu, B. Liang, and R. L. Greene, Physical Review B (Condensed Matter and Materials Physics) 74, 212504 (pages 4) (2006).
- Helm et al. (2009) T. Helm, M. Kartsovnik, M. Bartkowiak, N. Bittner, M. Lambacher, A. Erb, J. Wosnitza, and R. Gross, Physical review letters 103, 157002 (2009).
- Sachdev (2003) S. Sachdev, Reviews of Modern Physics 75, 913 (2003).
- Armitage et al. (2002) N. P. Armitage, F. Ronning, D. H. Lu, C. Kim, A. Damascelli, K. M. Shen, D. L. Feng, H. Eisaki, Z.-X. Shen, P. K. Mang, et al., Phys. Rev. Lett. 88, 257001 (2002).
- Matsui et al. (2005) H. Matsui, K. Terashima, T. Sato, T. Takahashi, S.-C. Wang, H.-B. Yang, H. Ding, T. Uefuji, and K. Yamada, Physical Review Letters 94, 047005 (2005).
- Tallon and Loram (2001) J. L. Tallon and J. W. Loram, Physica (Amsterdam) C 349, 53 (2001).
- Balakirev et al. (2003) F. F. Balakirev, J. B. Betts, A. Migliori, S. Ono, Y. Ando, and G. S. Boebinger, Nature 424, 912 (2003).
- Panagopoulos et al. (2002) C. Panagopoulos, J. L. Tallon, B. D. Rainford, T. Xiang, J. R. Cooper, and C. A. Scott, Phys. Rev. B 66, 064501 (2002).
- Timusk and Statt (1999) T. Timusk and B. Statt, Rep. Prog. Phys. 62, 61 (1999).
- Kyung et al. (2004) B. Kyung, V. Hankevych, A.-M. Dare, and A.-M. S. Tremblay, Physical Review Letters 93, 147004 (2004).
- Chakravarty et al. (2002) S. Chakravarty, C. Nayak, S. Tewari, and X. Yang, Phys. Rev. Lett. 89, 277003 (2002).
- Rosch (1999) A. Rosch, Phys. Rev. Lett. 82, 4280 (1999).
- Rosch (2000) A. Rosch, Phys. Rev. B 62, 4945 (2000).
- Lin and Millis (2005) J. Lin and A. J. Millis, Physical Review B 72, 214506 (2005).
- Fenton and Schofield (2005) J. Fenton and A. J. Schofield, Physical Review Letters 95, 247201 (2005).
- Mathur et al. (1998) N. D. Mathur, F. M. Grosche, S. R. Julian, I. R. Walker, D. M. Freye, R. K. W. Haselwimmer, and G. G. Lonzarich, Nature 394, 39 (1998).
- Sidorov et al. (2002) V. A. Sidorov, M. Nicklas, P. G. Pagliuso, J. L. Sarrao, Y. Bang, A. V. Balatsky, and J. D. Thompson, Phys. Rev. Lett. 89, 157004 (2002).
- Boebinger et al. (1996) G. S. Boebinger, Y. Ando, A. Passner, T. Kimura, M. Okuya, J. Shimoyama, K. Kishio, K. Tamasaku, N. Ichikawa, and S. Uchida, Phys. Rev. Lett. 77, 5417 (1996).
- Fournier et al. (1998) P. Fournier, P. Mohanty, E. Maiser, S. Darzens, T. Venkatesan, C. J. Lobb, G. Czjzek, R. A. Webb, and R. L. Greene, Phys. Rev. Lett. 81, 4720 (1998).
- Maiser et al. (1998) E. Maiser, P. Fournier, J. L. Peng, F. M. Araujo-Moreiral, T. Venkatesan, R. L. Greene, and G. Czjzek, Physica (Amsterdam) C 297, 15 (1998).
- Naito et al. (1997) M. Naito, H. Sato, and H. Yamamoto, Physica (Amsterdam) C 293, 36 (1997).
- Jiang et al. (1994) W. Jiang, S. N. Mao, X. X. Xi, X. Jiang, J. L. Peng, T. Venkatesan, C. J. Lobb, and R. L. Greene, Phys. Rev. Lett. 73, 1291 (1994).
- Higgins et al. (2006) J. S. Higgins, Y. Dagan, M. C. Barr, B. D. Weaver, and R. L. Greene, Physical Review B 73, 104510 (2006).
- Kang et al. (2007) H. J. Kang, P. Dai, B. Campbell, p. J. Chupas, S. Rosenkranz, P. L. Lee, S. Li, S. Komiya, and Y. Ando, Nature Materials doi:10.1038/nmat1847 (2007).
- Sachdev (1999) S. Sachdev, Quantum Phase Transitions (Cambridge University Press, New York, 1999).
- Custers et al. (2003) J. Custers, P. Gegenwart, H. Wilhelm, K. Neumaier, Y. Tokiwa, O. Trovarelli, C. Geibel, C. P. F. Steglich, and P. Coleman, Nature 424, 524 (2003).
- Varma et al. (2002) C. Varma, Z. Nussinov, and W. Van Saarloos, Physics Reports 361, 267 (2002).
- Chakravarty et al. (1989) S. Chakravarty, B. I. Halperin, and D. R. Nelson, Phys. Rev. B 39, 2344 (1989).
- Dagan and Greene (2007) Y. Dagan and R. Greene, Physical Review B 76, 024506 (2007).
- Fournier et al. (1997) P. Fournier, X. Jiang, W. Jiang, S. N. Mao, T. Venkatesan, C. J. Lobb, and R. L. Greene, Phys. Rev. B 56, 14149 (1997), and references therein.
- Gollnik and Naito (1998) F. Gollnik and M. Naito, Phys. Rev. B 58, 11734 (1998).
- Matsui et al. (2007) H. Matsui, T. Takahashi, T. Sato, K. Terashima, H. Ding, T. Uefuji, and K. Yamada, Physical Review B 75, 224514 (2007).
- Fournier et al. (2000) P. Fournier, J. Higgins, H. Balci, E. Maiser, C. J. Lobb, and R. L. Greene, Phys. Rev. B 62, R11993 (2000).
- Lee and Ramakrishnan (1985) P. A. Lee and T. V. Ramakrishnan, Rev. Mod. Phys. 57, 287 (1985).
- Ong (1991) N. P. Ong, Phys. Rev. B 43, 193 (1991).
- Li et al. (2007) P. Li, K. Behnia, and R. L. Greene, Physical Review B 75, 020506 (2007).
- Sekitani et al. (2003) T. Sekitani, M. Naito, and N. Miura, Phys. Rev. B 67, 174503 (2003).
- Ando et al. (1995) Y. Ando, G. S. Boebinger, A. Passner, T. Kimura, and K. Kishio, Phys. Rev. Lett. 75, 4662 (1995).
- Ando et al. (2003) Y. Ando, A. N. Lavrov, and S. Komiya, Phys. Rev. Lett. 90, 247003 (2003).
- Lavrov et al. (2004) A. N. Lavrov, H. J. Kang, Y. Kurita, T. Suzuki, S. Komiya, J. W. Lynn, S.-H. Lee, P. Dai, and Y. Ando, Physical Review Letters 92, 227003 (2004).
- Fournier et al. (2004) P. Fournier, M.-E. Gosselin, S. Savard, J. Renaud, I. Hetel, P. Richard, and G. Riou, Physical Review B 69, 220501 (2004).