Modeling Structure and Resilience of the Dark Network
Abstract
While the statistical and resilience properties of the Internet are no more changing significantly across time, the Darknet, a network devoted to keep anonymous its traffic, still experiences rapid changes to improve the security of its users. Here, we study the structure of the Darknet and we find that its topology is rather peculiar, being characterized by non-homogenous distribution of connections – typical of scale-free networks –, very short path lengths and high clustering – typical of small-world networks – and lack of a core of highly connected nodes.
We propose a model to reproduce such features, demonstrating that the mechanisms used to improve cyber-security are responsible for the observed topology. Unexpectedly, we reveal that its peculiar structure makes the Darknet much more resilient than the Internet – used as a benchmark for comparison at a descriptive level – to random failures, targeted attacks and cascade failures, as a result of adaptive changes in response to the attempts of dismantling the network across time.
I Introduction
Since when Internet became a publicly accessible infrastructure and communication network, its resilience to random failures – caused, for instance, by unexpected crashes due to nodes’ malfunction or protocol’s errors – or attack – actions devoted to isolate nodes that play a vital role in the network – has been widely investigatedAlbert et al. (2000); Cohen et al. (2000); Callaway et al. (2000); Pastor-Satorras et al. (2001); Pastor-Satorras and Vespignani (2007). In fact, the Internet exhibits highly nontrivial structural and dynamical properties, from heavy-tail distribution of connections – known as scale-free propertyBarabási and Albert (1999) – to a moderate amount of clustering – proportional to the fraction of nodes that form closed triangles –, whose modeling has been the subject of intense research activityVázquez et al. (2003); Serrano et al. (2005, 2006); Boguná et al. (2010); Papadopoulos et al. (2012). In fact, several years after the Internet first proper crash, in 1980, the focus of many studies has been, and still is, to improve its resilienceSavage et al. (1999); Fortz and Thorup (2004); Doyle et al. (2005); Boguna et al. (2009); Boguná and Krioukov (2009); Boguná et al. (2010); Briscoe and Manner (2014). In late 90s, about 30 years after the first Internet prototype, the US Defense Advanced Research Projects Agency (DARPA) and the Office of Naval Research started to develop a communication network, at the application layer, based on anonymous connections and, in principle, resistant to both eavesdropping and traffic analysisSyverson et al. (1997). This network was based on onion routing, a special infrastructure for private communications over a public network that is able to hide the content of a message and the identity of peers who are exchanging itGoldschlag et al. (1999). Nowadays, this infrastructure is better known as Tor network and represents the backbone of the Darknet, an Web of hidden services that are not reachable from within the Internet. The Darknet turned out to be the most suitable communication network to exchange sensitive information, both licit and illicit, becoming soon the target of governments trying to identify dissidents or of intelligence agencies, such as CIA and GCHQThe Guardian , to contain unauthorized news leaks, distribution of illegal contents or trade of illegal substances.
Here, we characterize the structural properties of the Darknet across time, from 2013 to 2015, and we compare them against the Internet topology. It is worth remarking that throughout the manuscript we model and characterize the Darknet from a complex system perspective, meaning that we attach to the representation of both the Internet and the Darknet from available data, while focusing the study on the particular networks structures they provide. Note that this comparison is performed at a descriptive level, using the structure of the Internet as a benchmark to highlight the salient features of the Darknet. The Autonomous Systems data capture connections at the Internet layer (IP packages), while Tor works on the application layer, which means that is built on top of the Internet and transport layers. We propose a model, based on how Tor functions, to reproduce with high accuracy the most salient characteristics of the Darknet. Finally, we perform a thorough analysis, based on simulations, of the resilience of both networks to three different types of failures, static – due to random disruptions or targeted attacksAlbert et al. (2000) – and dynamical – due to the cascade failures induces by attacking a single specific node of the networkMotter and Lai (2002); Motter (2004), and show that the Darknet is much more robust than the Internet under any perspective.
II Overview of the data sets
For our analysis, we use publicly available data sets for both the Internet and the Darknet. The Internet topology, at the level of autonomous systems (AS), is sampled from historical AS-level topology data derived from Border Gateway Protocol (BGP) monthly snapshots, consisting of IPv4 and IPv6 links appearing between different endpoints during that month. The data are hosted by the UCLA Computer Science Department’s Internet Research LabUCLA Computer Science Department’s Internet Research Lab .
The Darknet topology is sampled from the data obtained by probing the Tor network to improve its performanceAnnessi and Schmiedecker (2016). The links between endpoints are extracted from the chain of circuits built by Tor clients to probe the network. The network is directed, but we will treat it as undirected, in the following. The full raw data are available upon request and a partial release can be downloaded from a public repositoryAnnessi and Schmiedecker . Although such data were obtained to study the performance of the Tor network and not its topology, they provide the best approximation to the underlying topology of the Darknet to date.
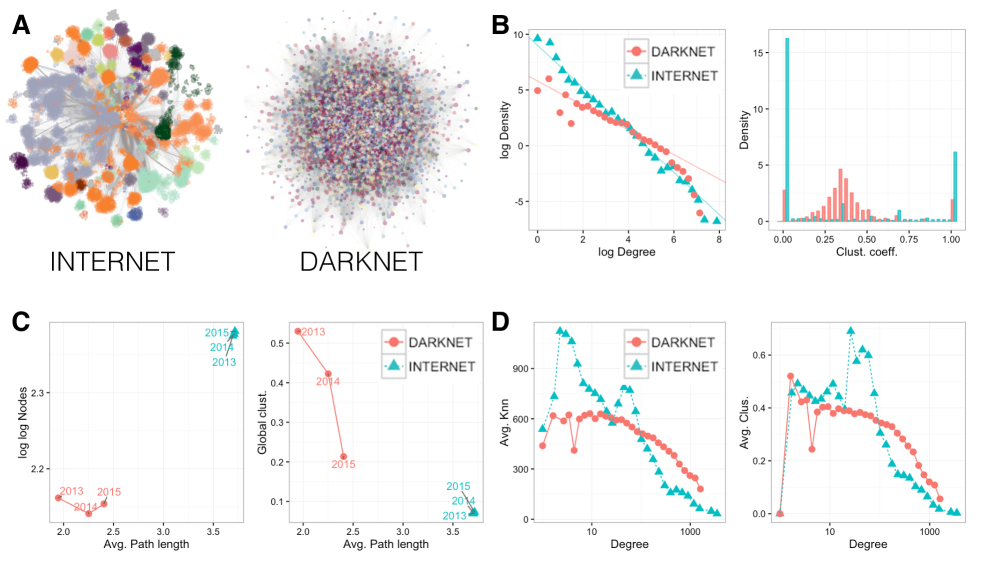
In both cases, we have been able to build three temporal snapshots, corresponding to the networks in December 2013, May 2014 and January 2015. The Internet network snapshots have 46,462, 47,626 and 49,635 nodes with 195,446, 204,254 and 221,470 connections, in the three periods, respectively. The Darknet network snapshots have 5,921, 4,953 and 5,535 nodes with 2,017,542, 536,287 and 274,831 connections, in the three periods, respectively. The structure of both networks for the 2015 period is shown in Fig.1A.
III The structure of the Darknet
III.1 Characterizing the Darknet topology
Let us indicate with the entries of the adjacency matrix of each network ( Internet and Darknet) at time ( and 2015), with value equal to one if and are connected, and zero otherwise (here , where indicates the number of nodes in the network and the number of edges).
For any node in each network, we calculate the degree – characterizing the number of connections of each node – and the local clustering coefficient – characterizing the tendency of nodes to form triangles –, defined by the ratio between the number of closed triangles involving node and the maximum number of triangles node might be part of. The mean degree is defined by , whereas the average local clustering coefficient if given by . Another macroscopic structural descriptor of interest is the global clustering coefficient , defined by the ratio between the total number of closed triplets and the total number of connected triplets of nodes in the network. In general, the values of and are different for networks with a non-homogeneous connectivity. Throughout the analysis no power-law fitting is performed, the power laws indicated in the plots are a simple eye-guide.
The degree distribution is shown in Fig. 1 and exhibits highly inhomogeneity, with evident heavy tails that resemble two different truncated power laws with cut-off. The distribution of the local clustering coefficient is also different in the two cases, with much more unclustered nodes in the Internet than the Darknet. In the Internet, a significant fraction of nodes has local clustering equal to 1 and few nodes have intermediate values, at variance with the Darknet where the local clustering is more uniformly distributed and peaked around 0.3. On average, Darknet nodes have mean degree close to 100 and are more clustered than Internet nodes, which have mean degree close to 10.
To quantify how easy is to transmit information between any two nodes of each network, we calculate the average path length , obtained by averaging the length of all shortest path connecting any pairs of nodes, and the diameter , defined as the length of the longest shortest path. The Internet has average path length close to 3.5, with diameter between 10 and 12, whereas the average path length in the Darknet ranges between 2 and 2.5, with diameter between 4 and 5 (see Supplementary Figure 1). Therefore, assuming no time constraints in the propagation of the information for both networks, communication in the Darknet is, in principle, much faster than the Internet, with the two most extremal nodes separated by no more than 5 hops, less than half of the Internet. Given that the traffic in the Darknet is encrypted and the routing is decentralized, at variance with the Internet, the shortest paths for communicating compensate the higher latency and throughput of the channels.
In Fig. 1C is shown the relationship between the size of the networks, their average path length and their global clustering for the three snapshots under consideration. The presence of high clustering and short average path lengths are strong indicators that the two networks have nontrivial topology and formation mechanisms. In fact, both networks exhibit the property known as small-worldnessWatts and Strogatz (1998). Small-world networks are characterized by high clustering, with respect to random expectation, and characteristic length scaling as . The average local clustering of the Internet is more than 1000 times higher than its uniformly random expectation, whereas the clustering of the Darknet is between 7 and 32 times larger than its uniformly random expectation, suggesting nontrivial triadic closure mechanisms underlying both networks. The characteristic length of the Darknet is larger than its uniformly random expectations, whereas this is not the case for the Internet. Although small-worldness is better understood as a tendency, rather than being quantified by a single number, it is worth remarking that – as in small worlds – for the Internet snapshots and – as in ultra-small worldsCohen and Havlin (2003) – for the Darknet ones.
The Internet and the Darknet also exhibit different types of higher-order correlations, as shown in Fig. 1D, where the average nearest-neighbors’ degree and the average local clustering coefficient are scattered against the degree. This kind of analysis is generally used to shade light on the degree-degree correlations of the network: if the degree or the clustering of each node are independent on the nodes in the neighborhood, no trends are expected. Instead, the two systems present highly anti-correlations, with hubs (i.e. nodes with largest degree) tending to be connected, on average, to nodes with much smaller degree and local clustering coefficient. This tendency is confirmed by the negative assortative mixing measured in both networks (see Supplementary Figure 1), defined by the Pearson’s correlation coefficient of the degree of linked pairs of nodesNewman (2002, 2003).
From this structural analysis we find that while structural descriptors of the Internet do not change over time, this is not the case for the Darknet, that is still evolving (see Supplementary Figure 1 for other structural descriptors and their evolution between 2013 and 2015). Nevertheless, while the Internet has been widely investigated and several models have been proposed to explain its structure, the peculiar properties of the Darknet and the previous unavailability of data about its structure call for a model that is able to reproduce its most salient characteristics.
III.2 Modeling the Darknet structure
To model the Darknet, it is crucial to understand how the Tor network functions. Any Tor client initially queries the Directory Authorities to get the consensus, a table providing information about all active nodes in the network and their metadata. The metadata is then evaluated to build a circuit, a chain of three nodes used to connect the client to the server where the (possibly hidden) service is located. The choice of the nodes of the circuit is subjected to severe constraints, by default. For instance, the same node can not be chosen twice and nodes run by the same operator are usually avoided. The choice of the first node is not performed uniformly random: instead, nodes with largest bandwidth are favored, with priority to long-lived nodes called “guard”.
We model the above procedure with the following simple growing model. At time a small random network with nodes and edges is created first. We assign a timestamp to such nodes (), that will allow to calculate their age later at any time , and a property , not varying on time, whose value is sampled from a heavy-tailed distribution, to mimic the empirical bandwidth distribution. In the following, we will use a log-normal distribution.
At each time step , a new node and links enter the network. The timestamp and a bandwidth are assigned to , as previously described. It is crucial to remark that the links do not involve node necessarily, at variance with processes based on the traditional preferential attachment. In fact, in a trust network like the Darknet, new nodes have to increase their reputation before being trusted and this is more likely to happen with aging. Nevertheless, links have to be created between trusted nodes at time , therefore nodes are randomly chosen with probability
| (1) |
where is the age of node at time . The nodes are then randomly linked into pairs. Crucially, the degree of each node at each time step does not play any role in the growing process, that is completely driven by exogenous node’s properties such aging and bandwidth. The final step is to rewire nodes randomly, while preserving the degree distribution: this last stage destroys possible structural correlations due to the previous stages of the model and it is crucial to introduce a higher level of randomness in connectivity.
This Darknet stochastic model is very general and, varying the exponents and , it is possible to explore different scenarios, e.g. where probability is inversely proportional to age () and proportional to bandwidth (). In practice, the value of is fixed by the data as and therefore, the only free parameters of the model are, in general, and . In the following, we do not fit the parameters and we just consider the simplest scenario with linear proportionality ().
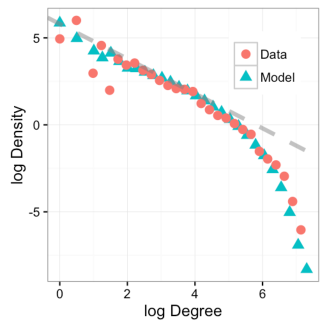
Our simulations revealed that this model generates networks that are remarkably close to the observed one from different perspectives. The high clustering and small characteristic length are satisfactorily reproduced, although the main finding here is that the degree distribution of simulated networks reproduce with excellent accuracy the empirical one, as shown in Fig. 2.
This result is of particular interest because, in general, networks with degree distribution scaling as power laws with exponent smaller than -2 (and especially close to -1) and cutoff are very difficult to model. Mechanisms involving degree-based preferential attachment and the influence of some exogenous properties, like aging and cost, have been proposedAmaral et al. (2000) although they are able to reproduce power-law scaling with exponent equal or larger than -2 with cutoff.
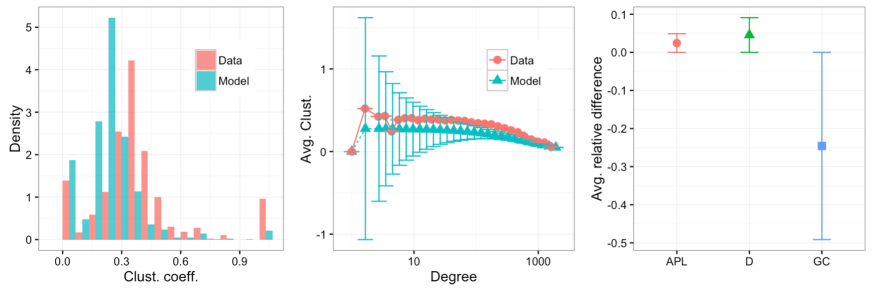
The ensemble of random realizations of our model is sufficient to reproduce the main topological properties of the Darknet, including its structural resilience as we will see later. Figure 3 shows the comparison between observed values and their expectation according to our model.
III.3 Lack of “rich club” effect in the Darknet
It has been shown that in many complex networks, especially the Internet, nodes that are very central tend to interconnect more each other. This effect, called rich club, produces a core of nodes that is really important for the stability and the robustness of the network and can be quantifiedColizza et al. (2006); Opsahl et al. (2008). Let us denote by the number of connections among the nodes with degree larger than the threshold . The rich-club coefficient is defined by
| (2) |
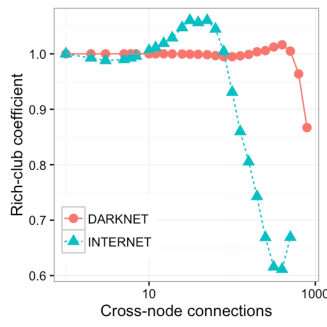
However, to understand to which extent the observed rich-club effect is not due to chance, we generate an ensemble of random networks preserving the empirical degree distribution and calculate the expected coefficient . Therefore we study how the ratio changes as a function of : when this ratio is close to 1 the observed rich-club is compatible with random fluctuations, whereas when it is larger (smaller) than 1 it indicates the existence (absence) of a rich core of nodes. We show in Fig. 4 the calculated value of the ratio for the Internet and the Darknet in 2015. The Internet exhibits a clear rich-club effect for nodes with intermediate degree, around , with largest hubs tending to be not interconnected each other. Conversely, the Darknet does not exhibit a rich core, with slight tendency of the largest hubs to be not interconnected each other, effect that in is magnitude significantly smaller than the case of the Internet.
Summing up, the Internet consists of a backbone of high-centrality nodes, whereas the Darknet does not. This result is compatible with the fact that nowadays Internet is a very centralized network providing an easier way to manage and search for online services, whereas the Darknet is very decentralized (as the Usenet, the ancestor of the Internet) but it is more difficult to manage and search for hidden online services.
IV Resilience of the Darknet
IV.1 Resilience to static failures
Here we investigate how the structural properties of the Darknet and the Internet are reflected in their resilience to perturbations. We consider three different types of disturbances based on topological and dynamical perturbations. Topological perturbations are static removals of nodes that might mimic either random disruptions or targeted attacksAlbert et al. (2000). Dynamical perturbations start with the disruption of a single node, generally the one with highest degree, that triggers a cascade of failuresMotter and Lai (2002); Motter (2004).
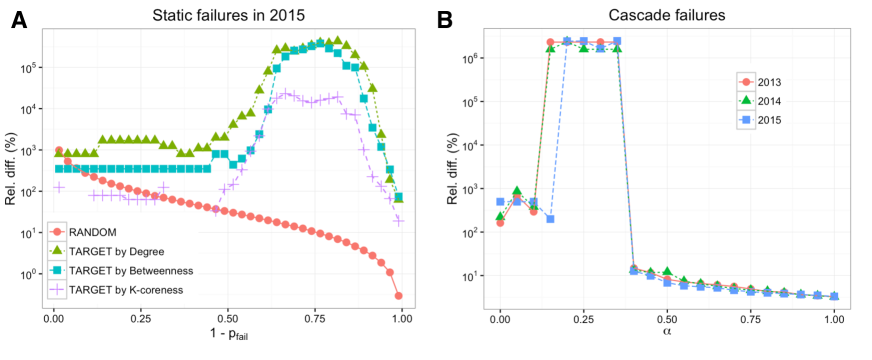
In random disruptions, a fraction of nodes is chosen uniformly random in the network and removed. In targeted disruptions, the fraction of nodes is chosen accordingly to their ranking with respect to a measure of centrality. Usually, the degree is used, but also the betweennessFreeman (1977) – quantifying centrality with respect to the communication flow – and k-corenessSeidman (1983) – based on the core decomposition of a network and characterizing to which nested shell a node belongs to. It is common to quantify the resilience of a network to such perturbations by observing how the relative size of the largest connected component changes as a function of , i.e. the fraction of survived nodes. This method allows to quantify if the survived nodes are clustered all together or if they form small disconnected clusters which hinder the network’s function.
Non-homogeneous random networks are known to be very robust to random disruptions but very sensitive to targeted attacks. In fact, our findings confirm that both the Internet and the Darknet are fairly robust to random failures, whereas they are more damaged by targeted attacks (see Supplementary Figures 2, 3 and 4). It is worth remarking that the critical point, i.e. the fraction of disruptions for which the size largest connected component of the network is minimum, is very different for the two networks. In fact, while it is enough to target the 10% of Internet nodes to reach the critical point, in the case of the Darknet much more efforts are needed, requiring a 40% of disruptions (this result is in excellent agreement with expectation from our model, see Supplementary Figure 6). The corresponding relative differences between the two networks are explicitly shown in Fig. 5A, where it is evident that the Darknet is by orders of magnitude, more resilient than the Internet, even with respect to random disruptions.
IV.2 Resilience to dynamical failures
Another type of disruption, very suitable for communication networks, is based on the inducing cascade failures. The rationale behind this method is that a node in a communication network is characterized by a certain capacity , a fixed feature quantifying the maximum amount of load they can operate with, and a load , a dynamical feature depending on the state of the network. Nodes with higher degree are assumed to be the ones with higher capacity, and at any time the total load of the network is constant, i.e. . If a node with high capacity is disrupted, its load must be redistributed among the other nodes of the network: but if the new loads exceed their capacities, a new set of nodes will suffer a disruption, redistributing the loads through the remaining nodes and so on, thus generating a cascade of failures that can paralyze the system. The dynamics of cascade failures and the resilience of the network can be studied as a function of a parameter which improves the capacity of each node to . By varying and calculating the relative size of the largest connected component at the end of the cascade, we can estimate the required enhancement in capacity to make the network resilient to this attack. The detailed results are shown in Supplementary Figures 2, 3 and 4, whereas the differences are shown in Fig. 5B. Again, the Darknet is much more resilient than the Internet to this catastrophic cascade of failures, requiring just to remain fully operative, whereas the Internet requires at least to keep operative almost the 90% of its nodes (full operations is guaranteed for values of close to 1). This result is, one more time, in excellent agreement with expectation from our model (see Supplementary Figure 6). The relative differences between the resilience of the two networks clearly indicate that before and close to the critical point the Darknet is more resilient than the Internet. This property has direct economic implications, because larger the value of higher the costs to make the network more robust.
V Conclusions and Discussion
We have investigated the structural properties of the Darknet, the communication network developed in the last two decades to guarantee safe and anonymous navigation. The Darknet exhibits some interesting features that are not shared by the structure of the Internet. Triadic closure in the Darknet is more likely than in the Internet, with communication paths much shorter in the former. Like the Internet, the Darknet is characterized by a non-homogenous connectivity distribution and the presence of higher-order degree-degree correlations. However, the topology of the Darknet is more interesting because of the peculiar heavy-tailed scaling of the degree distribution, with scaling exponent close to -1 and cutoff, at variance with the Internet, appearing more like a power-law with scaling exponent close to -2 and no evident cutoff.
The rich-club analysis has revealed the lack of a core of highly central nodes interconnected each other, at variance with the Internet where this effect is remarkable. We argue that such topological differences are responsible for the different resilience exhibited by the two communication systems in response to random disruption, target attacks and induced cascade failures. We have thoroughly shown that the peculiar topology of the Darknet, characterized by highly clustered communication circuits, small characteristic distance between hops and lack of a rich core, makes this network much more resilient than the Internet as a result of adaptive changes in response to the attempts of dismantling it across time.
While the resilience of the Internet is not significantly changing over time, the resilience of the Darknet is still changing. In fact, its resilience to topological disruption slightly decreases between 2013 and 2014, remaining unchanged in 2015, whereas in the same year the Darknet become slightly less resilient to induced cascade failures. Together with the trends revealed by other structural descriptors, such as decreasing clustering, slightly increasing characteristic length and increasing assortativity, we argue that the Darknet might be undergoing a transition from decentralization to centralization of its services. It will be interesting to confirm this prediction in the future, when longer historical data will be available.
By mimicking how the Darknet actually works, we have proposed a model – based on a preferential attachment mechanism depending on exogenous properties such as aging and bandwidth and independent on endogenous properties such as node’s degree – to reproduce the empirical degree distribution with remarkable accuracy. The analysis shows that our model is sufficient to understand the structural correlations and the robustness of the Darknet.
We recognize that there are many possible flaws in the representation of both systems, the Darknet and the Internet, as to claim to have the true topological networks. Nevertheless, from the data available it is indeed possible to start thinking about properties of the structure and its implications. The comparison between both structures has been developed at a descriptive level from the underlying graphs, with no other goal than using the Internet as a benchmark to better highlight some salient features of the Darknet. Finally, the proposal of a model driven by the main features of the Darknet seems to be enough to capture its more prominent topological features.
Summing up, the main result of this work is the indication that the mechanisms adopted to guarantee anonymous traffic in the Darknet and to improve the cyber-security of its users could be the main responsible for the peculiar topology of the Darknet observed so far, and its resilience.
Acknowledgements.
The authors thank Robert Annessi and Martin Schmiedecker for providing the Tor raw data and support on data processing. MDD acknowledges financial support from the Spanish program Juan de la Cierva (IJCI-2014-20225). AA acknowledges financial support from ICREA Academia and James S. McDonnell Foundation and Spanish MINECO FIS2015-71582.References
- Albert et al. (2000) R. Albert, H. Jeong, and A.-L. Barabási, Nature 406, 378 (2000).
- Cohen et al. (2000) R. Cohen, K. Erez, D. Ben-Avraham, and S. Havlin, Physical review letters 85, 4626 (2000).
- Callaway et al. (2000) D. S. Callaway, M. E. Newman, S. H. Strogatz, and D. J. Watts, Physical review letters 85, 5468 (2000).
- Pastor-Satorras et al. (2001) R. Pastor-Satorras, A. Vázquez, and A. Vespignani, Physical review letters 87, 258701 (2001).
- Pastor-Satorras and Vespignani (2007) R. Pastor-Satorras and A. Vespignani, Evolution and structure of the Internet: A statistical physics approach (Cambridge University Press, 2007).
- Barabási and Albert (1999) A.-L. Barabási and R. Albert, science 286, 509 (1999).
- Vázquez et al. (2003) A. Vázquez, M. Boguná, Y. Moreno, R. Pastor-Satorras, and A. Vespignani, Physical Review E 67, 046111 (2003).
- Serrano et al. (2005) M. A. Serrano, M. Boguná, and A. Díaz-Guilera, Physical review letters 94, 038701 (2005).
- Serrano et al. (2006) M. Á. Serrano, M. Boguná, and A. Diaz-Guilera, The European Physical Journal B-Condensed Matter and Complex Systems 50, 249 (2006).
- Boguná et al. (2010) M. Boguná, F. Papadopoulos, and D. Krioukov, Nature communications 1, 62 (2010).
- Papadopoulos et al. (2012) F. Papadopoulos, M. Kitsak, M. Á. Serrano, M. Boguná, and D. Krioukov, Nature 489, 537 (2012).
- Savage et al. (1999) S. Savage, T. Anderson, A. Aggarwal, D. Becker, N. Cardwell, A. Collins, E. Hoffman, J. Snell, A. Vahdat, G. Voelker, et al., Micro, IEEE 19, 50 (1999).
- Fortz and Thorup (2004) B. Fortz and M. Thorup, Computational Optimization and Applications 29, 13 (2004).
- Doyle et al. (2005) J. C. Doyle, D. L. Alderson, L. Li, S. Low, M. Roughan, S. Shalunov, R. Tanaka, and W. Willinger, PNAS of the United States of America 102, 14497 (2005).
- Boguna et al. (2009) M. Boguna, D. Krioukov, and K. C. Claffy, Nature Physics 5, 74 (2009).
- Boguná and Krioukov (2009) M. Boguná and D. Krioukov, Physical review letters 102, 058701 (2009).
- Briscoe and Manner (2014) B. Briscoe and J. Manner, Internet Engineering Task Force RFC, 7141 (2014).
- Syverson et al. (1997) P. F. Syverson, M. G. Reed, and D. M. Goldschlag, Journal of Computer Security 5, 237 (1997).
- Goldschlag et al. (1999) D. Goldschlag, M. Reed, and P. Syverson, Communications of the ACM 42, 39 (1999).
- (20) The Guardian, “NSA and GCHQ target Tor network that protects anonymity of web users,” http://goo.gl/UiZyPd, accessed: 2016-05-20.
- Motter and Lai (2002) A. E. Motter and Y.-C. Lai, Physical Review E 66, 065102 (2002).
- Motter (2004) A. E. Motter, Physical Review Letters 93, 098701 (2004).
- (23) UCLA Computer Science Department’s Internet Research Lab, “Internet AS-level Topology Archive,” http://irl.cs.ucla.edu/topology/.
- Annessi and Schmiedecker (2016) R. Annessi and M. Schmiedecker, in IEEE European Symposium on Security and Privacy (2016).
- (25) R. Annessi and M. Schmiedecker, “NavigaTor,” https://naviga-tor.github.io/.
- Watts and Strogatz (1998) D. J. Watts and S. H. Strogatz, nature 393, 440 (1998).
- Cohen and Havlin (2003) R. Cohen and S. Havlin, Physical Review Letters 90, 058701 (2003).
- Newman (2002) M. E. Newman, Physical review letters 89, 208701 (2002).
- Newman (2003) M. E. Newman, Physical Review E 67, 026126 (2003).
- Amaral et al. (2000) L. A. N. Amaral, A. Scala, M. Barthelemy, and H. E. Stanley, PNAS 97, 11149 (2000).
- Colizza et al. (2006) V. Colizza, A. Flammini, M. A. Serrano, and A. Vespignani, Nature physics 2, 110 (2006).
- Opsahl et al. (2008) T. Opsahl, V. Colizza, P. Panzarasa, and J. J. Ramasco, Physical review letters 101, 168702 (2008).
- Freeman (1977) L. C. Freeman, Sociometry , 35 (1977).
- Seidman (1983) S. B. Seidman, Social networks 5, 269 (1983).