Very Thin Disc Galaxies in The SDSS Catalog of Edge-on Galaxies
Abstract
We study the properties of galaxies with very thin discs using a sample of 85 objects whose stellar disc radial-to-vertical scale ratio determined from photometric decomposition, exceeds nine. We present evidences of similarities between the very thin disc galaxies (VTD galaxies) and low surface brightness (LSB) disc galaxies, and conclude that both small and giant LSB galaxies may reveal themselves as VTD, edge-on galaxies. Our VTD galaxies are mostly bulgeless, and those with large radial scale length tend to have redder colors. We performed spectral observations of 22 VTD galaxies with the Dual Imaging Spectrograph on the 3.5m telescope at the Apache Point Observatory. The spectra with good resolution (R 5000) allow us to determine the distance and the ionized gas rotation curve maximum for the galaxies. Our VTD galaxies have low dust content, in contrast to regular disc galaxies. Apparently, VTD galaxies reside in specific cosmological low-density environments and tend to have less connection with filaments. Comparing a toy model that assumes marginally low star formation in galactic discs with obtained gas kinematics data, we conclude that there is a threshold central surface density of about 88 , which we observe in the case of very thin, rotationally supported galactic discs.
keywords:
galaxies: structure, galaxies: edge-on, galaxies: LSB1 Introduction
Extremely thin galaxies with large major-to-minor axes ratio (typically, determined directly from images) have been noticed in large catalogs of edge-on galaxies since a long time ago, e.g., (Vorontsov-Velyaminov, 1967; Karachentsev et al., 1993; Kautsch et al., 2006). Edge-on galaxies with large axis ratio, e.g. , are often called superthin galaxies (Goad & Roberts, 1979, 1981). Only a few superthin galaxies have been studied thoroughly, such as UGC 7321 (Matthews et al., 1999; Matthews, 2000; Matthews & Wood, 2001; Uson & Matthews, 2003). A few more large superthin galaxies were studied spectroscopically (Goad & Roberts, 1981). Several spiral galaxies with large ratio and without bulges were observed in HI (Matthews & van Driel, 2000). A large sample of flat and superthin disc galaxies was analyzed and reviewed by Kautsch (2009) using data of optical photometry. The axis ratio used for the superthin selection in the previous studies was often estimated using faint outer isophotes in images, sometimes visually, making the axial ratio dependent of used photometric depth of the images (Karachentsev et al., 1993, 1999). The axis ratio estimated this way also can be biased by the presence of a bulge. In this paper we use the radial-to-vertical scale ratio (), which was automatically determined for a large sample of verified edge-on galaxies by Bizyaev et al. (2014) ("Edge-on disk Galaxies In SDSS", hereafter EGIS111http://users.apo.nmsu.edu/dmbiz/EGIS/). Since some large low surface brightness (LSB) galaxies with noticeable bulges are suspected to have thin LSB discs, we do not limit this study to bulgeless galaxies only. Instead, we call a galaxy as VTD, i.e. having a very thin disc, if its stellar disc’s radial-to-vertical scale ratio is greater than 9, independent of the bulge contribution. Below we outline general properties of our sample of VTD galaxies, consider their connection to cosmological environment, and estimate properties of their very thin discs, which may help understand the marginal star formation conditions necessary to form disc galaxies. The cosmological framework adopted throughout this paper is = 72 km s-1 Mpc-1 , = 0.3, and = 0.7.
2 The Sample of VTD Edge-on Galaxies
The large sample of verified edge-on galaxies collected by EGIS (Bizyaev et al., 2014) allows us to select a subsample of VTD galaxies large enough for statistical analysis. A disadvantage of the EGIS analysis is using a fixed, average gaussian Point Spread Function (PSF) for all galaxies. At the same time, using correct PSF is important in the case of edge-on galaxies, especially for the objects whose thickness is comparable to the PSF size. We incorporated the corresponding SDSS PSF information to the EGIS data release, and re-ran the photometric profile analysis pipeline with realistic PSFs. As a result, we selected 82 galaxies with 9 (measured in the -band).
The 1D analysis underestimates the radial-to-vertical scale ratio in the presence of a significant bulge: the scale ratio is biased 10% or more if the bulge-to-total ratio is greater than 0.4 (Mosenkov et al., 2015). In order to find possible missing galaxies with large bulges and very thin discs, we formed a subsample of objects with large ratios, which are based on the 3D analysis from EGIS. Some of those galaxies have been selected by our 1D approach. The images of the rest of the objects were visually inspected. The objects with noticeable curvature of the galactic midplane, or with small-scale structural elements that can confuse the 3D analysis (e.g. edge-on rings or spiral arms) were removed from the sample.
The resulting sample comprised 14 galaxies with large bulges and visually thin discs. All the galaxies were processed through the 1D EGIS pipeline again, while the region for the analysis was adjusted to avoid effects of the large bulges. Also, since we expect that stellar and the dust discs in VTD galaxies have comparable thickness (Dalcanton et al., 2004), in which the 3D structure analysis performed by EGIS was not reliable, the thickness of the dust layer was set equal to that of the stellar disc, and the 3D pipeline was re-run for the selected group of objects. Neither of these objects showed large enough to be qualified as VTD, so we left the subsample of 82 VTD galaxies unmodified. A well-studied "prototype" superthin galaxy UGC 7321, and two more large thin galaxies IC 2233 and UGC 711, were added to the sample for comparison purposes, despite their formally determined inverse scale ratio is less than nine. Our final sample comprises 85 VTD galaxies.
Our sample is presented in Table 1, which shows EGIS name, radial and vertical scales in kpc, the scale ratio, and the quality flag. The latter indicates ’Y’ if the radial velocity of the galaxy was within the reasonable range (between 0 and 30,000 km/s), and also if the galactic color was reported in EGIS. The flag ’N’ indicates that the spatial scales are incorrect, whereas the scale ratios calculated from the angular values of the scales are right. Note that the objects with wrong radial velocities have zeros in the scale columns in Table 1.
| EGIS Name | ,kpc | ,kpc | (r-i)0 | Quality | |
|---|---|---|---|---|---|
| EON_2.694_-0.892 | 10.01 | 0.81 | 11.0 | 0.315 | Y |
| EON_6.305_13.538 | 0.00 | 0.00 | 10.5 | 0.369 | N |
| EON_7.069_24.845 | 0.00 | 0.00 | 11.4 | 0.403 | N |
| EON_8.366_-11.103 | 16.66 | 0.81 | 23.6 | 0.336 | Y |
| EON_8.452_-9.540 | 0.00 | 0.00 | 11.3 | 0.383 | N |
| … | |||||
| The table is published in its entirety in the electronic edition. | |||||
The columns show the galaxy name according to the EGIS catalog (which contains coarse decimal RA and Dec
coordinates), the radial scale length, the vertical scale height,
the scale ratio, integral color, and the quality flag (see text).
2.1 Spectral Observations of Very Thin Disc Galaxies
Systematic study of the properties of VTD galaxies is a difficult task without dedicated spectroscopic observations. Just a few galaxies from our sample have information about their maximum of rotation curve in the HyperLeda database. We find that only 63% of VTD galaxies from our sample have radial velocities reported by HyperLeda222http://leda.univ-lyon1.fr or SDSS333http://skyserver.sdss.org.
We observed a sample of 24 objects with the Dual Imaging Spectrograph (DIS) on the 3.5m telescope at the Apache Point Observatory (APO). The observing time was issued in half-night blocks, and between December 2014 and August 2015 we were granted 8 such observing blocks. We observed in a high-resolution mode (B1200/R1200 grating), which provides the spectra resolution of about 5000. In many cases we detect major emission lines, other than H, available in our optical range (H, [OIII]4959,5007Å, [NII]6548,6583Å, & [SII]6713,6731Å).
Typically, each galaxy was observed with 3 exposures from 5 to 20 minutes long. During the observing nights we obtained a set of biases and dome flats. A Helium-Neon-Argone wavelength calibration lamp was observed immediately after each galaxy at the same position in the sky. Spectrophotometric standard stars were observed every night. The data reduction was performed with IRAF standard tools, including bias subtraction, flat fielding, wavelength calibration, sky line and sky background subtraction, cosmic ray removal, and flux calibration. We estimated the heliocentric radial velocity of the galactic centre and the maximum rotation velocity from the spectra for each galaxy. We used the emission line for it, except for two galaxies in which we did not detect any emission lines. In those cases we used the weak NaD absorption lines at 5893Å and assumed that we estimate the lower limit of the maximum rotational velocity from it.
The typical accuracy of the radial velocity and is 15 and 10 km/s, respectively, except for the galaxies without the emission lines, where only a lower limit constraint on the maximum rotational velocity is available. Fourteen galaxies from Table 2 have radial velocities reported by the NED database444https://ned.ipac.caltech.edu. The mean difference between the NED and our radial velocities is 9 km/s, and the r.m.s. is 23 km/s for this sample of fourteen galaxies. Table 2 shows the object name (in the EGIS catalog), date of observations, total exposure time, our heliocentric radial velocity, and the amplitude of the rotation curve.
| Object | Date | Exposure | RV | Vmax |
|---|---|---|---|---|
| min | km/s | km/s | ||
| EON_2.694_-0.892 | 11 Aug 2015 | 35 | 11452 | 152 |
| EON_17.154_1.641 | 21 Jun 2015 | 15 | 1964 | 79 |
| EON_17.275_19.605 | 16 Aug 2015 | 45 | 12498 | 96 |
| EON_19.768_-0.139 | 16 Aug 2015 | 35 | 5230 | 141 |
| EON_31.087_6.852 | 11 Aug 2015 | 40 | 23516 | 191 |
| EON_44.216_5.686 | 16 Aug 2015 | 45 | 11150 | 132 |
| EON_65.268_18.389 | 14 Dec 2014 | 20 | 16175 | 232 |
| EON_119.500_17.903 | 14 Mar 2015 | 60 | 45001 | 334b |
| EON_126.544_1.747 | 14 Mar 2015 | 60 | 16773 | 162 |
| EON_132.574_3.497 | 14 Mar 2015 | 45 | 8519 | 298 |
| EON_175.741_9.394 | 21 Mar 2015 | 50 | 25275 | 272 |
| EON_194.909_6.446 | 21 Mar 2015 | 45 | 6363 | 107 |
| EON_200.709_19.691a | 21 Mar 2015 | 35 | 6733 | 194 |
| EON_205.922_54.952 | 14 Dec 2014 | 40 | 19734 | 317 |
| EON_211.189_2.896 | 21 Mar 2015 | 50 | 49931 | 205c |
| EON_233.587_57.953 | 21 Mar 2015 | 35 | 29628 | 301 |
| EON_237.173_21.870 a | 21 May 2015 | 45 | 2160 | 197 |
| EON_253.776_39.578 | 21 May 2015 | 45 | 20885 | 213 |
| EON_266.042_55.180 | 21 Jun 2015 | 35 | 22872 | 174 |
| EON_267.275_64.367 | 18 May 2015 | 55 | 16244 | 193 |
| EON_310.213_-6.850 | 21 May 2015 | 50 | 8555 | 113d |
| EON_332.464_7.430 | 21 Jun 2015 | 40 | 3955 | 92 |
| EON_341.857_-1.255 | 16 Aug 2015 | 50 | 26184 | 202 |
| EON_344.455_14.189 | 21 Jun 2015 | 45 | 25896 | 215 |
a Not a VTD galaxy, the ratio is close to 6. Used for comparison purposes.
b,c No H line in the spectrum. A line identified as NaD absorption is used.
d Raising rotation curve with ring-like features.
3 General Properties of Our Very Thin Disc Galaxies
3.1 Structural Parameters
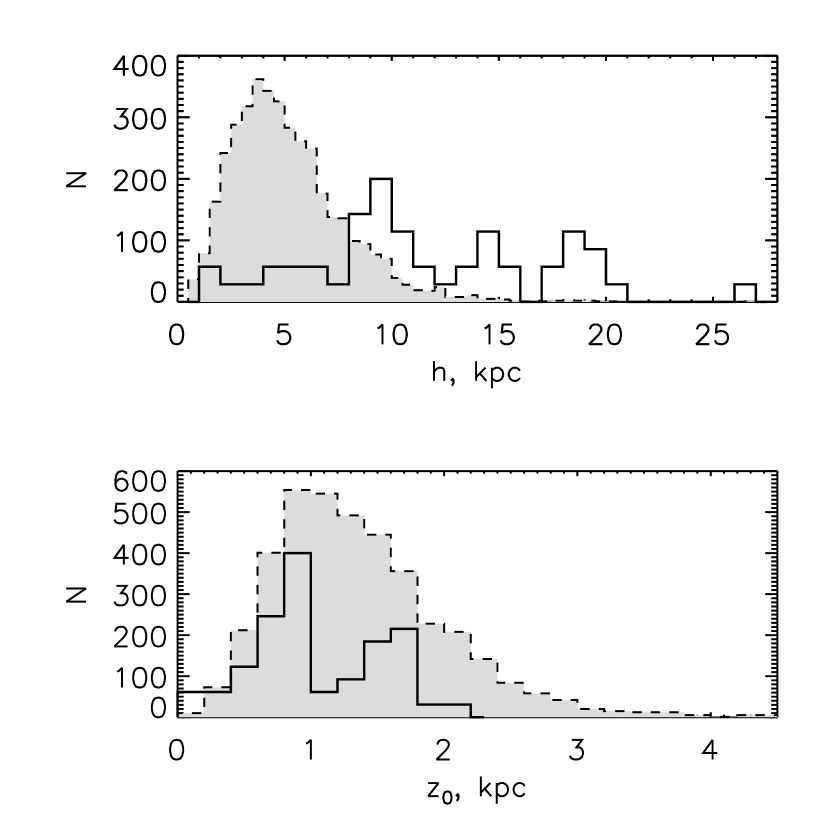
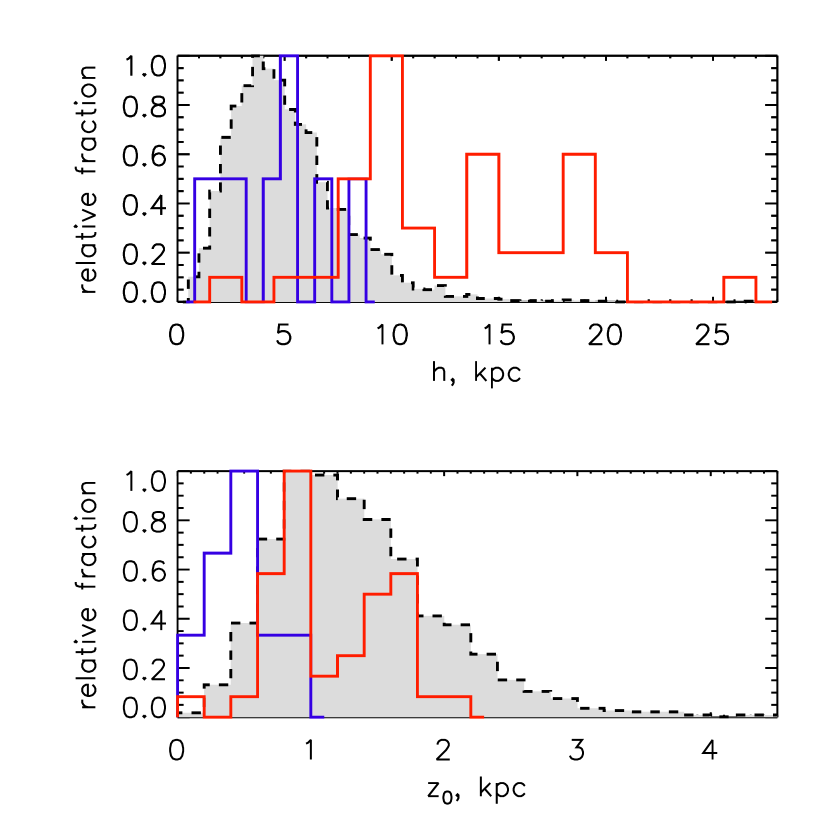
The subsample of VTD galaxies is different in both the stellar disc scale length and the stellar disc scale height in comparison to the main sample from EGIS. Figure 1 shows that the scale length of VTD discs spans a wide range and is biased towards larger values (h = 11.6 5.6 kpc) when compared to the main sample (h = 5.2 2.7 kpc). The disc scale height of very thin discs is shorter ( = 1.0 0.6 kpc) than that in the main sample ( = 1.3 0.5 kpc). The mean VTD-to-normal scale ratio is 2.2 for the scale length and 0.71 for the scale height.
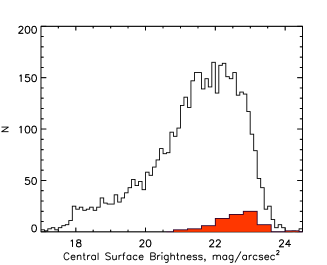
The face-on central surface brightness of VTD discs is biased towards fainter values, see Figure 2. The systematic difference of about 1.5 mag between all EGIS galaxies and VTDs. This suggests that the latter are mostly LSB galaxies, which is confirmed in detailed studies of UGC 7321 (Matthews et al., 1999; Matthews, 2000). Note that the interpretation of Figure 2 is not straightforward because dust effects can systematically move the galaxies along the X-axis, and the galaxies with thin stellar discs potentially could be more affected by the dust attenuation than galaxies with thicker discs.
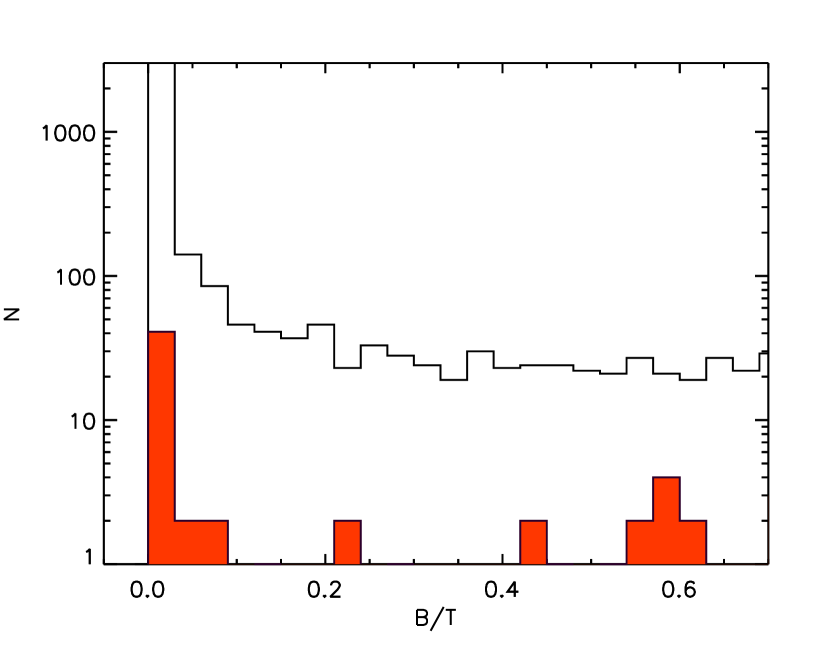
Since we do not constrain our sample by bulgeless galaxies only, we do see some bulges in our VTD objects, although they are not large. As follows from Figure 3, only a small fraction of our VTD sample members has noticeable bulges. This conclusion may be biased because the 1D analysis often reports larger than real scale height in the case of very large bulge (Mosenkov et al., 2015). Thus we might systematically miss galaxies with very large bulges and VTD discs, mostly because of dust effects. Near-infrared imaging of a statistically significant sample of thin edge-on galaxies will allow us to update the sample of VTD galaxies in the near future.
3.2 Color, Size and Extinction
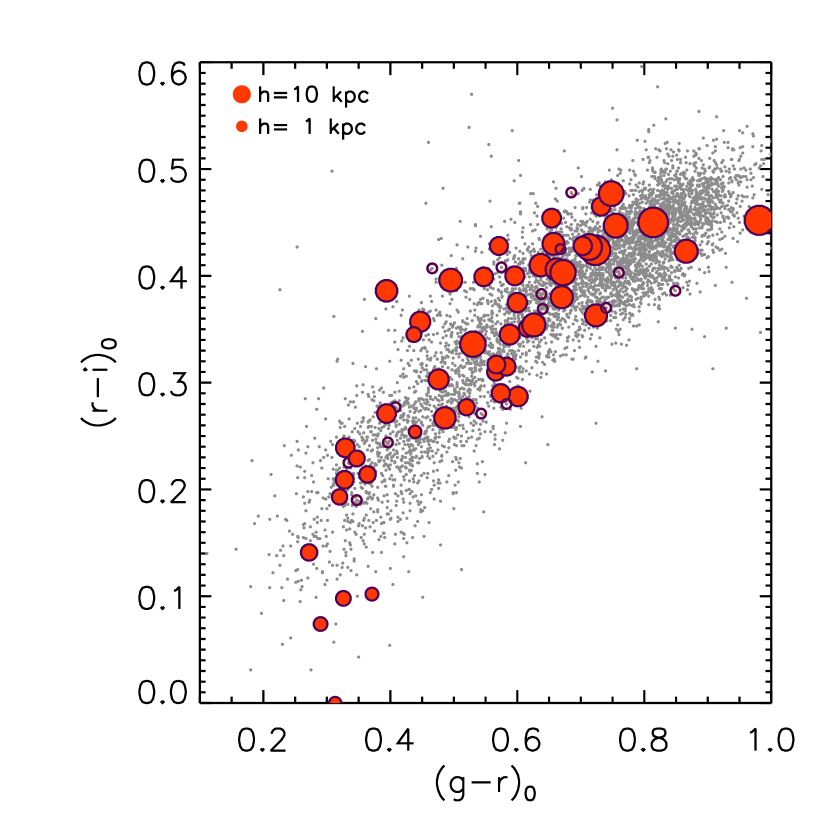
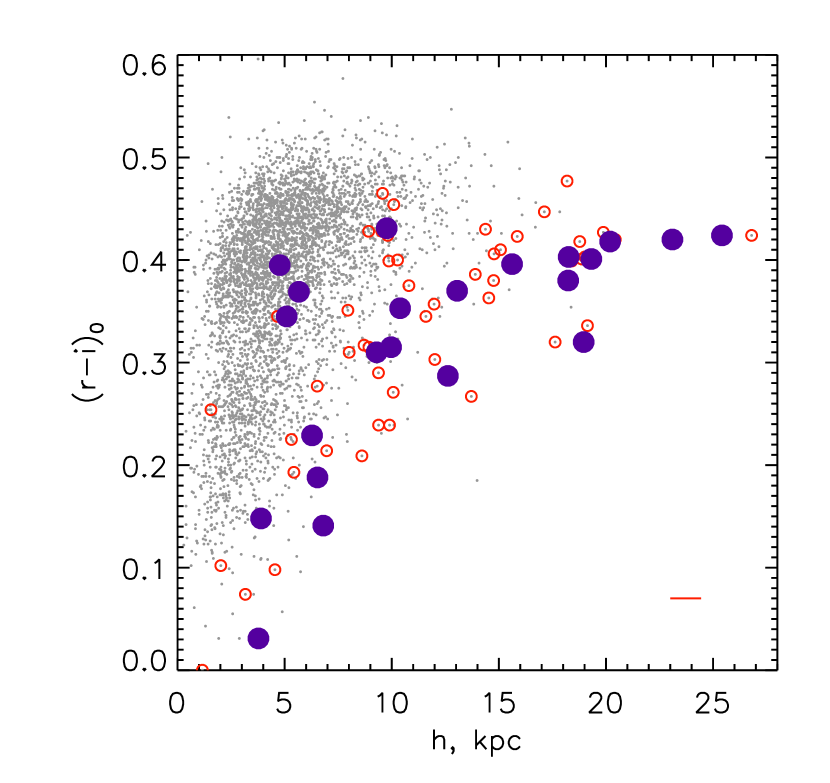
The broad-band colors of our VTD galaxies do not differ significantly from the main EGIS sample in the color-color diagram, see Figure 4. The colors of VTD galaxies span the range typical for the regular galaxies. As it is seen in Figure 4, red VTD galaxies tend to have larger scale length. The galaxies in the blue corner of the diagram have shorter scalelength, whereas the smaller galaxies occupy mostly the lower left corner of the - diagram. The scale length of the VTD galaxies (ranges from 1.6 to 28 kpc) is denoted by the symbol size in Figure 4. It may suggest that the selected sample of VTD galaxies is a mix of different types of objects, including those blue and underevolved, similar to UGC 7321, and large red LSB galaxies like Malin 2 or other large LSB systems (Beijersbergen et al., 1999; O’Neil et al., 2000). Note that the colors are corrected for the reddening in our Galaxy using Schlegel et al. (1998) maps, but are not corrected for internal extinction.
We split the sample of our VTD galaxies into blue and red subsamples (divided by the color =0.23 mag), and redraw the first figure in the paper. Figure 5 shows the distribution of the scale length and scale height of the VTD galaxies for the separate "blue" and "red" subsamples.
The VTD galaxies are not typical, as it is seen from their location on the color-size diagram in Figure 6. They have bluer color, on average, for the same size as regular EGIS galaxies. The colors of very thin galaxies can be partly or completely attributed to the low dust extinction in them (MacLachlan et al., 2011, see also discussion below), as well as to underevolved stellar population in LSB galaxies (Vorobyov et al., 2009). The higher extinction in the regular edge-on galaxies can help explain the color difference between the normal and VTD objects in Figure 6. It is worth noting that Figure 6 is qualitatively similar to the size-color plot from Beijersbergen et al. (1999) made for LSB galaxies, which also supports the analogy between the VTD and LSB galaxies.
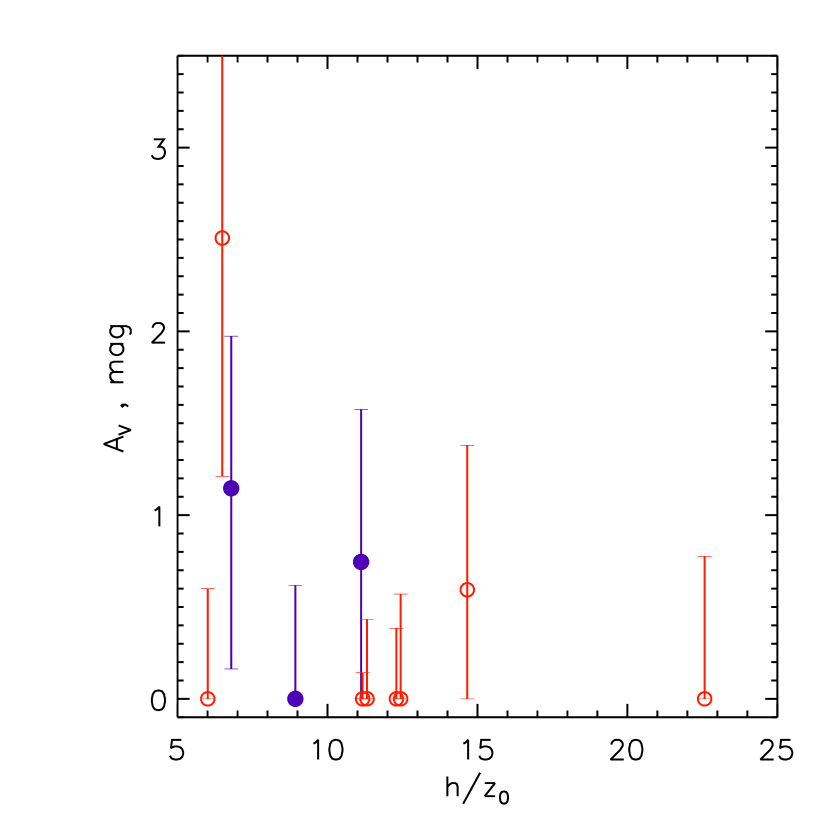
The internal extinction is low in LSB galaxies (Matthews & Wood, 2001). MacLachlan et al. (2011) came to a conclusion that small and thin LSB galaxies have low overall dust extinction. Their face-on optical depth is much less than unity. The dust scale height in those galaxies is comparable to their stellar scale height. By analogy, we expect that our VTD galaxies also have low dust extinction. While the H line is detected in the majority of our objects from Table 2, only 11 galaxies have measurable H lines. We integrated the hydrogen line fluxes all over the galaxies in order to increase the signal-to-noise and estimate the overall extinction from the H/H ratio (Charlot & Longhetti, 2001). We noticed that the background stellar population spectrum is not detected in majority of the galaxies or looks extremely weak, and the correction for the underlying absorption does not affect the estimated fluxes. Figure 7 shows the overall extinction AV corrected for the foreground Milky Way reddening (Schlegel et al., 1998) plotted for the galaxies with different thickness. We also include two regular EGIS galaxies (EON_200.709_19.691 and EON_237.173_21.870) that did not meet the "very thin disc" threshold. The bullets designate the small galaxies with low amplitude of rotation curve, 110 km/s. The circles show the galaxies with 110 km/s. The VTD galaxies in Figure 7 indicate low dust extinction, which suggests their low dust content (see also Matthews & Wood, 2001; MacLachlan et al., 2011).
4 Very Thin Disc Galaxies in Cosmological Context
Cosmological simulations suggest that the formation of LSB galaxies may require special cosmological conditions: in general, LSB galaxies are born in 15% less concentrated dark matter halos than high surface brightness galaxies (e.g., Maccio et al., 2007). Karachentsev et al. (2016) found that very thin galaxies tend to have smaller number of satellites than regular spiral galaxies. We investigate if VTD galaxies correlate with elements of the large-scale structure, such as voids, superclusters, and filaments.
A catalog of filaments identified in SDSS data by Tempel et al. (2014) allows us to find the minimum distance from a galaxy in the EGIS catalog to a filament. We filtered the EGIS catalog and left only the objects within the same redshift range as our sample of VTD galaxies.We also limited the maximum radial velocity in both samples by 25,000 km/s since the majority of VTD galaxies are have lower radial velocities. Note that the conclusions presented below do not change if the maximum radial velocity is limited by slightly different value (e.g. 30,000 km/s.) In this case the Kolmogorov-Smirnov test suggests that the probability that the distances in the two subsamples are drawn from the same distribution equals to 0.77. Then we estimated three-dimensional distances to the filaments from Tempel et al. (2014) for the objects from both samples.
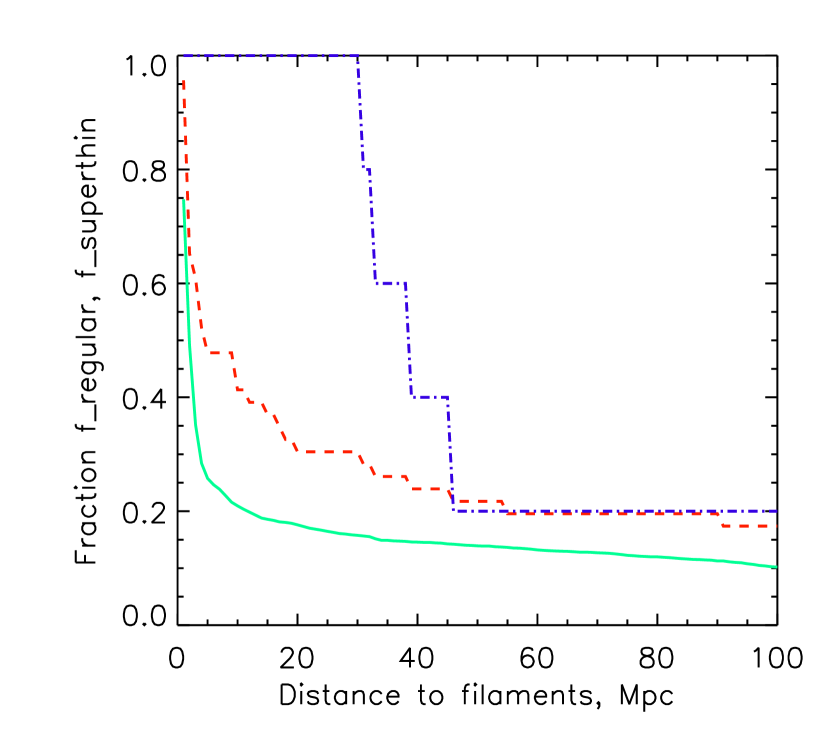
We observe significant difference in how the VTD and regular galaxies associate with the filaments. Figure 8 shows the fraction of galaxies that are farther than certain distance from filaments for three groups of objects: all non-thin disc galaxies, all VTD galaxies, and those from the latter group whose scale length is shorter than 4.5 kpc. Here the fraction that equals to 1 means that there are no objects closer than this distance from the filament, and the fraction of 0 means that all objects of this kind are located closer than certain distance to the nearby filament.
It is seen that within a certain distance from filaments we observe a smaller fraction of VTD galaxies than regular EGIS objects. The fraction of non-associated supethins is more than twice as large than that of the regular edge-on galaxies starting with a few Mpc from filaments.
Interesting to notice that LSB galaxies also tend to avoid the inner regions in filaments ( inner 5 Mpc), and prefer to reside in the outer regions there (Mo et al., 1994; Rosenbaum & Bomans, 2004). Since large and small galaxies tend to have different colors (Figure 4), which may reveal different evolution scenarios, we also check if the radial scale length affects the fraction of the galaxies associated with filaments. The dash-dotted blue curve in Figure 8 designates relatively small VTD galaxies defined as those with the scalelength h 4.5 kpc. This subsample of small VTD galaxies indicates higher than in the general VTD subsample fraction of objects that do not associate with filaments. In general, we observe that VTD galaxies tend to reside in low-galaxy density environments, similar to completely bulgeless disc galaxies (Kautsch et al., 2009).
The smaller VTDs are apparently, underevolved objects that were born and evolved in unperturbed environment, with slower rate of accretion from filaments. This, probably, explains why we can find such galaxies at larger distances from filaments with respect to all other objects in our sample.
In order to estimate the dependence of our conclusions of the sample selection, we varied the lower and upper thresholds of the radial velocity that determines the inclusion of objects into both samples. We found that the conclusion of this section that VTD galaxies tend to avoid filaments (in the comparison with the regular galaxies) holds for a wide variety of the distance-limited subsamples. The conclusion is independent of the estimated Kolmogorov-Smirnov (KS) probability (that is the probability that the samples of the regular and VTD galaxies are drawn from the same parental population). The KS probability can be as high as 0.98 for certain cases of the radial velocity thresholds selection.
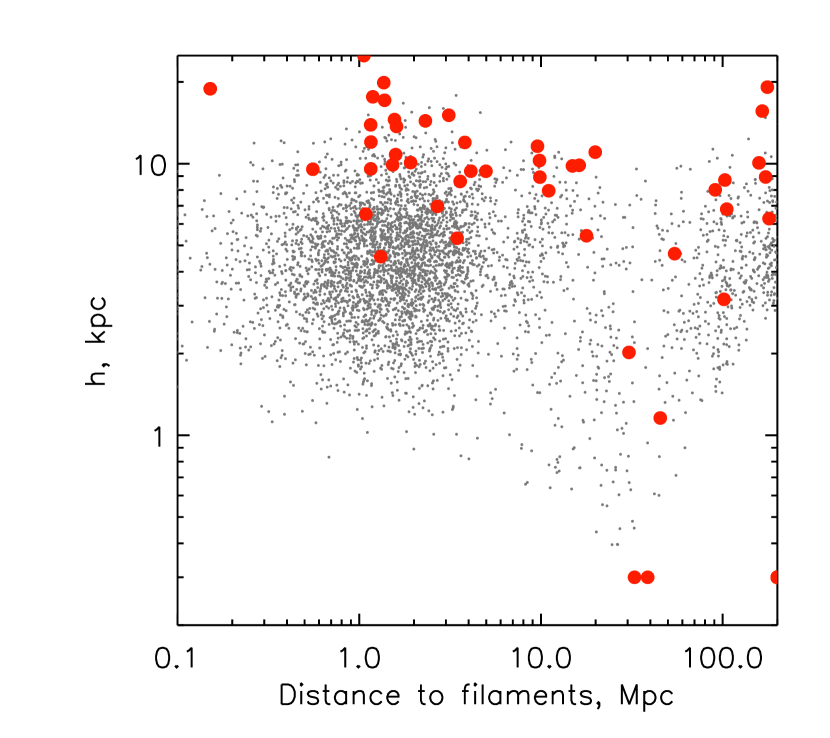
Figure 9 shows both VTD and regular EGIS samples of edge-on galaxies on the distance-to-filament versus the scale length diagram. Figure 9 highlights that small VTD galaxies can be found at larger distances from filaments, whereas the proximity to the filaments of the large VTDs resembles that of the regular EGIS galaxies.
We observe no difference between the correlation of all EGIS galaxies and VTD galaxies with voids: both groups of galaxies stay away from voids, according to the catalog by Varela et al. (2012). We checked if there is a difference in the fraction of regular and VTD galaxies that associate with superclusters identified by Liivamagi et al. (2012), and did not find significant difference. Figure similar to Figure 8 made with the distance to superclusters instead of filaments shows no difference between all EGIS and VTD galaxies.
5 How to Make a Very Thin Disc Galaxy?
The main ingredients of known VTD galaxies are massive dark matter halos and LSB stellar discs (Matthews et al., 1999; Uson & Matthews, 2003; Bizyaev & Mitronova, 2002; Bizyaev & Kajsin, 2004; Sotnikova & Rodionov, 2006; Bizyaev & Mitronova, 2009; Karachentsev et al., 2016). The gas fraction is also high in some VTD galaxies (Matthews & van Driel, 2000; Uson & Matthews, 2003; Banerjee et al., 2009). It was found that the gravitational potential of dark matter halo dominates at all radii in a VTD galaxy UGC 7321 (Banerjee et al., 2009).
5.1 Properties of Dark Matter Halos in Very Thin Disc Galaxies
A massive dark halo is a necessary but not sufficient condition: Saha (2014) found that a galaxy has to avoid forming a bar or prominent spirals during its evolution to be a VTD. Banerjee & Jog (2013) analyzed the halo concentration parameter in two galaxies and concluded that a compact dark matter halo with its scale less the radial scalelength of the stellar disc is required to assemble a VTD galaxy. Sotnikova & Rodionov (2006) concluded that the presence of a compact, not necessarily massive bulge in a spiral galaxy may be enough to suppress the bending instability and to keep the stellar disc very thin. This finding supports the conclusions by Banerjee & Jog (2013), because Sotnikova & Rodionov (2006) noticed that the gravitational potential of a compact bulge has the same effect as the potential of a compact dark halo. Khoperskov et al. (2010) simultaneously modeled rotation curves and thickness of several galaxies, including three very thin ones. They found that dark halos dominate by mass in the galaxies with very thin stellar discs. The presence of a compact dark halo in galaxies with very thin discs is not confirmed by Khoperskov et al. (2010). Instead, the results of Khoperskov et al. (2010) indicate that stellar discs must have a low surface density to keep them very thin.
An interesting example comes from the dynamical analysis of components of a giant LSB galaxy Malin 2: Kasparova et al. (2014) confirm a low surface brightness stellar disc in Malin 2, and also a very massive dark halo. The stellar disc thickness estimated from dynamical equilibrium reasons is of the order of 1 kpc in Malin 2 (A. Kasparova, private communication), so the galaxy can be considered as a VTD, with a large scale ratio 20. The halo scale length was estimated by Kasparova et al. (2014), and the conclusion is opposite to that by Banerjee & Jog (2013): an extended and spread-out halo is required to make a giant LSB (and VTD) galaxy. Thus we suspect that the halo concentration parameter may work different ways in the evolution of small and large VTD galaxies, but in all cases a low surface density stellar disc is required.
5.2 Disc Surface Density Threshold and Very Thin Stellar Discs
The marginal conditions for star formation in galactic discs can be explored and quantified with the help of VTD galaxies. VTDs exhibit low-density discs and gravitationally dominating dark halos. This brings them close to the minimum conditions, which are necessary for starting the star formation. Therefore, VTD galaxies provide an additional tool, the disc thickness, which cannot be infinitely small. The one-dimensional gas velocity dispersion is of the order of 6 km/s in the star forming media (see e.g., Kennicutt, 1989), and the stellar disc formed from the gas cannot decrease its vertical velocity dispersion being collisionless.
A toy model of an exponential stellar disc embedded into a spherical gravitational potential brings up simple equations to estimate the relative disc thickness (Zasov et al., 1991, 2002; Kregel & van der Kruit, 2005; Sotnikova & Rodionov, 2006; Bizyaev & Mitronova, 2009; Khoperskov et al., 2010). We assume that the disc mass is , and the total mass of the galaxy within four disc scale lengths is . Here is the central surface density of the stellar disc, is the circular velocity, which can be assumed as constant in the case of a flat rotation curve, and is the gravitational constant. We consider the discs are in equilibrium in the vertical direction, with their vertical scaleheight determined via the vertical equilibrium condition for the isothermal slab (Spitzer, 1942): , where is the vertical stellar or gas velocity dispersion.
The radial stellar velocity dispersion in a disc that is marginally stable against axisymmetric perturbations in its plane, is (Toomre, 1964), where is the epicyclic frequency. If we take into account the non-axisymmetric perturbations and a finite layer thickness, the minimum radial dispersion should be greater than , where is the Toomre parameter (e.g., Polyachenko et al., 1997, and references therein). The radial profile of usually has a wide minimum with the value in the region of in the marginally stable discs (see, e.g., numerical simulations by Khoperskov et al., 2003). The value of is consistent with the empirical criterion of the gravitational stability (Kennicutt, 1989). Thus, we can safely assume that is a constant at intermediate distances to the galactic centre. The epicyclic frequency at the region of the flat rotation curve is , and we get . At the total-to-disc mass ratio is .
The low vertical dispersion in disc galaxies allows us to introduce a few more simplifications. Note that if we consider early epochs of the galaxy formation, the discs should be assumed mostly gaseous, for which (Safronov, 1960) and = 1. In general, considering the instability of multi-component galactic discs (Jog & Solomon, 1984; Rafikov, 2001; Romeo & Falstad, 2013) as well as finite gas and stellar layer thickness (e.g., Bogelman & Shlosman, 2009) should introduce corrections to the stability criterion. Fortunately, the proximity of the vertical velocity dispersion in the stellar and gas discs, as well as the small disc thickness, make the pure gas disc stability criterion equation well applicable in the case of the VTD discs. In this case
| (1) |
Formally, equation (1) does not put any constraints on the stellar disc thickness and if , the ratio grows infinitely, too.
Although we considered a purely gaseous disc in our toy model, the stellar component inevitably emerges in real galaxies. It is worth noticing that if we apply a two-component stability criterion (Jog & Solomon, 1984; Efstathiou, 2000) in which the stellar velocity dispersion is equal or higher than that in the gas, we obtain a higher critical density necessary to make the disc (stellar and gaseous together, in this case) unstable. The stellar or gas discs can be stable if considered taken apart, but their combination can be unstable, at the same time. In this case our approximation of purely gaseous disc at the beginning, when the star formation just started, constrains the lower limit of the critical density necessary for starting the disc fragmentation.
One more limitation to the disc thickness comes from the inability to make vertical component of the velocity dispersion arbitrary small. We assume that one-dimensional gas velocity dispersion is limited by (10/) km/s, and that the stellar population cannot inherit the vertical velocity dispersion less than this value. Starting with equation (1), we substitute km/s, , , and in it, and get , where is the base of the natural logarithm. In more convenient designation this can be written
| (2) |
where km/s. Equation (2) predicts very thin discs ( for ) for galaxies with massive dark halos () (Bizyaev & Mitronova, 2009; Khoperskov et al., 2010; Uson & Matthews, 2003; Kasparova et al., 2014), while the predicted thickness for galaxies becomes unrealistic. Large values of would help partly “fix” equation (2): Mosenkov et al. (2010) report slightly higher maximum values of up to 8, but it will not prevent equation (2) from displaying very high ratios for large galaxies with .
The star formation threshold criteria in the form of a plain critical surface density were considered in the past (e.g., Guiderdoni, 1987; Skillman, 1987; van der Hulst et al., 1987; Impey & Bothun, 1989; Phillips et al., 1990; Clark & Glover, 2014). We consider this for our galaxies as well, because this threshold density can limit the disc surface density. We employ a relationship between the radial scale length and the rotation velocity , as follows from Courteau et al. (2007); Hall et al. (2012). The coefficient in the equation can be calibrated using existing kinematic measurements available for several VTD galaxies from our sample, see the next section. In this case equation (1) can be written
| (3) |
Here is expressed in km/s, and in M⊙/pc2; , . In this case we expect for small galaxies like UGC 7321, and for giant LSB galaxies like Malin 2 (given a proper value of ).
Since equations (2) and (3) have different functional dependence of the rotation curve amplitude , we can distinguish between the two cases considered above. The thinnest discs in the VTD galaxies should highlight the cases of the lowest vertical stellar velocity dispersion and lowest stellar density.
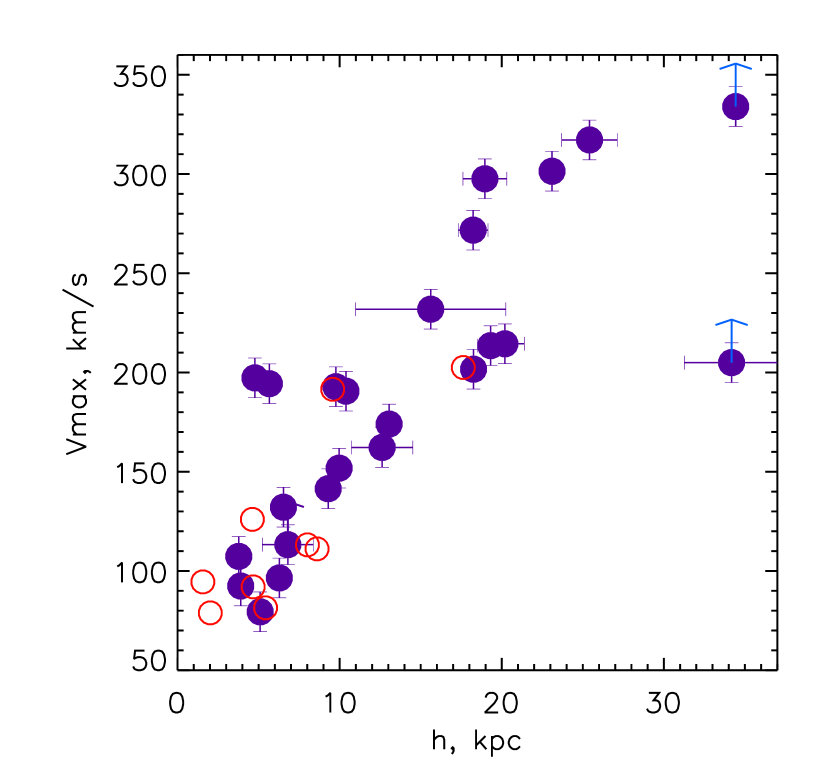
Figure 10 demonstrates the relation between the rotation curve maximum and the radial scale length for nine galaxies with data from HYPERLEDA (open circles) and for the galaxies observed by us (filled circles). The trend corresponds to the dependency. The arrows indicate the two cases of the lack of emission lines in spectra, when NaD absorption line was used to constrain the , and one more case of purely raising rotation curve with ring-like brightness distribution in the H rotation curve. The latter indicates that we observe emission from a gas ring in the galaxy, whereas the outer regions can rotate faster than gas in the ring.
5.2.1 The Disc Surface Density Threshold
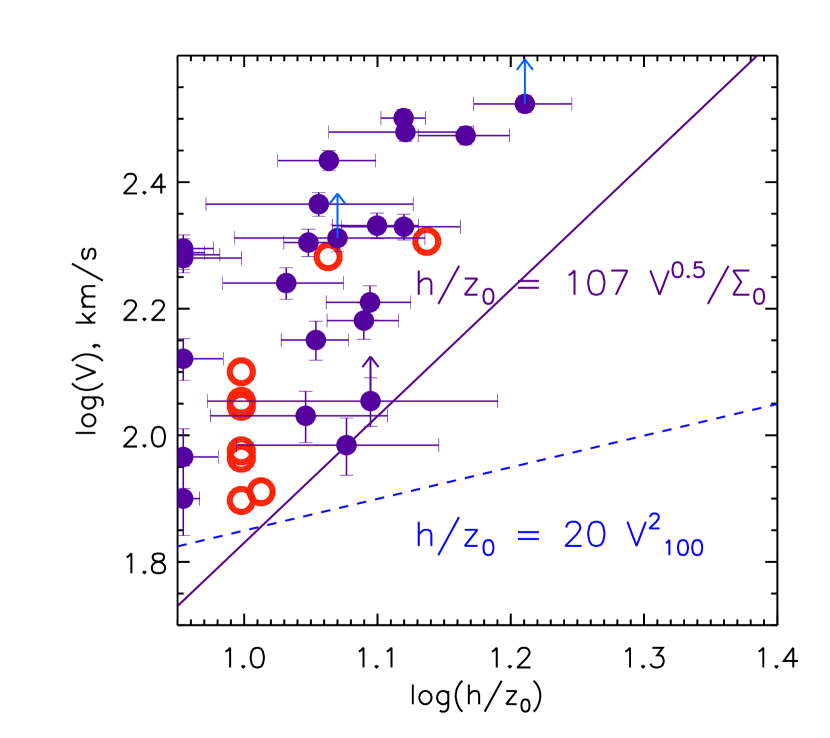
Figure 11 shows the comparison between and for our VTD galaxies. The open circles designate the galaxies with the rotation curve maximum found in literature (HYPERLEDA), while the filled circles show our APO/DIS measurements (§2.1). The arrows indicate the galaxies with the lower limit of , same as in Figure 10.
The solid and dashed lines correspond to equations (3) and (2) with , respectively. The observing point allocation in Figure 11 strongly favors the case of a star formation threshold surface density. Since all galaxies (not only VTDs) are located above the solid line because the threshold should prevent them from moving below this line), the lowest points help determine the “envelope” line that corresponds to certain lowest . We determine that the solid curve in Figure 11 corresponds to = 88 M⊙/pc2. As it follows from the assumed initial conditions and assumptions for the equations, this is the stellar and gas surface density summed together. It is interesting to notice that the upper left corner in Fig. 11 in Matthews & van Driel (2000) demonstrates a similar “envelope” feature and confirms our finding, although the definition of ratio in Matthews & van Driel (2000) comes from a visual estimate, therefore it is hard to compare it quantitatively to our results. Kregel et al. (2005) show this “envelope” feature in their versus plots as well. Note that the predictions of our toy model are in qualitative agreement with N-body simulations of UGC 7321, which suggest that the central surface density in the stellar disc ranges between 50 (Banerjee & Jog, 2013) and 200 M⊙/pc2 (Khoperskov et al., 2010).
The galaxies that are located above both the solid and dashed lines in Figure 11 have their disc surface density above the threshold and the stellar velocity dispersion above the minimum value. It does not mean that galaxies with lower surface density and, hence, lower surface brightness cannot exist: galaxies can have a lower central surface density, but their discs will be thick and have a relatively high vertical stellar velocity dispersion, i.e. they will be more pressure supported and less rotationally supported. In the latter sense they will resemble Irr/Im galaxies rather than Sd. The minimum central surface density that we observe in the large, rotationally supported disc galaxies, may be a manifestation of the disc formation regulating processes via the spin angular momentum parameter (Peebles, 1969; Dalcanton et al., 1997): LSB galaxies with massive dark halos tend to have large and a low dark matter halo concentration index (Maccio et al., 2007). Since we assumed the marginal stability of galactic discs to evaluate equation (1), this threshold density is an additional threshold, independent of the Toomre-Kennicutt large scale instability criterion (Kennicutt, 1989).
Our toy model uses several simplifications and assumptions. “Typical” values of numerical coefficients may not work well in all cases of the extreme conditions, which we consider. The modelling of real galaxy rotation curves with the application of additional constraints from the stellar disc thickness for a larger sample of VTD galaxies should help to better understand their dynamical status and the star formation threshold. The essential transparency of the dust layer in the galaxies is an additional feature, which should simplify the estimation of the parameters of the galactic components from the rotation curve modelling (e.g., as shown in Zasov & Khoperskov (2003); Kregel & van der Kruit (2005)).
5.3 Very Thin Disc Galaxies and LSB galaxies
The properties of VTD galaxies resemble those of LSB disc galaxies. Both classes of galaxies have low surface brightness, both are relatively deficient in dust, and prefer to reside outside the core filament regions. VTD galaxies possess large fraction of dark matter, similar to many LSB galaxies. We can conclude that VTD galaxies are mostly LSB galaxies, but the opposite is incorrect, in general: not all LSB galaxies are VTD, as well as not all LSB galaxies have massive dark halos (Graham, 2002). Moreover, extreme LSB galaxies with a surface density below 90 M⊙/pc2 should have moderate (less than nine) radial-to-vertical disc scale ratios and the stellar velocity dispersion close to that in the galactic gas medium. Additional studies of statistically large samples of VTD galaxies are needed to verify our conclusions.
6 Conclusions
We select 85 VTD galaxies with large radial-to-vertical scale ratios from the EGIS catalog of edge-on galaxies (Bizyaev et al., 2014). The VTD galaxies have larger scale lengths and shorter scale heights than regular EGIS objects in general. The objects with large radial and vertical scales tend to have redder colors, whereas smaller VTD galaxies have bluer colors.
VTD galaxies are mostly LSB stellar systems with low dust extinction. They may possess bulges, but a large fraction of VTD galaxies have very small bulges (bulge-to-total luminosity ratio is less than 0.1) or no bulges at all.
VTD galaxies from our sample avoid large-scale filaments twice as frequent than regular EGIS objects, thus suggesting that the VTDs are located in more isolated environment. At the same time, VTD galaxies possess very massive and spread out dark matter halos, which makes the dark-to-luminous mass ratio several times greater than that in regular spiral galaxies. Further studies of correlations between the properties of the dark halos around VTD galaxies and cosmological structures in which they reside should help identify specific cosmological conditions necessary to create VTD, dark matter dominated disc galaxies.
Correlation between the scale ratio and maximum rotational velocity, as well as the lack of very thin and low-massive galaxies, suggests that the formation of the disc component in galaxies is regulated by a threshold surface density. Using kinematic data available for a sample of VTD galaxies observed with the Dual Imaging Spectrograph at the Apache Point Observatory, we conclude that the minimum central surface density in the VTD galaxies is 88 M⊙/pc2. Galaxies with less central surface density indicate a small ratio (i.e. they are not VTD), and they are less rotationally supported systems.
Acknowledgements
DB is supported by RSF grants RSCF-14-50-00043 (spectra acquisition and reduction) and RSCF-14-22-00041 (data interpretation and modeling.) AM is a beneficiary of a mobility grant from the Belgian Federal Science Policy Office. We acknowledge partial financial support from the RFBR grants 14-02-00810 and 14-22-03006-ofi. Based on observations obtained with the Apache Point Observatory 3.5-meter telescope, which is owned and operated by the Astrophysical Research Consortium.
We appreciate valuable suggestions by Heinz Andernach (Univ. Guanajuato) for his help in increasing our sample of EGIS galaxies with known parameters. We thank Dmitry Makarov (SAO RAS) and Vasily Belokurov (University of Cambridge) for comments on many individual galaxies in the EGIS catalog. We thank anonymous referee for helpful constructive comments that improved the paper.
We acknowledge the usage of the HyperLeda database. This research has made use of the NASA/IPAC Extragalactic Database (NED) which is operated by the Jet Propulsion Laboratory, California Institute of Technology, under contract with the National Aeronautics and Space Administration.
References
- Banerjee et al. (2009) Banerjee, A., Jog, C., & Matthews, L. 2009, ASP Conf. Ser., 407, 99
- Banerjee & Jog (2013) Banerjee, A. & Jog, C. 2013, MNRAS, 431, 582
- Beijersbergen et al. (1999) Beijersbergen, M., de Blok, W. J. G., & van der Hulst, J. M. 1999, A&A, 351, 903
- Bizyaev & Kajsin (2004) Bizyaev, D. & Kajsin, S. 2004, ApJ, 613, 886
- Bizyaev & Mitronova (2002) Bizyaev , D. & Mitronova, S. 2002, A&A, 100, 200
- Bizyaev & Mitronova (2009) Bizyaev , D. & Mitronova, S. 2009, ApJ, 702, 1567
- Bizyaev et al. (2014) Bizyaev, D., Kautsch, S., Mosenkov, et al. 2014, ApJ, 787, 24 (EGIS)
- Bogelman & Shlosman (2009) Bogelman, M. & Shlosman, I. 2009, ApJ, 702L, 5
- Bottema (1993) Bottema, R., 1993, A&A, 275, 16
- Charlot & Longhetti (2001) Charlot, S. & Longhetti, M. MNRAS, 323, 887
- Clark & Glover (2014) Clark, P. C. & Glover, S. 2014, MNRAS, 44, 2396
- Courteau et al. (2007) Courteau, S., Dutton, A., van den Bosch, F., et al. 2007, ApJ, 671, 203
- Dalcanton et al. (1997) Dalcanton, J. J., Spergel, D. F., & Summers, F. J. 1997, ApJ, 482, 659
- Dalcanton et al. (2004) Dalcanton, J. J., Yoachim, P., & Bernstein, R. A. 2004, ApJ, 608, 189
- Dehnen & Binney (1998) Dehnen, W. & Binney, J.J. 1998, MNRAS, 298, 387
- Efstathiou (2000) Efstathiou, G. 2000, ApJ, 317, 697
- Gerssen et al. (2000) Gerssen, J., Kuijken, K., & Merrifield, M. 2000, MNRAS, 317, 545
- Graham (2002) Graham, A. 2002, MNRAS, 334, 721
- Goad & Roberts (1979) Goad, J. W., Roberts, M. S. 1979, BAAS, 11, 668
- Goad & Roberts (1981) Goad, J. W., Roberts, M. S. 1981, ApJ, 250, 79
- Guiderdoni (1987) Guiderdoni, B. 1987, A&A, 172, 27
- Hall et al. (2012) Hall, M., Courteau, S., Dutton, A., et al. 2012, MNRAS, 425, 2741
- Impey & Bothun (1989) Impey, C. & Bothun, G. 1989, ApJ, 341, 89
- Jarrett et al. (2003) Jarrett, T. H., Chester, T., Cutri, R., et al. 2003, AJ, 125, 525
- Jog & Solomon (1984) Jog, C. & Solomon, P. 1984, ApJ, 276, 127
- Karachentsev et al. (1993) Karachentsev, I. D., Karachentseva, V. E., Parnovskij, S. L. 1993, Astronomische Nachtichten, 314, 97
- Karachentsev et al. (1999) Karachentsev, I. D., Karachentseva, V. E., Kudrya, Yu. N., et al., 1999, Bull. Spec. Astr. Obs., 47, 5
- Karachentsev et al. (2016) Karachentsev, I. D., Karachentseva, V. E. & Kudrya, Yu. N., 2016, arXiv:1605.03734
- Kasparova et al. (2014) Kasparova, A., Saburova, A., Katkov, I., et al. 2014, MNRAS, 437, 3072
- Kautsch et al. (2006) Kautsch, S. J., Grebel, E. K., Barazza, F. D., & Gallagher, J. S., III 2006, A&A, 445, 765
- Kautsch et al. (2009) Kautsch, S. J., Gallagher, J. S., & Grebel, E. K. 2009, Astronomische Nachrichten, 330, 1056
- Kautsch (2009) Kautsch, S. J. 2009, PASP, 121, 1297
- Kennicutt (1989) Kennicutt, R. C. 1989, ApJ, 344, 685
- Khoperskov et al. (2003) Khoperskov, A., Zasov, A., & Tyurina, N. 2003, Astron. Reports, 47, 357
- Khoperskov et al. (2010) Khoperskov, A., Bizyaev, D., Tiurina, N., & Butenko, M. 2010, Astronomische Nachtichten, 331, 731
- Kregel et al. (2005) Kregel, M., van der Kruit, P. C., & Freeman, K. C. 2005, MNRAS, 358, 503
- Kregel & van der Kruit (2005) Kregel, M. & van der Kruit, P. C. 2005, MNRAS, 358, 481
- Liivamagi et al. (2012) Liivam gi, L., Tempel, E., & Saar, E. 2012, A&A, 539, 80
- Maccio et al. (2007) Maccio, A., Dutton, A., van den Bosch, F., et al. 2007, MNRAS, 378, 55
- MacLachlan et al. (2011) MacLachlan, J. M., Matthews, L. D., Wood, K., & Gallagher, J. S. 2011, ApJ, 741, 6
- Matthews et al. (1999) Matthews, L. D., Gallagher, J. S., & van Driel, W. 1999, AJ, 118, 2751
- Matthews (2000) Matthews, L.D., 2000, AJ, 120, 1764
- Matthews & van Driel (2000) Matthews, L. D. & van Driel, W. 2000, A&A, 143, 421
- Matthews & Wood (2001) Matthews, L. D. & Wood, K. 2001, ApJ, 548, 150
- Mo et al. (1994) Mo, H. J., McGaugh, S. S., & Bothun, G. D. 1994, MNRAS, 267, 129
- Mosenkov et al. (2010) Mosenkov, A.V., Sotnikova, N.Ya., & Reshetnikov, V.P. 2010, MNRAS, 401, 559
- Mosenkov et al. (2015) Mosenkov, A.V., Sotnikova, N.Ya., Reshetnikov, V.P., et al., 2015, MNRAS, 451, 2376
- O’Neil et al. (2000) O’Neil, K., Bothun, G. D., & Schombert, J. 2000, AJ, 119, 136
- Peebles (1969) Peebles, P. J. E. 1969, ApJ, 155, 393
- Phillips et al. (1990) Phillipps, S., Edmunds, M. G., & Davies, J. 1990, MNRAS, 244, 168
- Polyachenko & Shukhman (1977) Polyachenko, V. L. & Shukhman, I. G. 1977, Astronomy Letters, 3, 134
- Polyachenko et al. (1997) Polyachenko, V., Polyachenko, E., & Strel’nikov, A. 1997, Astron. Letters 23, 525
- Rafikov (2001) Rafikov, R. 2001, MNRAS, 323, 445
- Romeo & Falstad (2013) Romeo, A. & Falstad, N. 2013, MNRAS, 433, 1389
- Rosenbaum & Bomans (2004) Rosenbaum, S. D. & Bomans, D. J. 2004, A&A, 422, 5
- Safronov (1960) Safronov, V. S. 1960, Ann. d’Astrophysique, 23, 979
- Saha (2014) Saha, K. 2014, arXiv:1403.1711
- Schlegel et al. (1998) Schlegel, D.J., Finkbeiner, D.P. & Davis, M., 1998, ApJ, 500, 525
- Skillman (1987) Skillman, E. D. 1987, Proc. of a conference at the California Institute of Technology, Pasadena, California, June 16-19, 1986. Ed. C. J. Lonsdale Persson, p. 263
- Sotnikova & Rodionov (2006) Sotnikova, N. & Rodionov, S. 2005, Astronomy Letters, 31, 17
- Sotnikova & Rodionov (2006) Sotnikova, N. & Rodionov, S. 2006, Astronomy Letters, 32, 649
- Spitzer (1942) Spitzer, L., 1942, ApJ, 95, 329
- Tempel et al. (2014) Tempel, E., Stoica, R., Mart nez, V., et al. 2014, MNRAS, 438, 3465
- Toomre (1964) Toomre, A. 1964, ApJ, 139, 1217
- Uson & Matthews (2003) Uson, J. & Matthews, L. 2003, AJ,125, 2455
- van der Hulst et al. (1987) van der Hulst, J. M., Skillman, E. D., Kennicutt, R. C., & Bothun, G. D. 1987, A&A, 177, 63
- Varela et al. (2012) Varela, J., Betancort-Rijo, J., Trujillo, I., & Ricciardelli, E. 2012, ApJ, 744, 82
- Vorobyov et al. (2009) Vorobyov, E.I, Shchekinov, Yu., Bizyaev, D., Bomans, D. et al. 2009, A&A, 505, 483
- Vorontsov-Velyaminov (1967) Vorontsov-Velyaminov, B. 1967, in Modern Astrophysics, ed. M. Hack (Paris: Gauthier-Villars), p.347
- Walker et al. (1996) Walker, I. R., Mihos, J. C., & Hernquist, L. 1996, ApJ, 460, 121
- Wright et al. (2010) Wright, E. L., Eisenhardt, P. R. M., Mainzer, A. K. et al. 2010, AJ, 140, 1868
- Zasov et al. (1991) Zasov, A.V., Makarov, D. I., & Mikhailova, E. A. 1991, Astronomy Letters, 17, 374
- Zasov et al. (2002) Zasov, A.V., Bizyaev, D.V., Makarov, D. I., & Tiurina, N.V., Astronomy Letters, 2002, 28, 527
- Zasov & Khoperskov (2003) Zasov, A. V. & Khoperskov, A. V., 2003, Astronomy Letters, 29, 437