16\Yearpublication\Yearsubmission\Month\Volume\Issue
later
The XMM Deep Survey in the CDFS
Abstract
The Chandra Deep Field South (CDF–S) was observed by XMM–Newton for a total of about 3 Ms in many periods over the past decade (2001–2002 and 2008–2009). The main goal of the survey was to obtain good quality X–ray spectroscopy of the AGN responsible for the bulk of the X–ray background. We will present the scientific highlights of the XMM–Newton survey and briefly discuss the perspectives of future observations to pursue XMM deep survey science with current and forthcoming X–ray facilities.
keywords:
galaxies: active – X-rays: galaxies1 Introduction
The primary goal of the XMM–Newton ultra–deep survey in the CDF–S was a detailed study of the X–ray spectral properties and cosmological evolution of heavily obscured AGN. The long exposure in the CDF–S, coupled with the XMM–Newton detector’s spectral throughput, made possible to obtain good quality () spectra for some 170 X–ray sources (=1.221; =4.8 1043 erg s-1) over the range of redshifts and luminosities which are relevant in terms of their contribution to the X–ray background.
Since the early pioneering models (Setti & Woltjer 1989; Comastri et al. 1995), it was realized that the XRB spectrum can be reproduced by an evolving population of unobscured and obscured active galaxies (AGN) integrated over a broad range of luminosities and up to very high redshift. Obscured AGN are known to produce the bulk ( 80%) of the Universe accretion power and to play an important role in the processes responsible for the correlations between nuclear and host galaxy properties (Kormendy & Ho 2103). Gas and dust obscuration may represent a transient, but extremely important, phase in the cosmic history of accretion onto Supermassive Black Holes (i.e. Hopkins et al. 2008).
From an X–ray perspective, obscured AGN are roughly subdivided in two major classes depending if the optical thickness for Compton scattering of the obscuring gas is larger (lower) than unity. The Compton thick threshold (NH cm-2) corresponds to an exponential cut–off in the X–ray spectrum below approximately 10 keV. This value is coincident with the upper energy bound of focusing instruments of large X–ray observatories, most notably XMM–Newton and Chandra. As a consequence, deep and ultra–deep surveys were extremely efficient in the discovery and characterization of the Compton–thin population up to high redshifts (Vito et al. 2014). Furthermore, the much more elusive Compton thick AGN are a key ingredient in all the models of the XRB and are required to fit the peak of its emission at 20–30 keV and the source counts in the X–ray band. Even though the number of bona–fide Compton thick AGN has significantly increased in the last decade (see the review by Lanzuisi in this volume), their space density and cosmological evolution remain poorly understood.
It turns out that excellent fits to the XRB spectrum and source counts are obtained even for widely different assumptions on the spectra, space density and evolution of the most obscured AGN (Gilli et la. 2007; Treister et al. 2009; Ballantyne et al. 2011; Akylas et al. 2012; Ueda et al 2014; Esposito & Walter 2016)
The advent of NuSTAR with a spectral coverage extending up to 80 keV and a sensitivity which has allowed to resolve about of the 8–24 keV XRB (Aird et al. 2015; Harrison et al. 2016) has started to improve our knowledge of high energy emission processes in the most obscured AGN. Despite the significant progresses obtained by the spectral analysis of NuSTAR survey sources (Zappacosta et al 2017; Del Moro et al. 2017), deep XMM–Newton and Chandra data are still extremely valuable to break the degeneracy between the various parameters.
Here we overview the results obtained by the XMM–Newton deep survey in the CDF–S (i.e. Comastri et al. 2011) in particular those related to the search for and the characterization of obscured AGN at cosmological distances.
2 X-ray catalog
The large effective area of XMM–Newton in the 2–10 and 5–10 keV bands, coupled with a 3.45 Ms nominal exposure time (2.82 and 2.45 Ms after light curve cleaning for MOS and PN, respectively), allowed us to build clean samples in both bands, and makes the XMM-CDFS the deepest XMM–Newton survey currently published in the 5–10 keV band. A three–band colour image is shown in Figure 1. A number of 339 and 137 sources are detected over an area of 0.25 deg2 in the bands reported above with flux limits of 6.6 10-16 and 9.5 10-16 erg cm-2 s-1 , respectively. The flux limits at 50% of the maximum sky coverage are 1.8 10-15 and 4.0 10-15 erg cm-2 s-1, respectively (Ranalli et al. 2013). The cumulative flux of hard X–ray sources accounts for about 60% of the 5–10 keV XRB.

3 Spectral Analysis
Above a limiting flux of the order of a few erg cm-2 s-1 X–ray spectra obtained by XMM–Newton long exposures have a number of counts which allow us to constrain the column density and the Compton reflection fraction, two key parameters of the XRB models. The results of the spectral analysis of relatively bright, highly obscured and Compton thick AGN are presented in Comastri et al. (2011), Georgantopoulos et al. (2013) and Castello–Mor et al. (2013), while a detailed analysis of the spectra and variability properties of the two brightest source in the sample is reported in Iwasawa et al. (2015). Finally, a comprehensive analysis of the X–ray spectra of a flux limited sample of 168 sources will be presented in Iwasawa et al. (2017).
X–ray absorption is mainly measured by the low energy cut-off of an X–ray spectrum, which moves to higher energies as the absorbing column density increases. When the the column density approaches the Compton thick threshold the cut–off is above 10 keV (i.e. outside the XMM–Newton band). At the typical redshifts of the sources contributing to the XRB (1), the cut–off, along with the iron complex and the reflection bump, are shifted toward lower energies, where the XMM–Newton effective area is larger.
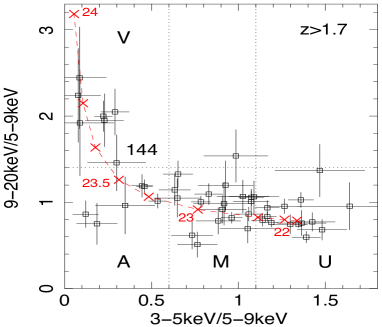
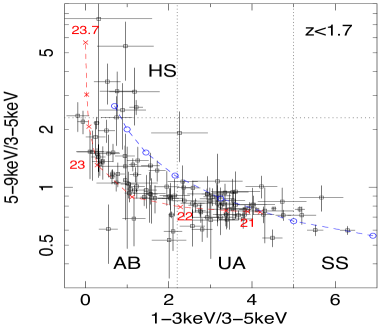
Iwasawa et al. (2012) searched for heavily obscured AGN at using three rest-frame energy bands: s (3–5 keV); m (5–9 keV); and h (9–20 keV), and two X–ray colours: s/m and h/m. For the adopted rest–frame energy range, these X–ray colours are sensitive to column densities larger than 1022 cm-2 and up to the Compton thick threshold. In Fig. 2 (top panel), a locus of spectral evolution when a power–law continuum of photon index is modified by various absorbing column of log between 21 and 24 (cm-2) is shown. In the bottom panel a similar plot is reported for lower redshift sources using different, more appropriate, bands: s (1–3 keV); m (3–5 keV); and h (5–9 keV), and the same X–ray colors.
Sources lying in different parts of the two diagrams have X–ray colors corresponding to different values of the nuclear obscuration. The Very absorbed (V), absorbed (A), moderately absorbed (M) and unabsorbed (U) groups of the high redshift panel were extensively discussed in Iwasawa et al. (2012). A similar scheme (HS, AB, UA and SS) is used for the lower redshift group.


The average stacked spectra of the entire XMM–Newton –CDFS spectral sample grouped for different values of their rest–frame X–ray colors are reported in Figure 3 (both panels). The excellent spectral quality, especially at lower redshifts, is evident. The detailed spectral analysis of the most obscured sourecs in the HS and V classes is currently undergoing. There is significant evidence of a redshift evolution of the fraction of obscured AGN in high luminosity (1044 erg s-1) sources. We anticipate that several previously unknown, or misclassified, Compton thick AGN were identified and will be discussed in Iwasawa et al. (2017).
4 Iron features
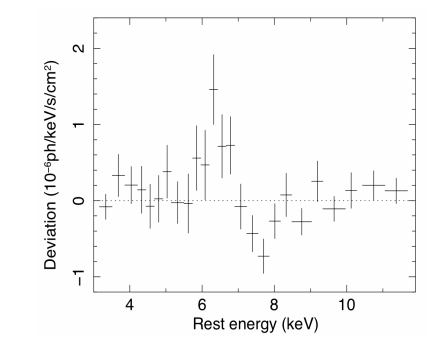
Evidence for ultra-fast (v 0.05 c) outflows in the innermost regions of AGN has been collected in the past decade by sensitive X–ray observations for sizable samples of AGN, mostly at low redshift. The XMM–Newton spectrum of a luminous ( 4 1044 erg s-1), obscured ( 1023 cm-2) quasar in the CDFS (PID 352) at is shown in Figure 4. The source is characterized by an emission and absorption line complex in the 6–7 keV iron band. While the emission line is interpreted as being due to neutral iron (consistent with the presence of cold absorption), the absorption feature is due to highly ionized iron transitions (FeXXV, FeXXVI) with an outflowing velocity of 0.14. The mass outflow rate is similar to the source accretion rate ( 2 M yr-1) , and the derived mechanical energy rate of almost erg s-1 corresponds to about 10% of the source bolometric luminosity. A highly ionized emission line is expected given the relatively large solid angle assumed to estimate the mass outflow rate. The lack of detection may be due to a low column density for the ionized gas. As a consequence the emission feature intensity is not strong enough to be detected in the XMM–Newton spectrum.
PID352 represents one of the few cases where evidences of X–ray outflowing gas have been observed at high redshift thus far (Vignali et al. 2015). The relatively deep XMM–Newton exposure – 800 ks because the source is at the edge of the field – and the PID352 intrinsic luminosity, made possible to collect enough source counts (4500 in EPIC cameras) to detect the outflowing X–ray feature. The small area covered by the XMM–Newton deep field prevents a systematic study of iron absorption features on a statistically sound sample.
While the analysis of iron features in individual bright sources is severely limited by the counting statistic, the stacking techniques do not suffer from this limitation and return extremely useful averaged information. The spectral analysis of the 54 AGN ( 1) with the best spectral signal to noise ratio are presented in Falocco et al. (2013). Using a specifically developed methodology to stack XMM–Newton X–ray spectra they found a robust ( 7) and convincing evidence for the presence of iron line emission up to 3.5. The average line equivalent width (EQW) is consistent with what is observed in the local Universe for both obscured and unobscured AGN. There is strong evidence of the so called Iwasawa–Taniguchi effect: the line EQW is much higher in lower luminosity Seyfert galaxies than in high luminosity quasars (Iwasawa & Taniguchi 1993; Bianchi et al. 2007). The results of subdividing the CDF–S sample below and above a threshold luminosity of 1044 erg s-1 are reported in Figure 5. The line intensity is clearly higher in lower luminosity Seyfert objects.
A combination of obscuration, enhancing the line EQW and more common in lower luminosity AGN, and disk ionization, quenching the line emission in luminous quasars, are likely to contribute to the observed effect. The presence of an anti–correlation with the Eddington ratio (Bianchi et al. 2007) suggests that the accretion rate may be the driver of the observed effect.


5 Conclusions
The physics and evolution of the most obscured AGN is mainly based on deep X–ray spectroscopy. Further progresses will be obtained combining the data of deep XMM–Newton survey with the ultra deep 7 Ms Chandra observations in the CDF–S (Luo et al. 2016). For the brightest sources the deep NuSTAR survey in the same field has already extended the frequency coverage towards high energies (Zappacosta et al. 2017).
Current surveys are limited by both the relatively small field of view covered in the CDF–S and, especially for XMM–Newton the instrumental background. Additional deep exposures will not allow to probe much deeper than the current limits nor to extend the source sample.
The rich plethora of multiwavelength data available in the deep fields and, in particular MUSE and ALMA observations, will nicely complement the deep X–ray spectroscopy and allow to further probe the physics of obscured AGN.
A major advance in our understanding of the physics of the sources of the XRB could be obtained with dedicated, deep (of the order of 1 Ms each) exposures of carefully selected samples of sources such as deeply buried AGN, strong iron line emitters and candidate relativistic outflows.
Acknowledgements.
The authors acknowledge financial support from ASI-INAF grants 2015-046-R.0; I/037/12/10 and the PRIN-INAF 2014. We thank the member of the XMM CDF–S Team and Massimo Cappi for interesting and extremely useful discussions before the “XMM–Newton the next decade” meeting.References
- [Aird et al. (2015)] Aird, J., Alexander, D.M., Ballantyne, D.R., et al. 2015, ApJ, 815, A66
- [Akylas et al.(2012)] Akylas, A., Georgakakis, A., Georgantopoulos, I, et al. 2012, A&A, 546, A98
- [Ballantyne et al.(2011)] Ballantyne, D. R., Draper, A. R., Madsen, K. K., et al. 2011, ApJ, 736, 56
- [Bianchi et al.(2007)] Bianchi, S., Guainazzi, M., Matt, G., & Fonseca Bonilla, N. 2007, A&A, 467, L19
- [Castelló-Mor et al.(2013)] Castelló-Mor, N., Carrera, F. J., Alonso-Herrero, A., et al. 2013, A&A, 556, A114
- [Comastri et al.(1995)] Comastri, A., Setti, G., Zamorani, G., & Hasinger, G. 1995, A&A, 296, 1
- [Comastri et al.(2011)] Comastri, A., Ranalli, P., Iwasawa, K., et al. 2011, A&A, 526, L9
- [] Del Moro, A., et al. 2017, in prep.
- [Esposito & Walter(2016)] Esposito, V., & Walter, R. 2016, A&A, 590, A49
- [Falocco et al.(2013)] Falocco, S., Carrera, F. J., Corral, A., et al. 2013, A&A, 555, A79
- [Georgantopoulos et al.(2013)] Georgantopoulos, I., Comastri, A., Vignali, C., et al. 2013, A&A, 555, A43
- [Gilli et al.(2007)] Gilli, R., Comastri, A., & Hasinger, G. 2007, A&A, 463, 79
- [Harrison et al.(2016)] Harrison, F. A., Aird, J., Civano, F., et al. 2016, ApJ, 831, 185
- [Hopkins et al. (2008)] Hopkins, Philip F.; Hernquist, Lars; Cox, Thomas J.; Kereš, Dušan 2008, ApJS, 175, 356
- [Kormendy & Ho(2013)] Kormendy, J., & Ho, L. C. 2013, ARA&A, 51, 511
- [Iwasawa & Taniguchi(1993)] Iwasawa, K., & Taniguchi, Y. 1993, ApJ, 413, L15
- [Iwasawa et al.(2012)] Iwasawa, K., Gilli, R., Vignali, C., et al. 2012, A&A, 546, A84
- [Iwasawa et al.(2015)] Iwasawa, K., Vignali, C., Comastri A., et al. 2015, A&A, 574, A144
- [] Iwasawa, K., et al. 2017, in prep.
- [Luo et al.(2016)] Luo, B., Brandt, W.N., Xue, Y.Q., et al. 2016, arXiv1611.03501
- [Ranalli et al.(2013)] Ranalli, P., Comastri, A., Vignali, C., et al. 2013, A&A, 555, A42
- [Setti & Woltjer(1989)] Setti, G., & Woltjer, L. 1989, A&A, 224, L21
- [Treister et al.(2009)] Treister, E., Urry, C. M., & Virani, S. 2009, ApJ, 696, 110
- [Ueda et al.(2014)] Ueda, Y., Akiyama, M., Hasinger, G., et al. 2014, ApJ, 786, 104
- [Vignali et al.(2015)] Vignali, C., Iwasawa, K., Comastri, A., et al. 2015, A&A, 583, A141
- [Vito et al.(2014)] Vito, F., Gilli, R., Vignali, C., et al. 2014, MNRAS, 445, 3557
- [] Zappacosta, L., et al. 2017, in prep.