Collaborative visual analytics of radio surveys in the Big Data era
Abstract
Radio survey datasets comprise an increasing number of individual observations stored as sets of multidimensional data. In large survey projects, astronomers commonly face limitations regarding: 1) interactive visual analytics of sufficiently large subsets of data; 2) synchronous and asynchronous collaboration; and 3) documentation of the discovery workflow. To support collaborative data inquiry, we present encube, a large-scale comparative visual analytics framework. encube can utilise advanced visualization environments such as the CAVE2 (a hybrid 2D and 3D virtual reality environment powered with a 100 Tflop/s GPU-based supercomputer and 84 million pixels) for collaborative analysis of large subsets of data from radio surveys. It can also run on standard desktops, providing a capable visual analytics experience across the display ecology. encube is composed of four primary units enabling compute-intensive processing, advanced visualisation, dynamic interaction, parallel data query, along with data management. Its modularity will make it simple to incorporate astronomical analysis packages and Virtual Observatory capabilities developed within our community. We discuss how encube builds a bridge between high-end display systems (such as CAVE2) and the classical desktop, preserving all traces of the work completed on either platform – allowing the research process to continue wherever you are.
keywords:
Visualization, Visual analytics, Survey, Big Data1 Common limitations in large-scale radio survey
Most of the knowledge obtained about neutral atomic hydrogen (HI) in galaxies comes from unresolved observations with large radio telescopes such as the Arecibo, Parkes, and Jodrell Bank radio telescopes. The current data archive contains a few hundreds of resolved HI images. With upcoming next-generation radio telescope facilities such as the Square Kilometre Array (SKA; e.g. [Quinn et al. 2015]) and its related pathfinders, e.g. Australian SKA Pathfinder ([Johnston et al. 2008]) and the APERTIF upgrade on the Westerbork telescope ([Verheijen et al. 2009]), thousands of resolved images of the HI distribution of galaxies are expected to be observed. Hence, a revolution in galaxy evolution studies is about to happen, and novel solutions will be needed to be able to make the comparisons required to understand what role hydrogen gas plays in galaxy evolution.
Hyperspectral images or spectral cubes are used to study the properties of HI in galaxies. A spectral cube is composed of two spatial dimensions along with a spectral or a velocity dimension. We use the expression ‘spectral cube survey’ for scenarios where multiple spectral cubes are collected. A primary goal of any spectral cube survey is to identify and investigate similarities and differences between individual sources. While the growth of spectral cubes – both in number and in size – within surveys will allow novel science to be undertaken, significant challenges are arising regarding knowledge discovery and analysis.
With the growth in number of individual spectral cubes within a given survey, new limitations emerge with regard to: 1) interactive visualisation and analysis of sufficiently large subsets of data; 2) synchronous and asynchronous collaboration; and 3) documentation of the discovery workflow. To overcome these challenges, astronomers can borrow techniques from the field of visual analytics – defined as the science of analytical reasoning facilitated by interactive visual interfaces ([Thomas et al. 2006]). Visual analytics includes techniques like information synthesis and insight derivation from massive, dynamic, ambiguous, and conflicting data.
2 encube: interactive visual analytics of spectral cubes
To provide support for collaborative data inquiry in large radio surveys, we introduce encube ([Vohl et al. 2015, Vohl et al. 2016]), a large scale comparative visual analytics framework. encube is tailored for use with large tiled-displays and advanced immersive environments like the CAVE2 at Monash University. With its 80 stereo-capable screens arranged in a 20 columns 4 rows grid configuration, and powered with a 100 Tflop/s Graphics Processing Unit (GPU)-based supercomputer, the Monash CAVE2 represents a modern hybrid 2D and 3D virtual reality environment. The encube framework is designed to harness the power of high-end visualisation environments for collaborative analysis of large subsets of data from radio surveys. Alternatively, it can also work on standard desktops, providing a seamless visual analytics experience regardless of the number of displays or their arrangement.
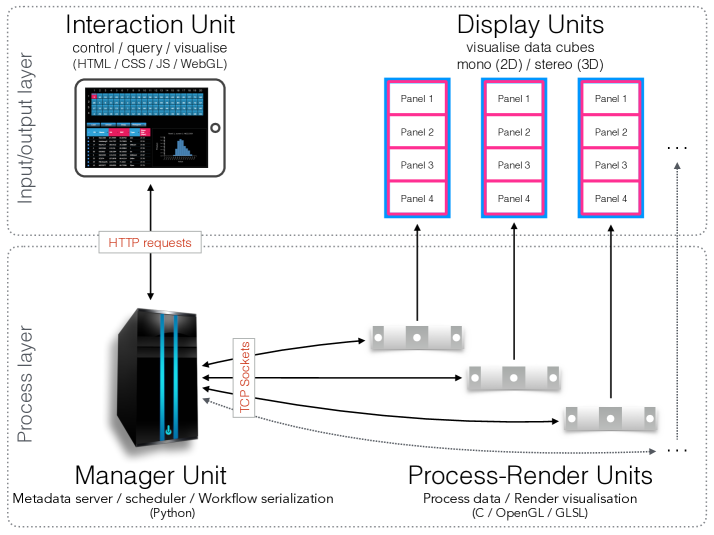
encube aims at enabling astronomers to interactively visualise, compare, and query a subset of spectral cubes from survey data. The framework includes several strategies for qualitative, quantitative, and comparative visualisation, including different mechanisms to organise, query and tag data interactively. encube comprises two layers: the Input/output layer, and the Process layer. The Input/output layer includes an Interaction unit and multiple Display Units, while the Process layer includes a Manager Unit and multiple Process-Render Units. Figure 1 depicts the framework and its related hardware and software components. For an in-depth description of encube and its different units, see Vohl et al. (2016).
The Manager Unit is at the core of encube. The Manager Unit has been designed to make it simple to incorporate other Python-based astronomical packages such as astropy ([Astropy Collaboration et al. 2013]) and Virtual Observatory capabilities [e.g. TAP ([Dowler et al. 2010]), SAMP ([Taylor et al. 2015])] developed within our community. In addition, as all communications and queries circulate through the Manager Unit, it is where the workflow history record is being gathered.
Different interactive functionalities to compare spectral cubes are provided via the Interaction Unit. An Interaction unit provides control over the global visualisation and analysis environment. Such functionalities include sorting spectral cubes, manually reordering displayed cubes, modifying rendering parameters, and querying one or many spectral cubes to obtain information like voxel distributions (i.e. histograms) or moment maps. Interaction with the many screens is provided through a web interface that can be used through different devices such as touch-based devices (tablet, smart phones) and other portable devices (e.g. laptops).
The primary advantage of encube comes from its concepts of ‘Single Instruction, Multiple Views’ (SIMV) and ‘Single Instruction, Multiple Queries’ (SIMQ). Sharing similarities to the concept of ‘Single Instruction, Multiple Data’ (SIMD), these distributed models of processing and rendering allow one requested action to be applied to many data cubes in parallel. Hence, within the Monash CAVE2 environment for example, one can compare of order 100 spectral cubes.Through SIMV and SIMQ, instead of repeating a task (analysis or visualisation) over and over from one spectral cube to the next, one has the ability to spawn this task to multiple data cubes seamlessly.
3 Documenting the discovery workflow: a key for synchronous and asynchronous collaboration
To help researchers keep track of the discovery process, encube includes different features to stay organised. In particular, encube integrates the concept of workflow serialization: the generation of metadata about user interactions with the system. Two levels of interactions are considered for serialization: actions applied to a file, and actions applied on the overall distribution of visualisations. In addition, researchers can include annotations linked to specific data files by using searchable keywords called tags.
3.1 Workflow serialization: data file level
During a session, actions applied to data files can be stored for future evaluation. The type of information to be stored can be defined by the user. For example, one can keep track of visualisation parameters such as camera position (e.g. volume rotation angle, pan/zoom position), and volume rendering parameters (e.g. transparency, contrast). With data file level workflow, a user can review actions taken throughout the discovery process, either within the advanced visualisation environment or back at the researcher’s desk. A user can restore a file to a given state in order to review interesting features, or simply continue the analysis process where a previous session ended. It also permits the discovery process to be replayed – which may help the user to remember how and why certain steps have been taken.
3.2 Workflow serialization: meta-visualisation level
Workflow at the meta-visualisation level keeps track of which data file is loaded at a given time, and where it is rendered (e.g. on which Display Unit it appears). This mechanism represents a way to store actions relative to the configuration for future evaluation. To provide a means for comparative visualisation in a collaborative fashion, a key feature of encube is to rely on users’ visual and spatial awareness. By keeping a record of the spatial configuration of visualisations within the visualisation environment (e.g. on which Display Unit a data file is rendered), it is possible for users to reproduce specific visualisation setups.
3.3 Workflow serialization: an example
As a workflow example, consider a research team interested in the evaluation of galaxy kinematics from survey data. This team is formed of two sub groups, namely group A and B, where no members are shared between the two sub groups. Group A is available for a visit to the CAVE2 on Wednesday, while group B is available on Friday. On Wednesday, group A arranges galaxies into categories, and includes tags with each object, where each category shows similarities in kinematic morphology. On Friday, group B can evaluate all tags left behind by group A. By itself, a tag may be ambiguous. Hence, by reloading the overall configuration of visualisations within the CAVE2, group B can evaluate the tags in relation to the physical arrangement of galaxies on Display Units. This methodology provides a new asynchronous way of collaboration within teams.
4 Current limitations & on-going work
Despite the considerable computational power available within the Monash CAVE2, there will be times where more computational resources will be required to visualise SKA-pathfinder scale spectral cubes. To cope with spectral cubes of terabyte (TB) scale (e.g. APERTIF and ASKAP cubes), the distributed visualisation and analysis framework GraphTIVA was introduced ([Hassan et al. 2013]). For a 0.5 TB spectral cube using a cluster of 96 GPUs, [Hassan et al. 2013] showed volume rendering at 7–10 frames per second could be achieved; and computation of basic global image statistics such as the mean intensity and standard deviation in 1.7 seconds.
We are evaluating the possibility of integrating GraphTIVA within the encube framework to provide HI astronomers with novel way to interactively analyse TB scale spectral cubes’ sources within their environment, at high resolution via advanced visualisation environments like the Monash CAVE2. This would offer a mode of operation where a full resolution spectral cube is rendered on a grid of displays, leaving screens for individual sources found within the parent cube.
5 Final thoughts
As we are entering the Petascale Astronomy Era and its large scale spectral cube surveys, there is a need for novel methods to be explored. Our visual analytics framework has the potential to empower researchers with ways to quickly manipulate and visualise large subsets of their data. To this end, the CAVE2 permits new approaches to, and applications of, visual analytics. It offers great potential to accelerate the discovery process in the era of large-scale spectral-cube surveys. encube provides a best of both worlds approach through support of high-end, collaborative visualisation in the CAVE2 while also supporting desktop-based analysis and discovery. We note that encube is not only viable for astronomy, but for any volumetric scientific data surveys (e.g. medical imaging, earth sciences).
Acknowledgements.
This work was enabled and supported by the Monash Immersive Visualisation Platform (http://monash.edu/mivp). DV acknowledges the support of the Astronomical Society of Australia for travel funding.References
- [Astropy Collaboration et al. 2013] Astropy Collaboration , Robitaille, T. P., Tollerud, E. J., Greenfield, P., Droettboom, M., Bray, E., Aldcroft, T., Davis, M., Ginsburg, A., Price-Whelan, A. M., Kerzendorf, W. E., Conley, A., Crighton, N., Barbary, K., Muna, D., Ferguson, H., Grollier, F., Parikh, M. M., Nair, P. H., Unther, H. M., Deil, C., Woillez, J., Conseil, S., Kramer, R., Turner, J. E. H., Singer, L., Fox, R., Weaver, B. A., Zabalza, V., Edwards, Z. I., Azalee Bostroem, K., Burke, D. J., Casey, A. R., Crawford, S. M., Dencheva, N., Ely, J., Jenness, T., Labrie, K., Lim, P. L., Pierfederici, F., Pontzen, A., Ptak, A., Refsdal, B., Servillat, M., Streicher, O. 2013, A&A Astronomy & Astrophysics, 558, A33
- [Dowler et al. 2010] Dowler, P., Rixon, G., & Tody, D. 2010, ArXiv e-prints, arXiv 1110.0497
- [Febretti et al. 2014] Febretti, A., Nishimoto, A., Mateevitsi, V., Renambot, L., & Johnson, A., & Leigh, J., 2014. Virtual Reality (VR), Proc. IEEE Conference, pp. 9–14.
- [Hassan et al. 2013] Hassan, A. H., Fluke, C. J., Barnes, D. G., & Kilborn, V. A., 2013. MNRAS Monthly Notices of the Royal Astronomical Society, 463, 3
- [Johnston et al. 2008] Johnston, S., Taylor, R., Bailes, M., Bartel, N., Baugh, C., Bietenholz, M., Blake, C., Braun, R., Brown, J., Chatterjee, S., Darling, J., Deller, A., Dodson, R., Edwards, P., Ekers, R., Ellingsen, S., Feain, I., Gaensler, B., Haverkorn, M., Hobbs, G., Hopkins, A., Jackson, C., James, C., Joncas, G., Kaspi, V., Kilborn, V., Koribalski, B., Kothes, R., Landecker, T., Lenc, E., Lovell, J., Macquart, J.-P., Manchester, R., Matthews, D., McClure-Griffiths, N., Norris, R., Pen, U.-L., Phillips, C., Power, C., Protheroe, R., Sadler, E., Schmidt, B., Stairs, I., Staveley-Smith, L., Stil, J., Tingay, S., Tzioumis, A., Walker, M., Wall, J., & Wolleben, M. 2008, Experimental Astronomy, 22, pp.151–273
- [Verheijen et al. 2009] Verheijen, M., Oosterloo, T., Heald, G., & van Cappellen, W. 2009, HI Surveys with APERTIF. Panoramic Radio Astronomy: Wide-field 1-2 GHz research on galaxy evolution, pp.1–2.
- [Quinn et al. 2015] Quinn, P., Axelrod, T., Bird, I., Dodson, R., Szalay, A., & Wicenec, A. 2015, ArXiv e-prints, arXiv 1501.05367
- [Taylor et al. 2015] Taylor, M. B., Boch, T., & Taylor, J. 2015, A&C Astronomy and Computing, 11, pp. 81–90
- [Thomas et al. 2006] Thomas, J. J. & Cook K. A. 2006, IEEE Computer Graphics and Applications, 26, 1
- [Vohl et al. 2015] Vohl, D., Fluke, C. J., Hassan, A. H., & Barnes, D. G. 2015, in: N. P. F. Lorente & K. Shortridge (eds.) An interactive, comparative and quantitative 3D visualization system for large-scale spectral-cube surveys using CAVE2, Proc. ADASS XXV (San Francisco: ASP)
- [Vohl et al. 2016] Vohl, D., Barnes, D. G., Fluke, C. J., Poudel, G., Georgiou-Karistianis, N., Hassan, A. H., Benovitski, Y., Wong, T. H., Kaluza, O., Nguyen, T. D., & Bonnington, C. P. 2016, PeerJ Computer Science, doi: 10.7717/peerj-cs.88