Corresponding Author: ] \corrmks Corresponding Author: ] \corrmz Present Address: ] \kiran Present Address: ] \arun Corresponding Author: ] \corrhtwong
The TEXONO Collaboration
Design and Performance of a Hybrid Fast and Thermal Neutron Detector
Abstract
We report the performance and characterization of a custom-built hybrid detector consisting of BC501A liquid scintillator for fast neutrons and BC702 scintillator for thermal neutrons. The calibration and the resolution of the BC501A liquid scintillator detector are performed. The event identification via Pulse Shape Discrimination (PSD) technique is developed in order to distinguish gamma, fast and thermal neutrons. Monte Carlo simulation packages are developed in GEANT4 to obtain actual neutron energy spectrum from the measured recoil spectrum. The developed methods are tested by reconstruction of 241AmBe(, n) neutron spectrum.
I Introduction and Physics Motivations
Experiments in neutrino physics neutrino and dark matter searches dm often involve very small interaction rates, and therefore desire a good detection sensitivity of low count rates of background. The elimination of known background signals from the physical signals constitutes a major part of the studies. However, complete reduction of background, especially neutron origin signals, is not possible even for very deep underground laboratories. Therefore, direct measurement of neutron background and its elimination are very crucial for such experiments.
With these as objectives and within the framework of the TEXONO research program texono , we develop some methods to construct actual neutron energy spectra and open a new research window to determine the neutron background from the direct measurement of neutron flux at the experimental site where the physical data taking will require low energy and low background environments, in order to determine its contribution to the background and eliminate it from the physical signals.
The ”hybrid neutron detector” (HND) custom-built for this study consists of Bicron BC501A bc501a , also known as NE231 or EJ301, liquid scintillator detector, which is sensitive for fast neutrons and BC702 bc702 organic scintillator detector, which is sensitive to thermal neutrons bicron . Liquid and organic scintillator detectors are widely used for neutron detection due to their high detection and capture efficiency. However, they are also sensitive to gamma rays as well. The discrimination can be performed effectively with these scintillator detectors via Pulse Shape Discrimination (PSD) technique due to the different behavior of decay time component of the pulse shape. One of the purposes of this study is to develop a PSD technique providing a good and effective discrimination of neutron against gamma background and thereby construct actual neutron energy spectrum from its measured recoil spectra.
Fast neutrons can be produced by cosmic-ray interaction with environmental or surrounding materials as a secondary products or by spontaneous fission products via reactions coming from radioactive materials in the rock such as naturally occurring isotopes of and decay chains. The main physical mechanism of fast neutron detection is that the incident fast neutron scatters from the protons in the scintillating medium until it leaves from the detector with partial energy deposition or is totally captured. The scintillation signal is produced during the interaction by each recoiling proton. On the other hand, in case of incident thermal neutron, it diffuses in the detector medium and captured by in a fine ZnS(Ag) phosphor powder via nuclear reaction of producing scintillations by the resulting alpha particle and triton. The reason of using as the dopant is that it has the advantage of high neutron capture probability and produces two energetic charged particles that create scintillation.
The structure of the paper is as follows: Design and Construction of the HND will be discussed in Section-II. Data taking and detector performance (the DAQ system, energy calibration, event identification and PSD techniques) will be discussed in Section-III. Reconstruction of actual neutron spectra via Doroshenko and Gravel unfolding methods will be discussed in Section-IV.
II Design and Construction
II.1 Detector Structure
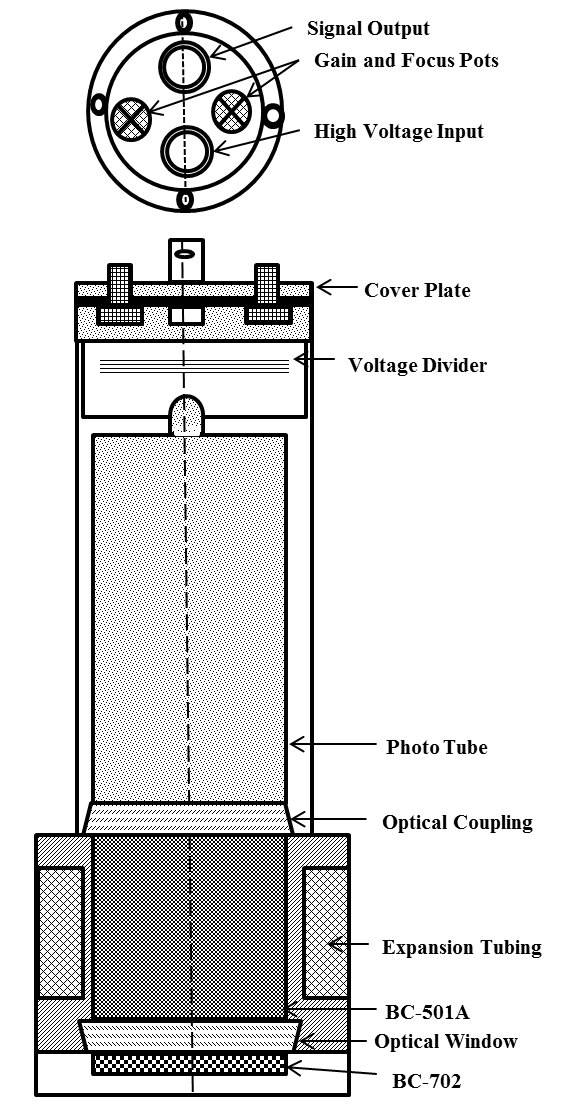
Neutron detector used in this study has a hybrid structure, bringing two different types of target materials to operate at the same time, Bicron BC-501A liquid scintillator having 0.113 liter cell volume and BC-702 type scintillator enriched to 95% 6Li in a fine ZnS(Ag) phosphor powder. The scintillation light output is readout by Hamamatsu photomultiplier tube (PMT). The schematic diagram of the detector is shown in Fig. 1.
The selected detector dimension is similar to those of germanium detector cryostat used in experiments at the Kuo-Sheng Reactor Neutrino Laboratory (KSNL) ksnl and China Jinping Underground Laboratory (CJPL) cjpl . Therefore, HND can be installed, replacing the Ge-target, within the well of an NaI(Tl) Anti-Compton detectors under the same shielding configurations as those experiments to provide measurements of the ambient neutron background.
BC-501A is sensitive for the fast neutron detection while BC702 has high efficiency of detection of thermal neutrons. Both scintillator detectors have good fast time response as well as the pulse shape discrimination property, which enables isolation of the gamma events (due to different signal characteristics for proton and electron recoil events, enabling to distinguish neutron hit events from those of gammas). Therefore this HND provides good discrimination against gamma background psd1 . There are a large number of PSD studies for neutron detectors available in the literature psd2 .
(a)
(b)
(c)
II.2 Physical Interactions
BC-501A liquid scintillator detector is designed to yield good PSD discrimination against gamma and neutron incident particles. BC-501A is an organic liquid scintillator containing 4.82 and 3.98 atoms of hydrogen and carbon per cm3, respectively. High density of hydrogen and carbon atoms present in its compound makes it a good target material for detection of fast neutrons in the range via the reactions of,
| (1) |
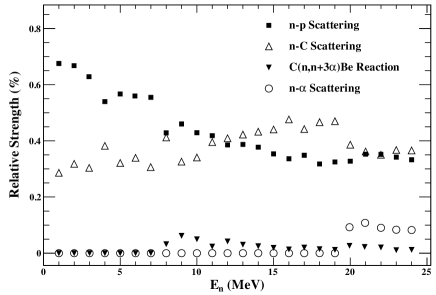
A Geant4 Monte Carlo Simulation for the proportions of the reactions listed in Eq. 1 are illustrated in Fig. 2. As shown, the most dominant interactions are and . As the incident neutron energy increases the proportion of the interaction increases and becomes dominant above around 10 . However, the regular neutron energy range in underground labs is usually below 10 tomasello . Therefore, interaction is still the most probable and dominant interaction among the neutron detection channels for underground experiments.
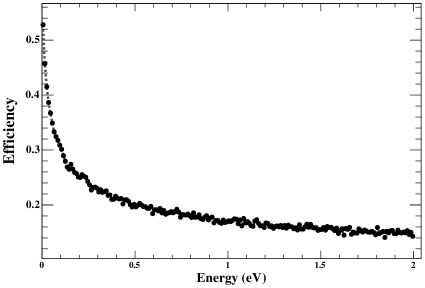
BC702 detector is designed as a 6.35 mm thick and 50.8 mm diameter disc. BC702 is sensitive for slow/thermal neutron detection, which are present in the background environment mostly as a result of moderation of the fast neutrons via elastic scattering in the shielding and other materials. BC702 is highly efficient such that detection efficiency of neutrons with kinetic energy around 0.01 eV is above 50% and this value rapidly decreases above 0.1 eV. BC702 scintillator is composed of 11 mg of 6Li per cm3 with 95% purity which is dispersed in ZnS(Ag) phosphor powder. The detector provides a good capture efficiency for thermal neutrons due to large neutron capture cross-section of , the reaction can be written as,
| (2) |
The detection mechanism is neutron absorption by 6Li is given in Eq. 2 where the resulting particle and triton with recoil kinetic energy induces scintillation light upon their interaction with ZnS(Ag). BC702 detector provides very good discrimination of thermal neutrons against both gamma and fast neutron background.
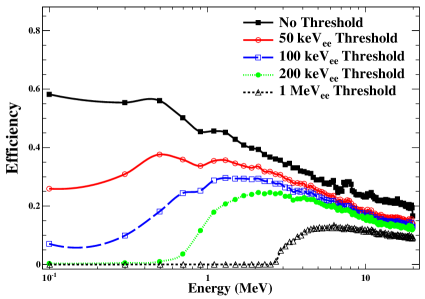
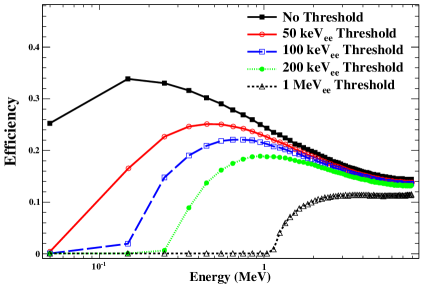
The simulated efficiencies of the detector for fast neutrons, gamma and slow neutrons are illustrated in Figure 3.
| Particle | A1 | A2 | A3 | A4 |
|---|---|---|---|---|
| p | 0.83 | 2.82 | 0.25 | 0.93 |
| 0.41 | 5.9 | 0.065 | 1.01 |
II.3 Quenching Effect
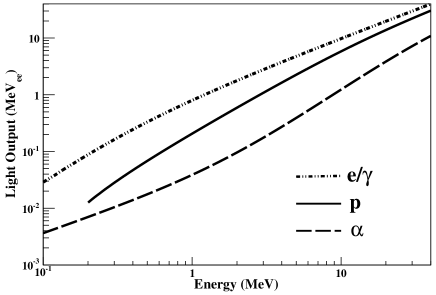
The scintillating photons can be produced via photoelectric effect, Compton scattering or pair production, while neutrons are scattered inside the scintillator transferring their energies via the mechanisms given in Eq. 1. The energies due to neutron interactions are quenched compared to those from interactions since the particles causing scintillation are charged and heavy. Therefore, simulated neutron recoil energy spectra has to be quenched to do comparison with the experimental measurements.
The quenched light output can be obtained by Eq.3 as,
| (3) |
where and are quenching factor parameters listed in Table 1 for BC501A liquid scintillator detector cecil , is the recoil energy before quenched, is the quenched energy which can be called as light output. The light output of electron, proton and alpha particle are illustrated in Figure 4.
III Data Taking and Detector Performance
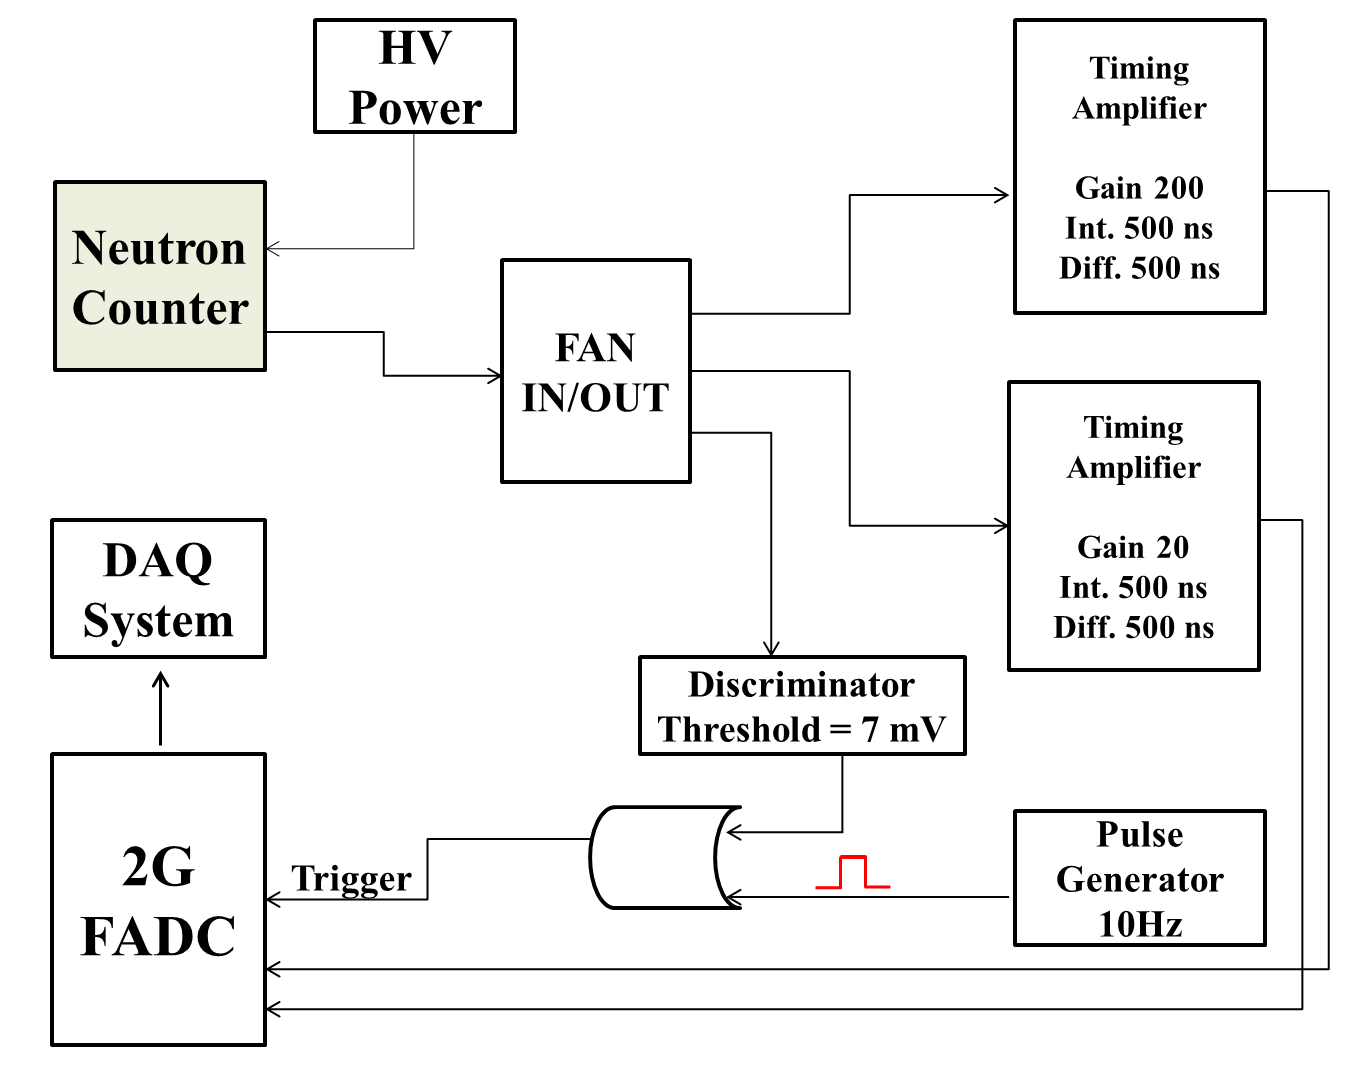
The TEXONO experiment at KSNL has adopted PXI DAQ system running in Windows environment with Labview package program. The data is taken by this new DAQ system with Fast Timing Amplifiers (TAs). The signal from the anode of the PMT is directly connected to FAN IN/OUT to make two identical outputs, these two outputs are connected to two TAs with gains of 20 and 200 for the high energy and the low energy settings, respectively, while the integration and differentiation time for both TAs are same, which is 500 ns. The fast signals after TAs are recorded by 8 bit dynamic range of Flash Analog to Digital Converter (FADC) running at 2 GHz sampling rate. With this configuration we are able to cover low energy as well as high energy spectra at the same time. The schematic block diagram of data acquisition (DAQ) electronic readout setup is shown in Fig. 5.
| Source | ||
|---|---|---|
| 0.511, 1.274 | 0.341, 1.062 | |
| 0.662 | 0.478 | |
| 1.173, 1.332 | 0.963, 1.120 |
III.1 Energy Calibration
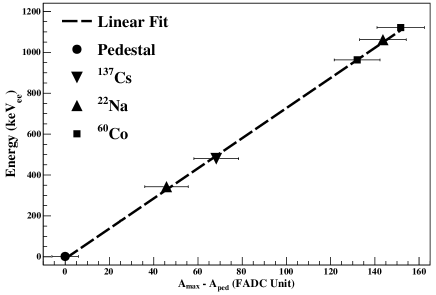
The pulse height corresponds to the maximum voltage of the pulse which is linearly proportional to the energy of the incident particles. For the energy calibration of BC-501A liquid scintillator neutron detector, gamma ray from , and sources are used. For the actual energy values of the sources their Compton edges energy values are accepted as listed in Table 2.
The calibration is performed based on the linear proportionality between the maximum pulse height and the energy of the events. Therefore, a first degree polynomial fit is performed between the net amplitude of the events, which can be defined as the remnant amplitude after substraction of pedestal from the pulse amplitude, and the actual energy values of the gamma rays. The linearity between actual energy values in electron equivalence (ee) unit and net amplitude in FADC unit accepted for the energy calibration procedure is illustrated in Figure 6.
(a)
(b)
(c)
The energy resolution is an important parameter to characterize any detector. The detector energy resolution in Full Width Half Maximum (FWHM) can be parameterized as,
| (4) |
where corresponds to the light transmission parameter depending on position in the detector, is related to the photoelectron production and represents the electronic noise which is normally very small and can be ignored.
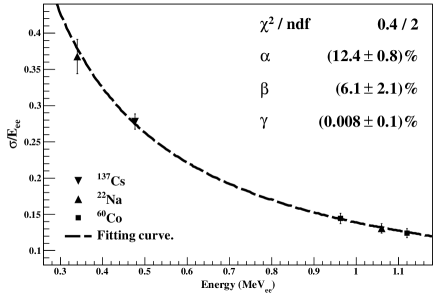
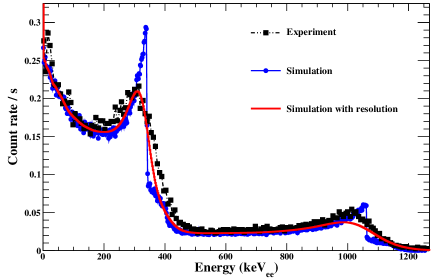
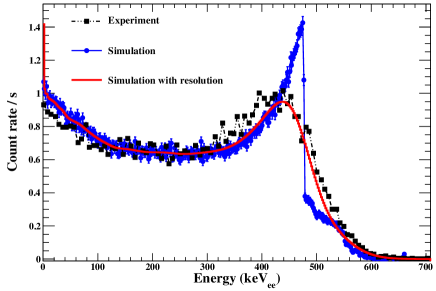
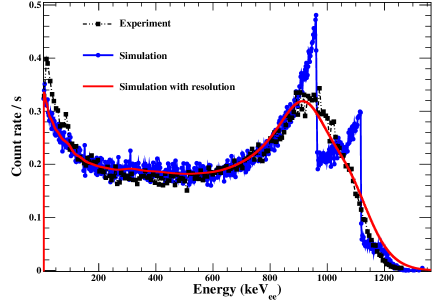
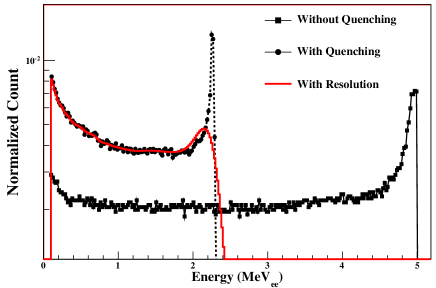
The measurement of the neutron detector energy resolution is illustrated in Figure 7. The resolution parameters given in Eq. 4 are measured with the calibration sources. The measured value of the resolution parameters of the neutron detector are , and . The calibrated energy spectra corresponding to different sources as well as the simulated energy spectra with and without detector resolution, are shown in Figure 8.
III.2 Neutron Response
Three exponential function can explain the pulse shape and can be parameterized as marrone ,
| (5) | |||||
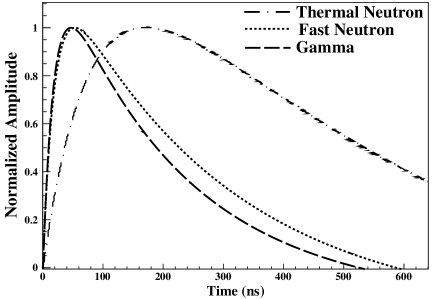
Here L represents the pulse shape, A and B are the normalization constants, is reference time and , , and represent decay constants. ratio can describe different particles for a specific scintillator. Smoothed normalized reference pulse shapes representing different particles fitted by Eq. 5 are shown in Figure 9.
Owing to different energy deposition mechanisms of gamma rays, fast neutrons and thermal neutrons, the light creation timing produced by them would not be the same. Therefore discrimination between gamma rays, fast neutrons and thermal neutrons can be obtained by examining the pulse shape information. By pulse shape analysis (i.e., rise and decay time of the pulses), we are able to categorize the events into three groups: gamma events, fast neutron events from BC501A and slow neutron events from BC702. Slow neutron events have the most characteristic signal output since ZnS(Ag) scintillation light output is dominated by a very slow decaying component for recoil particles and other heavier ion contrary to the fast response of the organic scintillator detectors. Fast neutron signals differ from that of events slightly in their tail behavior, as seen in the Figure 9.
(a)
(b)
III.3 Event Identification
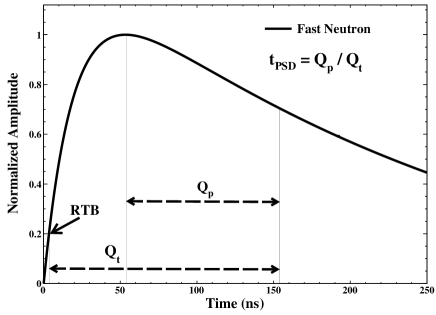
In this study, a PSD technique is developed to identify the events orginated from different particle sources. In this PSD technique the pulses are integrated within two different time intervals and the ratio between them is taken. The best integration region is chosen where the distinction between the pulses are the most obvious. The initial point of the integration is the time-bin that the pulses reach to 20% of their maximum amplitude and can be defined as rise time-bin (RTB). In order to differentiate observed events, two regions are selected for each individual pulses: first narrow range is the region where the distinction of the pulses is maximal and the other one has wider range starting from rising time bin (RTB) of the pulses. For both integration regions the initial point depends on RTB. Once the range of regions for the pulses are defined, the ratio of the two different partial integrals can be performed. By using the PSD technique the identification of the events can be maximized. Due to the fluctation of tail part of individual pulses especially for the pulses that correspond to the low energy, the partial integral range is chosen narrow in order to differentiate of gamma and neutron efficiently at low energies.
For the PSD study, a parameter named , is used as given in Eq. 6, which depends on RTB, since it yields better distinction between the pulses. The first integration region is defined as an integration region between 50 ns and 150 ns delay from the RTB respectively, which is denoted by . The second integration region is defined as from RTB to 150 ns delay from RTB which is denoted by . Therefore can be defined as simply taking the ratio between and .
| (6) |
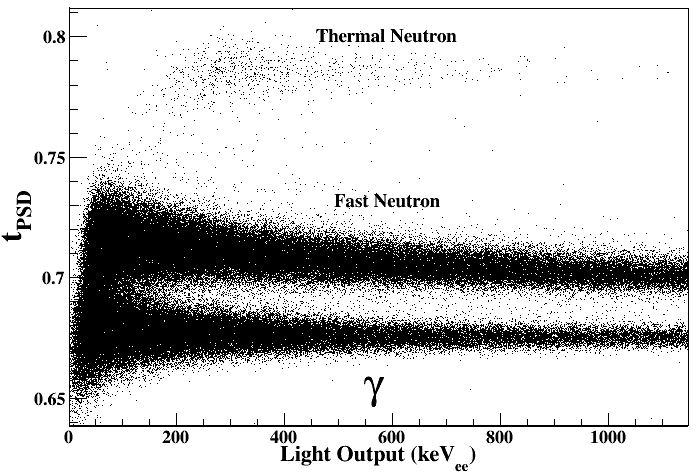
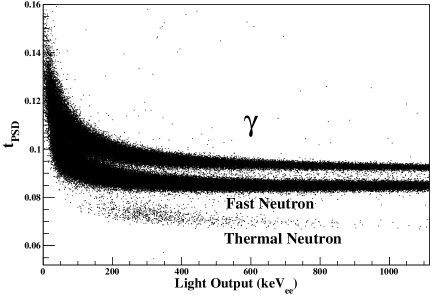
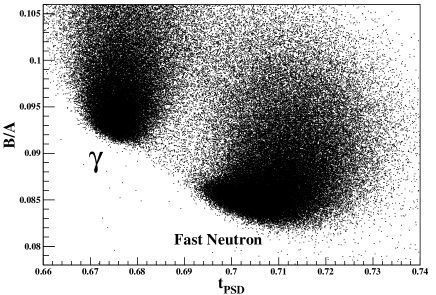
241AmBe(,n) is used as a reference source for gamma, fast neutrons and slow neutrons. Adopting the PSD technique given in Eq. 6, we can see three spectral bands clearly appeared in Figure 11. These three different bands corresponding to , fast neutron and slow neutron events from bottom to top, respectively.
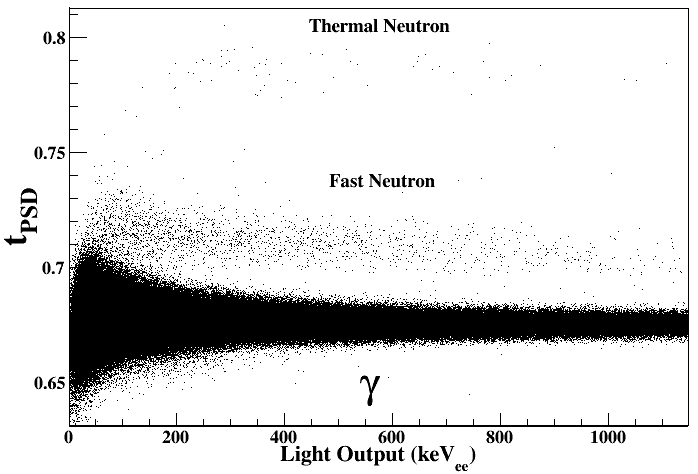
The energy distributions of 241AmBe(,n) and typical background are demonstrated in Figure 11a and Figure 11b, respectively. Well separated three bands of the reference 241AmBe(,n) source and background data illustrates that the identification of gamma, fast neutron and thermal neutron events is successfully achieved.
(a)
(b)
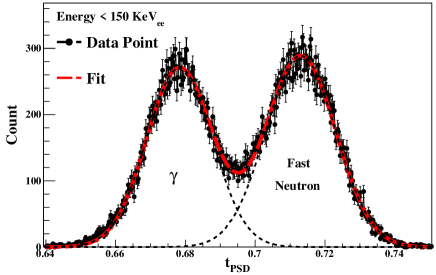
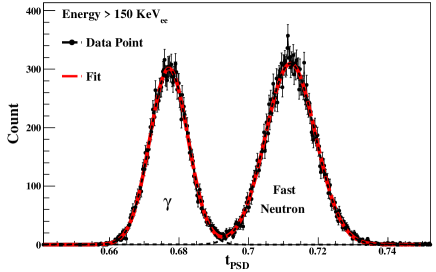
Figure 11 reveals that the thermal neutron are well separated from fast neutrons as well as from gamma events, while fast neutron is well separated from gamma upto 150 and bellow 150 there are some leackage between fast neutrons and gamma events. The distributions of the events within different energy intervals are shown in Figure 12, where Gaussian behaviors of both event groups are evident. Separation between fast neutrons and gamma events become very distinct above 150 energy range, as shown in Figure 12a, in which a complete separation between the bands is possible. While below 150 , as shown in Figure 12b, a further separation for the combined Gaussian analysis is necessary.
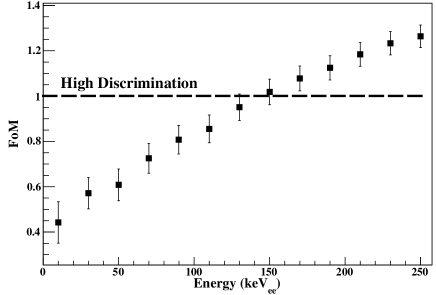
In order to determine the quality of the separation Figure of Merit (FoM) as a parameter can be introduced as,
| (7) |
where the mean and FWHM can be obtained from the two Gaussian fit defined as,
| (8) |
The FoM given in Eq. 7 with respect to energy is illustrated in Figure 13. FoM greater than unity is the indication of well separation. From Figure 13 it can be seen that above 150 the distinction is very clear and below 150 the two peaks of neutron and gamma start to merge.
Adopting the parameter of given in Eq. 5 as a representative pulse shape, we can differentiate gamma events from the neutron events by working on the ratios of individual pulses accordingly. For this study a reference pulse is constructed by adopting as the gamma source. The parameters of decay constants , , and reference time are obtained from the fitting of the gamma reference pulse. Then the pulse shape can be parametrized as,
| (9) | |||||
where is the only one free normalization parameter remains. The last exponential term in the Eq. 5 goes to unity since . Individual pulses are fitted with function given in Eq. 9. Corresponding PSD method for the identification of gamma against neutron events in parameter space with respect to energy is illustrated in Fig. 14(a). As given in Eq. 9 gamma events are located in around the ratio band value of 0.115.
(a)
(b)
The distribution of 241AmBe events in the parameter space of two independent PSD methods, which are given in Eq. 6 and given in Eq. 5, is illustrated in Fig. 14(b). The consistency of the values of the PSD parameter for gamma and neutron events shows both methods choose the same events.
The measured neutron recoil spectra of 241AmBe based on the two independent PSD methods are illustrated in Fig. 15. We also performed a selection of the events in the two parameter space of and shown in Fig. 14(b) as a combined selection. As it can be seen that there is a perfect match in the recoiled spectra based on different selection criteria showing that both PSD methods choose the same fast neutron events.
IV Unfolding and Reconstruction of Neutron Spectra
In the measurement of neutron, detection carried under an arbitrary particle flux of , the measured spectrum can be obtained as,
| (10) |
where is the incident particle energy, is the measured recoil energy and is called the response function which correlates the flux and the measured spectrum. The response function for a fixed E can also be considered as the measured spectrum of a monochromatic beam of incident particles at energy , or the probability distribution of the measured recoil energy for a single incident particle with kinetic energy . Even if the form of is known exactly for a detector system, the integral given in Eq. 10 may not be solvable for analytically. For a real measurement, the equation should be in discrete form such as bellow,
| (11) |
Finding requires developing a computational method called unfolding (or deconvolution) which is widely used in neutron spectroscopy and dosimetry applications. Response function can be constructed from the measurement of recoil spectra of monochromatic neutrons at every beam energy . In this study, response function is calculated via Monte Carlo simulation giving light output and resolution functions as input parameters.
(a)
(b)
(a)
(b)
IV.1 Response Function and Unfolding
Response function is generated by Monte Carlo simulation, by means of generating 1 million neutron particles at energy to obtain the light output spectrum L of recoil particles. Energy deposition by carbon nuclei should be ignored since they are highly quenched.
For the calculation of the neutron flux , the response functions are calculated for 1000 neutron beam energies of between 0 and 20 . Indeed, the response to the neutrons starts from 100 . For a specific neutron energy of incidence , and component of light output , the response function can be written as,
| (12) |
where is the bin of light output value of the response function, the content of which is to be calculated. Contribution from each Gaussian distributed bin of the spectrum at is integrated in the interval of . is the content of the bin of the spectrum. is the RMS error for which can be calculated from the resolution function given in Eq. 4 as,
| (13) |
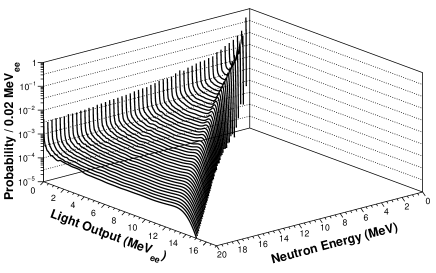
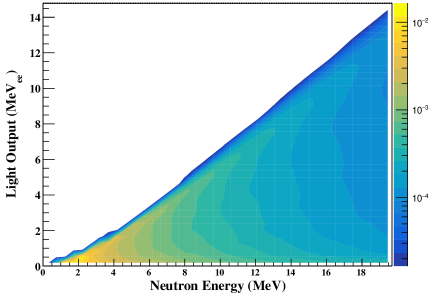
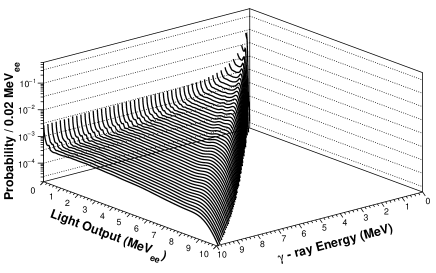
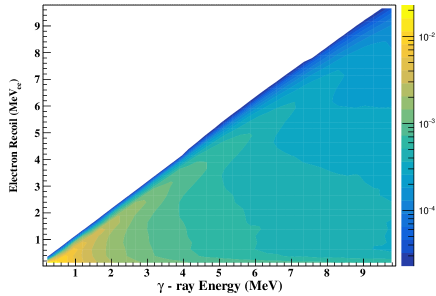
As an illustration, Figure 16 shows the response function for incident neutrons with 5 which is obtained from the corresponding simulated light output of recoil spectrum and the resolution functions. The response functions of R(L,E) are constructed for 1000 neutrons energies up to 20 and for 500 gammas energies up to 10 with 20 energy steps. The response functions for all neutron and gamma energies are illustrated in Figure 17 and Figure 18, respectively.
Unfolding is a widely used computational method in spectroscopy. The method had been developed for neutron / gamma dosimetry measurements for radiation protection purposes at nuclear facilities or similar environments where it is of crucial importance to know the abundance of the neutron / gamma radiation. There are several computational algorithms for unfolding in literature. In this work two of them are used, one is developed by Doroshenko doro and the other one is Gravel unfolding method gravel , both of them calculate the neutron flux by an iterative method. The iteration algorithm of Doroshenko can be written as,
| (14) |
(a)
(b)
(a)
(b)
(c)
This algorithm calculates the bin of the neutron flux . The index over the indicates the iteration number. The algorithm works with the inputs , detector measurement, response function and an initial neutron flux . This initial flux is just to get the algorithm started, but if there is a strong guess on the expected neutron flux, it may speed up the calculations, or even may result in a more precise result vega2002 . In general, a few hundreds of iterations are enough for the calculation to converge, and a good fit can be obtained.
The Gravel unfolding method can be written as,
| (15) |
where represents the response function obtained from Eq. 12. is the measured counts in bin light output. is a weight factor defined as,
| (16) |
where represents the RMS error of the light output. The convergence of the iterative procedure is controlled by given in Eq. 17. When it is close to unity the iteration will be terminated.
| (17) |
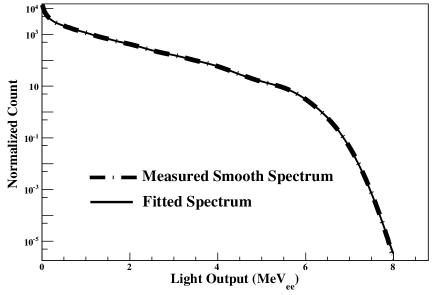
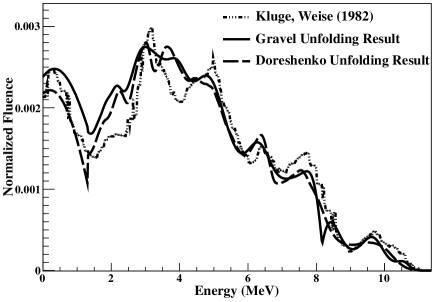
The detector has been exposed to a well known fast neutron source of 241AmBe(,n) to test the unfolding methods. The fast neutron band shown in Figure 11 which is the recoil spectrum shown in Figure 19a is taken as an input for both of the iterative methods. The resulting unfolded 241AmBe(,n) fluxes for both methods are shown in Figure 19 along with the measurement of Kluge and Weise in 1982 kluge82 . As can be seen a perfect match of the peak positions and the shape in general are obtained successfully. Therefore, the simulation package developed in this study is able to reproduce the actual neutron energy spectra from the recoiled spectra.
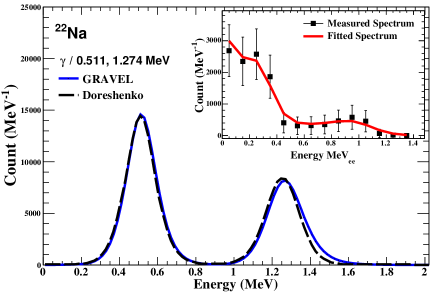
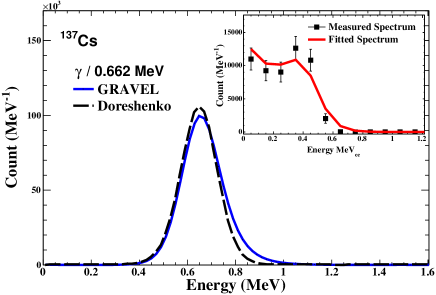
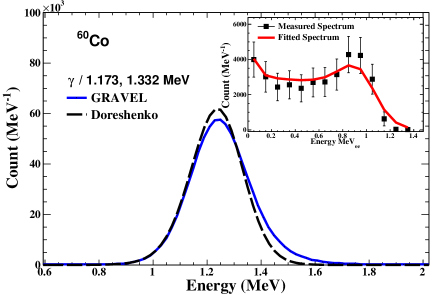
In order to illustrate the robustness of our iteration method, the same unfolding procedure as in the reconstruction of actual neutron spectrum can also be applied to obtain the actual gamma spectra of , , and , which are used for detector energy calibration. The reconstructed actual energy spectra of the gamma sources are demonstrated in Figure 20. The actual gamma spectra are reconstructed successfully from the measured recoil gamma spectra together with the corresponding gamma response functions given in Figure 18. The gamma peaks are located at the mean of (666.9 80.6) for , (1277.8 93.1) and (524 77.8) for and (1254.7 105.9) for , respectively.
Our on-going research program is to install this detector at the actual shielding configurations at KSNL ksnl to provide ambient neutron background measurements.
V Summary and Conclusion
Neutrino and Dark Matter experiments with low event rates highly depend on background suppression methods. Neutron component of the ambient background radiation is especially problematic since neutrons are difficult to shield directly. A new research window can be opened for measuring actual neutron flux at the experimental site to measure and therefore to subtract neutron background from the physics signal.
We report in this article our efforts on the optimization and characterization of a HND composed of BC501A liquid and BC702 organic scintillating neutron detector. Monte Carlo Simulation tools are developed with the aim of obtaining actual neutron energy spectra and neutron flux from the measurement of partially scattered neutron spectra. The 241AmBe(,n) neutron energy spectra are reconstructed successfully by means of Doroshenko and Gravel unfolding algorithm. This paves the way for in situ background measurement currently being pursued.
VI Acknowledgments
This work is supported by contract 114F374 under TUBITAK, Turkey and 104-2112-M-001-038-MY3 from the Ministry of Science and Technology, Taiwan. M K Singh thanks the University Grants Commission (UGC), Govt. of India, for the funding through UGC D. S. Kothari Postdoctoral Fellowship (DSKPDF) scheme.
References
- (1) T. Kajita, Int. J. Mod. Phys. A 24 (2009) 3437; C. MARIANI, Mod. Phys. Let. A 27 (2012) 1230010; V. Paolone, Int. J. Mod. Phys. A 29 (2014) 1430058; G. Altarelli, Int. J. Mod. Phys. A 29 (2014) 1444002.
- (2) M. Klasen, et al., Progress in Particle and Nuclear Physics 85 (2015) 1-32; T.Aramaki, et al., Physics Reports 618 (2016) 1-37; T. M. Undagoitia, et al., J. Phys. G: Nucl. Part. Phys. 43 (2016) 013001.
- (3) H.T. Wong, The Universe 3(4) (2015) 22; arXiv:1608.00306.
- (4) F. Arneodo at al., Nucl. Instr. and Meth. Phys. Res. A 418 (1998) 285; C. Guerrero et al., Nucl. Instr. and Meth. Phys. Res. A 597 (2008) 212; J. Qin et al., Appl. Rad. Iso. 104 (2015) 15.
- (5) http://www.eljentechnology.com/products/neutron-detectors; http://www.crystals.saint-gobain.com.
- (6) J.B. Birks, The theory and practice of scintillation counting, Pergamon Press (1964).
- (7) H.T. Wong, et al., Phys. Rev. D 75 (2007) 012001; S.T. Lin, et al., Phys. Rev. D. 79 (2009) 061101 (R); M. Deniz et al., Phys. Rev. D 81 (2010) 072001; H.B. Li, et al., Phys. Rev. Lett. 110 (2013) 261301.
- (8) S.K. Liu, et al., Phys. Rev. D 90 (2014) 032003; W. Zhao et al., Phys. Rev. D 93 (2016) 092003.
- (9) B. Sabbah, et al., Nucl. Instr. and Meth. A 58 (1968) 102; J. Kalyna, et al., Nucl. Instr. and Meth. A 88 (1970) 277; P. Sperr, et al., Nucl. Instr. and Meth. A 116 (1974) 55; J.A. Lockwood, et al., Nucl. Instr. and Meth. A 138 (1976) 353; J.M. Adams, et al., Nucl. Instr. and Meth. A 156 (1978) 459.
- (10) M. Flaska, et al., Nucl. Instr. and Meth. A 577 (2007) 654; M. Flaska, et al., Nucl. Instr. and Meth. A 599 (2009) 221; S.D. Clarke et al., Nucl. Instr. and Meth. A 604 (2009) 618; S.D. Clarke et al., Nucl. Instr. and Meth. A 638 (2011) 116; L. Swiderski et al., Nucl. Instr. and Meth. A 652 (2011) 330; B.M. Fisher et al., Nucl. Instr. and Meth. A 646 (2011) 126.
- (11) V. Tomasello, et al., Nucl. Instr. and Meth. A 595 (2008) 431.
- (12) R.A. Cecil, et al., Nucl. Instrum. and Meth. 161 (1979) 439.
- (13) S. Marrone et al., Nucl. Instr. and Meth. A 490 (2002) 299.
- (14) D. Wolski et al., Nucl. Instr. and Meth. A 360 (1995) 584; H. Klein, et al., Nucl. Instr. and Meth. A 476 (2002) 132.
- (15) Manfred Matzke, Unfolding of pulse height spectra: the HEPROW program system. Report PTB-N-19 (1994), Physikalisch-Technische Bundesanstalt, Bundesanstalt, Germany.
- (16) H. R. Vega-Carrillo, et al., Nucl. Instr. and Meth. A 476 (2002) 270.
- (17) H. Kluge, et al., Radiat. Prot. Dosimetry. 2 (2) (1982) 85.