Gas Accretion and Star-Formation Rates with IFUs and Background Quasars
Abstract
Star forming galaxies (SFGs) are forming stars at a regular pace, forming the so-called main sequence (MS). However, all studies of their gas content show that their gas reservoir ought to be depleted in 0.5-2 Gyr. Thus, SFGs are thought to be fed by the continuous accretion of intergalactic gas in order to sustain their star-formation activity. However, direct observational evidence for this accretion phenomenon has been elusive. Theoretically, the accreted gas coming from the intergalactic medium is expected to orbit about the halo, delivering not just fuel for star-formation but also angular momentum to the galaxy. This accreting material is thus expected to form a gaseous structure that should be co-rotating with the host once at or kpc. Because of the rough alignment between the star-forming disk and this extended gaseous structure, the accreting material can be most easily detected with the combination of background quasars and integral field units (IFUs). In this chapter, accretion studies using this technique are reviewed.
1 Gas accretion in the context of galaxy evolution
Two major advances in our understanding of the evolution of galaxies have occurred in the past five years or so. First, star forming galaxies (SFGs) are seen to be forming stars at a regular pace, forming the so-called main-sequence (MS; Brinchmann et al., 2004; Noeske et al., 2007; Daddi et al., 2007; Elbaz et al., 2007; Peng et al., 2010; Whitaker et al., 2012, 2014; Tomczak et al., 2016) an almost linear relation between star-formation rate (SFR) and stellar mass (). Second, star-forming galaxies have gas consumption time scales (defined as the time scale to consume the gas at the current SFR, i.e. /SFR) that are too short compared to the age of the Universe (at all epochs where gas masses can be measured, currently up to redshifts ; Leroy et al., 2008; Genzel et al., 2010; Tacconi et al., 2013; Freundlich et al., 2013; Saintonge et al., 2013, 2016). Thus, in order to sustain the observed levels of star-formation over many Gyrs, galaxies must continuously replenish their gas reservoir with fresh gas accreted from the vast amounts available in the intergalactic medium.
Two additional indirect arguments point towards the necessity for gas accretion. One other argument comes from the metallicity distribution of sun-like stars (G-type) in the Milky Way, where the metallicity distribution of G-stars is not consistent with the expectation from chemical evolution models (whose initial condition is that of a pure gaseous reservoir, a.k.a. a ‘closed-box’) unless some fresh gas infall is invoked (Lynden-Bell, 1975; Pagel & Patchett, 1975), a discrepancy often referred to as the G-dwarf problem (van den Bergh, 1962; Schmidt, 1963). Another another indirect argument for continuous replenishment of galaxy reservoirs comes from the non-evolving (or very weakly evolving) cosmic neutral density for damped Ly absorbers (Péroux et al., 2003; Bauermeiester et al., 2010; Noterdaeme et al., 2012; Zafar et al., 2013; Crighton et al., 2015) which contrasts with the rapid evolution of the stellar cosmic density.
In numerical simulations, accretion of intergalactic gas (via the cosmic web) originates from the growth of dark matter halos which pulls the cold baryons along. In galaxies with luminosities less than , this process is expected to be very efficient owing to the short cooling times in these halos (White & Frenk, 1991; Birnboim & Dekel, 2003; Kereš et al., 2005; Faucher-Giguère, 2011). This phenomenon is often referred to as ‘cold accretion’ and this term describes the halo mass regime () where the accretion is most efficient (White & Frenk, 1991; Birnboim & Dekel, 2003). At high masses and high redshifts, cold accretion can occur in the form of cold-streams (Dekel et al., 2009), i.e. when the halo is larger than the typical filament cross-section.
Once inside the galaxy dark matter halo, the accreted gas is expected to orbit the galaxy, the cold accreted gas should orbit about the halo before falling in to build the central disk, delivering not only fuel for star formation but also angular momentum to shape the outer parts of the galaxy (Stewart et al., 2011b; Shen et al., 2013; Danovich et al., 2015). Thus, accreting material should co-rotate with the central disk in the form of a warped, extended cold gaseous structure (Pichon et al., 2011; Kimm et al., 2011; Danovich et al., 2012, 2015; Shen et al., 2013), sometimes referred to as a “cold-flow disk” (Stewart et al., 2011a, 2013, 2016). This is further discussed in the chapter by K. Stewart.
In the local universe, such large gaseous disks are often seen around galaxies in Hi 21cm surveys, where the Hi disk extends 2–3 times beyond the stellar radius as in the M33 low surface brightness disk (Putman et al., 2009), the more massive M81 (Yun et al., 1994) and M83 galaxies (Huchtmeier & Bohnenstengel, 1981; Bigiel et al., 2010), and others (see chapter by F. J. Lockman). The kinematics of this Hi gas in the outer parts show that the gas is systematically rotating in the same direction as the central object at those large radii (2–3 times beyond the stellar radius or 20-30 kpc).
As discussed in Stewart et al. (2011a), these gaseous disks (or “cold-flow disks”) should produce distinct kinematic signatures in absorption systems. In particular, the gas kinematics seen in absorption spectra are expected to be offset by about km s-1 from the galaxy’s systemic velocity. It should be noted that these cold-flow disks are the end product of cold accretion and these two terms should not be confused. Moreover, cold-flow disks occur on scales of a few tens of whereas cold accretion (or cold streams) occur on scales of Mpc, hence the possibility to observe with background quasars these two distinct phenomenon depends strongly on the gas column density. Theoretical expectations for detecting cold accretion with Lyman limit systems is discussed in Fumagalli et al. (2011); Goerdt et al. (2012) and in the chapter by C. A. Faucher-Giguère. Observational signatures of cold accretion with Lyman limit systems are discussed in the chapter by N. Lehner. This chapter focuses on the distinct absorption kinematics of “cold-flow disks” which should occur in the high column density regime and well inside the halos of galaxies.
Before discussing the most recent observations, it is important to quantify how much accretion is needed in order to sustain the observed levels of star-formation over many Gyrs to the levels of tens to hundreds of solar masses per year at required by the main-sequence. This can be estimated from the following argument. As shown in Bouché et al. (2010) and many others since (Davé et al., 2012; Krumholz et al., 2012; Lilly et al., 2013; Feldmann, 2013, 2015; Dekel & Mandelker, 2014; Forbes et al., 2014; Peng & Maiolino, 2014), galaxies at can be thought of as a simplified gas regulator where there is a rough balance between the SFR and the gas accretion rate. The equilibrium between gas accretion and SFR under the ‘regulator’ model (Lilly et al., 2013) or ‘bathtub’ scenario (Bouché et al., 2010) indicate that the accretion rate should be comparable to the star-formation rate (SFR).
In particular, the equilibrium solution can be found from the continuity equation between the gas supply and gas consumption terms, and equilibrium SFR can be expressed as
| SFR | (1) | ||||
where is the gas returned fraction (from massive stars) under the instantaneous recycling approximation, the loading factor from galactic winds, the universal baryonic fraction and the efficiency of accretion (with ) and the dark matter growth rate (Genel et al., 2008; McBride et al., 2009; Dekel et al., 2013). Equation 1 has several implications. First, it shows that SFR and the accretion rate are comparable to a factor of order unity given that is found to be (Heckman et al., 2015; Schroetter et al., 2015, 2016) and that with its exact value depending on the initial mass function. Second, it shows that the evolution of the accretion rate sets the evolution of the SFR (Bouché et al., 2010). Lastly, it is ultimately the dark matter growth rate that limits the growth rate of galaxies and the evolution of SFR.
Equation 1 is important because it shows that SFR is regulated by cosmological quantities (in other words it is supply-limited) and not necessarily the very local conditions (such as gas mass or gas surface density). The gas mass will adjust itself such that there is a close balance between SFR (consumption) and accretion (supply). However, as discussed in Bouché et al. (2010) and Lilly et al. (2013), beyond or , the dark matter growth rate is so large that the SFR does not have the time to adjust itself towards the (quasi)-equilibrium solution, and thus this solution does not apply.
2 Detecting Gas Accretion
Contrary to gas outflows where observational evidence abounds, direct evidence of gas inflows is notoriously difficult to obtain. As described in this book, this situation has begun to change. One can study gas accretion via Lyman Limit Systems (see chapter by N. Lehner), studies of galaxy spectra (see chapter by K. Rubin), UV spectroscopy of quasars (see chapter by P. Richter), or Lyman alpha emission (see chapter by S. Cantalupo). In this chapter, I will focus on the recent breakthroughs on detecting gas accretion which came from recent technological advancements with integral field units (IFUs).
2.1 Observational and Technological breakthroughs
To study gas accretion, one can take advantage of one recent key observational result established only about 5-6 years ago, namely that the gas distribution as traced by low-ionization lines (such as Mgii, [Na D]) is highly anisotropic (see chapter by G. Kacprzak). The first evidence which showed that the circumgalactic gas was anisotropic came from a study of [Na D] absorption in stacked spectra from a large sample of SDSS galaxies (Chen et al., 2010). Their results showed a strong inclination dependence of the blue-shifted absorption lines. Had the gas been isotropic, this inclination dependence would not have been found.
Another important result came soon after with the investigation of the radial and azimuthal dependence of the low ion Mgii in a sample of 4000 intermediate redshift galaxies with 5000 background galaxies in the COSMOS survey (Bordoloi et al., 2011). They found that –for blue star-forming galaxies– there is a strong azimuthal dependence of the Mgii absorption within 50 kpc of inclined disk-dominated galaxies, indicating the presence of a strongly bipolar outflows. This result was soon confirmed with two key studies at using background quasars which have the advantage that they can probe the properties of gaseous halos around individual galaxies (Bouché et al., 2012; Kacprzak, 2012). While the presence of strong bipolar outflows leaving galaxy disks more or less perpendicularly, i.e. in the direction of the minor-axis, these studies with background quasars revealed that the low-ionization gas traced by Mgii do also trace the outskirts of gaseous disks when the quasar’s location appear to be aligned with the minor axis. Indeed, the azimuthal angle 111 is defined as the angle between the galaxy major-axis and the apparent quasar location. distribution of background quasars with Mgii appears to be bi-modal with a main peak at deg (aligned with the minor-axis) and at deg (aligned with major-axis) (Bouché et al., 2012; Schroetter et al., 2015, 2016).
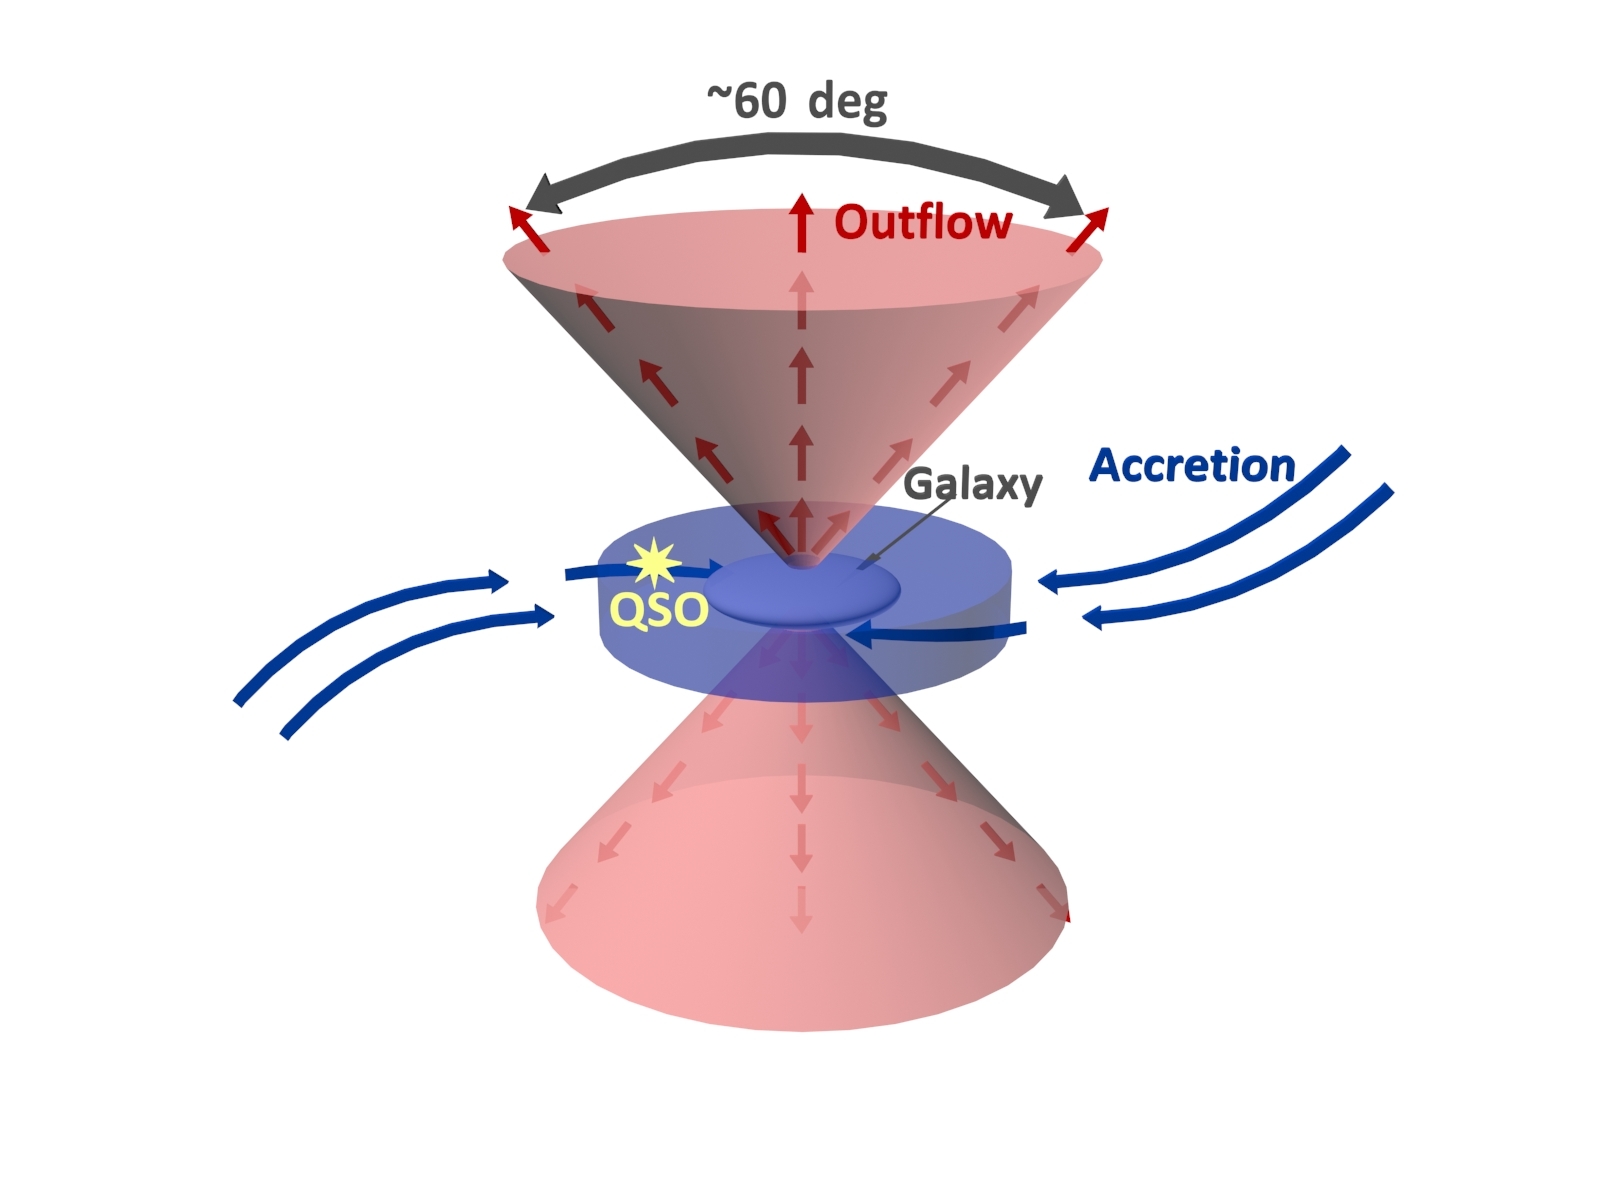
Thus, a picture is emerging from these observations where outflows occur preferentially along the minor axis of galaxies, with also large gaseous structures (as described in the previous section) that are roughly co-planar with the star-forming galaxy. Figure 1 represents schematically the situation with outflows leaving the galaxy along the minor-axis and gas inflows forming the so-called ‘cold flow disk’, the gaseous structure discussed in the previous section and in the chapter by K. Stewart. The cold gas in outflows as traced by Mgii extend to at least 80–100 kpc, but outflows could extend to the virial radius. The cold-flow disk on the other hand is typically 20–30 kpc, i.e. extends to a few tens of the virial radius.
Quasar absorption lines (such as the low-ionization Mgii2796,2803 doublet) have had the potential to yield important information on gas flows for decades, but the challenge has always been in finding the galaxy associated with a particular absorber. Indeed, in order to connect the properties of the Circum Galactic Medium (CGM) with those of galaxies, such as SFR, mass, etc., it is necessary to identify the galaxy associated with each metal line absorption system. This identification process has been a challenge more decades because it is inherently expensive and inefficient with traditional imaging and spectrographic instruments. As described in this book, one can take deep imaging, but one will need to perform extensive multi-object spectroscopy of all of the galaxies within a certain impact parameter around the quasar.
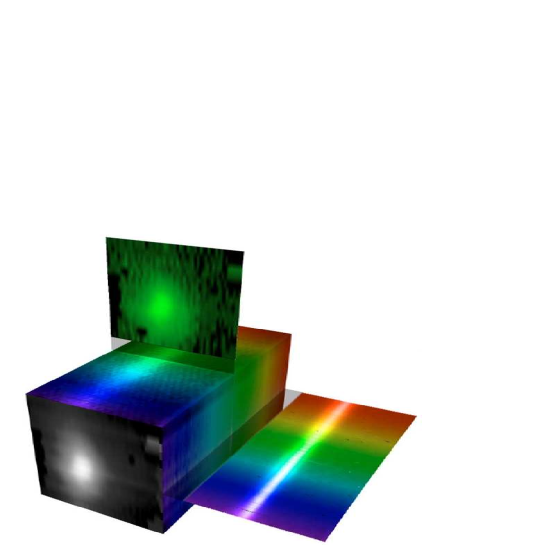
But in the past 10 years, there has been a technological breakthrough, with the advancements of IFUs on 10-m class telescopes. Indeed, with an IFU, one can simply point-and-shoot at a quasar field and identify line emitters at the expected redshift of the absorption system (Figure 2). However, the IFU must have a sufficiently large field of view (FOV). Two IFUs, both on the VLT, have played a major role in this area: the near-infrared IFU SINFONI (with a FOV of 8 arcsec8 arcsec; Bonnet et al., 2004) and the new optical IFU MUSE (with a FOV of 1’1’; Bacon et al., 2010).
This technique was pioneered by Bouché et al. (2007) on a sample of 21 Mgii absorbers selected from the SDSS survey using the SINFONI IFU as illustrated on Figure 2. Given that SINFONI has a small FOV of only 8 arcsec8 arcsec, one has to select the quasar sight-lines with absorbers that have the highest chance to be associated with a galaxy at small impact parameter, i.e. to lie within the FOV. Thanks to the well-known anti-correlation between the Mgii rest-equivalent width and impact parameter (Lanzetta & Bowen, 1990; Steidel, 1995), the strongest absorbers are the most likely to be associated with a galaxy at a small (of a few arcsec) impact parameter. This selection criteria became the basis for the SINFONI Mgii Program for Line Emitters (SIMPLE; Bouché et al., 2007, 2012; Schroetter et al., 2015).
2.2 Measuring the Gas Accretion Rate
Suppose one finds a galaxy with a background quasar within 15-30 kpc of a galaxy, but more importantly, a quasar whose apparent location is aligned with the galaxy’s major axis as illustrated on Figure 1. This geometrical configuration is ideal to study the properties of “cold-flow-disks” which are created by the global accretion process (or processes) as discussed earlier.
The gas accretion rate can be estimated if one approximates the gaseous structure as a short cylinder of radius and height which has mass density at the location of the quasar sight-lines, i.e. at the impact parameter . As the cylinder is intercepted by the quasar line-of-sight at the impact parameter , the accretion flux through the inner surface of area can be estimated from mass conservation argument, yielding the following equation:
| (2) | |||||
where is the radial flow velocity (perpendicular to the surface ), is the inclination of the structure, is the total gas column, is the mean molecular weight, is the proton mass, and the second line uses the identity . This equation can be used to estimate accretion rates of gaseous inflows in the close vicinity of galaxies as probed by quasar lines-of-sight.
3 Gas Accretion from IFU surveys
In this section, I discuss example results from the recent IFU surveys that have led to the first constraints on the accretion rates of fresh gas around star-forming galaxies. Before discussing detailed results, I list here several of the key surveys of quasar sight-lines with IFUs. These are
- •
- •
- •
-
•
the MUSE Gas Flow and Wind (MEGAFLOW) survey around Mgii systems with rest-equivalent width Å, on 22 quasar sight-lines with multiple ( or 5) Mgii systems (Schroetter et al., 2016).
In contrast to the SINFONI surveys where one can only target a single system at a time and have yielded about two dozens galaxy-quasar pairs, the MUSE survey will yield about 80 to 100 galaxy-quasar pairs thanks to the large wavelength range of the MUSE instrument (Å).
3.1 Case Study 1: HE2243 at
From a sample of galaxy-quasar pairs, one needs to select suitable pairs for the study of accretion. From Figure 1 one sees that the galaxy should not be seen face-on and that the quasar apparent location should be aligned with the galaxy major-axis. From the z2SIMPLE survey (Bouché et al., 2012), one star-forming galaxy associated with a Mgii system is located just 26 kpc from the quasar line-of-sight of HE 224360 222This system is also a damped Lyman absorber (DLA; Lopez et al., 2002) with a column density of .. The background quasar whose apparent location on the sky is fortuitously aligned with the galaxy’s projected major-axis, makes this galaxy-quasar pair an excellent candidate to test the predictions from cosmological simulations (Stewart et al., 2011a, 2016).
Not only IFUs are excellent tools to identify the host galaxy, but also, such observations directly yield the galaxy star-formation rate, the galaxy kinematics and the galaxy’s orientation with respect to the quasar sight-line. In this case, the galaxy has a star-formation rate (SFR) of M⊙ yr-1 (where M⊙ is the mass of the Sun), typical for that redshift. The kinematics of the star-forming galaxy obtained with adaptive optics (AO) assisted SINFONI (i.e. obtained with kpc or arcsec resolution) reveal that this galaxy has physical properties typical for rotationally-supported disks seen at that redshift (Förster Schreiber et al., 2006, 2009), with a maximum rotation velocity of km s-1 determined from 3D fitting. And the apparent quasar location on the sky is only 10∘ to 20∘ from the galaxy’s projected major-axis.
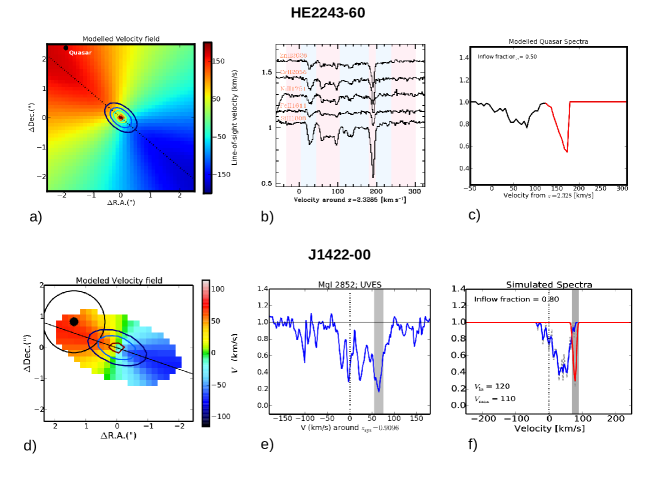
The kinematics of the absorbing gas along the line-of-sight give clues about the nature of the gas, which were observed with the VLT spectrograph UVES. A direct comparison between the absorbing gas kinematics with respect to the galaxy emission kinematics, reveal that the gas seen in absorption 26 kpc from the galaxy — corresponding to 7 times the half-light radius kpc or one third of the virial size of the halo — is moving in the same direction as the galaxy rotation; i.e. the gas appears to be co-rotating. The comparison is shown in Figure 3 where panel (a) shows the galaxy emission kinematics as recovered from the IFU data, and panel (b) shows absorbing gas kinematics measured from the absorption lines in the UVES spectra. One can see that all of the low-ionization ions Znii, Crii, Feii and Siii tracing the cold gas show redshifted velocities and the observed velocity field of this galaxy also shows redshifted velocities in the direction of the quasar location. Hence, the absorbing gas appears to be “co-rotating” with the host, meaning that it rotates in the same direction.
However, while the sign of the kinematic shifts agrees, the amplitude of the kinematic differences does not agree entirely. Only a fraction of the velocities seen in absorption are in agreement with those seen in emission from the galaxy (extrapolated at the location of the quasar). This would indicate that a simple rotating disk with circular orbits and a normal (flat) rotation curve can account only for some fraction of the absorbing gas kinematics. The other components have a line-of-sight velocity less than the rotation speed, indicating that this gas is not rotationally supported. In other words, the second group of components is offset by about 100km s-1 from the rotation pattern; hence cannot be gravitationally supported and therefore should be flowing in.
In order to estimate the accretion rate from these observations, one needs estimates of the gas column density and of the inflow speed. A detailed analysis of the metal column densities in each of the components (Bouché et al., 2013) indicate that each of these two groups contain about half of the total Hi column . Using a simple geometrical toy model of accretion —where “particles” representing gas clouds or absorption components are distributed in an extended disk configuration as in Figure 1— with cloud kinematics reflecting an inflowing (radial) gas flow, one can generate simulated absorption profiles which can then be compared to the observed absorption profile. Because the relative galaxy orientation is well determined by the VLT/SINFONI data, the only free parameter is the inflow speed which is found to be km s-1. Figure 3(c) shows the modeled kinematics with the disk component shown in red, and the inflow component shown in black.
Using the constraints on and on from the line-of-sight kinematic shift between the SINFONI and UVES datasets, the estimated accretion rates estimated from Equation 2 is 30 to 60 M⊙ yr-1 given the uncertainties in the column density and inflow speed. The range of accretion rates, 30 to 60 M⊙ yr-1, is found to be similar to the galaxy’s SFR of M⊙ yr-1, in agreement with the simplest arguments for galaxy growth given in § 1. Furthermore, for this galaxy’s halo mass, (assuming ), the maximum baryonic accretion rate is M⊙ yr-1 (Genel et al., 2008; Dekel et al., 2013), which implies an accretion efficiency in Equation 1 of % regardless of the value for the wind loading factor .
3.2 Case Study 2: J1422 at
From the SIMPLE survey (Bouché et al., 2007) consisting of 14 galaxies found around strong –1.0 Mgii absorbers selected from the Sloan Digital Sky Survey (SDSS) database with rest-frame equivalent widths 2 Å, two have the galaxy’s major-axis roughly aligned with the quasar apparent location among the galaxies that are not seen face-on (with an inclination ∘) as shown in (Schroetter et al., 2015). One of these two is the quasar–galaxy pair towards the quasar SDSS J142253.31000149 (hereafter SDSS J142200), where the galaxy’s major-axis is about 15∘ from quasar-galaxy orientation. This is — as already mentioned — the most favorable configuration to look for the kinematic signatures of gas inflows (Figure 1).
The J142200 quasar field was also observed with the MUSE IFU (Bouché et al., 2016), yielding [Oii] and H fluxes in addition to the H, and [Nii] fluxes from SINFONI. Incidentally, the MUSE observations show that there are no companion down to 0.22 M⊙ yr-1 (5 ) within 240 kpc (30 arcsec). Combining H, [Oii] fluxes from SINFONI and MUSE observations, the galaxy has a SFR of M⊙ yr-1 (Bouché et al., 2016), an a metallicity of . Figure 3 shows the galaxy kinematics which yield a maximum velocity km s-1, corresponding to a halo mass of , corresponding to a 0.1 galaxy. For such a halo mass, the average baryonic accretion rate is M⊙ yr-1.
The Hi gas column density associated with this 3.2Å Mgii absorber is log (Hi), measured from a Hubble Space Telescope/COS G230L spectra. Using a high-resolution spectrum (UVES) of the background quasar, Bouché et al. (2016) found that the gas kinematics traced by low-ionization lines (, Zn, Fe, Al) show distinct signatures consistent with those expected for a “cold-flow disk”. Indeed, the absorption profile consists of a component that follows the expected (projected) rotation speed, at km s-1, with several sub-components that are offset kinematically as shown in Figure 3(b) Using a similar geometrical model as in § 3.1, the absorption kinematics data are consistent with a radial inflow speed of 100 km s-1, when comparing the data (panel e) and the model (panel f) in Figure 3. With such an inflow velocity, one can estimate the mass flux rate to be at least two to three times larger than the SFR using Equation 2.
Interestingly, this galaxy also shows evidence for a galactic wind from the blueshifted (by km s-1) low-ionization absorption lines (Mgii and Feii) in the galaxy spectrum. The estimated mass outflow rate is about 0.5–5 M⊙ yr-1 (i.e. a loading factor ), and currently, this is the only galaxy with simultaneous constraints on the gas outflow and inflow rates. With a constraint on the outflow rate and the loading factor, one can better estimate the efficiency of baryonic accretion using Eq. 1. Together these numbers imply that the factor in Eq. 1 is SFR is 5 to 8 M⊙ yr-1. As mentioned, for this galaxy halo mass, the average baryonic accretion rate is estimated to be M⊙ yr-1 using the theoretical expectation for the DM accretion rate from Genel et al. (2008) or Birnboim et al. (2007). Putting it together, the accretion efficiency is high at (regardless of the loading factor ) in agreement with the theoretical expectation of Dekel & Birnboim (2006). It is important to keep in mind that our measurements on inflow and outflow rates are instantaneous quantities, while this baryonic estimate is time averaged, or averaged for populations of galaxies.
Implications for angular momentum
A critical question for these gaseous disks around star-forming galaxies is how much angular momentum they carry as discussed in Stewart et al. (2013) and Danovich et al. (2015). Here, we recall the common relation between the specific angular momentum and the spin parameter taken from Bullock et al. (2001), which is
| (3) |
where and are the halo virial radius and virial circular velocity.
The host galaxy is estimated by Bouché et al. (2016) to have to be 0.04–0.05, using the the relation between disk scale length and the disk spin parameter from Mo et al. (1998). But the angular momentum of the ‘cold-flow disk’ is harder to estimate without a direct size constraint, but one can place useful limits using the minimum radius given by the impact parameter. Doing so, the spin parameter of the cold-flow disk is estimated to be , i.e. 50% larger than that of the galaxy. This limit on the cold-flow disk angular momentum is consistent with the theoretical expectation of Danovich et al. (2015), where the baryons within have 2–3 times the galaxy angular momentum.
Metallicity aspects
When discussing gas inflows around galaxies, one naturally wonders whether the accreting material has a metallicity of ‘pristine’ IGM gas (i.e. ). Naturally, estimates of the gas metallicity requires a Hi column density measurement in addition to gas phase column densities for the metallic ions. For both of the cases discussed in this section, the Hi column density could be determined directly from either a UVES optical spectrum or a COS UV-spectrum.
In both cases, the metallicity of the absorbing gas is estimated to be much higher than the IGM metallicity of for fresh infall, implying a significant amount of recycling. Indeed, the absorbing gas metallicity is estimated to be and for HE224360 and J142200, respectively. Though, in both cases, the host galaxy ISM metallicity — measured from its nebular lines — is somewhat higher than the absorbing gas, at 1/2 and , respectively. Hence, one can conclude from these studies that the gas accretion is already enriched from significant recycling, but is lower than the metallicity of the ISM by about a factor of two.
3.3 Case Study 3: H I selection
Because a selection using metal lines inevitably leads to a bias in the selection of absorption line systems, C. Péroux and her collaborators have led several studies using Hi-selected absorbers, i.e. Damped Ly absorbers (DLAs) with Hi column densities greater than cm-2, and sub-DLAs with Hi column densities between and cm-2. The advantage of the Hi-selection is that it bypass the biases present in metal line selections. The disadvantage of this technique is that the success rate in detecting the host galaxy is much lower.
Using the IFU SINFONI, out of a large survey of 30 Hi systems, only 6 were detected (Péroux et al., 2011, 2012, 2013, 2014, 2017). Out of these 6 detections they find evidence for the presence of outflows in two systems, while three are consistent with gas accretion and the remaining case is poorly constrained.
Such sample will prove important in order to compare the gas metallicity seen along the quasar line-of-sight with the metallicity of the host as described in Péroux et al. (2016). At the moment, the situation is unclear and large samples are required.
4 Future Perspectives
The case studies described in Section 3 are interesting, but the natural question is how common are the features shown in Figure 3. While SINFONI has played a major role in this area, the wide-field IFU MUSE, one of the second generation instrument for the VLTs which started operation in the Fall of 2014, is changing our view of the CGM and will allow for a major leap forward in our knowledge of gas inflows and outflows. Indeed, thanks to its large 1’x1’ field of view sampled at 0.2 arcsec/spaxel, large wavelength range from 480nm to 930 nm sampled at 1.25Å, and to its unprecedented sensitivity, MUSE (Bacon et al., 2010) will allow us to study gas flows around galaxies with samples 10 times larger (i.e. ) than current surveys. In particular, we started the MusE Gas FLO and Wind (MEGAFLOW) survey designed to yield 100 galaxy-quasar pairs in about 22 quasar sight-lines selected from the SDSS database (DR12) which have multiple (4 or more) Mgii2796,2803 absorbers at redshifts suitable for [Oii]3726,3729 emitters. Results on outflows from the first two fields appeared in Schroetter et al. (2016) and the first results on accretion from this survey are to appear in J. Zabl (2017, in prep.).
References
- Bacon et al. (2010) Bacon, R., Accardo, M., Adjali, L., et al., SPIE, 7735, 8
- Bauermeiester et al. (2010) Bauermeister, A., Blitz, L., & Ma, C. 2010, ApJ, 717, 323
- Bigiel et al. (2010) Bigiel, F., Leroy, A., Seibert, M., et al. 2010, ApJ, 720, L31
- Birnboim & Dekel (2003) Birnboim, Y., & Dekel, A. 2003, MNRAS, 345, 349
- Birnboim et al. (2007) Birnboim, Y., Dekel, A., & Neistein, E. 2007 MNRAS, 380, 339
- Bonnet et al. (2004) Bonnet, H., Conzelmann, R., Delabre, B., et al. 2004, SPIE, 5490, 130
- Bordoloi et al. (2011) Bordoloi, R., Lilly, S.J., Knobel, C., et al. 2011, ApJ, 743, 10
- Bouché et al. (2010) Bouché, N., Dekel, A., Genzel, R., et al. 2010, ApJ, 718, 1001
- Bouché et al. (2016) Bouché, N., Finley, H., Schroetter, I., et al. 2016, ApJ, 820, 121
- Bouché et al. (2012) Bouché, N., Hohensee, W., Vargas, R., et al. 2012, MNRAS, 426, 801
- Bouché et al. (2013) Bouché, N., Murphy, M.T., Kacprzak, G.G., et al. 2013, Science, 341, 50
- Bouché et al. (2012) Bouché, N., Murphy, M.T., Péroux, C., et al. 2012, MNRAS, 419, 2
- Bouché et al. (2007) Bouché, N., Murphy, M.T., Péroux, C., et al. 2007, ApJ, 669, L5
- Brinchmann et al. (2004) Brinchmann, J., Charlot, S., White, S.D.M., et al. 2004, MNRAS, 351, 1151
- Bullock et al. (2001) Bullock, J.S., Dekel, A., Kolatt, T.S., et al. 2001, ApJ, 555, 240
- Chen et al. (2010) Chen, Y., Tremonti, C.A., Heckman, T.M., et al. 2010, AJ, 140, 445
- Crighton et al. (2015) Crighton, N.H.M., Murphy, M.T., Prochaska, J.X., et al. 2015, MNRAS, 452, 217
- Daddi et al. (2007) Daddi, E., Dickinson, M., Morrison, G., et al. 2007, ApJ, 670, 156
- Danovich et al. (2015) Danovich, M., Dekel, A., Hahn, O., Ceverino, D., Primack, J. 2015, MNRAS, 449, 2087
- Danovich et al. (2012) Danovich, M., Dekel, A., Hahn, O., Teyssier, R. 2012, MNRAS, 442, 1732
- Davé et al. (2012) Davé, R., Finlator, K., Oppenheimer, B.D.: 2012, MNRAS, 421, 98
- Dekel & Birnboim (2006) Dekel, A., Birnboim, Y. 2006, MNRAS, 368, 2
- Dekel et al. (2009) Dekel, A., Birnboim, Y., Engel, G., et al. 2009, Nature, 457, 451
- Dekel & Mandelker (2014) Dekel, A., & Mandelker, N. 2014, MNRAS, 444, 2071
- Dekel et al. (2013) Dekel, A., Zolotov, A., Tweed, D., et al. 2013, MNRAS, 435, 999
- Elbaz et al. (2007) Elbaz, D., Daddi, E., Le Borgne, D., et al. 2007, A&A, 468, 33
- Faucher-Giguère (2011) Faucher-Giguère, C.A., Kereš, D., & Ma, C.P. 2011, MNRAS, 417, 2982
- Feldmann (2013) Feldmann, R. 2013, MNRAS, 433, 1910
- Feldmann (2015) Feldmann, R. 2015, MNRAS, 449, 3274
- Forbes et al. (2014) Forbes, J.C., Krumholz, M.R., Burkert, A., Dekel, A. 2014, MNRAS, 438, 1552
- Förster Schreiber et al. (2009) Förster Schreiber, N.M., Genzel, R., Bouché, N., et al. 2009, ApJ, 706, 1364
- Förster Schreiber et al. (2006) Förster Schreiber, N.M., Genzel, R., Lehnert, M.D., et al. 2006, ApJ, 645, 1062
- Freundlich et al. (2013) Freundlich, J., Combes, F., Tacconi, L. J., et al. 2013, A&A, 553, A130
- Fumagalli et al. (2011) Fumagalli, M., Prochaska, J.X., Kasen, D., et al. 2011, MNRAS, 418, 1796
- Genel et al. (2008) Genel, S., Genzel, R., Bouché, N., et al. 2008, ApJ, 688, 789
- Genzel et al. (2010) Genzel, R., Tacconi, L.J., Gracia-Carpio, J., et al. 2010, MNRAS, 407, 2091
- Goerdt et al. (2012) Goerdt, T., Dekel, A., Sternberg, A., Gnat, O., & Ceverino, D. 2012, MNRAS, 424, 2292
- Heckman et al. (2015) Heckman, T. M. , Alexandroff, R. M. , Borthakur, S. , Overzier, R. , & Leitherer, C. 2015, ApJ, 809, 147
- Huchtmeier & Bohnenstengel (1981) Huchtmeier, W. K., Bohnenstengel, H. D. 1981, A&A, 100, 72
- Kacprzak (2012) Kacprzak, G.G., Churchill, C.W., Nielsen, N.M.: et al. 2012, ApJ, 760, L7
- Kereš et al. (2005) Kereš, D., Katz, N., Weinberg, D.H., & Davé, R. 2005, MNRAS, 363, 2
- Kimm et al. (2011) Kimm, T., Devriendt, J., Slyz, A., et al. 2011, preprint, arXiv:1106.0538
- Krumholz et al. (2012) Krumholz, M.R., Dekel, A., & McKee, C.F. 2012, ApJ, 745,
- Lanzetta & Bowen (1990) Lanzetta, K.M., Bowen, D.: 1990, ApJ, 357, 321
- Leroy et al. (2008) Leroy, A.K., Walter, F., Brinks, E., et al. 2008, AJ, 136, 2782
- Lilly et al. (2013) Lilly, S.J., Carollo, C.M., Pipino, A., Renzini, A., & Peng, Y. 2013, ApJ, 772, 119
- Lopez et al. (2002) Lopez, S., Reimers, D., D’Odorico, S., & Prochaska, J.X. 2002, A&A, 385, 778
- Lynden-Bell (1975) Lynden-Bell, D. 1975, Vistas in Astronomy, 19, 299
- McBride et al. (2009) McBride, J., Fakhouri, O., & Ma, C. 2009, MNRAS, 398, 1858
- Mo et al. (1998) Mo, H.J., Mao, S., & White, S.D.M. 1998, MNRAS, 295, 319
- Noeske et al. (2007) Noeske, K.G., Faber, S.M., Weiner, B.J., et al. 2007, ApJ, 660, L47
- Noterdaeme et al. (2012) Noterdaeme, P., Petitjean, P., Carithers, W.C., 2012, A&A, 547, L1
- Pagel & Patchett (1975) Pagel, B.E.J., & Patchett, B.E. 1975, MNRAS, 172, 13
- Peng et al. (2010) Peng, Y.j., Lilly, S.J., Kovač, K., 2010, ApJ, 721, 193
- Peng & Maiolino (2014) Peng, Y.J., & Maiolino, R. 2014, MNRAS, 443, 3643
- Péroux et al. (2003) Péroux, C., McMahon, R.G., Storrie-Lombardi, L.J., & Irwin, M.J. 2003, MNRAS, 346, 1103
- Péroux et al. (2013) Péroux, C., Bouché, N., Kulkarni, V.P., & York, D.G. 2013, MNRAS, 436, 2650
- Péroux et al. (2011) Péroux, C., Bouché, N., Kulkarni, V.P., York, D.G., & Vladilo, G. 2011, MNRAS, 410, 2237
- Péroux et al. (2012) Péroux, C., Bouché, N., Kulkarni, V.P., York, D.G., & Vladilo, G. 2012, MNRAS, 419, 3060
- Péroux et al. (2014) Péroux, C., Kulkarni, V.P., & York, D.G. 2014, MNRAS, 437, 3144
- Péroux et al. (2016) Péroux, C., Quiret, S., Rahmani, H., et al. 2016, MNRAS, 457, 903
- Péroux et al. (2017) Peroux, C., Rahmani, H., Quiret, S., et al. 2017, MNRAS, 464, 2053
- Pichon et al. (2011) Pichon, C., Pogosyan, D., Kimm, T., et al. 2011, MNRAS, 418, 2493
- Putman et al. (2009) Putman, M.E., Peek, J.E.G., Muratov, A., 2009, ApJ, 703, 1486
- Saintonge et al. (2016) Saintonge, A., Catinella, B., Cortese, L., et al. 2016, MNRAS, 462, 1749
- Saintonge et al. (2013) Saintonge, A., Lutz, D., Genzel, R., et al. 2013, ApJ, 778, 2
- Schmidt (1963) Schmidt, M. 1963, ApJ, 137, 758
- Schroetter et al. (2015) Schroetter, I., Bouché, N., Péroux, C., et al. 2015, ApJ, 804, 83
- Schroetter et al. (2016) Schroetter, I., Bouché, N., Wendt, M. 2016, ApJ, 833, 39
- Shen et al. (2013) Shen, S., Madau, P., Guedes, J., et al. 2013, ApJ, 765, 89
- Steidel (1995) Steidel, C.C., in QSO Absorption Lines, ESO Astrophysics Symposia, p. 139. Springer-Verlag, Berlin, Germany (1995)
- Stewart et al. (2016) Stewart, K., Maller, A., Oñorbe, J., et al. 2016, ApJ, submitted, arXiv:1606.08524
- Stewart et al. (2013) Stewart, K.R., Brooks, A.M., Bullock, J.S., et al. 2013, ApJ, 769, 74
- Stewart et al. (2011a) Stewart, K.R., Kaufmann, T., Bullock, J.S., et al. 2011a, ApJ, 735, L1
- Stewart et al. (2011b) Stewart, K.R., Kaufmann, T., Bullock, J.S., et al. 2011b, ApJ, 738, 39
- Tacconi et al. (2013) Tacconi, L.J., Neri, R., Genzel, R., et al. 2013, ApJ, 768, 74
- Tomczak et al. (2016) Tomczak, A.R., Quadri, R.F., Tran, K.V.H., et al. 2016, ApJ, 817, 118
- van den Bergh (1962) van den Bergh, S. 1962, AJ, 67, 486
- Whitaker et al. (2012) Whitaker, K.E., van Dokkum, P.G., Brammer, G., Franx, M. 2012, ApJ, 754, L29
- Whitaker et al. (2014) Whitaker, K.E., Franx, M., Leja, J., et al. 2014, ApJ, 795, 104
- White & Frenk (1991) White, S.D.M. & Frenk, C.S. 1991, ApJ, 379, 52
- Yun et al. (1994) Yun, M.S., Ho, P.T.P., & Lo, K.Y. 1994, Nature, 372, 530
- Zafar et al. (2013) Zafar, T., Péroux, C., Popping, A., et al. 2013, A&A, 556, A141