The low-mass population in the young cluster Stock 8: Stellar properties and Initial Mass Function
Abstract
The evolution of Hii regions/supershells can trigger a new generation of stars/clusters at their peripheries, with environmental conditions that may affect the initial mass function, disk evolution and star formation efficiency. In this paper we study the stellar content and star formation processes in the young cluster Stock 8, which itself is thought to be formed during the expansion of a supershell. We present deep optical photometry along with JHK and 3.6, 4.5 m photometry from UKIDSS and Spitzer-IRAC. We use multi-color criteria to identify the candidate young stellar objects in the region. Using evolutionary models, we obtain a median log(age) of 6.5 (3.0 Myr) with an observed age spread of 0.25 dex for the cluster. Monte Carlo simulations of the population of Stock 8, based on estimates for the photometric uncertainty, differential reddening, binarity, and variability, indicate that these uncertainties introduce an age spread of 0.15 dex. The intrinsic age spread in the cluster is 0.2 dex. The fraction of young stellar objects surrounded by disk is 35%. The K-band luminosity function of Stock 8 is similar to that of the Trapezium cluster. The IMF of Stock 8 has a Salpeter-like slope at 0.5 and the IMF flattens and peaks at 0.4 , below which declines into the substellar regime. Although Stock 8 is surrounded by several massive stars, there seems to be no severe environmental effect in the form of IMF due to the proximity of massive stars around the cluster.
Subject headings:
ISM: individual objects (Stock 8) –stars: formation – stars: pre-main sequence1. Introduction
The initial mass function (IMF) is an important statistical tool to understand the formation of stars and brown dwarfs. Whether the IMF is universal with a shape similar to that of the Galactic field with a general flattening below 1 M⊙ or is a function of star formation environment is a question yet to be answered (Bastian et al., 2010). Numerical simulations suggest that the peak stellar mass and the associated plateau of the IMF of a given region is related to the thermal Jeans mass at the onset of isothermal collapse (e.g., Bate & Bonnell 2005). The plateau properties would then vary with the environmental conditions, for instance the dependence of the Jeans mass on the density and temperature in the molecular core. However, analysis including additional physics, in particular radiative feedback, suggests that the variations in the IMF should be modest (Bate 2009; Krumholz et al. 2012).
Although there is evidence showing that the IMF appears to be constant across different star forming regions and even in the sub-stellar regime (Bastian et al. 2010; Offner et al. 2014), the topic is still under debate (e.g. Dib 2014). Evidence for IMF variations at high-masses has been presented for extreme regions such as the Galactic center (e.g. Lu et al. 2013). Similarly, high velocity dispersion galaxies have systematically bottom heavy IMF compared to Galactic field IMF and hence IMF may be a function of environmental conditions (van Dokkum & Conroy, 2010). The IMF is well characterized in most of the nearby low mass star forming regions such as Taurus or Ophiuchus (see review by Luhman 2012). However the conditions of star formation vary considerably between the massive star forming regions, which contain several tens to hundreds of OB stars, and low mass star forming regions. Radiation and stellar winds from O-type stars may have a profound effect on nearby star formation (e.g., Deharveng et al. 2012; Sicilia-Aguilar et al. 2014; Panwar et al. 2014; Ojha et al. 2011) by regulating the gas dynamics, density, temperature and radiation field. As a result, the products of star formation, such as the IMF, binary fraction and the evolution of protostellar disks, are likely to vary from region to region.
Whether the IMF is universal may be tested with its measurable properties, including the flattening and peak position of IMF in massive star environments. Young clusters located in the vicinity of the large Galactic bubbles, where the local environment might have been affected by feedback from nearby massive stars, are ideal targets for studying the environmental influence on star formation process. If these effects are significant, they may appear in the young cluster Stock 8. Stock 8 is located in the Perseus arm and is part of the extended Hii region Sh2-234 (IC417). Jose et al. (2008) (hereafter Paper 1) used optical and 2MASS photometry to derive the cluster parameters such as the cluster center ( = ; = ), distance ( 2.05 kpc) and age ( 1-5 Myr). Paper 1 shows that Stock 8 is surrounded by 12 massive OB type stars and is probably part of a large OB association. Based on the strong ionized gas emission at 1.4 GHz as well as in in the cluster vicinity, Paper 1 argues that the cluster and its immediate neighbourhood are under the strong influence of the surrounding massive stars. A recent photometric and spectroscopic survey of 25 pc radius around the cluster by Marco & Negueruela (2016) further reveals that the cluster is surrounded by at least 33 early type massive stars ( ). These properties make the cluster a special target to study the effect of massive stellar feedback from the early epoch of star formation to the cluster evolution process as well as the form of IMF in the sub-stellar regime.
In Paper 1 the cluster member list was limited by the shallow observations in optical and bands. Hence the low-mass population of Stock 8 largely remains unexplored so far. The low-mass stars constitute the majority of the stellar population in the Galaxy (Kroupa, 2002). Deep near-infrared observations are an ideal tool to uncover the low mass stellar content of the distant regions. In this study, we investigate the low mass young stellar content of the cluster Stock 8 using deep, high resolution optical observations ( 24 mag) in combination with the UKIDSS and Spitzer-IRAC data sets. The main objectives of this work are: 1) to identify and characterize the YSOs, 2) construct the IMF of Stock 8 down to the low mass regime and to test whether there is any influence of massive stars in its vicinity to the form of IMF. The distance estimated for the cluster in Paper 1 (2.1 kpc) is adopted here and is consistent with the distance of 1.8 – 2.3 kpc obtained by Pandey et al. 2013; Kharchenko et al. 2013; Hou & Han 2014; Foster & Brunt 2015 towards this region. The paper is organized as follows: in Section 2 we describe the various data sets used and generation of point source catalog. In Sections 3 and 4 we characterize the YSOs of the region and derive the various cluster properties. Section 5 describes the luminosity function and mass function analysis, Section 6 discusses the large scale structure of the complex and Section 7 concludes the various results obtained.
2. OBSERVATIONS AND POINT SOURCE CATALOGS
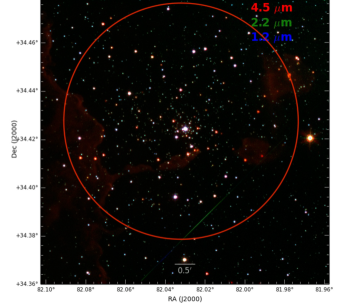
One of the main goals of this study is to obtain the census of YSOs in the cluster. The identification and classification of YSOs in the region are mainly based on and IRAC-3.6 and 4.5 m photometry (see Section 3.2). However, the 4.5 m data is limited to 3′ radius of the cluster towards its north. Hence in this study we focus an area of 3′ radius around the cluster. In this section we describe the individual data sets used for this study.
2.1. Optical Photometry
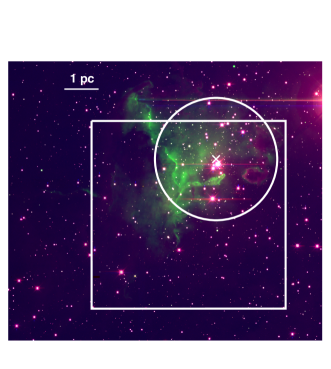
Optical imaging of Stock 8 was obtained on 13 December 2014 with the SNIFS instrument on the UH 2.2 m telescope at Mauna Kea, Hawaii. The instrument covers an area 9′.2 9′.2 on the sky with a plate scale of 0′′.273 per pixel. Two exposures were obtained in and bands, with integration times of 150 and 100 seconds, respectively. Average seeing during observations was 0′′.7. Bias and flat frames taken on the same night were used to pre-process the images. The area coverage of this observation is shown by a box in Fig. 1.
Images were reduced and analyzed using IRAF software. The sources above 5 of the background were detected using DAOFIND task in IRAF. Bright, isolated stars were selected across the field to construct a characteristic point-spread function (PSF) for the images. The PSF photometry of all the sources were obtained using ALLSTAR task in IRAF. The absolute photometry calibration in bands was obtained using the published photometry from Paper 1. We matched the bright isolated sources in the SNIFS catalog with that of Paper 1 within a radius of 1′′.0 and obtained the color and magnitude coefficients in and bands. These coefficients were applied to the entire SNIFS catalog to obtain the calibrated magnitudes. The saturated sources in the SNIFS photometry are replaced with the magnitudes given in Paper 1. We finally consider only those sources with uncertainty 0.2 mag in band for further analysis. The number of sources detected within 3′ radius of Stock 8 is given in Table 1. The detection limits are 24.2 and 22.8 mag in and bands, respectively (see Table 1), which is 2 mag deeper than Paper 1. In terms of spatial resolution and sensitivity, this is the deepest optical photometric survey of the region to date.
2.2. NIR photometry from UKIDSS
NIR photometry was obtained from the UKIDSS 6th archival data release (UKIDSSDR6plus) of the Galactic Plane Survey (GPS; Lucas et al. 2008). UKIDSS observations were performed using the UKIRT Wide Field Camera (WFCAM; Casali et al. 2007). Typical UKIDSS PSFs have 0′′.8 – 1′′ FWHM with 0′′.4 pixels. 2MASS photometry is used to calibrate the final fluxes. Details about the data reduction and calibration procedures are given in Dye et al. (2006) and Hodgkin et al. (2009), respectively. In order to select reliable point sources from the catalog, we consider only those sources with uncertainty 0.2 mag in all three bands. The list was again visually checked for any spurious source detection and such sources were deleted from the list. The magnitudes of the saturated bright sources were retrieved from the 2MASS catalog. The final NIR catalog includes 1256 sources common to , , and bands within 3′ radius of the cluster and the detection limits of individual bands are given in Table 1. UKIDSS photometry is 4 mag deeper than 2MASS photometry in all three bands.
| Band | number of | detection | completeness | completeness |
|---|---|---|---|---|
| sources | limit (mag) | limit (mag) | limit (M⊙) | |
| 848 | 24.2 | 23.0 | 0.3 | |
| 956 | 22.8 | - | - | |
| 1256 | 20.0 | 19.0 | 0.08 | |
| 1259 | 19.3 | - | - | |
| 1261 | 18.3 | 18.0 | 0.08 | |
| ch1 | 865 | 17.2 | 15.0 | 0.4 |
| ch2 | 868 | 17.1 | 15.0 | 0.4 |
2.3. Spitzer-IRAC Photometry
The Spitzer data in the two bands of IRAC centred at 3.6 and 4.5 m (ch1 and ch2) was obtained from the Spitzer archive111http://archive. spitzer.caltech.edu/. These observations were taken on 2010 May 05 (Program ID: 61070 PI: Barbara Whitney) as part of the Spitzer warm mission, in high dynamic range (HDR) mode with two dithers per map position and two images each with integration time of 0.4s and 10.4s per dither.
We obtained the cBCD (corrected basic calibrated data) images from the archive and the raw data was processed and calibrated with the IRAC pipeline. The final mosaic images were created using the MOPEX pipeline with an image scale of 1′′.2 per pixel. We used the DAOFIND task in IRAF to create a preliminary source list with the condition 5 above the background in ch2. The spurious sources were visually identified and deleted from the list. To extract the flux of the point sources, we performed point response function (PRF) fitting on IRAC images in multi frame mode, using the Astronomical Point Source EXtraction (APEX) tool, developed by the Spitzer Science Centre. Flux densities are converted in to magnitudes using the zero-points 280.9 and 179.7 Jys in the 3.6 and 4.5 m bands, respectively, following the IRAC Data Handbook222http://ssc.spitzer.caltech.edu/irac/iracinstrumenthandbook/. The saturated bright sources in the long integrated images were replaced by the sources from short images. The IRAC data of both the bands were merged by matching the coordinates using a radial matching tolerance of 1′′.2. Only those sources with uncertainty 0.2 mag are used for further analysis. The number of sources detected in each band and the detection limits are given in Table 1.
2.4. Final catalog
We created the final photometry catalog by spatially matching and merging the detected sources in various bands. We obtained the NIR detection for all the IRAC sources in both channels within a match radius of 1′′. A search for the optical counterparts of the NIR sources within a radius of 1′′ identified 838 and 946 sources in and bands, respectively. This shows that 99% of our optical sources have NIR counterparts. Sample entries of photometric data of all the stars within 3′ radius of Stock 8 is given in Table 2. The full table is available in the electronic version of the journal.
| Class | |||||||||
|---|---|---|---|---|---|---|---|---|---|
| deg | deg | mag | mag | mag | mag | mag | mag | mag | |
| 82.0033 | +34.4227 | 22.10 | 19.02 | 16.99 | 16.15 | 15.71 | 15.26 | 14.90 | Class II |
| 82.0527 | +34.4321 | 22.30 | 19.23 | 14.46 | 13.48 | 12.99 | 12.17 | 11.86 | Class II |
| 82.0143 | +34.4228 | 17.72 | 15.73 | 13.77 | 12.86 | 12.20 | 11.21 | 10.79 | Class II |
| 81.9839 | +34.4582 | 19.42 | 17.81 | 16.62 | 16.10 | 15.88 | 15.54 | 15.15 | Class II |
| 82.0364 | +34.4367 | 19.74 | 17.36 | 15.48 | 14.62 | 14.20 | 13.65 | 13.36 | Class II |
a The complete table is available in electronic form.
2.5. Completeness limits of the data
Artificial star tests are a standard procedure to assess the level of completeness and accuracy of a photometric analysis. We performed the artificial star experiment using the ADDSTAR tool in IRAF in , and -bands, by inserting stars with known position and magnitude into the images, and then repeating the PSF photometric analysis as was used for the real stars (see Section 2.1). The luminosity distribution of artificial stars is chosen in such a way that more stars were inserted toward the fainter magnitude bins. The fraction of recovered artificial stars per bin of magnitude gives an estimate of the photometric completeness. The photometry in the -band is 100% complete down to 21 mag and is reduced to 70% at 23 mag. In -band, the photometry is 100% complete down to 17 mag and is reduced to 90% at 17-18 mag and 80% at 18-19 mag. In -band, 100% completeness down to 16 mag, 90% at 16-17 mag and 80% at 17-18 mag. The completeness estimated from the histogram distribution of -band detection (see Jose et al. 2016 for details) is in agreement with that of the artificial star method. The completeness measurements of and -bands agree with the 90% completeness limits mentioned in the UKIDSS GPS catalog details (Lucas et al. 2008; =18.0, =18.75, =19.5 mag). The histogram distribution of sources in 3.6 and 4.5 m bands shows that 90% completeness corresponds to 15 mag in both bands. The completeness limits measured for various bands are listed in Table 1.
3. The pre-main sequence population and cluster properties
3.1. Extinction towards the cluster
We derive the extinction towards the cluster using the colors of the background stars, following the method outlined by Gutermuth et al. (2005) (see also Jose et al. 2016 for further details for our implementation). Briefly, after eliminating the foreground contribution, the line-of-sight extinction to each point on a 10′′ 10′′ grid is estimated by evaluating the mean and standard deviation of the colors of the 20 nearest stars to the grid point. An iterative outlier color algorithm is used to reject the colors more than 3 from the mean until the mean converges. The visual extinction map is generated assuming an average color of 0.2 mag for background stars and using the following relation, = 15.93, assuming the reddening law by Cardelli et al. (1989). We assume = 3.1, because Paper 1 shows that normal interstellar reddening law is applicable within the cluster.

The histogram distribution of extinction in -band within the cluster is shown in Fig. 2. The median extinction of the cluster is 2.0 mag with a standard deviation of 0.4 mag, is consistent with other extinction measurements towards the cluster (Paper I; Green et al. 2015; Marco & Negueruela 2016). The relatively low reddening variation within the cluster may be caused by the strong stellar winds of the massive stars around the cluster (Paper 1; Marco & Negueruela 2016). We use the extinction map to deredden the point sources for YSO selection (Section 3.2).
3.2. Identification of young stellar objects
In this section, we identify and classify the candidate Class I and Class II young stellar objects within Stock 8 based on their color excess in the , 3.6 and 4.5 m bands. We do not classify the diskless Class III sources because they are indistinguishable from the field stars in their IR colors. However, in Section 3.3, we estimate the probable statistics of the Class III population after removing the field star contaminants.
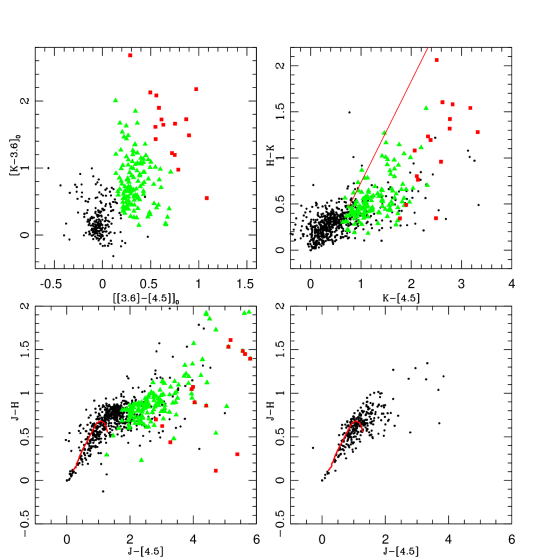
In the first step, we use the color excess in , , 3.6 and 4.5 m bands to identify the YSOs following the various color relations given by Gutermuth et al. (2009). We deredden the individual point sources based on their location on the extinction map (see Section 3.1) and using the extinction law of Flaherty et al. (2007). Within a 3′ radius, 150 candidate YSOs (133 Class II and 17 Class I) are identified. The dereddened vs color-color diagram is shown in Fig. 3, where the Class I and Class II sources are shown in red and green colors, respectively.
We next use a combination of , and 4.5 m bands to identify additional YSOs. Fig. 3 (top right panel) shows the vs color-color distribution of all sources detected along with the 150 candidate YSOs already identified. The reddening vector from the tip of the dwarf locus is also shown. Following the methods of Samal et al. (2014) and Jose et al. (2016), those sources with 0.65 mag and with an excess 3 (where is the average uncertainty in color) from the reddening vector are considered as YSOs (see Fig. 3 top right panel). These sources also satisfy the color-color criteria to identify the YSOs (i.e., 0.49 mag and 0.7 mag) given by Zeidler et al. (2015). We add 37 more YSOs to the list. Since most of these newly identified IR excess sources fall at the locations of the above Spitzer identified Class II YSOs, we consider them as Class IIs, although a few could be Class I YSOs. Thus our catalog includes a total of 187 candidate YSOs within 3′ radius of Stock 8, of which 147 are detected in and bands.
The bottom left panel of Fig. 3 shows the versus color-color diagram of the cluster region along with the candidate YSOs. The bottom right panel shows that of a nearby control field region, for an area equivalent to 3′ radius, located 15′ south-east to the cluster, well outside the cluster boundary and devoid of any -band nebulosity. A comparison of the color-color distribution of the candidate YSOs in the bottom left panel of Fig. 3 with that of the control field region shows that all the selected YSOs are likely IR excess sources. Since the intra-cluster reddening variation is negligible (see Section 3.1), the color excess of these YSOs is very unlikely to have any contribution from extinction within the cluster. A comparison of the cluster and control field color-color diagrams shows that 10% candidate YSOs overlap with the location of field stars, which can be considered as the contamination from various sources (e.g., AGB stars, galaxies etc.).
3.3. Field star decontamination and probable Class III statistics
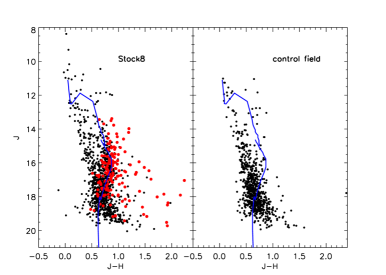
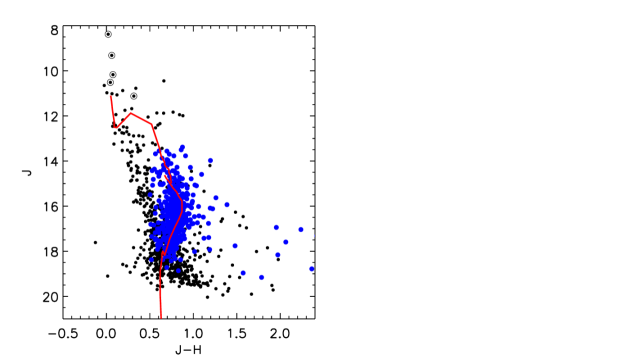
The left panel of Fig. 4 shows the color magnitude diagram (CMD) of the stars within 3′ radius of the cluster along with the pre-main sequence (PMS) isochrones of 3 Myr from Siess et al. (2000) ( 1.4 ) and Baraffe et al. (2015) ( 1.4 ). Candidate Class I/II YSOs identified in Section 3.2 are also overplotted in the figure. The right panel of Fig. 4 shows the distribution of sources within the control field region. A comparison of two figures shows that the sequence of stars seen on the left side in both figures is generally the field star population of the region and the extra sequence to the right is the locus of candidate pre-main sequence cluster members.
In the left panel of Fig. 4, the pre-main sequence is well defined by the YSOs and lies well separated from the MS/field star distribution of the cluster between 14-17 mag in . The pre-main sequence merges with the field star distribution at fainter levels. In order to study the circumstellar disk fraction or luminosity/mass function, field stars should be removed from the sample of stars in the cluster region. Without proper motion or spectroscopic data for the cluster, statistical subtraction of the control field from the cluster region is the only way to determine the member stars. Since the reddening towards Stock 8 and the control field is comparable, we assume that the same background stars exist in the cluster region as that in the control field. We statistically remove the expected background sources as follows. We first divide the space in to several grids of sizes 0.125 and 0.065 mag in the and axes both for the cluster and field CMDs. For any star in the CMD of the control field region, the nearest star in the cluster CMD within the same grid was considered as a field star and removed. By repeating this procedure for all sources in the CMD, we obtain the background subtracted sources in the target field and 700 sources are cleaned within 3′ radius. We repeat the process using two other control field regions located to the north-east and south-west of the cluster and the statistics of the field decontaminated CMD remains same within Poisson uncertainty. This statistical cleaning leaves 556 sources within 3′ radius, including the Class I/II/III population. In Section 3.2, we identified 187 candidate Class I/II sources, so there are approximately 369 (556-187) likely candidate Class III sources in the cluster.
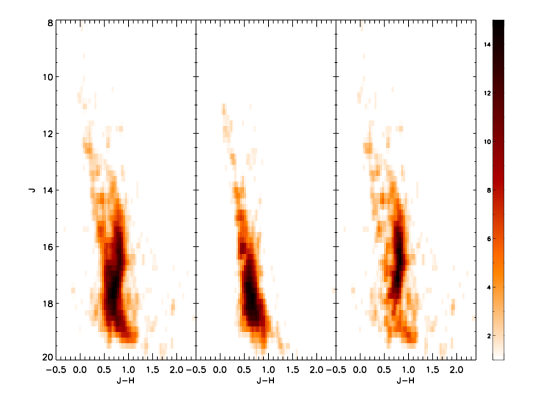
In order to study the spread of the pre-main sequence and field star population, in Fig. 5 we show Hess333A Hess diagram shows the relative density distribution of stars at different colour-magnitude bins on the HR diagram diagrams as a way to represent the stellar density distribution in axes. We bin the stars in the color and magnitude axis of the CMD and smooth the counts with a Gaussian kernel. Fig. 5 shows the Hess diagrams for the sources in the cluster region (left panel), the control field (middle panel), and the final result after the background elimination (right panel), respectively. Two sequences for the field and pre-main sequence population are evident in the left panel and majority of the field population have been removed in the field decontaminated CMD shown in the right panel.
4. HR diagram analysis : Ages and age spread of young stellar objects
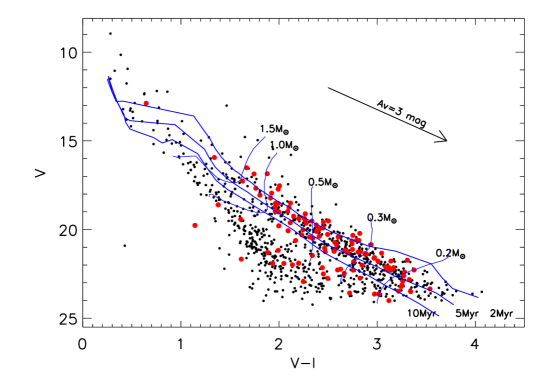
The distribution of YSOs on the optical CMD can be used to estimate their approximate age. The relatively low and constant reddening detected towards Stock 8 (Section 3.1) is an advantage to examine the position of YSOs on the CMD and to estimate their approximate age and mass based on the evolutionary models. Fig. 6 shows the CMD for sources within a 3′ radius of Stock 8. The candidate YSOs identified based on IR excess (see Section 3.2) are also superposed in the figure. A discontinuity in the stellar color distribution in the CMD separates the population of MS/field stars from one grouped at redder colors by 1–2 mag. Most candidate YSOs are located along the redder group of stars. The CMD shown in Fig. 6 is 2 mag fainter than those studied in Paper 1.
Cluster ages are generally inferred by fitting the distribution of young stellar population with pre-main sequence evolutionary model grids. The pre-main sequence isochrones of age 2, 5 and 10 Myr from Siess et al. (2000) are overplotted in Fig. 6 after correcting for the distance and minimum reddening (i.e., = 1.2 mag; Paper 1; Marco & Negueruela 2016) towards the cluster. Fig. 6 also shows the pre-main sequence evolutionary tracks for various masses. The YSOs are mostly distributed in the mass range between 0.2 - 1.5 .
In Fig. 6, other than the candidate YSOs, many sources are located above the pre-main sequence isochrone of 10 Myr. These sources are likely to be the candidate Class III sources that could not be selected in our YSO list based on IR excess. Fig. 7 shows the distribution of all those sources located above 10 Myr isochrone of Fig. 6 and 1.5 . These sources are mostly distributed along the pre-main sequence locus in Fig. 7, similar to the field-decontaminated CMD shown in Fig. 5. The statistics of those sources located above 10 Myr isochrone in Fig. 6 and above the optical completeness limit (mass 0.3 ) is similar to that of the field-decontaminated CMD in Fig. 5, within Poisson uncertainty. This shows that the statistics of the candidate Class III sources estimated in Section 3.3 is genuine.
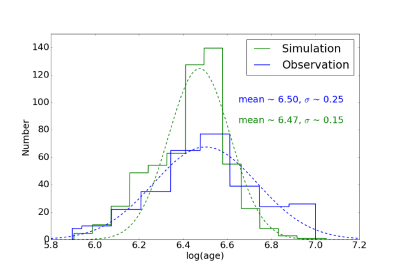
We estimate the age of the individual cluster members by comparing their locations on the CMD with the grid of pre-main sequence isochrones of ages 0.1 Myr to 10 Myr (Siess et al., 2000). Fig. 8 shows the histogram distribution of ages of all the sources in the range 1.5 – 0.3 M⊙ and located above the 10 Myr isochrone in the color-magnitude diagram (Fig. 6). The Gaussian fit to the distribution gives a mean log(age) 6.5 ( 3 Myr) and of 0.25 dex. The 1 age spread for Class I+II sources is 0.2 dex and that for Class III sources is 0.3 dex.
4.1. Age of the cluster from disk fraction
The fraction of circumstellar disk sources in a star forming region can be used as a proxy for its age estimation (e.g. Haisch et al. 2001; Hernández et al. 2008; Fang et al. 2013). In order to estimate the disk fraction of Stock 8, we use the field-decontaminated source list (see Section 3.3) as the total member stars (i.e., disked and disk-less) within the cluster. Our YSO survey is limited by the sensitivity of the IRAC observations i.e., 15 mag in 3.6 and 4.5 m bands (see Section 2.5). The corresponding photospheric brightness in -band is 16.5 mag. Hence we consider only those sources brighter than 16.5 mag in , for estimating the disk fraction, which corresponds to 0.4 at 3 Myr (Baraffe et al., 2015). Sources within the 1.5 - 0.4 mass range have a disk fraction of 35% in Stock 8. The average disk fraction versus age trend reported in the literature (e.g. Haisch et al. 2001; Hernández et al. 2008; Fang et al. 2012, 2013) in JHKL bands suggests, 50% of the stars in a given region should have lost their disks around 2-3 Myr. The age estimation based on disk fraction within Stock 8 is consistent with the photometrically derived age from the optical CMD analysis.
4.2. Probable causes of the apparent age spread
The age estimation of any star forming region is usually plagued with uncertainties (e.g. Hartmann 2001; Soderblom et al. 2014). In addition to the uncertainties in the input physics affecting the evolutionary models, various observational factors could cause an incorrect estimation of the age (or mass) of individual objects and inference of accurate star formation histories of molecular clouds (Hartmann, 2001; Slesnick et al., 2008). The typical sources of observational uncertainties include photometric errors, unresolved binaries, differential reddening, the modulation of spots, the obscuration by disk material and accretion (Stauffer et al. 2016). All of these effects produce broadening in the CMD, which could be misinterpreted as true age spread. Below we explain the apparent age spread in the cluster by generating a synthetic CMD and by broaden it with the individual factors, which can cause the major broadening in the CMD (i.e., Photometric uncertainty, differential reddening, binarity and variability). We generate a synthetic CMD using 10000 artificial pre-main sequence stars in the mass range of 0.3 to 1.5 with the models of Siess et al. (2000). The underlying IMF is assumed to be the Salpeter IMF (Salpeter, 1955). The age of the artificial stars is set to 3 Myr and an instantaneous star formation history is assumed, i.e. no spread in the age. The age spread due to individual factors is applied to the simulated CMD using Monte-Carlo simulations to estimate the effective spread in age.
Photometric uncertainty: The median value of photometric uncertainty within the completeness limit is 0.04 and 0.05 mag in and , respectively. This uncertainty is mainly caused by the PSF profile fitting and is random. We broaden the synthetic CMD with the above median values of photometric uncertainty and the corresponding age spread in log(age) is 0.09 dex.
Differential reddening: In Section 3.1, we derive the mean reddening of the cluster as 2 mag with a standard deviation of 0.4 mag in -band and 0.16 mag in . After broadening the CMD for a differential extinction of 0.4 mag in and 0.16 mag in , we obtain the corresponding age spread in log(age) as 0.07 dex.
Binarity: We generate binary stars based on the empirically derived relations for mass-dependent multiplicity fraction by Lu et al. (2013) and assuming a flat mass-ratio distribution. The standard deviation of the age spread in the synthetic CMD due to binarity is 0.13 dex.
Optical variability: Pre-main sequence stars can cause the spread in the observed CMD due to its variable nature. The variability in -band for classical T Tauri stars (CTTSs) can be as high as 3 mag, while for weak-line T Tauri stars (WTTSs) the variability is 0.6 mag (Herbst et al. 1994; Hennekemper et al. 2008). The main source of variability in WTTSs is the rotational modulation of cold spots. Majority of the pre-main sequence sources in Stock 8 are WTTSs. We broaden the synthetic CMD based on the rms distribution of -band variability observed in several hundreds of WTTSs by Venuti et al. (2015) and we obtain standard deviation of the age spread in the synthetic CMD 0.02 dex.
The synthetic CMD scaled to the number of observed YSOs and broadened by the above factors is shown in Fig. 8. The synthetic CMD has an apparent spread of 0.15 dex in log(age), whereas the observed age spread is 0.25 dex (Fig. 8). After quadratically subtracting the apparent age spread from the observed spread, we obtain the true age spread in the cluster as 0.2 dex in log(age). The mean age and age spread of Stock 8 is 6.5 0.2 dex or 3.16 (+1.85 - 1.16) Myr. The contribution from the true age spread due to star formation history of the cluster is comparable to other star forming regions such as W3-main (2-3 Myr; Bik et al. 2012) and NGC2264 (3-4 Myr; Lim et al. 2016). The luminosity spread corresponding to the 1 observed age spread at = 2.5 mag is 0.24 dex.
5. Luminosity function and initial mass function of Stock 8
In this section we use the cluster’s luminosity function to derive the initial mass function, which are the two fundamental parameters of a cluster to understand its formation. Based on the photometry completeness limits and age of the cluster, the mass detection limit is derived using pre-main sequence isochrones. Assuming the median age of the cluster 3 Myr, median extinction 2.0 mag (see Section 3.1), at a distance of 2.1 kpc, the photometric completeness limit of J=19 mag for the cluster (Section 2.5) corresponds to a mass limit of 0.05 (Baraffe et al. 2015). Considering the uncertainty in age estimation (Section 4), for the upper age limit of 5 Myr, the photometric completeness limit would raise the mass detection limit to 0.08 in -band.
The luminosity function is frequently used in studies of young clusters as a diagnostic tool of the mass function and the star formation history of their stellar populations (Lada & Lada 2003, and references therein). Pioneering work on the interpretation of the -band luminosity function (KLF) was presented by Zinnecker et al. (1993). Later, models of the -band luminosity function by Muench et al. (2000) showed its dependence on factors such as the cluster age, the spread of star formation over time, and the choice of theoretical pre-main sequence evolutionary tracks.

To derive the luminosity function, we use the -band photometry of the field star decontaminated (Section 3.3) data. From the right panel of Fig. 5, we derive a mean locus of the pre-main sequence stellar distribution in the plane, which traces the 3 Myr isochrone of Siess et al. (2000) (also see Fig. 4). To derive the luminosity function, we exclude a few sources which fall beyond 3 from the mean locus of distribution. These sources are most likely field stars, that were not removed due to the statistical uncertainty in our field star decontamination process.
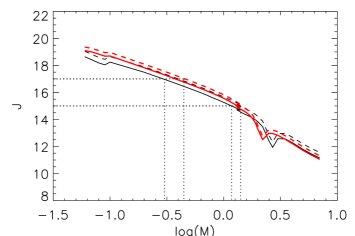
Fig. 9 shows the -band luminosity function of the cluster. The shape of the luminosity function appears remarkably similar to the well studied star forming regions such as Trapezium (Muench et al., 2002), NGC2024 (Spezzi et al., 2015), L1641 (Fang et al., 2012), RCW41 (Neichel et al., 2015), NGC6611 (Oliveira et al., 2009). For comparison, the -band luminosity function of Trapezium cluster from Muench et al. (2002) is over-plotted in Fig. 9, which shows a good match with Stock 8 up to 17.5 mag, beyond which it deviates. It may be due to improper field subtraction or completeness correction at faint level. In Fig. 9, the luminosity function peaks between 14.5–16.5 mag and below 16.5 mag the luminosity function steadily declines to the hydrogen burning limit.
The IMF is useful to understand the formation and evolution of stellar systems and the contribution of stellar mass to the host galaxy. In order to estimate the mass of the individual stars in the field star decontaminated CMD (see Fig. 5), the mass-magnitude relation from stellar evolutionary models of 3 Myr is used. For M 1.4 M⊙, the 3 Myr PMS isochrone of Baraffe et al. (2015) and for M 1.4 M⊙, Siess et al. (2000) models are used for mass-magnitude conversion (see Fig. 10). For younger ages ( 10 Myr), the pre-main sequence isochrones are almost vertical. The color change (in ) of the YSOs due to age variations within the age range of 3-5 Myr is minor since the effective temperature varies slowly. Since the reddening variation within the cluster is minimal, the above assumptions are reasonably valid to estimate the mass-magnitude relation. Fig. 10 also shows the error in the mass estimation from the mass-magnitude relation by incorporating the uncertainty in the cluster age ( 2 Myr) as well as the uncertainty in the values ( 0.4 mag). The typical uncertainty in log m is 0.15 dex.
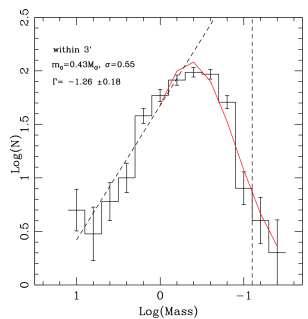
IMF is calculated using the mass-magnitude relation and by counting the number of stars in a logarithmic mass interval. The size of the IMF bin set to be log m = 0.2, which is comparable to the average uncertainty of mass estimation propagated from the assumed mass-magnitude relation (see Fig. 10). Fig. 11 (left panel) represents the mass distribution of Stock 8 within 3′ radius, which in general follows the shape of the Galactic field MF. We find that the IMF in Stock 8 rises Salpeter-like at high masses, consistent with many previous IMF estimations on young clusters (eg. NGC2264; Sung & Bessell 2010). The most massive bin has 5 sources, in agreement with the 5 early class stars identified within 3′ radius by Marco & Negueruela (2016). The IMF flattens out between 0.2 - 0.7 and then drops down to the brown dwarf regime. For 0.5 , Salpeter mass function is fit ( = ; Salpeter 1955), and is shown in Fig. 11. The value of the slope, , obtained ( = -1.26 0.18) agrees well with the canonical value (-1.35). We also fit the mass function with a log-normal distribution, exp(–), where, log m0 is the characteristic stellar mass (the mass at peak of the distribution) and is the spread in the log-normal distribution. The Galactic fieldmass function has a characteristic mass = 0.25 and = 0.55 (Chabrier, 2003). The derived log-normal functional fit to the low-mass stars (1.0 M⊙ M 0.08 M⊙) of Stock 8 (see Fig. 11 left panel) within 3′ radius yields a peak mass of = 0.43 .
In order to assess the effect of binning, the above analysis is repeated using different combinations of mass limits and shifting the mass bins in log m by 0.05 and 0.1 as well as for different bin sizes. The experiment is repeated for field-decontaminated data using two different control fields. From these experiments, the difference obtained in the value of is 0.25 dex. The characteristic stellar mass varies within 0.2 , comparable to the uncertainty limits. The choice of various evolutionary models can affect the mass-luminosity relations and thus the form of IMF. Use PARSEC models (Bressan et al. 2012; Chen et al. 2014) instead of Siess et al. (2000) models, yields a similar slope and characteristic mass. In conclusion, for 0.5 within Stock 8, the mass function follows a power law with slope similar to the Salpeter slope and the characteristic stellar mass appears to be robustly constrained around 0.4 M⊙.
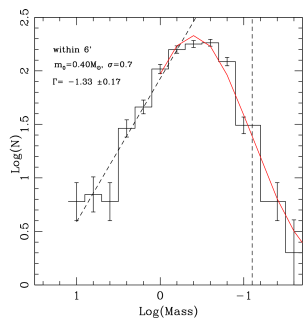
Our optical and IRAC photometric survey is limited to 3′ radius around Stock 8, however, the cluster spans a radius of 6′ (Paper 1). We also calculate the IMF using NIR data for the entire cluster radius. After field star decontamination, we obtain 952 probable cluster members. The mass function within 6′ radius is shown in the right panel of Fig. 11. The slope of the power law above 0.5 as well as the characteristic stellar mass remains same as that of 3′ radius.
6. Discussion
The low-mass regime of the IMF has been the subject of numerous observational and theoretical studies over the past decade (see Offner et al. 2014). The higher mass stars mostly follow the Salpeter mass function (Salpeter, 1955). At lower masses, the IMF is less well constrained, but appears to flatten below 1 M⊙ and exhibits a turnover between 0.1 - 0.7 M⊙, with fewer stars of the lowest masses (Kroupa 2002; Chabrier 2003). While the higher mass domain is thought to be mostly formed through fragmentation and/or accretion onto the protostellar core (e.g., Padoan & Nordlund 2002; Bonnell & Bate 2006), in the low-mass and substellar regime additional physics is likely to play an important role. The density, velocity fields, chemical composition, tidal forces in the natal molecular clouds and photo erosion in the radiation field of bright stars in the vicinity can lead to different star formation processes and consequently some variation in the IMF (Bate & Bonnell 2005; Bate 2009; Padoan & Nordlund 2002; Whitworth & Zinnecker 2004). The characteristic mass is observed to be essentially constant for most star forming regions (see review by Elmegreen et al. 2008). However, numerical simulations relate the characteristic mass to the thermal Jeans mass, and hence variation with respect to environment is expected (Bate & Bonnell, 2005).
In general, the IMF of Stock 8 is consistent with that of other well studied young clusters such as IC348, the Trapezium, NGC2264, NGC 6611 and W3-main. (Muench et al. 2003; Luhman et al. 2000; Sung & Bessell 2010; Oliveira et al. 2009; Ojha et al. 2009). Within uncertainties, the peak mass of IMF for Stock 8 ( 0.4 M⊙) is comparable to that of majority of young clusters such as IC348, NGC 6611 and RCW 41 (Luhman et al. 2003; Oliveira et al. 2009; Neichel et al. 2015).
The total mass of the cluster is 362 M⊙ and 583 M⊙ within 3′ and 6′, respectively, after integrating the IMF within the mass range 10 – 0.08 M⊙. Even though we do not include brown dwarfs, their contribution to the total mass of the cluster should be negligible. Stock 8 falls in the category of moderately massive cluster (102 103 ) in the classification scheme of Weidner et al. (2010). Recently, Pfalzner et al. (2016) found a correlation between the cluster mass, size and stellar mass using the clusters within the solar neighbourhood ( =, with = 1.7 0.2), which gives constraints for the theory of clustered star formation. The mass estimate within the effective radius of Stock 8 follows the above relation and is comparable to the nearby well known young clusters (Kuhn et al. 2014; Pfalzner et al. 2016).
6.1. Large scale structure around Stock 8
Stock 8 is surrounded by 33 early type stars ( B3 V) within a 24 pc of its radius (Marco & Negueruela, 2016). Kang et al. (2012) studied high-velocity Hi gas at l 173∘ with the Arecibo 305-m telescope (beam 3.4′). The high velocity Hi emission features are confined inside the radio continuum filaments of a giant shell associated with the Hii complex G173+1.5, (which is composed of five Sharpless Hii regions, S231-235 at its peripheries). The giant shell is spatially correlated with Stock 8 and associated Hii region Sh2-234, which are located at the southern boundary of the shell. Kang et al. (2012) estimated the expansion velocity of the shell as 55 km s-1 and kinetic energy of the shell as 2.5 1050 ergs for the assumed distance of 1.8 kpc. The hard X-ray emitting hot gas inside the shell has thermal energy of 3 1050 ergs. Kang et al. (2012) argue that the large kinetic energy, high expansion velocity and hard X-ray emitting hot gas implies a supernova origin of the shell. The scenario proposed is that the supernova expansion could have triggered the formation of the OB stars currently exciting the Hii regions. Using trigonometric parallaxes for water masers in massive star-forming regions, Choi et al. (2014) identified a cluster close to Stock 8 (IRAS 05168+3634) with a parallax distance of 1.9 kpc and a radial velocity of = -15.5 1.9 km s-1 (Sakai et al., 2012). These values are consistent with the measured for the S231-235 Hii complex (Kang et al., 2012). The Hii complex S231-235 including Stock 8 shares the same radial velocity and are likely located in the Perseus Arm (Choi et al., 2014).
Fig. 12 (right) shows the large scale structure around Stock 8, a large, irregular cavity at 350 m (rough boundary is marked with a green circle) with little dust inside. Stock 8 is located at its southern periphery. Fig. 12 (left) shows the environment in the immediate vicinity of Stock 8 at optical (DSS2-R; blue), 12 m (WISE W2-band; green) and 22 m (WISE W4-band; red). The early type stars identified by Marco & Negueruela (2016) as well as from SIMBAD are marked in Fig. 12. In Fig. 12, PAH emissions, which are excited by UV photons from the massive star(s), are present at the interface between the molecular and neutral gas. PAHs are absent in the interior of the shell due to destruction of these molecules by intense UV radiation (Pomarès et al., 2009). The early type massive stars located around Stock 8 should be responsible for this 12 m cavity. The irregular nature of the large cavity could be caused by the combination of an inhomogeneous medium, presence of multiple OB stars, proper motion of the stars and projection effect along the line of sight.
In Fig. 12, many ‘pillar-like’ or ‘elephant trunk’ structures are projected inwards from the bubble walls towards the OB-stars. Their heads point towards the bubble, and filamentary tails lead away from the head. High-resolution observations and simulations have shown that these structures result from the effect of radiation feedback on turbulent molecular cloud (Gritschneder et al. 2010; Jose et al. 2013; McLeod et al. 2015, 2016; Schneider et al. 2016; Sharma et al. 2016). Gravitational collapse occurs at the tip of the pillars, leading to the formation of cores and low mass stars (Gritschneder et al. 2009, 2010; Deharveng et al. 2012; Chauhan et al. 2011).
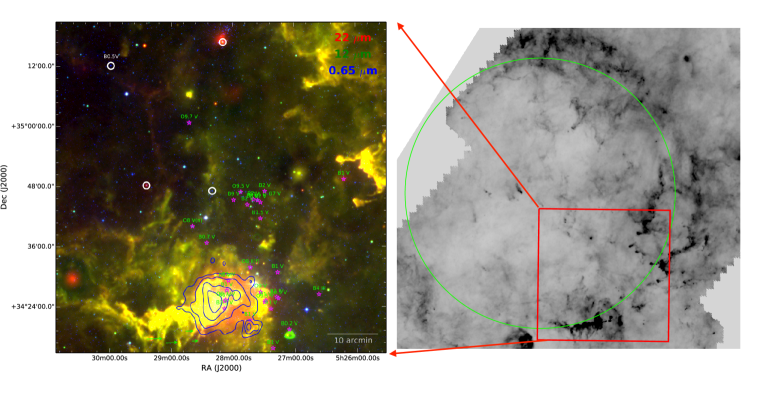
Stock 8 is located at the southern boundary of the cavity. Expanding super-bubbles may provide an efficient mechanism to compress the low density ISM or pre-existing filaments into dense shells that become gravitationally unstable and form stars. The evidence that Stock 8 and its associated nebulous stream (see Paper 1 for a discussion) is being compressed can be seen from the sharp decline of 12 m emission at the inner edge of the bubble and from the presence of elongated striations (marked using green arrows in Fig. 12) with their head pointing towards the center of the bubble. Newly formed OB stars (up to a few Myr old), generally associated with strong radio and 24 m emission, as found in several Galactic Hii regions (e.g., Deharveng et al. 2010; Jose et al. 2013; Samal et al. 2014; Deharveng et al. 2015). In Fig. 12, we find that the WISE W4 band (22 m) emission from warm dust is strongest in the vicinity of OB stars associated with the cluster Stock 8. Similarly, in the CGPS catalog of extended radio sources (Kerton et al., 2007) as well as in the NVSS 1.4 GHz survey (Condon et al., 1998), only Stock 8 is found to be associated with the radio continuum free-free emission (see Fig. 12). These results suggest that the Hii region (Sh2-234) associated with Stock 8 is likely younger than the surrounding massive stars.
6.2. Radiation field around Stock 8
Stock 8 is located in the harsh environment of an expanding bubble and pool of older OB stars which may have a considerable effect on the structure of the molecular material around it. We measure the total EUV flux reaching at the center of Stock 8 from the Lyman continuum photons emitted per second from the massive stars around the cluster. We obtained the number of ionizing photons for O8-B3V spectral types from Martins et al. (2005) and Panagia (1973). The total flux is estimated using the projected distance between each massive star to the cluster center and is 5 1011 photons/s/cm-2. Here we ignore the possible attenuation by diffuse gas and blocking by molecular clumps and also the uncertainty due to the use of projected distance. The total FUV flux reaching at the center of Stock 8 is measured in terms of the Habing flux G0 (equal to 1.6 10-3 erg cm-2s-1) and is 3 104 . The FUV strength is much higher than the average interstellar radiation field (i.e., 1.7 ; Habing 1968).
The kinetic energy of the expanding shell is 3 1050 erg (Kang et al., 2012). In the absence of any high resolution molecular observations towards the region, we use the low resolution 12CO map by Leisawitz et al. (1989) to roughly measure the internal kinetic energy (, 1/2 ) of the molecular cloud associated with Stock 8 and nebular region (mass 3.4 103 M⊙; resolution 8′.7; Leisawitz et al. 1989), where represents the turbulence due to internal random motions in the molecular cloud. is calculated using the Larson’s relations (Larson, 1981), for the effective radius of the cloud 20 pc. The of the cloud is estimated to be 4 1047 ergs, which is lower than the kinetic energy of the expanding shell.
The above analysis shows that the external environment might be expected to have an impact on the structure of the molecular cloud around Stock 8. However, our analysis on the low mass regime of the IMF of Stock 8 shows that there is no strong evidence for a difference in the underlying IMF between Stock 8 and other resolved star forming regions and the Galactic field. These results likely suggest that the role of external feedback has only a weak role in the shape of IMF and star formation process in Stock 8.
7. Summary
Stock 8 is a young cluster associated with the Hii region Sh2-234, and located at the edge of an expanding giant shell. In this study, we analysed the stellar content and star formation history of the cluster using a sensitive , -band ( 24 mag) optical photometry, complemented with the UKIDSS- and 3.6, 4.5 m Spitzer-IRAC photometry. The optical CMD extends to substantially fainter magnitudes than previous studies, sampling much of the main sequence as well as pre-main sequence objects and the NIR CMD extends to masses as low as 0.08 . Using near and mid-infrared photometry, we obtain the census of the young stellar population and their characteristics within 3′ radius of the cluster, which includes 187 candidate Class I and Class II YSOs. The fraction of sources having circumstellar disk is 35% in the mass range 1.5-0.4 . Both optical and NIR color-magnitude diagrams show a well defined sequence of young stellar objects. From the optical color-magnitude diagram analysis using evolutionary models of various ages by Siess et al. (2000), we obtain a median log(age) of 6.5 ( 3.0 Myr) with an age spread of 0.25 dex for the cluster. Through Monte Carlo simulations we quantify the effective broadening in the synthetic color-magnitude diagrams ( 0.15 dex) by various factors which causes the age spread. The intrinsic age spread ( 0.2 dex) evident from the color-magnitude diagram analysis is comparable to the other star forming regions.
The -band luminosity function of Stock 8 after field star decontamination and completeness correction shows a broad peak between 14.5 and 16.5 mag and steadily declines to fainter, less-massive objects. The -band luminosity function of Stock 8 is comparable to that of the Trapezium cluster. IMF of Stock 8 is well described by a log-normal distribution with a characteristic mass (=0.4M⊙), which is comparable with those found in other well studied nearby regions. Above 0.5M⊙, the IMF is well consistent with the Salpeter slope. Though Stock 8 is surrounded by several massive stars, we conclude that there seems to be no severe environmental effect in the form of IMF due to the proximity of the massive stars.
References
- Baraffe et al. (2015) Baraffe, I., Homeier, D., Allard, F., & Chabrier, G. 2015, A&A, 577, A42
- Bastian et al. (2010) Bastian, N., Covey, K. R., & Meyer, M. R. 2010, ARA&A, 48, 339
- Bate (2009) Bate, M. R. 2009, MNRAS, 392, 1363
- Bate & Bonnell (2005) Bate, M. R., & Bonnell, I. A. 2005, MNRAS, 356, 1201
- Bik et al. (2012) Bik, A., Henning, T., Stolte, A., et al. 2012, ApJ, 744, 87
- Bonnell & Bate (2006) Bonnell, I. A., & Bate, M. R. 2006, MNRAS, 370, 488
- Bressan et al. (2012) Bressan, A., Marigo, P., Girardi, L., et al. 2012, MNRAS, 427, 127
- Cardelli et al. (1989) Cardelli, J. A., Clayton, G. C., & Mathis, J. S. 1989, ApJ, 345, 245
- Casali et al. (2007) Casali, M., Adamson, A., Alves de Oliveira, C., et al. 2007, A&A, 467, 777
- Chabrier (2003) Chabrier, G. 2003, PASP, 115, 763
- Chauhan et al. (2011) Chauhan, N., Ogura, K., Pandey, A. K., Samal, M. R., & Bhatt, B. C. 2011, PASJ, 63, 795
- Chen et al. (2014) Chen, Y., Girardi, L., Bressan, A., et al. 2014, MNRAS, 444, 2525
- Choi et al. (2014) Choi, Y. K., Hachisuka, K., Reid, M. J., et al. 2014, ApJ, 790, 99
- Condon et al. (1998) Condon, J. J., Cotton, W. D., Greisen, E. W., et al. 1998, AJ, 115, 1693
- Deharveng et al. (2010) Deharveng, L., Schuller, F., Anderson, L. D., et al. 2010, A&A, 523, A6
- Deharveng et al. (2012) Deharveng, L., Zavagno, A., Anderson, L. D., et al. 2012, A&A, 546, A74
- Deharveng et al. (2015) Deharveng, L., Zavagno, A., Samal, M. R., et al. 2015, A&A, 582, A1
- Dib (2014) Dib, S. 2014, MNRAS, 444, 1957
- Dye et al. (2006) Dye, S., Warren, S. J., Hambly, N. C., et al. 2006, MNRAS, 372, 1227
- Elmegreen et al. (2008) Elmegreen, B. G., Klessen, R. S., & Wilson, C. D. 2008, ApJ, 681, 365
- Fang et al. (2013) Fang, M., Kim, J. S., van Boekel, R., et al. 2013, ApJS, 207, 5
- Fang et al. (2012) Fang, M., van Boekel, R., King, R. R., et al. 2012, A&A, 539, A119
- Flaherty et al. (2007) Flaherty, K. M., Pipher, J. L., Megeath, S. T., et al. 2007, ApJ, 663, 1069
- Foster & Brunt (2015) Foster, T., & Brunt, C. M. 2015, AJ, 150, 147
- Green et al. (2015) Green, G. M., Schlafly, E. F., Finkbeiner, D. P., et al. 2015, ApJ, 810, 25
- Gritschneder et al. (2010) Gritschneder, M., Burkert, A., Naab, T., & Walch, S. 2010, ApJ, 723, 971
- Gritschneder et al. (2009) Gritschneder, M., Naab, T., Walch, S., Burkert, A., & Heitsch, F. 2009, ApJ, 694, L26
- Gutermuth et al. (2009) Gutermuth, R. A., Megeath, S. T., Myers, P. C., et al. 2009, ApJS, 184, 18
- Gutermuth et al. (2005) Gutermuth, R. A., Megeath, S. T., Pipher, J. L., et al. 2005, ApJ, 632, 397
- Habing (1968) Habing, H. J. 1968, Bull. Astron. Inst. Netherlands, 19, 421
- Haisch et al. (2001) Haisch, Jr., K. E., Lada, E. A., & Lada, C. J. 2001, ApJ, 553, L153
- Hartmann (2001) Hartmann, L. 2001, AJ, 121, 1030
- Hennekemper et al. (2008) Hennekemper, E., Gouliermis, D. A., Henning, T., Brandner, W., & Dolphin, A. E. 2008, ApJ, 672, 914
- Herbst et al. (1994) Herbst, W., Herbst, D. K., Grossman, E. J., & Weinstein, D. 1994, AJ, 108, 1906
- Hernández et al. (2008) Hernández, J., Hartmann, L., Calvet, N., et al. 2008, ApJ, 686, 1195
- Hodgkin et al. (2009) Hodgkin, S. T., Irwin, M. J., Hewett, P. C., & Warren, S. J. 2009, MNRAS, 394, 675
- Hou & Han (2014) Hou, L. G., & Han, J. L. 2014, A&A, 569, A125
- Jose et al. (2016) Jose, J., Kim, J. S., Herczeg, G. J., et al. 2016, ApJ, 822, 49
- Jose et al. (2008) Jose, J., Pandey, A. K., Ojha, D. K., et al. 2008, MNRAS, 384, 1675
- Jose et al. (2013) Jose, J., Pandey, A. K., Samal, M. R., et al. 2013, MNRAS, 432, 3445
- Kang et al. (2012) Kang, J.-h., Koo, B.-C., & Salter, C. 2012, AJ, 143, 75
- Kerton et al. (2007) Kerton, C. R., Murphy, J., & Patterson, J. 2007, MNRAS, 379, 289
- Kharchenko et al. (2013) Kharchenko, N. V., Piskunov, A. E., Schilbach, E., Röser, S., & Scholz, R.-D. 2013, A&A, 558, A53
- Kroupa (2002) Kroupa, P. 2002, Science, 295, 82
- Krumholz et al. (2012) Krumholz, M. R., Klein, R. I., & McKee, C. F. 2012, ApJ, 754, 71
- Kuhn et al. (2014) Kuhn, M. A., Feigelson, E. D., Getman, K. V., et al. 2014, ApJ, 787, 107
- Lada & Lada (2003) Lada, C. J., & Lada, E. A. 2003, ARA&A, 41, 57
- Larson (1981) Larson, R. B. 1981, MNRAS, 194, 809
- Leisawitz et al. (1989) Leisawitz, D., Bash, F. N., & Thaddeus, P. 1989, ApJS, 70, 731
- Lim et al. (2016) Lim, B., Sung, H., Kim, J. S., et al. 2016, ApJ, 831, 116
- Lu et al. (2013) Lu, J. R., Do, T., Ghez, A. M., et al. 2013, ApJ, 764, 155
- Lucas et al. (2008) Lucas, P. W., Hoare, M. G., Longmore, A., et al. 2008, MNRAS, 391, 136
- Luhman (2012) Luhman, K. L. 2012, ARA&A, 50, 65
- Luhman et al. (2000) Luhman, K. L., Rieke, G. H., Young, E. T., et al. 2000, ApJ, 540, 1016
- Luhman et al. (2003) Luhman, K. L., Stauffer, J. R., Muench, A. A., et al. 2003, ApJ, 593, 1093
- Marco & Negueruela (2016) Marco, A., & Negueruela, I. 2016, MNRAS, 459, 880
- Martins et al. (2005) Martins, F., Schaerer, D., & Hillier, D. J. 2005, A&A, 436, 1049
- McLeod et al. (2015) McLeod, A. F., Dale, J. E., Ginsburg, A., et al. 2015, MNRAS, 450, 1057
- McLeod et al. (2016) McLeod, A. F., Gritschneder, M., Dale, J. E., et al. 2016, MNRAS, 462, 3537
- Muench et al. (2000) Muench, A. A., Lada, E. A., & Lada, C. J. 2000, ApJ, 533, 358
- Muench et al. (2002) Muench, A. A., Lada, E. A., Lada, C. J., & Alves, J. 2002, ApJ, 573, 366
- Muench et al. (2003) Muench, A. A., Lada, E. A., Lada, C. J., et al. 2003, AJ, 125, 2029
- Neichel et al. (2015) Neichel, B., Samal, M. R., Plana, H., et al. 2015, A&A, 576, A110
- Offner et al. (2014) Offner, S. S. R., Clark, P. C., Hennebelle, P., et al. 2014, Protostars and Planets VI, 53
- Ojha et al. (2009) Ojha, D. K., Tamura, M., Nakajima, Y., et al. 2009, ApJ, 693, 634
- Ojha et al. (2011) Ojha, D. K., Samal, M. R., Pandey, A. K., et al. 2011, ApJ, 738, 156
- Oliveira et al. (2009) Oliveira, J. M., Jeffries, R. D., & van Loon, J. T. 2009, MNRAS, 392, 1034
- Padoan & Nordlund (2002) Padoan, P., & Nordlund, Å. 2002, ApJ, 576, 870
- Panagia (1973) Panagia, N. 1973, AJ, 78, 929
- Pandey et al. (2013) Pandey, A. K., Eswaraiah, C., Sharma, S., et al. 2013, ApJ, 764, 172
- Panwar et al. (2014) Panwar, N., Chen, W. P., Pandey, A. K., et al. 2014, MNRAS, 443, 1614
- Pecaut & Mamajek (2013) Pecaut, M. J., & Mamajek, E. E. 2013, ApJS, 208, 9
- Pfalzner et al. (2016) Pfalzner, S., Kirk, H., Sills, A., et al. 2016, A&A, 586, A68
- Pomarès et al. (2009) Pomarès, M., Zavagno, A., Deharveng, L., et al. 2009, A&A, 494, 987
- Sakai et al. (2012) Sakai, N., Honma, M., Nakanishi, H., et al. 2012, PASJ, 64, arXiv:1204.4782
- Salpeter (1955) Salpeter, E. E. 1955, ApJ, 121, 161
- Samal et al. (2014) Samal, M. R., Zavagno, A., Deharveng, L., et al. 2014, A&A, 566, A122
- Schneider et al. (2016) Schneider, N., Bontemps, S., Motte, F., et al. 2016, A&A, 591, A40
- Sharma et al. (2016) Sharma, S., Pandey, A. K., Borissova, J., et al. 2016, AJ, 151, 126
- Sicilia-Aguilar et al. (2014) Sicilia-Aguilar, A., Roccatagliata, V., Getman, K., et al. 2014, A&A, 562, A131
- Siess et al. (2000) Siess, L., Dufour, E., & Forestini, M. 2000, A&A, 358, 593
- Slesnick et al. (2008) Slesnick, C. L., Hillenbrand, L. A., & Carpenter, J. M. 2008, ApJ, 688, 377
- Soderblom et al. (2014) Soderblom, D. R., Hillenbrand, L. A., Jeffries, R. D., Mamajek, E. E., & Naylor, T. 2014, Protostars and Planets VI, 219
- Spezzi et al. (2015) Spezzi, L., Petr-Gotzens, M. G., Alcalá, J. M., et al. 2015, ArXiv e-prints, arXiv:1505.04631
- Sung & Bessell (2010) Sung, H., & Bessell, M. S. 2010, AJ, 140, 2070
- Taylor et al. (2003) Taylor, A. R., Gibson, S. J., Peracaula, M., et al. 2003, AJ, 125, 3145
- van Dokkum & Conroy (2010) van Dokkum, P. G., & Conroy, C. 2010, Nature, 468, 940
- Venuti et al. (2015) Venuti, L., Bouvier, J., Irwin, J., et al. 2015, A&A, 581, A66
- Weidner et al. (2010) Weidner, C., Kroupa, P., & Bonnell, I. A. D. 2010, MNRAS, 401, 275
- Whitworth & Zinnecker (2004) Whitworth, A. P., & Zinnecker, H. 2004, A&A, 427, 299
- Zeidler et al. (2015) Zeidler, P., Preibisch, T., Ratzka, T., Roccatagliata, V., & Petr-Gotzens, M. G. 2015, ArXiv e-prints, arXiv:1510.01631
- Zinnecker et al. (1993) Zinnecker, H., McCaughrean, M. J., & Wilking, B. A. 1993, in Protostars and Planets III, ed. E. H. Levy & J. I. Lunine, 429–495