On the Redshifts of the BL Lac 3FGL J0909.0+2310 and its Close Companion
Abstract
We report on the redshift of the BL Lac object 3FGL J0909.0+2310 based on observations obtained with the OSIRIS Multi Object Spectrograph (MOS) mounted on the 10.4-m Gran Telescopio Canarias. A redshift of 0.4320.002 was obtained by the identification of three absorption features (Ca II K&H and G-band) detected in the spectrum of the BL Lac host galaxy. The closest object to the BL Lac at an angular separation of 3.8″(21 kpc at this distance) has a similar redshift of 0.4310.002. This companion galaxy could be the most likely cause of the nuclear activity as postulated by studies based on more extended data sets and cosmological models. MOS allows us to study the object’s neighbourhood within a field of view of approximately 7’2’ and we find two small groups of galaxies at redshifts 0.28 and 0.39 which are probably not related to the activity of 3FGL J0909.0+2310.
keywords:
BL Lacertae objects: individual: 3FGL J0909.0+2310 – galaxies: distances and redshifts1 Introduction
Blazars, in particular BL Lac objects (see Falomo, Pian, & Treves, 2014, for a recent review), are described as extreme active galactic nuclei (AGN) in which the relativistic jets originating close to the central massive black hole (BH) are pointing directly to the observer (Blandford & Rees, 1978). The highly beamed energy released by the central BH across the entire electromagnetic spectrum makes them visible at large distances, but at the same time dilutes severely any spectral feature from its host galaxy (León-Tavares et al., 2011; Furniss et al., 2013). Shaw et al. (2013) recently compiled the largest sample of -ray selected BL Lac objects (BLLs) with spectroscopic redshifts. They used literature data and their own observations in 4 and 10 meter class telescopes resulting in successful redshift measurements for only 44% of the 475 studied BLLs.
3FGL J0909.0+2310, also named SDSS J090900.62+231112.9, (3FGL J0909 hereafter) was first detected by the NRAO Green Bank telescope (Becker, White, & Edwards, 1991) and classified as a radio-loud AGN by Brinkmann et al. (1997). The classification as a BL Lac comes from high angular resolution radio images obtained with the VLA of targets with detection in both the NRAO Green Bank telescope and the ROSAT All-Sky Survey (Laurent-Muehleisen et al., 1997). First attempts to obtain the redshift of 3FGL J0909 are from Allen et al. (2011) who, applying a non-negative matrix factorisation method to the SDSS spectrum, estimated . Aliu et al. (2012) and Shaw et al. (2013) proposed a lower limit of based on the detection of the 2800 Å MgII doublet in the SDSS spectrum which could be either intrinsic, or due to the presence of absorbers in the line of sight.
3FGL J0909 appears in gamma rays in the First Catalog of point sources detected by the Fermi Large Area Telescope (1FGL, Abdo et al., 2010) with a flux in the 100 MeV to 100 GeV range of erg s-1cm-2. It is also listed in the second (2FGL, Nolan et al., 2012) and third (3FGL, Acero et al., 2015) Fermi releases with fluxes of and erg s-1cm-2 respectively. These observations report a hard power law () spectral index of . The object is included in the First Fermi-LAT Catalog of Sources above 10 GeV (1FHL, Ackermann et al., 2013), with a flux of erg s-1cm-2 and a spectral index in the 10-500 GeV energy range of . Sources with hard spectral index and detected by Fermi above 10 GeV are targets of interest for follow up studies at very high energies (VHE; E GeV). In particular 3FGL J0909 has been observed by the imaging Cherenkov telescopes VERITAS but only upper limits to the fluxes in the TeV regime were obtained even after 14.2 hours of observation (Aliu et al., 2012). At high energies the spectral energy distribution (SED) is severely affected by the diffuse extra–galactic background light and the appropriate corrections to recover the intrinsic spectral shape must be applied (e.g. Franceschini, Rodighiero, & Vaccari, 2008; Domínguez et al., 2011), before the SED can be compared with theoretical emission models (e.g. Dermer & Schlickeiser, 1993; Böttcher et al., 2013). In all these studies a precise measurement of the redshift is required. It is generally assumed that BL Lac nuclei are hosted by luminous elliptical galaxies embedded in small groups of galaxies (e.g. Falomo, Melnick, & Tanzi, 1990; Urry et al., 2000). The presence of a close companion is usually presented as the cause of the activation of the central engine (e.g. Hopkins et al., 2008) however, Hubble Space Telescope observations of a large sample of BL Lac objects have shown than only around 50% of them have a nearby companion finding also truly isolated BL Lac (Urry et al., 2000).
Most of the previous studies on BL Lac environment have been performed using photometric redshifts and only in a few cases (e.g. Lietzen et al., 2008; Farina et al., 2016) the environment have been characterized with spectroscopic redshifts. In this paper we report on the distance and environment of 3FGL J0909 obtained by making use of spectroscopic redshifts gathered with the Gran Telescopio Canarias (GTC) 111Gran Telescopio Canarias is a Spanish initiative with the participation of Mexico and the US University of Florida, and is in- stalled at the Roque de los Muchachos in the island of La Palma..
Throughout this paper, we assume a flat cold dark matter cosmology with =0.3 and H0=70 km s-1 Mpc-1.
2 Observations and Data Reduction
The observations were performed using the OSIRIS Multi Object Spectrograph (MOS) installed in the Nasmyth-B focus of the 10.4-m GTC under the program GTC5-15BMEX (PI DRG). The observations were carried out in service mode, using the R1000R grism. The spectrum is centred at 7430 Å covering the range from 5100 to 10000 Å at a resolution of 2.62 Å/pixel which translates to an effective resolution measured on strong sky lines of 10.86 Å. Targets are located at different positions along the dispersion axis, changing the actual wavelength coverage; the common wavelength range covered by all spectra is 5400–9500 Å.
The total observing time was divided in two observing blocks (OB) that were observed on February 6th 2016. Each OB consisted of 3 exposures of 1310 seconds on target to facilitate later removal of cosmic ray hits. The two OBs were accompanied by a common set of ancillary files that included observations of G191–B2B as a standard star, bias, flat-field and arc lamps. Both OBs were observed with air masses lower than 1.12 under cloud coverage and a seeing of 0.9″.
The data reduction was carried out by using a new MOS pipeline described in Gómez-González, Mayya, & Rosa-González (2016). In short, the code reduces every MOS slit by applying the usual IRAF scripts for long slit spectra. To reduce the data, the three different target images were corrected by bias independently. Then we stacked them to obtain a single spectral image where the cosmic rays were successfully removed. After that, every slitlet spectrum was calibrated in wavelength by using as a reference a He+Ne+Ar arc image. The dispersion solution is obtained for every single slitlet and in all the cases rms errors lower than 0.4 Å were found. This uncertainty produces a systematic error in the redshift calculations of at a wavelength of 5000Å.
Finally the image is calibrated in flux by using a sensitivity curve obtained by the observation of G191–B2B. The output of the pipeline is a 2-D spectral image calibrated both in wavelength and flux. The final signal to noise ratio around 7000Å for a point source of 21 mag. (e.g. MOS-35), was of around 28 in agreement with the values given by the GTC exposure time calculator for a single OB.
After analyzing independently the two OBs we noticed that – probably due to cloud coverage – one of them had about 40% less counts per second than the other. The poor signal to noise of this latter dataset did not allow us to search for weak absorption lines and we do not use it in the following analysis.
MOS allows us to obtain the spectra of several objects within an effective field of view (FOV) of around 7. Excluding the stars used as astrometric guides, within the MOS field of view we found 71 targets brighter than 22. We selected our targets based on the SDSS images centred at the position of 3FGL J0909. Fifty three of the selected targets are classified as galaxies by SDSS, 4 of them are unclassified (including 3FGL J0909), and the remaining 14 are classified as stars.
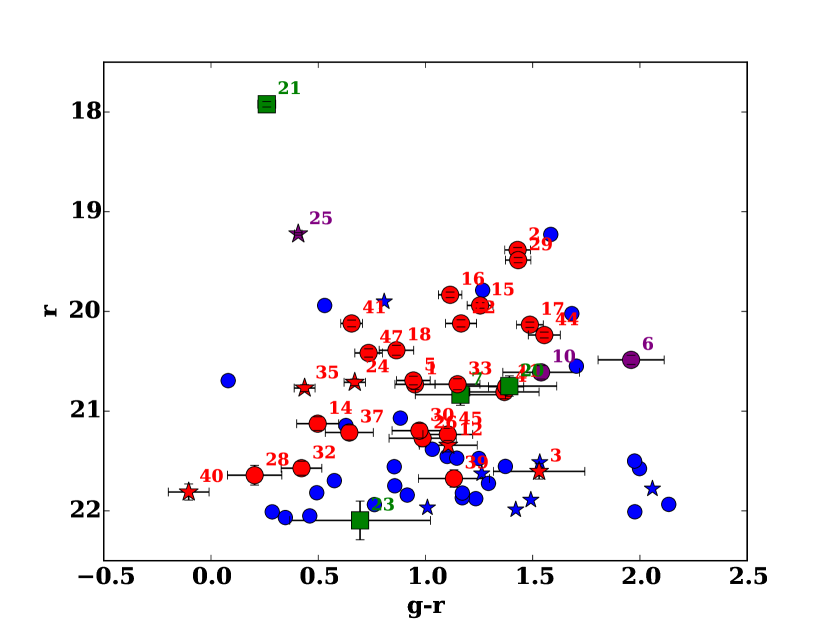
Given the nature of our program, where we do not know the redshift of the source, the host galaxy morphological type, or other extra information about the surroundings, we tried to cover as many objects as possible in the OSIRIS field of view taking care of the physical limitations of the mask making procedure, giving preference to those objects classified as galaxies. Notice that some objects classified as stars could be distant galaxies, and in fact objects classified as stars by SDSS, covered by slits 25 and 35, turned out to be galaxies at and respectively (see Table 2). The colour magnitude diagram (CMD, Fig. 1) shows the location of the SDSS targets where we differentiate stars from galaxies and we marked those objects selected for spectroscopy. We cover most of the parameter space in the CMD where for SDSS galaxies brighter than =21.5 we obtain spectroscopic redshift for 60% of them.
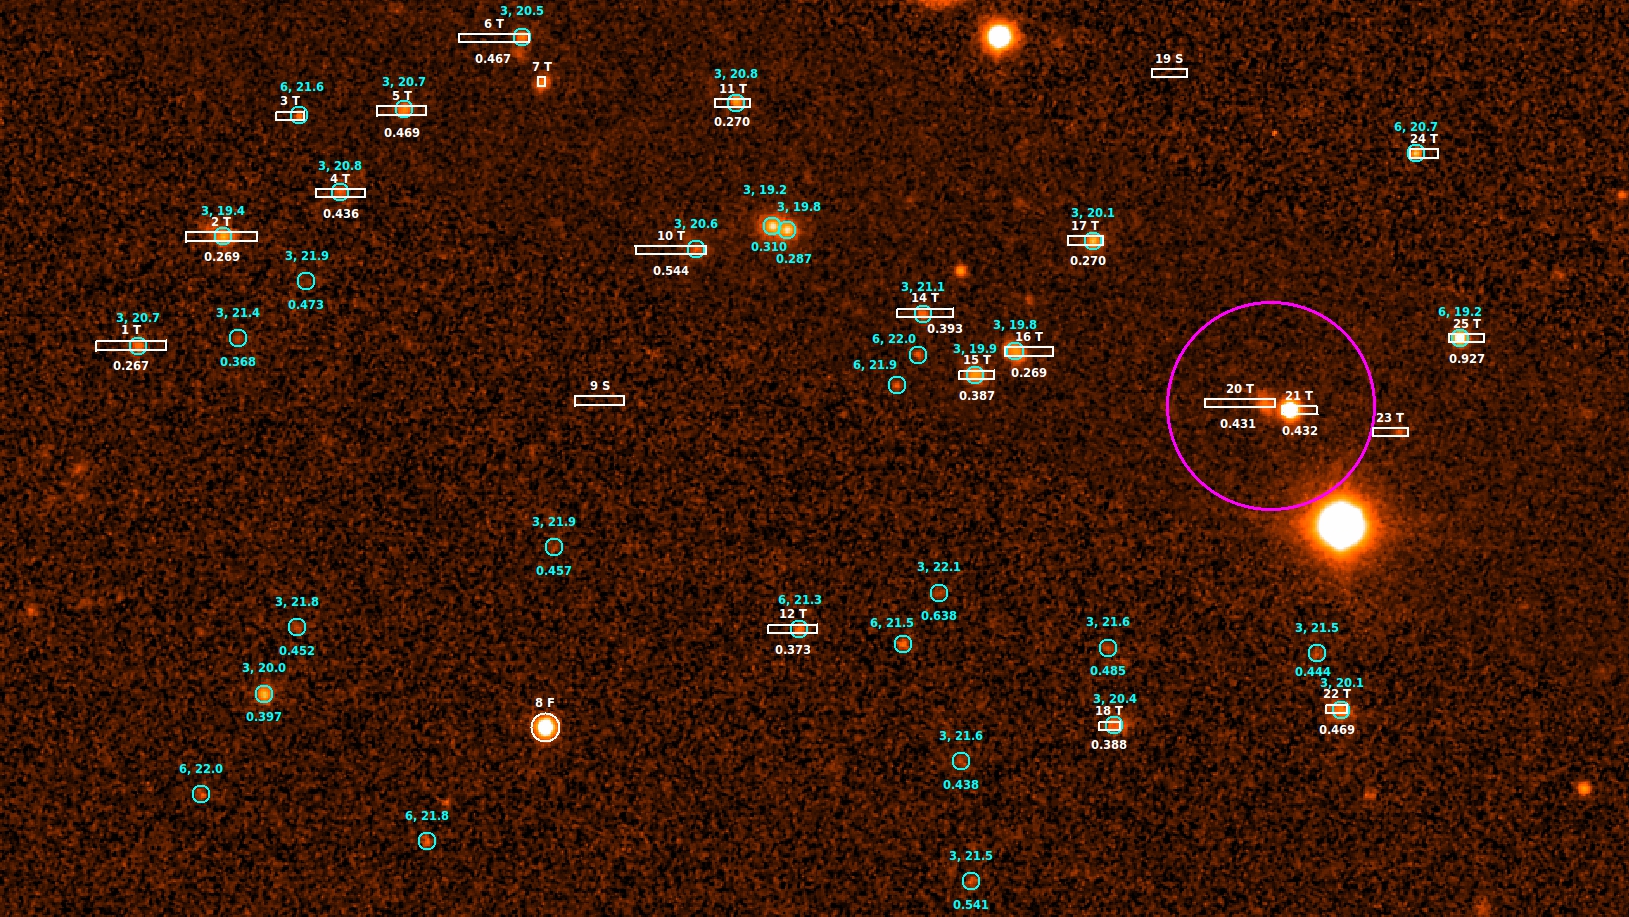
Figure 2 shows partially the slit positions on top of an -band SDSS image, where we also marked the fiducial stars used for astrometry and areas free of objects used for obtaining reliable sky spectra. The length of the slits goes from 1″ to 10″ and the width is fixed at 1.2″. The SDSS image shows that 3FGL J0909 – in slit 21 – has a nearby companion (3.8″ apart, Fig. 2) with unknown redshift, we placed one of our slits (MOS-20) on top of this source to find if it is physically associated to 3FGL J0909.
The individual spectrum for each object was extracted from the calibrated 2-D spectral image by using the IRAF task . In general the extraction window is centred on the peak of the continuum, however for the case of the extraction of the spectrum corresponding to 3FGL J0909 (MOS-21) and keeping in mind that the emission coming from the centre is featureless, we extracted the spectrum avoiding the central pixels. After trying with different apertures we end with a final extraction window centered 3 pixels (0.75″) to the west of the continuum peak and an aperture of 4 pixels (1″). Based on the spatial profile of the emission around 5000 Å we calculate that the central pixel contribute around 40% of the light inside the aperture. Therefore by excluding that pixel from the extraction window, we improve significantly the observed equivalent widths.
In most of the cases the continuum is well detected and a 4th order polynomial function was good enough to fit the trace along the dispersion axes. In the cases where the continuum was not well detected we used the trace solutions found for a nearby object as reference.
Once the 1-D individual spectra were extracted, we located by eye different spectral features. We looked for the most common lines observed in extra–galactic sources, both in absorption (e.g. Ca II K&H, Mg band, NaD) and in emission (e.g. Hydrogen recombination lines, [OII]3727, [OIII]5007, [NII]6583). Once the lines were identified in a given spectrum we fit a Gaussian profile which returns the position of the peaks, the integrated flux of the different lines and the equivalent widths (we used the IRAF/ command stroke ). The peaks position was used to estimate the corresponding redshifts for each individual line. The final redshift is the median of all measured values. The error is given by the standard deviation where we have more than two lines in the spectrum, or the difference between the two redshift values when we have only two lines identified in the spectrum. The systematic error in redshift of due to uncertainties in the wavelength calibration described in section 2 was added in quadrature. The spectroscopic redshifts and the errors are included in Table 2. We also included the number of lines used to estimate the redshifts and if they were found in emission or in absorption.
3 Results
3.1 Redshift of 3FGL J0909
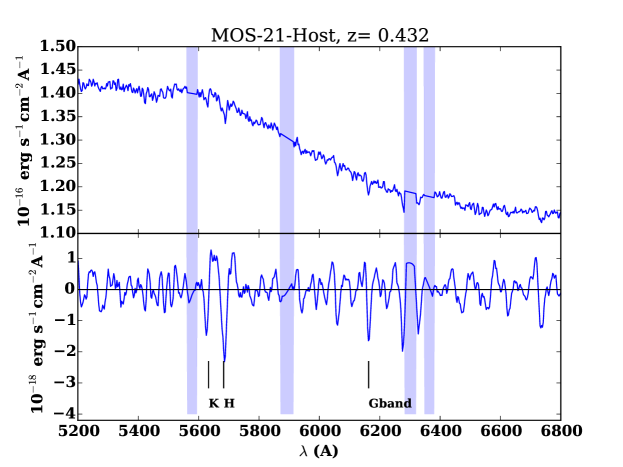
We obtain spectroscopic redshifts for 26 of the 35 observed targets. Targets for which we cannot extract the redshift include objects close to the slit borders and those where the signal to noise ratio was too low to obtain any spectral feature. Table 2 lists the SDSS properties of the selected targets, the spectroscopic redshifts, and distance to 3FGL J0909. The flux calibrated spectrum of the 3FGL J0909 host galaxy is plotted in Figure 3 (top panel). Around 5700 Å, the spectrum has a root mean square noise of erg s-1cm-2Å-1 (signal to noise ratio of ) which is a factor of 9 better than that in Aliu et al. (2012) and Shaw et al. (2013). In order to see clearly the weak absorption features, we fit a 6th order polynomial curve to the original spectra plus a Savitzky–Golay filter (e.g. Press et al., 1989)222The Savitzky Golay filter is a particular type of low-pass filter. We make use of the routine provided by the SciPy organization at SciPy.org. Information of the algorithm and multiple references can be found in the SciPy pages. which removes very broad spectral features due to residuals produced in the sky substraction process, and therefore they are not related with any astrophysical source. The result of that process is plotted in the bottom panel of Fig. 3. We mark in the plot three absorption lines used to obtain the redshift of . These spectral features from Ca II K&H and the G–band, have their origin in stellar atmospheres, therefore they are coming from the 3FGL J0909 host galaxy, and not from any intervening material in the line of sight. Table 1 shows the line fluxes and equivalent widths obtained from the Gaussian profile fit. In all cases the lines were detected above 3 level.
| Line Flux | Equivalent Width | |
|---|---|---|
| (erg s-1cm-2Å-1) | (Å) | |
| Ca II K | 3.46 1.07 | 0.25 0.08 |
| Ca II H | 8.63 1.44 | 0.62 0.10 |
| G band | 3.37 0.94 | 0.28 0.08 |
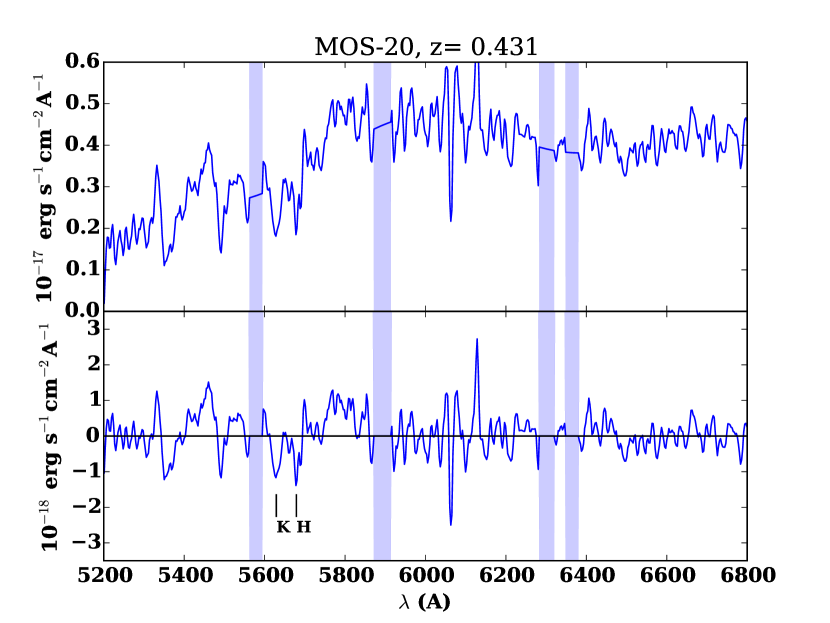
The spectra of the nearby companion is shown in Fig. 4 and based on the observed absorption lines we obtain a . The angular separation between these two sources is of 3.8″ which corresponds to 21 kpc at the redshift of the BL Lac.
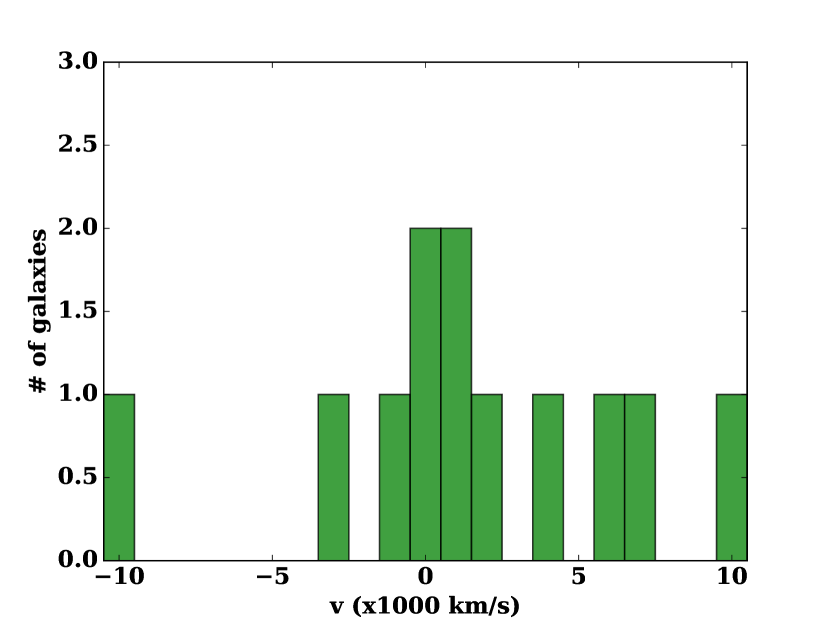
We calculate the radial velocity dispersion distribution taking as reference the recessional velocity of 3FGL J0909 (Fig. 5). The distribution includes both photometric and spectroscopic redshifts. The spectroscopic data comes from our MOS observations and the photometric redshifts were obtained from the SDSS data release 12 (Beck et al., 2016) which includes all the galaxy–type objects within the OSIRIS FOV (7 centered in 3FGL J0909). We did not find any significant structure around 3FGL J0909. The difference between the recession velocity of 3FGL J0909 and its nearby companion is 300 km s-1 which is similar to the dispersion velocities observed in galaxy groups.
3.2 Redshift of Galaxies in the OSIRIS FOV
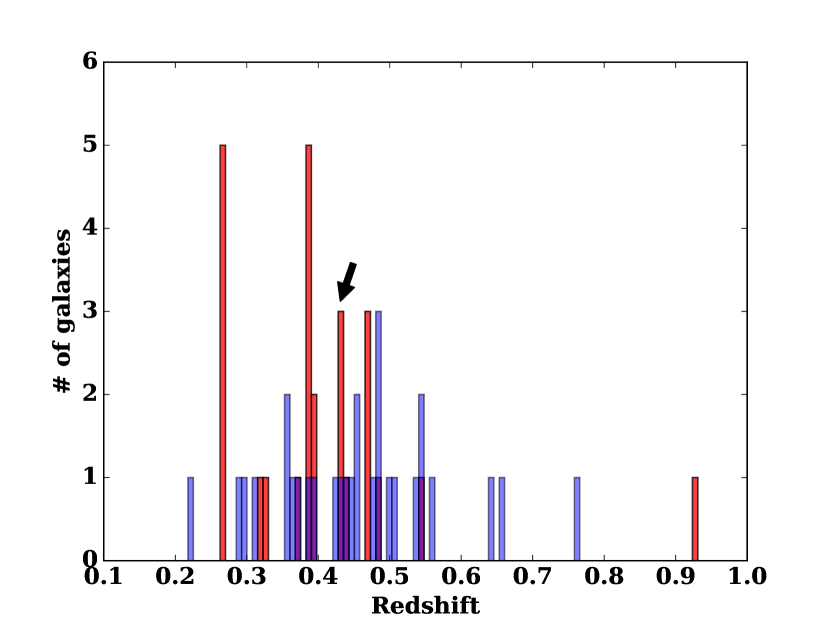
To study the existence of galaxy groups within the OSIRIS FOV we create a histogram showing the redshift distribution based on photometric and spectroscopic redshifts (Fig. 6). As shown in Figure 5, we did not find any significant over density around 3FGL J0909, either using the spectroscopic or photometric redshifts. Within the redshift bin where 3FGL J0909 is located, we find just another galaxy (MOS-44) with similar redshift but separated by 270″. This angular separation corresponds to a projected physical distance of 1.5 Mpc, therefore this galaxy is too far away to be related to the nuclear activity of 3FGL J0909.
Two small peaks appear in the spectroscopic distributions at 0.28 and 0.39 which are not related with 3FGL J0909. The minimum and maximum distances between the members belonging to the group at =0.28 are 86, and 585 kpc respectively. The corresponding values for the group at =0.39 are 286 kpc, and 1.7 Mpc. The spectroscopic study of these two groups will be presented in a forthcoming paper.
4 Conclusions
By carefully extracting the GTC spectra of 3FGL J0909 avoiding the featureless central engine we assign a redshift of =0.4320.002 to its host galaxy. We find a neighbouring galaxy just 21 kpc apart with similar redshift that could be the cause of the BL Lac nuclear activity observed in 3FGL J0909. In fact, the presence of nearby companions separated by tens of kpc have been observed in other BL Lac objects pointing to the possible connection between the gas fueling towards the nuclei due to a close encounter and the consequent triggering the nuclear activity (e.g. Falomo, 1996; Farina et al., 2016).
Our results show that in a FOV of exist two groups of galaxies with mean redshifts which are quite different from the spectroscopic redshift of the BL Lac. This result indicates that conclusions obtained by associating the redshift of a given object based on the presence of a galaxy group within the studied FOV (e.g. Muriel et al., 2015) must be used with caution.
The fact that we now have a precise spectroscopic redshift determination for 3FGL J0909 and taking into account that photons from this object have been detected above 10 GeV, makes 3FGL J0909 an interesting target for Cherenkov telescopes.
| ID | RA(o) | DEC(o) | Type | (mag.) | (mag.) | N | (″) | Comments | |
|---|---|---|---|---|---|---|---|---|---|
| MOS-1 | 137.30323 | 23.18951 | 3 | 20.730.05 | 0.950.09 | 0.26700.0002 | 4/E | 182.4 | – |
| MOS-2 | 137.29928 | 23.19389 | 3 | 19.380.02 | 1.430.06 | 0.2690.0010 | 6/A | 169.0 | – |
| MOS-3 | 137.29633 | 23.19840 | 6 | 21.600.08 | 1.530.21 | – | – | 160.3 | (d) |
| MOS-4 | 137.29408 | 23.19562 | 3 | 20.810.07 | 1.370.16 | 0.4360.0060 | 2/A | 151.1 | – |
| MOS-5 | 137.29140 | 23.19894 | 3 | 20.690.04 | 0.940.08 | 0.46850.0003 | 5/E | 143.2 | – |
| MOS-6 | 137.28744 | 23.20185 | 3 | 20.490.05 | 1.960.15 | 0.46650.0003 | 3/A | 131.5 | (SDSS) |
| MOS-7 | 137.28540 | 23.19999 | 0 | 20.840.11 | 1.160.21 | – | – | 123.0 | (e) |
| MOS-10 | 137.27964 | 23.19333 | 3 | 20.610.07 | 1.540.18 | 0.5440.0030 | 4/A | 98.8 | (SDSS) |
| MOS-11 | 137.27697 | 23.19924 | 3 | 20.750.04 | 1.380.08 | 0.270.0080 | 5/A | 93.6 | – |
| MOS-12 | 137.27430 | 23.17811 | 6 | 21.340.07 | 1.110.14 | 0.3730.0030 | 2/E | 81.5 | – |
| MOS-14 | 137.26851 | 23.19081 | 3 | 21.130.07 | 0.500.10 | 0.39250.0002 | 5/E | 58.2 | – |
| MOS-15 | 137.26625 | 23.18832 | 3 | 19.940.03 | 1.250.06 | 0.38680.0001 | 4/E | 49.3 | – |
| MOS-16 | 137.26397 | 23.18925 | 3 | 19.830.03 | 1.120.05 | 0.2690.0070 | 4/A | 41.4 | – |
| MOS-17 | 137.26150 | 23.19371 | 3 | 20.130.03 | 1.490.06 | 0.26980.0004 | 6/A | 36.7 | – |
| MOS-18 | 137.26049 | 23.17430 | 3 | 20.390.05 | 0.860.08 | 0.3880.0002 | 4/E | 43.9 | – |
| MOS-20 | 137.25487 | 23.18718 | 0 | 20.750.10 | 1.390.22 | 0.4310.0020 | 2/A | 3.8 | (b) |
| MOS-21 | 137.25216 | 23.18690 | 0 | 17.920.03 | 0.260.04 | 0.4320.0020 | 3/A | 0.0 | (a) |
| MOS-22 | 137.25051 | 23.17490 | 3 | 20.120.04 | 1.170.07 | 0.46920.0004 | 5/EA | 32.7 | – |
| MOS-23 | 137.24843 | 23.18602 | 0 | 22.100.19 | 0.700.33 | – | – | 15.2 | (c) |
| MOS-24 | 137.24657 | 23.19721 | 6 | 20.710.03 | 0.670.05 | – | – | 34.8 | (c) |
| MOS-25 | 137.24483 | 23.18979 | 6 | 19.220.01 | 0.410.02 | 0.9270.0030 | 2/E | 29.0 | (SDSS) |
| MOS-26 | 137.23555 | 23.16875 | 3 | 21.270.09 | 0.990.16 | 0.3830.0070 | 3/E | 78.0 | – |
| MOS-28 | 137.23118 | 23.17396 | 3 | 21.640.10 | 0.200.13 | – | – | 84.4 | (c) |
| MOS-29 | 137.22870 | 23.18817 | 3 | 19.490.03 | 1.430.06 | 0.3840.0010 | 4/E | 86.1 | – |
| MOS-30 | 137.22499 | 23.17738 | 3 | 21.200.07 | 0.970.13 | 0.320.0030 | 2/A | 102.6 | – |
| MOS-32 | 137.22047 | 23.17773 | 3 | 21.570.07 | 0.420.09 | – | – | 118.2 | (c) |
| MOS-33 | 137.21864 | 23.18462 | 3 | 20.730.05 | 1.150.10 | 0.4810.0050 | 3/A | 122.4 | – |
| MOS-35 | 137.21341 | 23.18033 | 6 | 20.770.03 | 0.440.05 | 0.0640.0040 | 2/A | 142.2 | – |
| MOS-37 | 137.20116 | 23.17549 | 3 | 21.210.08 | 0.640.11 | 0.39290.0001 | 4/E | 187.6 | – |
| MOS-39 | 137.18953 | 23.19677 | 3 | 21.680.09 | 1.130.17 | – | – | 228.5 | (e) |
| MOS-40 | 137.18827 | 23.18101 | 6 | 21.810.08 | -0.100.09 | – | – | 232.1 | (e) |
| MOS-41 | 137.18586 | 23.17341 | 3 | 20.120.03 | 0.660.05 | – | – | 242.9 | (e) |
| MOS-44 | 137.17782 | 23.18492 | 3 | 20.240.03 | 1.550.07 | 0.43470.0006 | 5/A | 269.3 | – |
| MOS-45 | 137.17472 | 23.16406 | 3 | 21.230.06 | 1.100.12 | 0.38560.0002 | 5/E | 286.8 | – |
| MOS-47 | 137.16818 | 23.18464 | 3 | 20.420.04 | 0.730.06 | 0.32300.0001 | 4/E | 304.0 | – |
The magnitudes and colours of the SDSS unclassified objects (type=0) were obtained by doing photometry on the SDSS images. (a) Main target, (b) a galaxy close to 3FGL J0909 , (c) close to the borders, impossible to get the spectra; (d) field star; (e) no spectral features detected, (SDSS) we agree – within the errors – with the spectroscopic redshift given by SDSS.
Acknowledgements
We thank the support team at GTC, and an anonymous referee for suggestions that helped to improve the clarity of the paper.
This work is partly financed by CONACyT (Mexico) research grants CB-2010-01-155142-G3 (PI:YDM) and CB-2011-01-167281-F3 (PI:DRG). SCL thanks CONACyT for her studentship.
Funding for SDSS-III has been provided by the Alfred P. Sloan Foundation, the Participating Institutions, the National Science Foundation, and the U.S. Department of Energy Office of Science. The SDSS-III web site is http://www.sdss3.org/.
References
- Abdo et al. (2010) Abdo A. A., et al., 2010, ApJS, 188, 405
- Acero et al. (2015) Acero F., et al., 2015, ApJS, 218, 23
- Ackermann et al. (2013) Ackermann M., et al., 2013, ApJS, 209, 34
- Aliu et al. (2012) Aliu E., et al., 2012, ApJ, 759, 102
- Allen et al. (2011) Allen J. T., Hewett P. C., Maddox N., Richards G. T., Belokurov V., 2011, MNRAS, 410, 860
- Beck et al. (2016) Beck R., Dobos L., Budavári T., Szalay A. S., Csabai I., 2016, MNRAS, 460, 1371
- Becker, White, & Edwards (1991) Becker R. H., White R. L., Edwards A. L., 1991, ApJS, 75, 1
- Blandford & Rees (1978) Blandford R. D., Rees M. J., 1978, PhyS, 17, 265
- Böttcher et al. (2013) Böttcher M., Reimer A., Sweeney K., Prakash A., 2013, ApJ, 768, 54
- Brinkmann et al. (1997) Brinkmann W., et al., 1997, A&A, 323, 739
- Dermer & Schlickeiser (1993) Dermer C. D., Schlickeiser R., 1993, ApJ, 416, 458
- Domínguez et al. (2011) Domínguez A., et al., 2011, MNRAS, 410, 2556
- Falomo, Melnick, & Tanzi (1990) Falomo R., Melnick J., Tanzi E. G., 1990, Natur, 345, 692
- Falomo (1996) Falomo R., 1996, MNRAS, 283, 241
- Falomo, Pian, & Treves (2014) Falomo R., Pian E., Treves A., 2014, A&ARv, 22, 73
- Farina et al. (2016) Farina E. P., Fumagalli M., Decarli R., Fanidakis N., 2016, MNRAS, 455, 618
- Gómez-González, Mayya, & Rosa-González (2016) Gómez-Gónzalez V. M. A., Mayya Y. D., Rosa-González D., 2016, MNRAS, 460, 1555
- Franceschini, Rodighiero, & Vaccari (2008) Franceschini A., Rodighiero G., Vaccari M., 2008, A&A, 487, 837
- Furniss et al. (2013) Furniss A., Fumagalli M., Danforth C., Williams D. A., Prochaska J. X., 2013, ApJ, 766, 35
- Hopkins et al. (2008) Hopkins P. F., Hernquist L., Cox T. J., Kereš D., 2008, ApJS, 175, 356-389
- Laurent-Muehleisen et al. (1997) Laurent-Muehleisen S. A., Kollgaard R. I., Ryan P. J., Feigelson E. D., Brinkmann W., Siebert J., 1997, A&AS, 122, 235
- León-Tavares et al. (2011) León-Tavares J., Valtaoja E., Chavushyan V. H., Tornikoski M., Añorve C., Nieppola E., Lähteenmäki A., 2011, MNRAS, 411, 1127
- Lietzen et al. (2008) Lietzen H., Nilsson K., Takalo L. O., Heinämäki P., Nurmi P., Keinänen P., Wagner S., 2008, A&A, 482, 771
- Muriel et al. (2015) Muriel H., Donzelli C., Rovero A. C., Pichel A., 2015, A&A, 574, A101
- Nolan et al. (2012) Nolan P. L., et al., 2012, ApJS, 199, 31
- Press et al. (1989) Press W. H., Flannery B. P., Teukolsky S. A., Vetterling W. T., 1989, in Numerical Recipes in C. The Art of Scientific Computing (Cambridge Univ. Pres)
- Shaw et al. (2013) Shaw M. S., et al., 2013, ApJ, 764, 135
- Urry et al. (2000) Urry C. M., Scarpa R., O’Dowd M., Falomo R., Pesce J. E., Treves A., 2000, ApJ, 532, 816