Hard X-ray Spectral Investigations of Gamma-ray Bursts, 120521C and 130606A, at High-redshift
Abstract
This study presents the temporal and spectral analysis of the prompt emission of two high-redshift gamma-ray bursts (GRBs), 120521C at and 130606A at , which were performed using the Swift-XRT/BAT and the Suzaku-WAM simultaneously. Based on follow-up XRT observations, the longest durations of the prompt emissions were approximately s (120521C) and s (130606A) in the rest frame of each GRB, which are categorized as long-duration GRBs, but are insufficiently long compared with the predicted duration of GRBs that originate from first-generation stars. Because of the wide bandpass of the instruments covering the ranges of 15 keV–5 MeV (BAT-WAM) and 0.3 keV–5.0 MeV (XRT-BAT-WAM), we successfully determined the peak energies of keV and keV in the rest frame, and the isotropic-equivalent radiated energies of erg and erg, respectively. These obtained characteristic parameters are in accordance with the well-known relation between and (Amati relation). In addition, we examined the relations between and the 1-s peak luminosity, , or the geometrical corrected radiated energy, , and confirmed the - (Yonetoku) and - (Ghirlanda) relations. The results implied that these high-redshift GRBs at , expected as having radiated from the reionization epoch, have similar properties as that of X-ray prompt emission with low-redshift GRBs.
keywords:
methods: data analysis – gamma-ray burst: individual: 120521C– gamma-ray burst: individual: 130606A1 Introduction
Gamma-ray bursts (GRBs) at a high redshift are considered a powerful probe for the early universe at z6–20, and a portion of their progenitors are first-generation stars, called Population III (Pop. III) stars. Radiations emitted from these stars have been predicted to cause a reionization state of the intergalactic medium (IGM). Theoretical investigations of production of GRBs from Pop III stars have been intensively performed (e.g. Mészáros & Rees, 2010; Komissarov & Barkov, 2010; Suwa & Ioka, 2011; Nagakura et al., 2012; Woosley & Heger, 2012; Nakauchi et al., 2012; Toma et al., 2016). Most of models prefer to use the very massive progenitor stars with solar mass, and predict the peculiarly large total energies and ultra-long duration (e.g. Suwa & Ioka, 2011). On the other hand, numerical studies of the evolution of Pop. III stars imply that luminous GRBs are rather difficult to occur from the very massive progenitor stars (Yoon et al., 2012, 2015). For GRB originated from the Pop. III stars with mass smaller than 100 solar mass (typically 40 solar mass), Nakauchi et al. (2012) predicted the duration of s in the observer frame. Ultra-long duration with the time scale of – s is therefore the common expected property from GRBs originated from Pop III stars. Although prompt spectral properties of Pop. III stars were expected (e.g. Nakauchi et al., 2012), it fully relies on the correlations (Amati et al., 2002; Yonetoku et al., 2004), which are established using GRBs at lower redshift. Hence, prompt emission characterizations of long GRBs at higher redshift could enrich the studies of Pop. III stars.
To date, a few GRBs, namely 050904 (, Tagliaferri et al., 2005; Haislip et al., 2006; Kawai et al., 2006), 080913 (, Greiner et al., 2009), 090423 (, Salvaterra et al., 2009; Tanvir et al., 2009), 090429B (, Cucchiara et al., 2011), 120521C (, Tanvir et al., 2012; Laskar et al., 2014),130606A (, Chornock et al., 2013; Castro-Tirado et al., 2013; Totani et al., 2014), and 140515A (, Chornock et al., 2014; Melandri et al., 2015), have been identified as high-redshift GRBs at z 6. These brief properties are listed in Table 1. In particular, according to Zhang et al. (2014) duration of 050904 in X-ray band exceeds s, but the authors also suggested ultra-long GRBs were not outliers from the distribution of the duration of ordinary GRBs.
According to the optical afterglow spectrum of 130606A obtained with the Subaru telescope (Totani et al., 2014), the measured neutral fraction of the IGM implies that reionization is incomplete at , which provides critical information on the reionization history of the cosmos. This result is consistent with the neutral fraction of the IGM measured using quasar spectra at (Schroeder et al., 2013), which is less uncertain. We consider this implication to support the possibility that the Pop. III star is a progenitor of a high-redshift GRB, which is expected to form with completely metal-free gases, the composition of which might be relatively different from present stars. However, the correlations between the peak energy in the X-ray spectrum and the radiated energy of prompt emissions are known, and GRBs are expected to be a useful tool for determining the cosmological parameters as a standard candle like type Ia supernovae. GRBs have the strength of reaching a higher redshift compared with supernovae. This raises the the following question; Could high-redshift GRBs produced from Pop. III stars also fit the correlations confirmed with low-redshift GRBs at z 6?
Fireball dissipation model in photosphere (Ioka, 2010) was implied by the - (Yonetoku) relation as a candidate of radiation mechanism of the prompt emission. Blackbody law in the surface of the photosphere follows , where is radius of the photosphere; is a Lorentz factor of its radiation flow; and is blackbody temperature observed as peak energy . Considering Pop. III stars are one-hundred times larger radius (Ohkubo et al., 2009; Ioka, 2010) and luminosity and the Lorentz factor are comparable with those of Wolf-Rayet stars, Pop. III stars have ten times lower than that of Wolf-Rayet stars is required. We predicted that high-redshift GRBs deviate from Yonetoku relation as lower . However, the two characteristic parameters of peak energy and the isotropic-equivalent radiated energy have been measured in only one object (050904) to date, without any assumptions of X-ray spectral shapes (Table 1). Thus, sensitive X-ray observations of the prompt interval of the GRBs with a broadband from the keV to MeV energy range are critical for measuring the two characteristic parameters.
This paper presents X-ray spectral analyses of the prompt emissions of two high-redshift GRBs, which were conducted using Suzaku wide-band all-sky monitor (WAM, Yamaoka et al., 2009), Swift burst alert telescope (BAT, Barthelmy et al., 2005), and Swift X-ray telescope (XRT, Burrows et al., 2005). To better constrain the spectral peak energy and isotropic-equivalent energy , we performed simultaneous joint spectral fitting between BAT-WAM (nominal bandpass: 15 keV–5 MeV) and XRT-BAT-WAM (0.5 keV–5 MeV). Because these combinations provide broadband spectral information, investigating these spectral features presents an advantage (e.g. Krimm et al., 2009; Urata et al., 2009, 2014). Furthermore, the detailed spectral cross-calibration studies were performed among the BAT and the WAM (Sakamoto et al., 2011). The following sections detail our employment of FTOOLS provided in the HEADAS software package (version 6.14) for data reduction and analyses, and the quoted error was at a 90% confidence level. The cosmological parameters of km s-1 Mpc-1, , and were used.
2 Instruments and Analyses
The WAM is an active-shield of a hard X-ray detector (HXD, Takahashi et al, .2007; Kokubun et al., 2007) onboard Suzaku satellite (Mitsuda et al., 2007). It is composed of four Bismuth Germanate crystal walls (WAM-0, WAM-1, WAM-2, and WAM-3). Although the main function of the WAM is exception of non-X-ray background events caused by cosmic-particles from observed data of main sensor of the HXD, the WAM is effective for monitoring transient astronomical events in the nominal bandpass range of 50 keV–5 MeV (Yamaoka et al., 2009). However, because of the long-term degradation of the gain during the observational period, the energy bandpass shifted to 88 keV–7.7 MeV on May 21, 2012, and 91 keV–8.0 MeV on June 6, 2013. Because of its wide field of view of 2 st and large effective area of 400 cm2 for 1-MeV photons, the WAM can be used for investigating GRBs, solar flares, and magnetar bursts (e.g. Endo et al., 2010; Urata et al., 2012; Yasuda et al., 2015; Ohmori et al., 2016). The analytical tools applied to the WAM data, hxdmkwamlc displaying a light curve and correcting dead time, and hxdmkwamspec extracting energy spectrum. Furthermore, we used battblocks to calculate the duration, which is the time of accumulation between 5% and 95% of the counts. In the following sections, we used these tools and a Monte-Carlo response generator (Ohno et al., 2005), which was used to generate detector response matrices for the spectral analyses.
The BAT and the XRT onboard Swift satellite (Gehrels et al., 2004) are powerful detectors for the discovery and observation of transient astronomical objects. Initial detections and localizations of 120521C and 130606A were also performed using the BAT (Baumgartner et al., 2012; Ukwatta et al., 2013). Both detectors provide detailed time-resolved temporal information compared with the WAM by using BAT trigger data and XRT windowed-timing (WT) mode data. In addition, in-depth follow-up observations with the XRT provided the long-term light curves of GRBs. BAT and XRT spectra cover bandpasses of 0.5–10 keV and 15–150 keV, respectively.
This paper presents the temporal and spectral analyses of a part of the prompt emission of the GRBs. First, we used the reprocessing tools batgrbproduct for the BAT trigger data sets and xrtpipeline for the XRT WT data. Second, we employed batbinevt and batdrmgen to extract the BAT energy spectra and generate these response matrices, respectively. For the spectral analyses of the XRT, we used xselect to accumulate XRT energy spectra. We then extracted the source and background spectra within 20 pixels from the center of the location of the GRB and between 20–40 pixels, respectively. We used a response matrix “swxwt0to2s6_20130101v015.rmf,” which is available from the calibration database CALDB, and generated an ancillary response file by using xrtmkarf. In the following spectral analyses, we fixed the flux normalization of the BAT to 1, and maintained the factor of the WAM and XRT as a free parameter.
By using the three instruments simultaneously, we achieved four orders of broadband joint spectral fitting within an energy range of 0.5 keV–5 MeV, which is more advantageous for determining such spectral characteristics compared with the individual use of these instruments.
3 Observations and Results
To perform the spectral analyses on high-redshift GRBs, we listed seven high-redshift GRBs, as shown in Table 1 (GCN circulars111http://gcn.gsfc.nasa.gov and GRB big data table222http://www.mpe.mpg.de/ jcg/grbgen.html). All listed GRBs triggered the BAT and were localized by it. Previous spectral studies on four GRBs (050904, 080913, 090423, and 140515A) have reported the and values (Sugita et al., 2009; Yonetoku et al., 2010; von Kienlin, 2009; Melandri et al., 2015), although the two characteristics (except for 050904) were derived under the assumption of one or two model parameters of the Band function (Band et al., 1993) of or , or by using a power-law (PL) with an exponential cut-off (PLE) model. Because of the broadband spectrum between the BAT and WAM, Sugita et al. (2009) successfully determined the two characteristics for 050904 without the requiring the aforementioned assumption.
The 090429B recorded a photometric redshift of (Cucchiara et al., 2011), which is the greatest distance observed among GRBs to date. However, only Swift satellite observed its prompt emission, and the two spectral characteristic parameters have not been determined because of the limited bandwidth (Cucchiara et al., 2011). Regardless, the remaining two GRBs, 120521C and 130606A were successfully simultaneously observed with the WAM and BAT. We conducted the broadband spectral analyses as follows:
3.1 GRB120521C
The BAT triggered 120521C (Baumgartner et al., 2012; Markwardt et al., 2012) on May 21, 2012, at 23:22:07.703 (UT) (, hereafter), and localized its position at (RA, Dec)(J2000) = (14h17m09s, + 42 d 07’ 23”) Afterglow emissions of the GRB were successfully observed in multi-wavelength from radio, near infrared, optical to X-ray, and a jet-break time of d was revealed also in Laskar et al. (2014). According to the paper, a jet opening angle rad, a beaming-corrected kinetic energy erg, and a corrected radiated gamma-ray energy erg were derived using Markov Chain Monte Carlo analysis. Then its redshift was estimated z . However, the energies (1 keV–10 MeV) were calculated from only observed BAT spectrum (15-150 keV). Therefore, more broader bandpass spectrum than that of only the BAT is important to reveal the energetics.
3.1.1 Light Curves of 120521C
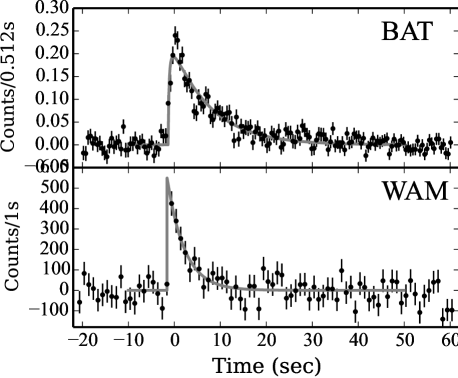
After the BAT detection of 120521C at , Swift satellite immediately slewed, and the XRT began conducting observations in WT mode. The WAM also detected the GRB, which was recognized by a ground-burst search at 23:22:06.595 (UT) with the 1-s time-resolution data of WAM-1. As shown in the left-hand panel of Figure 1, the light curves of the prompt part of the GRB exhibited a fast rise and exponential decay (FRED)-like pulse. The duration in the WAM light curve was measured as s. However the observed duration itself may not indicate of central engine activity directly, since it is strongly affected by sensitivity of the observation instruments as well as the redshift and time dilation effect. We therefore estimated the duration of the GRB using X-ray light curves as following paragraphs.
The FRED function is indicated by Norris et al. (2005); Peng et al. (2010) as , where is time since ; represents the normalization of the pulse height; is the start time; and denote the rise and decay characteristics, respectively; and is defined as . According to the previous researches, by using the two parameters of and , we can calculate a pulse width between the two intensity points, , and a pulse asymmetricity, . Furthermore, the rise and decay constant are derived from the two characteristics as and , respectively. The two light curves (Figure 1) fit well with the FRED functions. Table 2 shows the obtained test statistics and the FRED characteristic parameters. Because several previous studies on FRED GRBs (e.g. Peng et al., 2012; Tashiro et al., 2012, 2014) have indicated the energy dependency of the decay constant to be , we examined the fit of the FRED function as a narrower energy bandpass, as shown in Table 2. Thereafter, above the 409 keV band of the WAM light curve, we could not observe a significant pulse, and thus, the light curve was divided into two bandpasses, 88–195 keV and 195–409 keV.
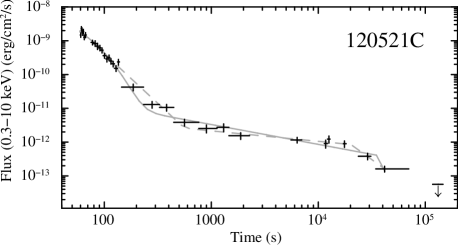
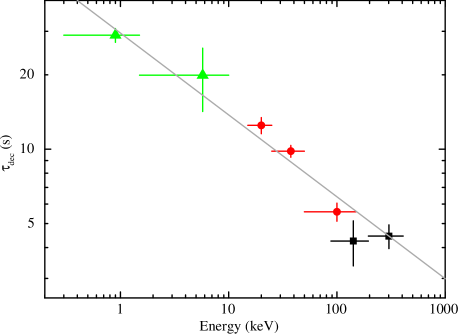
We tested whether a light curve of a following X-ray emission from an earlier observation, obtained from the Swift archive333http://www.swift.ac.uk and shown in Figure 2, also exhibited an exponential decay. Afterward, we attempted to identify whether a double-broken PL function better fit () compared with the combination of an exponential decay and a one-time broken PL (). We calculated the first and second broken times of the former function to be s and s in the observer frame, respectively The decay slope indices were , , and in order of time. With the XRT, we also divided the light curve into two energy bandpasses of 0.3–1.5 keV and 1.5–10 keV, and fit them with the latter function to identify the decay time constant in the soft X-ray band. Although the latter function did not provide the best model fit, the energy dependency of the decay time constant revealed good linearity from an energy band of 0.3–409 keV in Figure 3, and a decay index of was obtained.
3.1.2 Spectral Analyses of 120521C
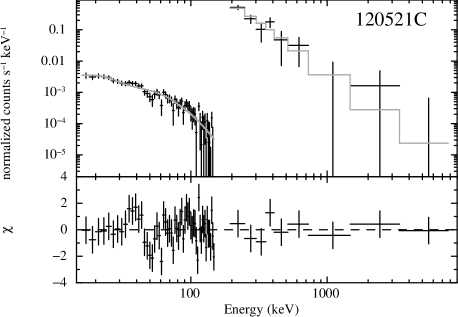
Time-averaged spectra of WAM-1 and the BAT were accumulated from s to s and s to s, respectively, by covering the entirety of the WAM . A background spectrum of WAM-1 was estimated from an average between ( s to s) and ( s to s). First, the time-averaged spectra were fit with a simple model of the PL function; a photon index was the obtained, which was (). Second, we applied more complex models of a PLE and Band model (Band et al., 1993), and these models revealed better test statistics compared with that of the PL. The parameters obtained from the PLE model were and keV with , and those obtained from the Band model were , , and keV with . Figure 4 shows the fitting results with the Band model.
We further extracted the 1-s peak spectra. The extracted time region ranged from s to s, which is the brightest interval in the WAM light curve (Figure 1). The peak spectra were fit with the PLE of and keV with , and the Band model of , , and keV with . Its peak flux was in the 1 keV–10 MeV band. The derived parameters of the Band model are shown in Table 4.
We also checked XRT spectra of following X-ray emissions, and the data were provided from the UK Swift science data centre (Evans et al., 2009). The spectra were extracted from the three intervals from s to s, from s to s, and from s to s which are defined from the fitting results of the light curve with double-broken function (§3.1.1), and they were fitted with PL models of photon indexes of (d.o.f = 55.8/72), (91.2/107), and (39.6/47), respectively. Then we employed fixed Galactic absorption column density of cm-2 (Kalberla et al., 2005) and added an extra-galactic absorption with a thawed column density parameter.
3.2 GRB130606A
The BAT was also triggered by 130606A (Ukwatta et al., 2013) on June 6, 2013, at 21:04:39.020 (UT) (, hereafter) in the location of (RA, Dec)(J2000) = (16h37m37s, + 29 d 47’ 27”), and goaded many astronomical instruments to observe the following afterglow emissions. 130606A was investigated with optical observatory deeply (Castro-Tirado et al., 2013; Chornock et al., 2013; Totani et al., 2014; Hartoog et al., 2015), and its redshift was determined at . In particular, Totani et al. (2014, 2016) suggested that the re-ionization state has not completed at the redshift, measuring the IGM neutral fraction (Table 1). Therefore this GRB is good opportunity to get a hint of first generation stars, although the reported redshift is not farther than .
3.2.1 Light Curves of 130606A
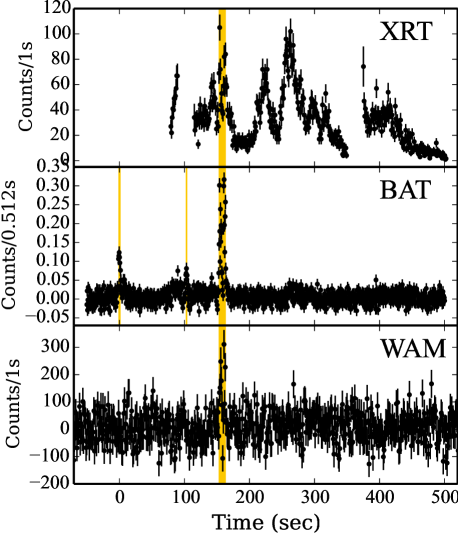
Figure 1 shows the temporal variations of a part of the prompt emission observed by the three instruments. In the BAT light curve (15–150 keV), three intervals were considerably brighter than in the 5.0 level from background variations. We defined the three intervals as region A ( s to s), region B ( s to s), and region C ( s to s). In the WAM light curve, only region C was detected successfully with the same criteria, and its duration was s. However the duration was obviously shorter compared with the light curves of Swift. We therefore tried to estimate the intrinsic duration of the emission activity using X-ray light curve.
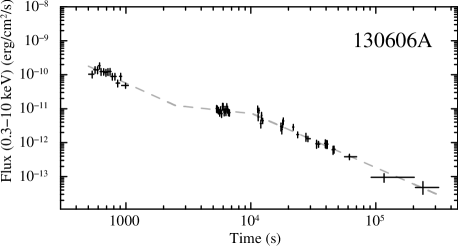
An X-ray light curve of the emissions that followed, published in the Swift UK archives333http://www.swift.ac.uk, displays a similar decay to that of 120521C, which also fit well with the double-broken PL functions, with (Figure 2). The broken times were thus s and s, and the decay slope indices were , , and in order of time.
3.2.2 Spectral Analyses of 130606A
We extracted the spectra from the regions A and B and performed spectral fitting with only the BAT data sets because the two intervals were detected substantially though only the BAT, but not covered by the XRT. The PL models of photon indexes of and represented the spectra well, respectively, and the obtained parameters are listed in Table 4. We examined the PLE model instead, and found that the peak energies were not determined because of the low statistics in the high-energy range.
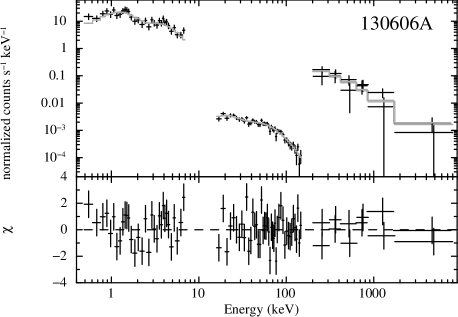
Region C was evidently detected by all three instruments (Figure 1); we therefore extracted the energy spectra from all the instrument data, and performed simultaneous spectral fitting. To prepare a broadband spectral fitting of region C simultaneous with the XRT, we derived an extra galactic absorption of cm-2 from an averaged spectrum of the XRT, which was accumulated from the entirety of the WT data set ( s – s) and fit with the PL model (Table 4). We then assumed a Galactic absorption of cm-2 (Kalberla et al., 2005) as a fixed parameter. For the WAM data, we used WAM-1 and WAM-2, which were exposed to the GRBs compared with the other sides. The extracted intervals of the BAT and the XRT were identical to those defined in region C ( s to s), whereas those of the WAM were between s and s. Although these spectra were accumulated from slightly different intervals, the differences are only 3% of the total extracted exposure time. Therefore, we regarded the differences to be negligible below spectral fitting. The background spectra of the WAM were estimated to have accumulated spectra from s to s, and from ṡ to s. We employed the XRT background spectrum produced for average spectrum fitting as the background spectrum of region C and the1-s peak interval, as shown in the following paragraph. The galactic and extra galactic absorption were fixed at those values. The spectra better fit the Band model with of , of , and of keV () compared with the PL (134.7/83) and the PLE models (120.3/82). Figure 4 shows the fitting results with the Band model, and the parameters obtained from the Band model are listed in Table 4.
The 1-s peak spectra were extracted from ( s to s), which is a part of region C. The spectra were represented by the PLE model of of and of keV () and the Band model with of , of , and of keV (). The Band model revealed a flux of (1 keV–10 MeV). The other obtained parameters are listed in Table 4.
We also performed spectral analysis of XRT spectra of following parts of from s to s, from s to s, and from s to 29891 s. We defined the three intervals from the results of the light curve fitting with the double-broken PL function (§3.2.1). The XRT spectra were represented by PL models of photon indexes of (), (), and (), respectively, in order of observation times, and then we employed fixed Galactic absorption column density of cm-2 (Kalberla et al., 2005) and thawed extra-galactic absorption column density as fitting parameters.
4 Discussion
We presented our temporal and spectral analyses of the prompt emissions of two GRBs, (i.e., 120521C and 130606A), at high-redshift and , respectively. The results revealed that we succeeded in determining these spectral shapes as listed in Table 4, because of the broadband simultaneous spectra with an energy band ranging from at least 15 keV–7.7 MeV.
4.1 Temporal Characteristics
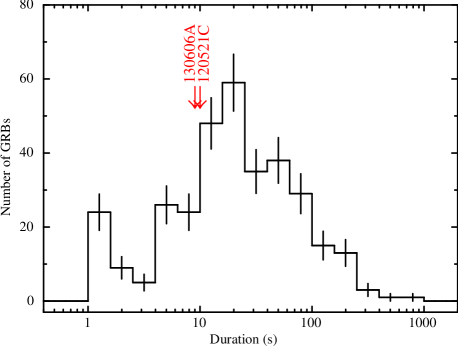
The durations derived from the WAM light curves (§3.1.1 and §3.2.1) were s (120521C) and s (130606A). Figure 5 shows the distribution, which was constructed by the WAM with observed GRBs with a 1-s time resolution data format (Ohmori et al., 2016), and represented with a single lognormal Gaussian centered at s, excluding the 1-s bin. Compared with the distribution, our results were shorter than the peak of the distribution. However, the durations of the prompt emissions obviously differed in each energy band (Figure 1), and thus, we attempted to evaluate the durations though a different approach involving .
Both XRT light curves (Figure 2) assume similar shapes, as represented by the double broken PL function (§3.1). Specifically, the early part of the light curve of 120521C also exhibited exponential decay, and these decay constants were correlated with those of a higher bandpass of the BAT and the WAM (Figure 3). The derived energy dependency index of is consistent with the values reported in several previous studies of FRED GRBs of (Peng et al., 2012), (Tashiro et al., 2012), and (Tashiro et al., 2014), although these dispersions are large. We therefore considered the emission until the first break time of s at the longest duration not to be afterglow dominant, but as the tail of the prompt emission. Furthermore, we assumed duration of X-ray radiation in the rest frame using energy dependency index of and the equation of
| (1) |
where and are duration and energy of photons in the rest frame of the GRB, respectively, and and are those of in the observer frame. Then the duration of s corresponds to s. The value of the energy dependency index is insufficient to be explained with synchrotron and/or inverse-Compton cooling predicting one of , thus implying the presence of an additional component and/or a geometrical effect in the emission region (Tashiro et al., 2014). However, the prompt emissions of 120521C were too faint to investigate the spectral evolution. We further calculated the energy dependency index of the pulse width of excluding the XRT light curve because it does not include the pulse rise interval that enables a comparision against other GRBs (e.g. Peng et al., 2012; Shenoy et al., 2013). Although the dispersions of the index value are large, it is comparable with the reported distribution of (Peng et al., 2012).
Hartoog et al. (2015) reported that the optical to X-ray energy spectrum of the 130606A afterglow are well reproduced with a single PL model of a photon index of . The photon index is consistent with the value of that we observed after second break time (§3.2.2; s). Moreover the X-ray light curve in its interval showed a simple PL decay. We therefore conclude that the dominant component is not prompt emission but afterglow after the second break. Also the spectral shapes of three intervals after s were not different each other, but the first interval shows the most similar photon index with the average XRT spectrum of the prompt emission. We finally defined the interval until the first break time of the fitted double-broken PL function dominates the prompt emission for 130606A like that of 120521C.
Although theoretical studies (e.g. Suwa & Ioka, 2011) have predicted that the prompt emissions have a long duration of approximately s in the rest frame of GRBs produced from Pop. III stars, an approximately 80 s (or s) duration of 120521C in the rest frame is insufficient for such a prediction. The duration is comparable with the expected duration of s from a progenitor of the Wolf-Rayet star (Suwa & Ioka, 2011). Although the duration of 130606A, approximately s in the rest frame, is substantially longer than that of 120521C significantly, it is still insufficient to compare with the predicted value for the Pop. III stars. The estimation of 72 s in the rest frame for 130606A (Zhang et al., 2014) also supports this conclusion.
4.2 Radiated Energy Correlations
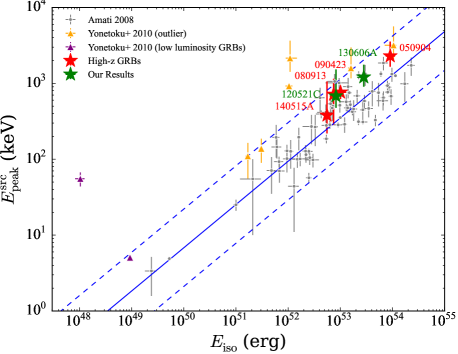
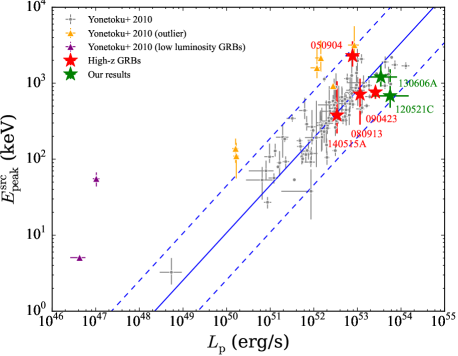
Regarding the emission mechanism compared with typical GRBs, we tested our results by using two well-known relations, namely the Amati (-; Amati et al., 2002) and Yonetoku (-; Yonetoku et al., 2004) relations. We calculated the intrinsic spectral energy peak , the isotropic radiated energy , and the 1-s peak luminosity . The energy bands of and are defined as the range of 1 keV–10 MeV. Afterward, the luminosity distances of 57.7 Gpc (120521C) and 56.7 Gpc (130606A) were calculated from each redshift of and , respectively. The parameters derived from our samples are as follows: keV, erg, and for 120521C; and keV, erg, and for 130606A. As shown in Figure 6, according to the Amati relation, both of our samples were consistent within the 2.0 (120521C) and 1.7 (130606A) levels of the correlation PL function reported by Amati et al. (2008). Moreover, the - value of 130606A fits the Yonetoku relation (Yonetoku et al., 2010) within the 0.8 level, but the mean value of 120521C deviated by 2.6 . The result of 120521C possibly supports the prediction of the fireball dissipation in photosphere of large radius Pop. III star.
Certain objects have already been reported as outliers in the Amati and/or Yonetoku relation (Yonetoku et al., 2010), and these points show an inclination of higher values compared with the mean of the relation, as shown in Figure 6. Because the point of 120521C is in the lower and higher side, it might imply a new type of outlier in the Yonetoku relation. Although 050904, the redshift of which is (Kawai et al., 2006), was identified as an outlier in Yonetoku et al. (2010), a result of a detailed and broadband spectral analysis (Sugita et al., 2009) indicated an inlier within the 3 level. Thus, we cannot reject the statistical effect caused by a large uncertainty and declare that 120521C is a new outlier.
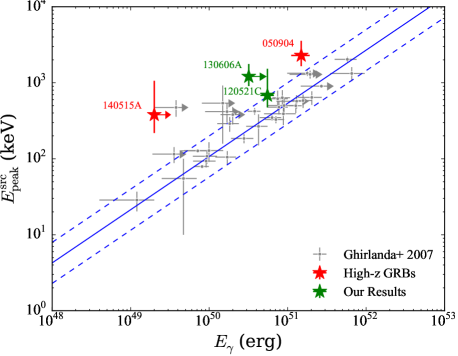
We further calculated the geometrically corrected radiated energy of 120521C and 130606A, and compared other GRBs against the Ghirlanda relation (-; Ghirlanda et al., 2004, 2007). Afterward, we assumed an energy conversion efficiency of 0.2 to radiate, with an ambient density of 3 cm3, respectively. According to the jet break time of 120521C at 7 d (Laskar et al., 2014), as revealed by radio observations, the jet opening angle and were estimated to be approximately and erg, respectively. To convert the measured jet break time to the jet opening angle, we then used the formula of Sari et al. (1999); Frail et al. (2001). For 130606A, a jet break time has not been determined through any follow-up observations, and an obvious break has not been seen in the reported optical light curve of the -band (Trotter et al., 2013) until 1.3 d. Therefore, we assumed the jet break time to be d, and estimated 130606A to have a jet opening angle of and an value of erg. As shown in Figure 6, the estimated values were plotted according to the Ghirlanda relation, and both points in the figure fit the relation. Furthermore, assuming a jet opening angle of , which is a median of a distribution (Fong et al., 2012) that indicates a jet break time of 12.3 d, is estimated as erg, and the value is an inlier of the correlation within the 1.2 level. Although 050904 is outside the 3 level, after applying dusty circumburst density around the GRB, it also fits the Ghirlanda relation (Sugita et al., 2009).
In conclusion, our samples fit the three notable empirical relations. Because 130606A has been implied as having radiated from the reionization epoch (Totani et al., 2014), our findings revealed that the relations conformed not only to low-redshift GRBs, but also to high-redshift GRBs from the epoch. According to our results of insufficient durations and the fitting with the three relations, these properties are dissimilar to those of the prediction of Pop. III stars, but apply instead to ordinary stars such as Walf-Rayet stars.
acknowledgments
We are grateful to all the Suzaku-WAM team members. We also thank Norisuke Ohmori for providing useful information of WAM distribution. This work is partly supported by the Ministry of Science and Technology of Taiwan grants MOST 104-2112-M-008-011- and 105-2112-M-008-013-MY3 (YU). This work made use of data supplied by the UK Swift Science Data Centre at the University of Leicester.
| Redshift | Prompt observation | (BAT) | Model | the IGM neutral fraction | ||||
| (s) | (s) | (keV) | (erg) | |||||
| 050904 | a | BAT, XRT, WAM | b | c | Band | d | d | e |
| 080913 | f | BAT, XRT | g | — | Band (fixed ) | h | h | – |
| 090423 | i | GBMj, BAT, XRT | k | — | Band (fixed ) | h | h | – |
| 090429B | l | BAT, XRT, | m | — | – | – | – | – |
| 120521C | n | BAT, XRT, WAM | o | — | Band | p | p | – |
| 130606A | q | BAT, XRT, WAM, Konus | r | c | Band | p | p | 0.1–0.5 s |
| 140515A | t | BAT, XRT | u | — | PLE | v | v | v |
| References; aKawai et al. (2006), bSakamoto et al. (2005), cZhang et al. (2014), dSugita et al. (2009), eTotani et al. (2006), fGreiner et al. (2009), gStamatikos et al. (2008), hYonetoku et al. (2010), iSalvaterra et al. (2009), kPalmer et al. (2009), lCucchiara et al. (2011), mStamatikos et al. (2009), nLaskar et al. (2014), oMarkwardt et al. (2012), pthis work, qChornock et al. (2013), rBarthelmy et al. (2013), sTotani et al. (2014), tChornock et al. (2014), uStamatikos et al. (2014), vMelandri et al. (2015) | ||||||||
| j GBM is gamma-ray burst monitor onboard Fermi satellite. | ||||||||
| Instrument | Bandpass | /d.o.f a | (s) | (s) | (s) | (s) | (s) | |
| WAM | 88 keV–7.7 MeV | 44.4/56 | ||||||
| 195–409 keV | 55.3/56 | |||||||
| 88–195 keV | 50.4/56 | |||||||
| BAT | 15–150 keV | 126.2/113 | ||||||
| 50–150 keV | 122.8/113 | |||||||
| 25–50 keV | 144.9/113 | |||||||
| 15–25 keV | 87.3/113 | |||||||
| XRT | 0.3–10 keV | 33.0/27 | – | – | – | – | – | |
| 1.5–10 keV | 5.4/6 | – | – | – | – | – | ||
| 0.3–1.5 keV | 17.0/29 | – | – | – | – | – | ||
| a d.o.f is degree of freedom. | ||||||||
| Instrument | ObsID | Start Time (UT) | Stop Time (UT) | |
|---|---|---|---|---|
| 120521C | WAM | 707013010 | 2012-05-20 20:54:08 | 2012-05-22 21:39:12 |
| BAT | 00522656000 | 2012-05-21 23:18:15 | 2012-05-21 23:38:17 | |
| XRT | 2012-05-21 23:23:30 | 2012-05-21 23:24:38 | ||
| 130606A | WAM | 708021020 | 2013-06-05 05:55:19 | 2013-06-07 23:00:11 |
| BAT | 00557589000 | 2013-06-06 20:50:59 | 2013-06-07 04:40:54 | |
| XRT | 2013-06-06 21:06:05 | 2013-06-07 09:29:15 |
| Interval | Instruments | Flux (15 keV–5 MeV) | Model | ||||||
| [ cm-2] | [keV] | [ erg s-1 cm-2] | |||||||
| 120521C | Average | BAT+WAM | – | 53.7/44 | Band | ||||
| Peak 1 s | BAT+WAM | – | 45.6/49 | Band | |||||
| 130606A | Average | XRT | – | – | – | 308.8/313 | PL | ||
| Region A | BAT | – | – | – | 58.4/44 | PL | |||
| Region B | BAT | – | – | – | 24.3/20 | PL | |||
| Region C | XRT+BAT+WAM | (fixed) | 101.5/81 | Band | |||||
| Peak 1 s | XRT+BAT+WAM | (fixed) | 59.4/53 | Band |
References
- Amati et al. (2002) Amati, L., Frontera, F., Tavani, M., et al. 2002, A&A, 390, 81
- Amati et al. (2008) Amati, L., Guidorzi, C., Frontera, F., et al. 2008, MNRAS, 391, 577
- Band et al. (1993) Band, D., Matteson, J., Ford, L., et al. 1993, ApJ, 413, 281
- Barthelmy et al. (2005) Barthelmy, S. D., Barbier, L. M., Cummings, J. R., et al. 2005, Space Sci. Rev., 120, 143
- Barthelmy et al. (2013) Barthelmy, S. D., Baumgartner, W. H., Cummings, J. R., et al. 2013, GRB Coordinates Network, 14819, 1
- Baumgartner et al. (2012) Baumgartner, W. H., Barthelmy, S. D., Burrows, D. N., et al. 2012, GRB Coordinates Network, 13318, 1
- Burrows et al. (2005) Burrows, D. N., Hill, J. E., Nousek, J. A., et al. 2005, Space Sci. Rev., 120, 165
- Castro-Tirado et al. (2013) Castro-Tirado, A. J., Sanchez-Ramirez, R., Gorosabel, J., et al. 2013, GRB Coordinates Network, 14796, 1
- Castro-Tirado et al. (2013) Castro-Tirado, A. J., Sánchez-Ramírez, R., Ellison, S. L., et al. 2013, arXiv:1312.5631
- Chornock et al. (2013) Chornock, R., Berger, E., Fox, D. B., et al. 2013, ApJ, 774, 26
- Chornock et al. (2014) Chornock, R., Fox, D. B., & Berger, E. 2014, GRB Coordinates Network, 16269, 1
- Cucchiara et al. (2011) Cucchiara, A., Levan, A. J., Fox, D. B., et al. 2011, ApJ, 736, 7
- Endo et al. (2010) Endo, A., Minoshima, T., Morigami, K., et al. 2010, PASJ, 62, 1341
- Evans et al. (2009) Evans, P. A., Beardmore, A. P., Page, K. L., et al. 2009, MNRAS, 397, 1177
- Fong et al. (2012) Fong, W., Berger, E., Margutti, R., et al. 2012, ApJ, 756, 189
- Frail et al. (2001) Frail, D. A., Kulkarni, S. R., Sari, R., et al. 2001, ApJL, 562, L55
- Fryer et al. (2001) Fryer, C. L., Woosley, S. E., & Heger, A. 2001, ApJ, 550, 372
- Gehrels et al. (2004) Gehrels, N., Chincarini, G., Giommi, P., et al. 2004, ApJ, 611, 1005
- Ghirlanda et al. (2004) Ghirlanda, G., Ghisellini, G., & Lazzati, D. 2004, ApJ, 616, 331
- Ghirlanda et al. (2007) Ghirlanda, G., Nava, L., Ghisellini, G., & Firmani, C. 2007, A&A, 466, 127
- Greiner et al. (2009) Greiner, J., Krühler, T., Fynbo, J. P. U., et al. 2009, ApJ, 693, 1610
- Hartoog et al. (2015) Hartoog, O. E., Malesani, D., Fynbo, J. P. U., et al. 2015, A&A, 580, A139
- Haislip et al. (2006) Haislip, J. B., Nysewander, M. C., Reichart, D. E., et al. 2006, Nature, 440, 181
- Ioka (2010) Ioka, K. 2010, Progress of Theoretical Physics, 124, 667
- Kalberla et al. (2005) Kalberla, P. M. W., Burton, W. B., Hartmann, D., et al. 2005, A&A, 440, 775
- Kawai et al. (2006) Kawai, N., Kosugi, G., Aoki, K., et al. 2006, Nature, 440, 184
- von Kienlin (2009) von Kienlin, A. 2009, GRB Coordinates Network, 9251, 1
- Kokubun et al. (2007) Kokubun, M., Makishima, K., Takahashi, T., et al. 2007, PASJ, 59, 53
- Komissarov & Barkov (2010) Komissarov, S. S., & Barkov, M. V. 2010, MNRAS, 402, L25
- Krimm et al. (2009) Krimm, H. A., Yamaoka, K., Sugita, S., et al. 2009, ApJ, 704, 1405
- Laskar et al. (2014) Laskar, T., Berger, E., Tanvir, N., et al. 2014, ApJ, 781, 1
- Mészáros & Rees (2010) Mészáros, P., & Rees, M. J. 2010, ApJ, 715, 967
- Markwardt et al. (2012) Markwardt, C. B., Barthelmy, S. D., Baumgartner, W. H., et al. 2012, GRB Coordinates Network, 13333, 1
- Melandri et al. (2015) Melandri, A., Bernardini, M. G., D’Avanzo, P., et al. 2015, A&A, 581, A86
- Mitsuda et al. (2007) Mitsuda, K., Bautz, M., Inoue, H., et al. 2007, PASJ, 59, 1
- Nagakura et al. (2012) Nagakura, H., Suwa, Y., & Ioka, K. 2012, ApJ, 754, 85
- Nakauchi et al. (2012) Nakauchi, D., Suwa, Y., Sakamoto, T., Kashiyama, K., & Nakamura, T. 2012, ApJ, 759, 128
- Norris et al. (2005) Norris, J. P., Bonnell, J. T., Kazanas, D., et al. 2005, ApJ, 627, 324
- Ohkubo et al. (2009) Ohkubo, T., Nomoto, K., Umeda, H., Yoshida, N., & Tsuruta, S. 2009, ApJ, 706, 1184
- Ohno et al. (2005) Ohno, M., Fukazawa, Y., Yamaoka, K., et al. 2005, IEEE Transactions on Nuclear Science, 52, 2758
- Ohmori et al. (2016) Ohmori, N., Yamaoka, K., Ohno, M., et al. 2016, PASJ, 68, S30
- Palmer et al. (2009) Palmer, D. M., Barthelmy, S. D., Baumgartner, W. H., et al. 2009, GRB Coordinates Network, 9204, 1
- Peng et al. (2010) Peng, Z. Y., Yin, Y., Bi, X. W., et al. 2010, ApJ, 718, 894
- Peng et al. (2012) Peng, Z. Y., Zhao, X. H., Yin, Y., Bao, Y. Y., & Ma, L. 2012, ApJ, 752, 132
- Sakamoto et al. (2005) Sakamoto, T., Barbier, L., Barthelmy, S., et al. 2005, GRB Coordinates Network, 3938, 1
- Sakamoto et al. (2011) Sakamoto, T., Pal’Shin, V., Yamaoka, K., et al. 2011, PASJ, 63, 215
- Salvaterra et al. (2009) Salvaterra, R., Della Valle, M., Campana, S., et al. 2009, Nature, 461, 1258
- Sari et al. (1999) Sari, R., Piran, T., & Halpern, J. P. 1999, ApJL, 519, L17
- Schroeder et al. (2013) Schroeder, J., Mesinger, A., & Haiman, Z. 2013, MNRAS, 428, 3058
- Shenoy et al. (2013) Shenoy, A., Sonbas, E., Dermer, C., et al. 2013, ApJ, 778, 3
- Stamatikos et al. (2008) Stamatikos, M., Barthelmy, S. D., Baumgartner, W., et al. 2008, GRB Coordinates Network, 8222, 1
- Stamatikos et al. (2009) Stamatikos, M., Barthelmy, S. D., Baumgartner, W. H., et al. 2009, GRB Coordinates Network, 9290, 1
- Stamatikos et al. (2014) Stamatikos, M., Barthelmy, S. D., Baumgartner, W. H., et al. 2014, GRB Coordinates Network, 16284, 1
- Sugita et al. (2009) Sugita, S., Yamaoka, K., Ohno, M., et al. 2009, PASJ, 61, 521
- Suwa & Ioka (2011) Suwa, Y., & Ioka, K. 2011, ApJ, 726, 107
- Takahashi et al (.2007) Takahashi, T., Abe, K., Endo, M., et al. 2007, PASJ, 59, 35
- Tanvir et al. (2009) Tanvir, N. R., Fox, D. B., Levan, A. J., et al. 2009, Nature, 461, 1254
- Tanvir et al. (2012) Tanvir, N. R., Wiersema, K., Levan, A. J., et al. 2012, GRB Coordinates Network, 13348, 1
- Tagliaferri et al. (2005) Tagliaferri, G., Antonelli, L. A., Chincarini, G., et al. 2005, A&A, 443, L1
- Tashiro et al. (2012) Tashiro, M. S., Onda, K., Yamaoka, K., et al. 2012, PASJ, 64, 26
- Tashiro et al. (2014) Tashiro, M., Ueno, H., & Enomoto, J. 2014, Proceedings of Swift: 10 Years of Discovery (SWIFT 10), held 2-5 December 2014 at La Sapienza University, Rome, Italy, id.164, 164
- Toma et al. (2011) Toma, K., Sakamoto, T., & Mészáros, P. 2011, ApJ, 731, 127
- Toma et al. (2016) Toma, K., Yoon, S.-C., & Bromm, V. 2016, Space Sci. Rev.,
- Totani et al. (2006) Totani, T., Kawai, N., Kosugi, G., et al. 2006, PASJ, 58, 485
- Totani et al. (2014) Totani, T., Aoki, K., Hattori, T., et al. 2014, PASJ, 66, 63
- Totani et al. (2016) Totani, T., Aoki, K., Hattori, T., & Kawai, N. 2016, PASJ, 68, 15
- Trotter et al. (2013) Trotter, A., Lacluyze, A., Reichart, D., et al. 2013, GRB Coordinates Network, 14826, 1
- Tsutsui et al. (2011) Tsutsui, R., Nakamura, T., Yonetoku, D., et al. 2011, PASJ, 63, 741
- Ukwatta et al. (2013) Ukwatta, T. N., Barthelmy, S. D., Gehrels, N., et al. 2013, GRB Coordinates Network, 14781, 1
- Urata et al. (2009) Urata, Y., Huang, K., Im, M., et al. 2009, ApJL, 706, L183
- Urata et al. (2012) Urata, Y., Huang, K., Yamaoka, K., Tsai, P. P., & Tashiro, M. S. 2012, ApJL, 748, L4
- Urata et al. (2014) Urata, Y., Huang, K., Takahashi, S., et al. 2014, ApJ, 789, 146
- Woosley & Heger (2012) Woosley, S. E., & Heger, A. 2012, ApJ, 752, 32
- Yamaoka et al. (2009) Yamaoka, K., Endo, A., Enoto, T., et al. 2009, PASJ, 61, 35
- Yasuda et al. (2015) Yasuda, T., Iwakiri, W. B., Tashiro, M. S., et al. 2015, PASJ, 67, 41
- Yonetoku et al. (2004) Yonetoku, D., Murakami, T., Nakamura, T., et al. 2004, ApJ, 609, 935
- Yonetoku et al. (2010) Yonetoku, D., Murakami, T., Tsutsui, R., et al. 2010, PASJ, 62, 1495
- Yoon et al. (2012) Yoon, S.-C., Dierks, A., & Langer, N. 2012, A&A, 542, A113
- Yoon et al. (2015) Yoon, S.-C., Kang, J., & Kozyreva, A. 2015, ApJ, 802, 16
- Zhang et al. (2014) Zhang, B.-B., Zhang, B., Murase, K., Connaughton, V., & Briggs, M. S. 2014, ApJ, 787, 66