Online Production Validation in a HEP environment
Abstract
Petabytes of data are to be processed and stored requiring millions of CPU-years in high energy particle (HEP) physics event simulation. This enormous demand is handled in worldwide distributed computing centers as part of the LHC computing grid. These significant resources require a high quality and efficient production and the early detection of potential errors. In this article we present novel monitoring techniques in a Grid environment to collect quality measures during job execution. This allows online assessment of data quality information to avoid configuration errors or inappropriate settings of simulation parameters and therefore is able to save time and resources.
1 Introduction
Today’s particle physics experiments are producing a huge amount of data both from direct measurement and simulations. The latter is mandatory to compare theoretical expectations to measured data [1] and requires a detailed description of both the underlying physics processes and the particle interactions in the detector. This process demands significant amounts of computing resources [2], which are provided by LHC computing centers distributed worldwide, the basis of the LHC computing Grid. As an example, in 2012, the ATLAS experiment at the Large Hadron Collider (LHC) has simulated about ten trillion events111Each event represents the detector information on all particles produced in a single particle collision. stored in more than 54 PB of disk space, and more than 100 000 jobs are processed every day. Figure 1 shows a monthly distribution of computing jobs222A job is one collection of programs processing the same physics process. . Any error in processing this vast amount of simulation wastes CPU time and should be avoided.
The requirement of high efficiency and reliability in the production of these simulated events is somewhat at odds with the very high complexity of the simulation programs, which therefore contain a high number of potential sources of mistakes. The simulation programs are configured by a large number of settings describing special physics processes, special particle decay modes, theoretical models and the state of the detector at various energy levels and conditions.
Inappropriate settings may lead to job aborts, which would be easy to detect. However, more difficult to identify are those faulty settings that cause the jobs to terminate technically without errors, but lead to results, which may be useless or even misleading for physics analysis. The complexity and large range of running conditions also imply that inappropriate settings are frequently discovered only after large samples have been produced and intensively used in analyses, wasting a substantial amount of computing and human resources and slowing down results. This requires a rapid employment of data quality tools and a prompt and as much as possible automated response to potential failures.
We argue in this paper that problems can be detected promptly during job processing by an on-line monitoring of production jobs within the grid environment and discuss a tool for this: the ’Job Execution Monitor’ (JEM) [3, 4]. As a side effect, using a tool like JEM leads to a job-based resource monitoring.
In this paper we present the application of such a monitoring program which is used, for example, in ATLAS simulation.

2 Replacing manual by automized Monitoring
The major steps in physics simulation [1] at the LHC towards its use in analysis are depicted in Fig. 2. In this figure the sequence of processing steps is listed. In the first two step events are generated using theoretical models, and particles from this generator stage are tracked in the detector, repectively decays and interactions in the detector material are simulated. In a third step they are digitized, i.e the response of sensors to the interacting particles is modeled. All these steps use Monte Carlo (MC) techniques. Finally physics objects are reconstructed from these signals and the results converted into a physics analysis data format.
To obtain sufficient statistics as well as to check for rare event topologies, tens of millions of events of a certain generator configurations have to be produced. The production of events with identical configurations will be denoted as ’tasks’. To minimize resource losses due to technical failure, each task is parallelized into many computing jobs, typically of 5000 events each.
The tasks are processed serially, i.e. each step has to be finished for all of the generated events, before the next step is started. This leads to a significant latency between the first event generation and its ultimate use in physics analysis can be performed. It also means that a significant amount of resources is employed.
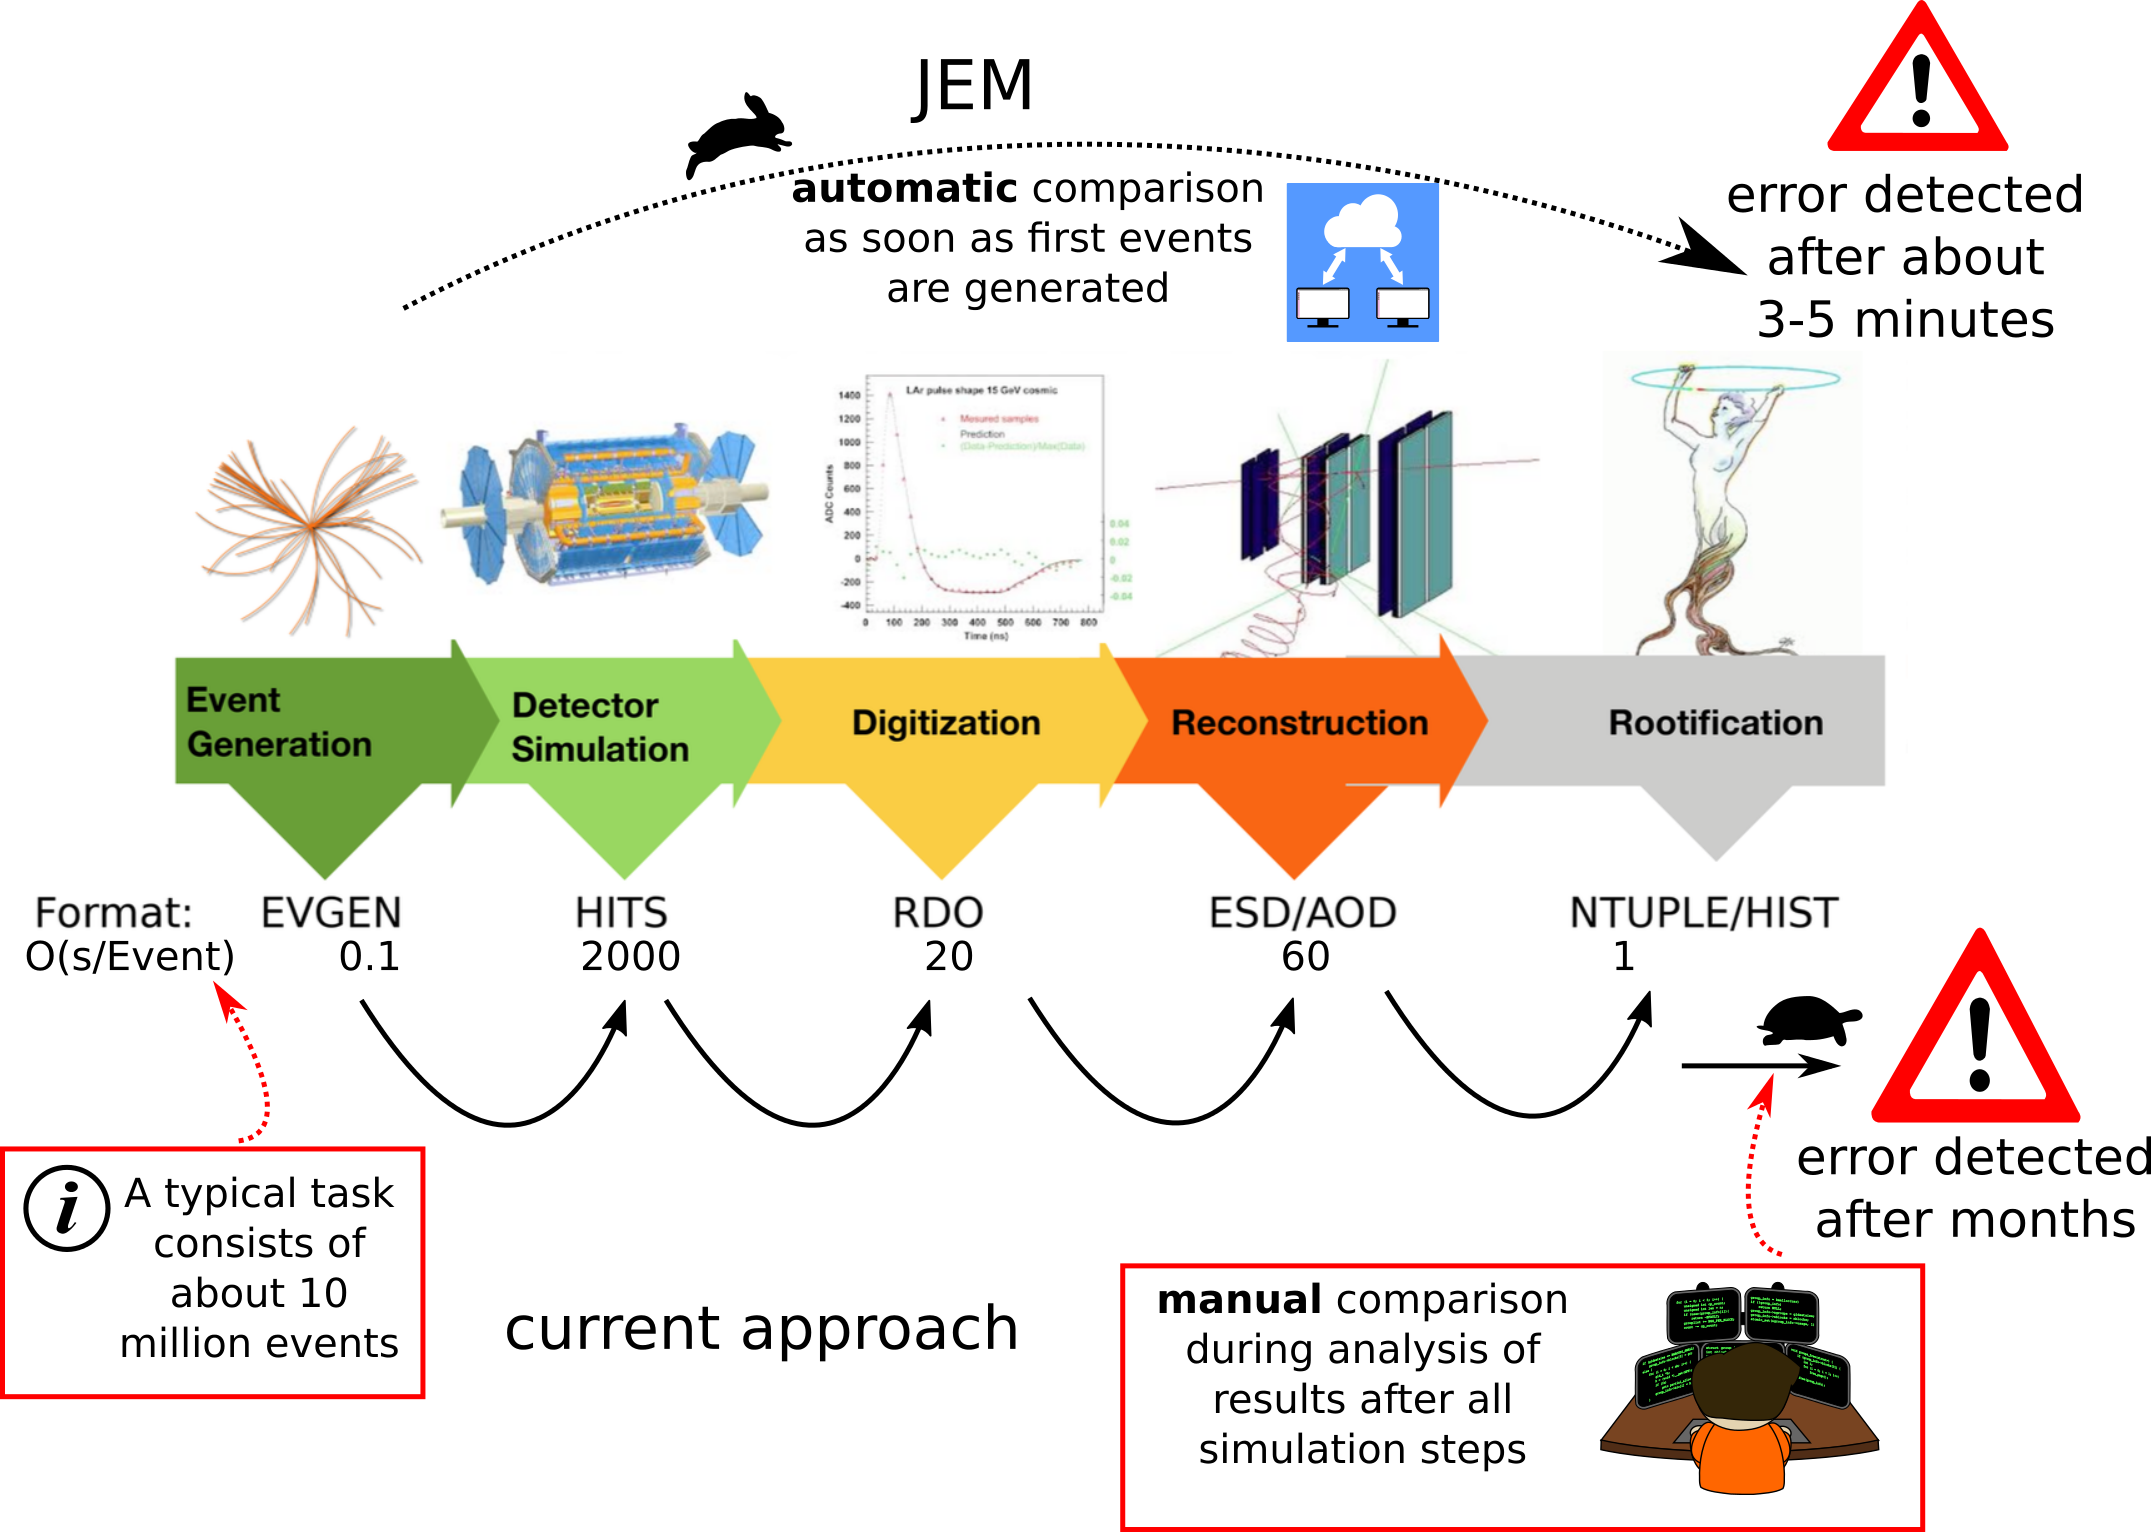
As a consequence, problems, e.g. those introduced in the first step by inadequate parameter settings, are only identified after all events have been processed. For the most part experiments rely on the effort of individual members to check manually many histograms in order to verify the integrity of the results. To perform such evaluation reliably requires a substantial effort, it is time consuming and requires a high level of expertise. Furthermore, comprehensive checks would at best require a significant amount of time and resources. However, this is most often prohibitive given the amount of information that needs to be digested. Therefore this monitoring by hand is delayed and susceptible to failure. In fact, it may happen that such problems are detected only after the simulation results have been used for several months in the analysis.
Instead of manual and lengthy tests, the method that is discussed in this paper is based on two main ingredients:
-
•
the checks are automated with a central tool,
-
•
they are performed during job execution on the grid.
Using such a method provides immediate response and allows one to monitor all kind of relevant data quality information. Moreover, the criteria to identify problems are unambiguously defined and agreed upon. Therefore the proposed automated procedure only needs to be developed once and can be centrally maintained. Monitoring of production jobs can thus be significantly simplified and accelerated to secure an almost immediate response. Furthermore, the observables to be monitored can be expanded without major cost and effort.
In the framework introduced here, these general data quality potentials are applicable on - line and in a grid environment. The procedure can therefore be used to rapidly trigger a termination of jobs, if significant problems are identified thus preventing a waste of computing resources. The procedure is schematically shown for the case of monitoring the generator stage in Fig. 2, where early monitoring has the highest benefit, as errors can be detected before the costly detector simulation stage.
This new concept can be realized in JEM, which has been developed for online and remote data monitoring. While JEM has a wide range of features, in the context of this application, it uses a set of reference histograms and compares them to their respective counterparts while these are being generated in the job.
3 JEM
Before discussing its application to generator validation, the general concept of JEM will be summarized. JEM was originally developed for online monitoring of jobs in a grid environment, where it aimed at identifying causes of execution problems.
The Job Execution Monitor has features to help identifying the reasons for job failures or irregular job behavior based on different metrics taken during job runtime. These metrics include consumption of CPU, memory and disk space, the number of open file descriptors and network throughput. Advanced analysis techniques like online log file analysis and stack trace inspection are available, together with the ability to follow step by step execution of Python and Bash scripts and of binary files that have been prepared before submitting the job to the grid.
JEM is mainly developed using the Python interpreter333The Python part has grown to almost 230.000 lines of code., with few core components written in the programming language C. The web services and database backends are based on the Django framework [6].
In addition to the functionality of the job instrumentation, JEM provides several services at a central machine called "JEMserver". These services include data management, like a database for job monitoring data storage, a web server to display monitoring and validation results and a central file cache.
4 Applying JEM to validation of production
The large potential of JEM can be applied to online data quality. The validation procedure with JEM is based on the comparison of histograms and it has three components. The first one are certified histograms from previous tasks, denoted ’reference histograms’, which are relevant for the task that is to be validated and stored in the central file cache. The second component are histograms which are produced during the processing of the new task and are denoted ’quality histograms’. The production of these histograms and the statistical comparison of reference and quality histograms is performed automatically. In case of a process considered to be identical to a previous reference, an immediate evaluation is provided. In case of the more frequent case that the parameters in the production have been changed even slightly, as a third component a physicist has to ultimately judge the severity of possible disagreements. These steps and the detailed integration into JEM will be discussed next.
4.1 Categories of histograms
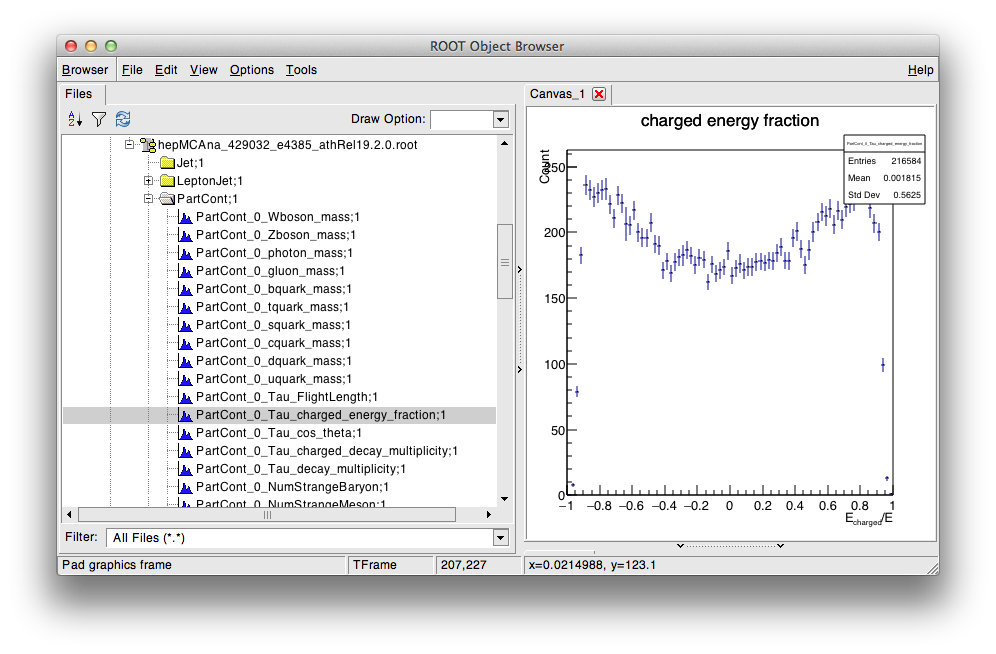
A key issue for the comparison of the simulation tasks is the definition of which distributions to compare. Two standardized production frameworks for histogramming at the generator level are invoked up to now: HepMCAnalysis [7] and RIVET [8]444RIVET is a widely used analysis package in particle physics that contains comparisons of high energy physics data with MC simulations for a large number of processes and analyses. Both produce ROOT [9] histogram collections organized in subdirectories for differently defined analysis types. An example is shown in Fig. 3 for HepMCAnalysis. Expanding JEM validation to more analysis packages can easily be achieved by simply providing a small glue code.
4.2 Relevant JEM infrastructure
The JEM Activation Service is the kernel of the infrastructure (see fig.4). It runs as a central service on the JEMserver, is contacted by every grid job, which is about to start, and decides whether this particular job should be instrumented with JEM or not. In the current test version this decision is steered manually by a web interface, and the monitoring jobs run just after the production task is finished. This service has been optimized for speed, database access is cached and the amount of exchanged data is very small. It could be proven that it holds the load of about 11 jobs per second. Furthermore, a fallback procedure in every job prevents it from failing even if the central server would not respond within a reasonable time frame. Typically within each task around 200 jobs will be instrumented to obtain about a million events allowing sufficient statistical power for each histogram. The additional time overhead needed to run the instrumented jobs is typically of the order of minutes and therefore negligible compared to the total runtime of several hours needed for the simulation and reconstruction of events. A rule engine decides which job will be instrumented, based on the given meta data of the job that is accompanying each request. This meta data includes, among others, information about the location of the job, the submitter, the job type and the job identifier.
As the JEM monitoring component is acting as a payload job’s wrapper, this has full control over its child processes. Once it detects a successfully finished job, further actions can be initiated without notifying the outer batch system about the job’s end, which is especially important for the validation, as will be described in Sec. 4.5.
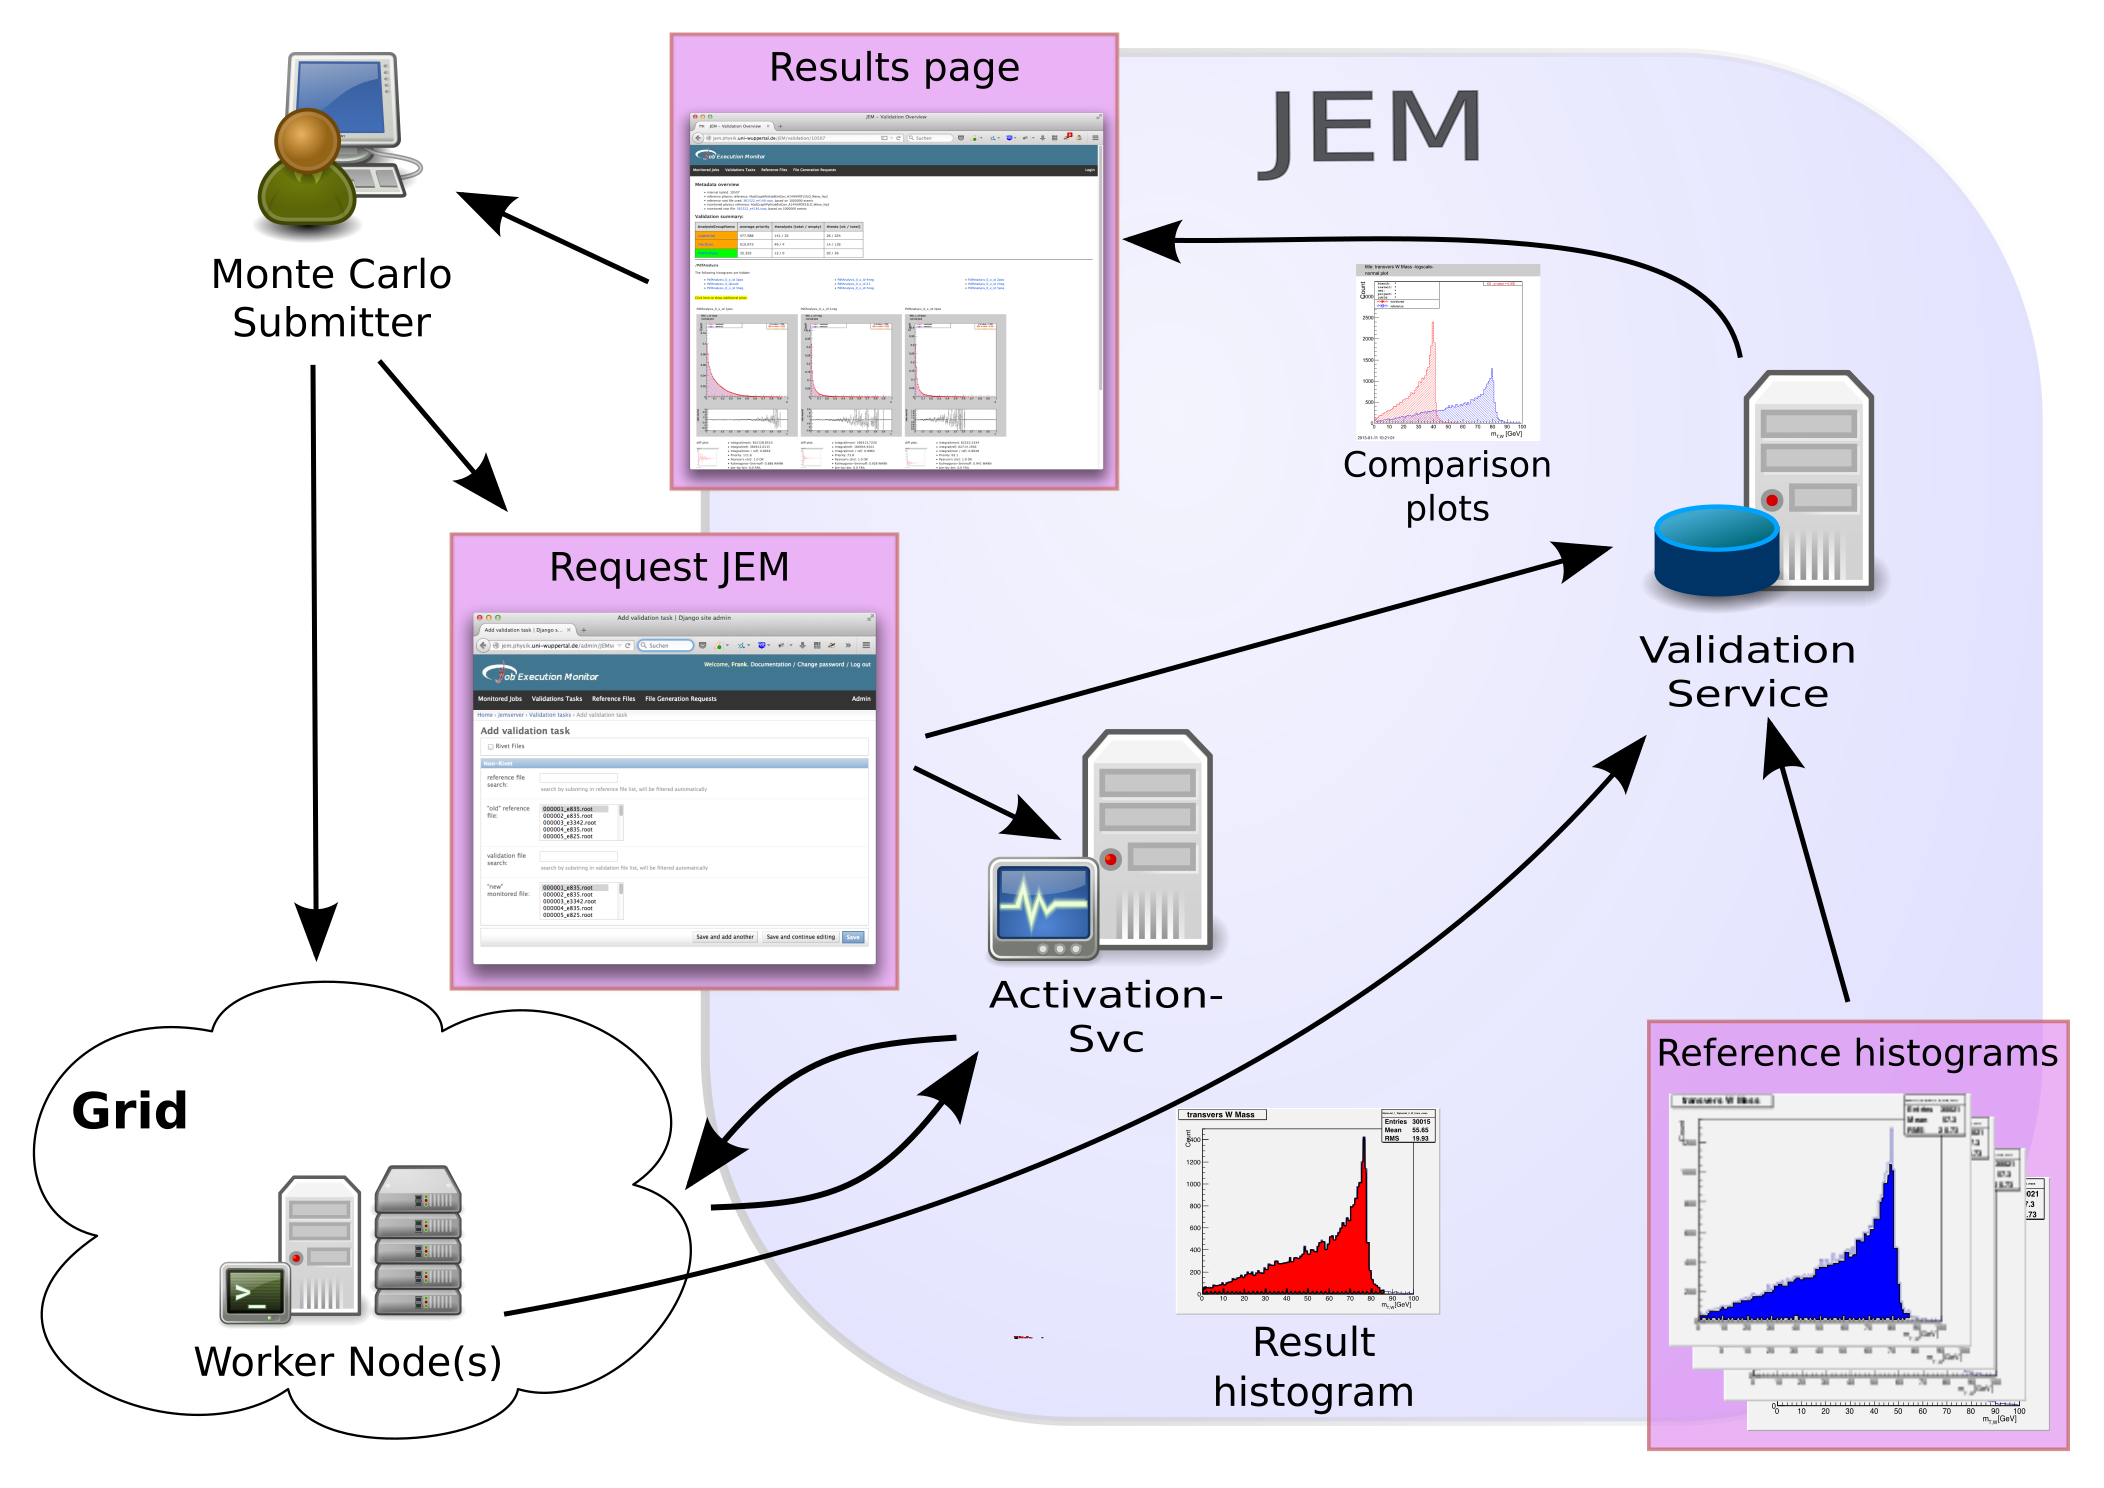
The schematic workflow is shown in Figure 4, and it is explained next.
4.3 Initiating JEM Validation
The validation process within the JEM system is initiated using the JEMserver web interface555http://jem.physik.uni-wuppertal.de/. This initialization step requires an authorized person with a valid account that guarantees data protection measurements by the experiments. The required input data includes the task identifier, the desired number of jobs to be instrumented, and the keywords to select the respective physics analysis module.
The inputs are stored in a database and several services on the JEMserver then either add appropriate rules to the JEM Activation Service or store a search pattern that is regularly executed to find a task matching the given criteria. The rules in the Activation Service keep track of the number of jobs that have been instrumented.
4.4 Quality Histograms
Once jobs have been instrumented with JEM the quality histograms of the same type and format as the reference histograms are created. This comprises more than 200 histograms. The production of quality histograms can be performed online during job execution or offline after the specified jobs have terminated.
| field | description |
|---|---|
| fileName | physical file name on disk |
| dataSetId | ATLAS specific; describing the underlying physics process |
| eTag | software tag: ATLAS specific; a tag associated with a software cache, containing specific software versions |
| swGenTag | version of histogram generation software |
| swConfig | configuration parameters for histogram generation software |
| physRef | description of the underlying physics process |
| ts | timestamp of creation or last update |
| eventCount | number of events the file is based upon |
| generatedWith | histogram generation software |
Once the quality histograms have been created, they are sent to the JEMserver where they are merged and stored in the validation file cache. A database entry is added for each quality histogram collection file (an excerpt of its content is listed in Table 1). This file is also stored at the JEMserver to serve as reference file for future validations.
4.5 Validation process
The comparison between the monitored and the reference histograms is performed by the JEM Validation Service, which is a worker process running on the JEMserver that reacts to state changes of validation tasks in the database. For visualisation purposes and automatic quality control, a standard data quality program, DCube [10] is launched to perform a statistical analysis to estimate the level of agreement between monitored and reference file. This agreement is calculated using one or more statistical tests. Currently these are the Kolmogorov-Smirnoff test and Pearson’s . Each of these statistical tests returns a p-value . An overall estimator, the comparison severity , is calculated using the weighted sum of the individual test results for each histogram comparison,
| (1) |
where is a weight factor that can be set to give preference to certain test results, and whose current default values are set to 1 for both tests. is a simple measure of the inconsistency between both histograms. Histograms are considered consistent and therefore ’ok’, if . Values of would be considered as warning, and values above 0.5 are problematic and should be reviewed. It further allows one to present all histograms of an analysis group in an ordered fashion, e.g. having those with the largest , i.e. the most inconsistent histograms first.
4.6 Validation output web page
The results are stored in a file, containing all results on the comparisons. In order to easily interpret results, they are graphically presented on a web page, an example of which is shown in Fig. 5. An overview of the metadata is given at the top. A summary of the quality of the validation is presented in classes according to the analysis groups. The information contains the average value (’severity’) and the number of non-empty and total histograms. The global agreement can be easily assessed since the outcome is presented using a color code of green, orange and red depending on the number of failed tests.

A more detailed information of potential disagreements is provided by showing the individual distributions. The histograms for the specific analysis modules are also listed (see Fig. 6). Within each module they are ordered according to the magnitude of the severity of the disagreement. Therefore the histograms with the largest discrepancies are displayed on the top. This ensures that the most problematic histograms can be spotted easily. The level of (dis)agreement can be assessed since each quality histogram is overlayed to its reference histogram. Also shown is the ratio between these histograms. Furthermore, the results of the statistical tests are listed.

The fast turnaround and the immediate availability of the results on a web page provide an easy and fast tool for validation purposes. All necessary actions run automatically in the background and can also be easily configured using a web interface.
Although these validation steps run automatically, the assessment from experts is required in order to judge the importance of potential differences. This manual judgement is needed since very rarely tasks are submitted under identical conditions, but differences are expected due to changes in parameter settings or new versions of generators to be validated.
5 Operational experience
In the two years since the first prototype of the JEM Validation Service was launched manually, more than 540 different task validations have been initiated by the users of the ATLAS production system. This represents 197,660 individual histogram comparisons that had to be evaluated. Overall the JEM Validation Service created 409 quality histogram files based on 345,703,764 events. As described in Sec. 4.1, two different publicly available analysis software tools, HepMCAnalysis [7] and RIVET [8], are used to create the histograms to compare a reference MC sample with the monitor MC sample to be validated. In both cases, JEM is very simple to use, therefore the ATLAS Collaboration employed offline shift personnel to overview the validation, which was possible with only a small amount of training.
In practice the very large majority of the tasks showed no problematic distributions. The ease to interpret results, e.g. the colour coding, has saved the MC validation shifters a significant amount of time and resources. This made JEM crucial for a fast and reliable use of simulation. In addition some tasks led to inappropriate results and were quickly discovered using JEM. Some examples are given in Ref [11]. As will be discussed next, JEM helped to quickly validate new versions of Monte Carlo generators.
5.1 PYTHIA validation
One example involves the validation of PYTHIA 6.428 [12] which was compared to PYTHIA 6.427 as reference. This was the first validation campaign of PYTHIA in the ATLAS collaboration using JEM. It became apparent that the reference version PYTHIA 6.427 had problems that previously remained undiscovered. This shows that the systematic validation with JEM represents a large improvement compared to previous validation methods. The blue distribution in Fig. 7, shows the the pseudorapidity distribution of the leptons that passed tight selection requirements in the Drell–Yan production, . The two additional partons in the matrix element were generated using the ALPGEN generator [13], to match parton showering and matrix element partons the MLM procedure [14] was invoked and the string fragmentation model was used to build primary hadrons from the final partons.
Apparently, the reference sample has a problem, because the distribution is not symmetric, in contrast to the expectation. The red distribution shows the same observable in the next PYTHIA version PYTHIA 6.428, showing that the problems were fixed in this version.
Only through the systematic investigation using JEM this error was discovered by ATLAS. Consequently, the version PYTHIA 6.427 was discarded from further usage.
On the other hand, JEM was also used to quickly check if intended changes in the distributions are actually realised. An example from the two versions of PYTHIA is shown in Figure 7 (right). Here the distributions of the jet mass squared over is displayed. This shows that both versions differ in the simulation, a result that was expected since for the newer version some changes in the PYTHIA string fragmentation simulation were implemented by the authors.


5.2 SHERPA validation
Another example where the systematic MC validation with JEM found previously unknown problems involved the validation campaign of SHERPA[16].
SHERPA 1.4 was a multileg generator containing tree-level matrix elements. For the +jets production process this involved the multi-parton matrix elements for +0 jets, +1 jet, +2 jets, and +3 jets in leading order (LO) Quantumchromodynamics (QCD) combined with the QCD parton cascades following the CKKW merging scheme [15], and fragmentation of partons into primary hadrons described using a phenomenological cluster-hadronisation model.
SHERPA 2.1.0 was one of the first publicly available versions of this multileg generator that included also matrix elements in next-to-leading order (NLO) QCD. In case of +jets production, this version contained matrix elements of +0 jets, +1 jet, and +2 jets in NLO QCD, and +3 jets, +4 jets in LO QCD, matched to parton showers using the CKKW method. This version represented a major step in developing MC multileg generators including NLO QCD matrix elements. Since the changes to previous versions were large, a very careful MC validation was necessary. The systematic MC validation method using JEM was essential in this task.
During the validation of SHERPA 2.1.0 problems became obvious. Generating +jets events with subsequent decay in proton–proton scattering at a centre-of-mass energy of 8 TeV, for example, displayed asymmetric distributions of the pseudorapidity of hadrons including charm or bottom flavour, while those distributions were expected to be symmetric as predicted in SHERPA 1.4. After private communication with the SHERPA authors, this problem could be traced to an error in the multiple parton interaction matrix elements, which was fixed in version SHERPA 2.1.1.
This
can be seen in Fig. 8 where the pseudorapidity
distributions for charm hadrons (left) and for bottom
hadrons (right) are compared between the repaired version SHERPA 2.1.1
(red) and the problematic version SHERPA 2.1.0
(blue). As a result, in version SHERPA 2.1.1, the pseudorapidity distributions of charm and bottom hadrons are
now symmetric.
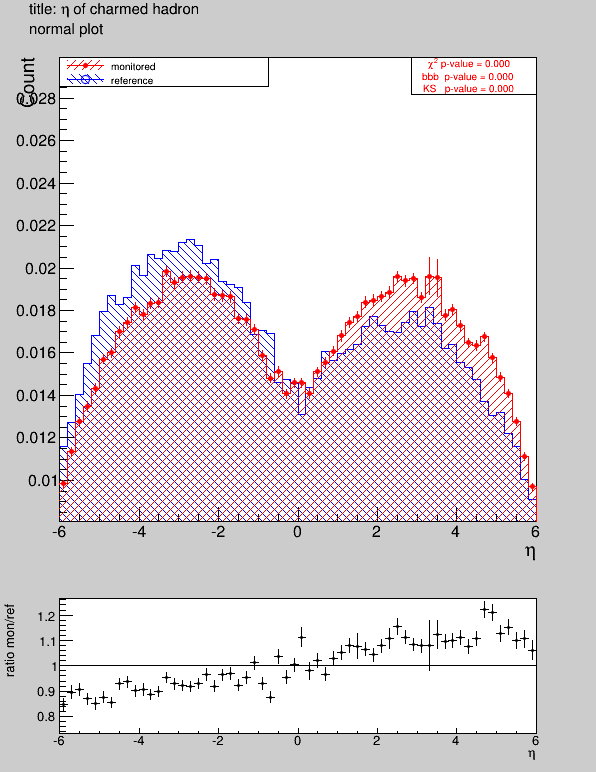
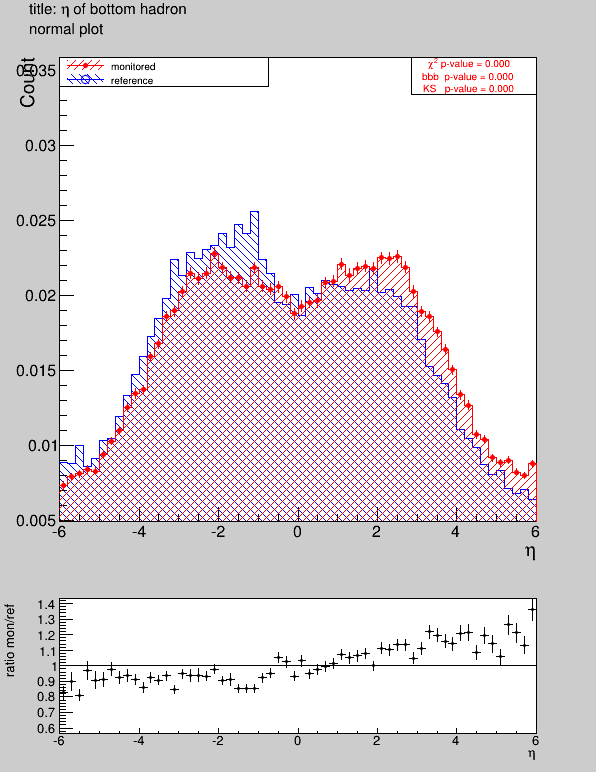
This is another example that through the systematic MC validation with JEM, a prompt identification of issues within a new release of generators was possible. This information and the large set of plots produced by JEM was of tremendous help for the SHERPA authors to fix this and further problems.666In a similar way, for example, a problem in the shower simulation of partons produced close to the beam axis was found which led to a modification in the next SHERPA 2.2.0 version. Furthermore, it prevented mass production of mis-confugured samples by the ATLAS and CMS collaborations and therefore saved an enormous amount of CPU resources.
6 Summary & Outlook
In this paper a new validation tool based on the Job Execution Monitor (JEM) is presented. JEM is ready to run inside the Grid framework as a payload and automatically collects and compares quality measures of simulated physics processes during event generation. Utilizing its current test version that allows manual steering by a web interface, JEM has already become a standard to validate ATLAS simulation and gives ATLAS users the opportunity to detect inappropriate results due to mis - configurations in Monte - Carlo generators and unexpected features of simulation tasks. It accomplishes this by automatically comparing and classifying certified reference histograms with the new ones produced during simulation. This aids in early discovery of problems and avoids a waste of resources and time. It has also been extremely helpful in validating new versions of QCD generators.
The results and the user interface are presented as a web service. With an easy color code and sorted histograms, where only the most important ones are displayed, a quick assessment of the level of agreement can be achieved. This mode of presentation was tested in practice and improved in collaboration with the ATLAS Monte Carlo working group and their shifters. The overhead of generating the validation plots and the automatic comparison of histograms is negligable compared to the runtime of typical simulation tasks.
It is currently investigated to automatically instrument a small fraction of every generator task within ATLAS. This would give quality histograms, which would be readily available should the need arise to inspect them.
Whereas currently JEM is used at the early generator stage of the simulation chain, its validation system can be expanded to other stages, such as simulation, digitization or reconstruction and beyond. Also in this case a significant saving of time and resources can be expected. The simplicity of JEM installation and operation makes it also possible to use it outside ATLAS and HEP experiments.
7 Acknowledgements
We like to thank Leonid Serkin and Maria Moreno Llacer, together with the ATLAS generator validation team, for their invaluable feedback on using the JEM Validation Service. It helped to improve the overall structure and user experience. We are grateful to Markus Elsing and Marcello Vogel for very helpful comments on the text. Also, we would like to thank Frank Ellinghaus for discussions and Ewelina Lobodzinska for the computing support and Nataliia Kondrashova for the HepMCAnalysis modules.
References
- [1] G. Aad et al. The ATLAS Simulation Infrastructure. Eur. Phys. J., C70:823, 2010.
- [2] E. Karavakis et al. [ATLAS Collaboration], Common Accounting System for Monitoring the ATLAS Distributed Computing Resources, J. Phys. Conf. Ser. 513 (2014) 062024.
- [3] Tim dos Santos. New approaches in user-centric job monitoring on the LHC Computing Grid. Ph.D. thesis, Bergische Universität Wuppertal, 2011.
- [4] T. dos Santos et al., Application of remote debugging techniques in user-centric job monitoring, J. Phys. Conf. Ser. 368 (2012) 012012.
- [5] C. Debenedetti, Concepts for fast large scale Monte Carlo production for the ATLAS experiment, ATL-SOFT-SLIDE-2013-790, Oct 2013, URL http://cds.cern.ch/record/1605835.
- [6] The Web framework for perfectionists with deadlines | Django, 2014. URL https://www.djangoproject.com.
- [7] Sebastian Johnert. Measurement of the cross section in proton-proton collisions at ATLAS and the development of the HePMCAnalysis tool. Ph.D. thesis, Hamburg U., 2012. URL http://www-library.desy.de/cgi-bin/showprep.pl?thesis12-009.
- [8] Andy Buckley et al. Rivet user manual, arXiv:1003.0694 [hep-ph].
- [9] Rene Brun et al. ROOT - An Object Oriented Data Analysis Framework. In Proceedings AIHENP’96 Workshop, Lausanne, Sep. 1996, Nucl. Inst. & Meth. in Phys. Res. A 389, 1997. See also http://root.cern.ch/.
- [10] DCube Documentation, 2014. URL https://twiki.cern.ch/twiki/bin/view/Sandbox/DCubeDoc.
- [11] ATLAS Collaboration, Validation of Monte Carlo event generators in the ATLAS Collaboration for LHC Run 2, Jan 2016, ATL-PHYS-PUB-2016-001, URL http://cds.cern.ch/record/2119984.
- [12] T. Sjostrand, S. Mrenna and P. Z. Skands, JHEP 0605, 026 (2006).
- [13] M. L. Mangano, M. Moretti, F. Piccinini, R. Pittau and A. D. Polosa, JHEP 0307, 001 (2003).
- [14] M. L. Mangano et al., Nucl. Phys. B 632, 343 (2002), arXiv:hep-ph/0108069.
- [15] S. Catani, F. Krauss, R. Kuhn and B. R. Webber, JHEP 0111, 063 (2001) doi:10.1088/1126-6708/2001/11/063 [hep-ph/0109231].
- [16] T. Gleisberg et al., J. High Energy Phys. 02, 007 (2009),