Low-dimensional Data Embedding via Robust Ranking
Abstract.
We describe a new method called -ETE for finding a low-dimensional embedding of a set of objects in Euclidean space. We formulate the embedding problem as a joint ranking problem over a set of triplets, where each triplet captures the relative similarities between three objects in the set. By exploiting recent advances in robust ranking, -ETE produces high-quality embeddings even in the presence of a significant amount of noise and better preserves local scale than known methods, such as t-STE and t-SNE. In particular, our method produces significantly better results than t-SNE on signature datasets while also being faster to compute.
1. Introduction
Learning a metric embedding for a set of objects based on relative similarities is a central problem in human computation and crowdsourcing. The application domain includes a variety of different fields such as recommender systems and psychological questionnaires. The relative similarities are usually provided in the form of triplets, where a triplet expresses that “object is more similar to object than to object ”, for which the similarity function may be unknown or not even quantified. The first object is referred to as the query object and objects and are the test objects. The triplets are typically gathered by human evaluators via a data-collecting mechanism such as Amazon Mechanical Turk111https://www.mturk.com. These types of constraints have also been used as side information in semi-supervised metric learning (Davis et al., 2007; Liu et al., 2012) and clustering (Amid et al., 2015).
Given a set of relative similarity comparisons on a set of objects, the goal of triplet embedding is to find a representation for the objects in some metric space such that the constraints induced by the triplets are satisfied as much as possible. In other words, the embedding should reflect the underlying similarity function from which the constraints were generated. Earlier methods for triplet embedding include Generalized Non-metric Multidimensional Scaling (GNMDS) (Agarwal et al., 2007), Crowd Kernel Learning (CKL) (Tamuz et al., 2011), and Stochastic Triplet Embedding (STE) and extension, t-distributed STE (t-STE) (van der Maaten and Weinberger, 2012).
One major drawback of the previous methods for triplet embedding is that their performance can drop significantly when a small amount of noise is introduced in the data. The noise may arise due to different reasons. For instance, each human evaluator may use a different similarity function when comparing objects (Amid and Ukkonen, 2015). As a result, there might exist conflicting triplets with reversed test objects. Another type of noise could be due to the insufficient degree of freedom when mapping an intrinsically (and possibly hidden) high-dimensional representation to a lower-dimensional embedding. A simple example is mapping uniformly distributed points on a two-dimensional circle to a one-dimensional line; regardless of the embedding, the end points of line will always violate some similarity constraints.
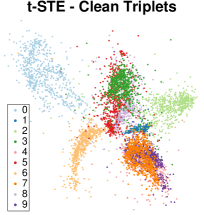
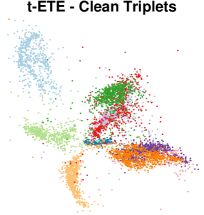
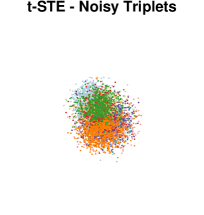
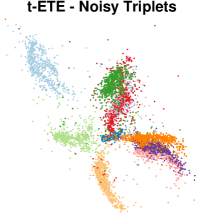
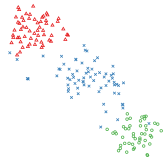
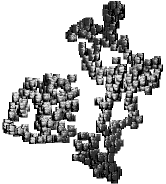
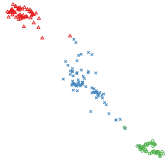
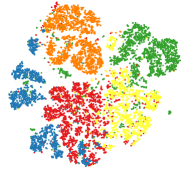
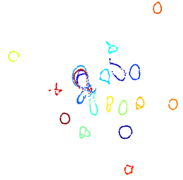
In this paper, we cast the triplet embedding problem as a joint ranking problem. In any embedding, for each object , the remaining object are naturally ranked by their “distance” to . The triplet expresses that the object should be ranked higher than object for the ranking of . Therefore, triplet embedding can be viewed as mapping the objects into a Euclidean space so that the joint rankings belonging to all query objects are as consistent (with respect to the triplets) as possible. In order to find the embedding, we define a loss for each triplet and minimize the sum of losses over all triplets. Initially our triplet loss is unbounded. However in order to make our method robust to noise, we apply a novel robust transformation (using the generalized function), which caps the triplet loss by a constant. Our new method, -Exponential Triplet Embedding (-ETE)222The acronym t-STE is based on the Student-t distribution. Here, “t” is part of the name of the distribution. Our method, -ETE, is based on -exponential family. Here, is a parameter of the model., inherits the heavy-tail properties of t-STE in producing high-quality embeddings, while being significantly more robust to noise than any other method. Figure 1 illustrates examples of embeddings of a subset of data points from the MNIST dataset using t-STE and our proposed method. The triplets are synthetically generated by sampling a random point from one of the -nearest neighbors for each point and another point from those that are located far away ( triplets for each point). The two embeddings are very similar when there is no noise in the triplets (Figures 1 and 1). However, after ‘reversing’ of the triplets, t-STE fails to produce a meaningful embedding (Figure 1) while -ETE is almost unaffected by the noise (Figure 1).
We also apply our -ETE method to dimensionality reduction and develop a new technique, which samples a subset of triplets in the high-dimensional space and finds the low-dimensional representation that satisfies the corresponding ranking. We quantify the importance of each triplet by a non-negative weight. We show that even a small carefully chosen subset of triplets capture sufficient information about the local as well as the global structure of the data to produce high-quality embeddings. Our proposed method outperforms the commonly used t-SNE (Maaten and Hinton, 2008) for dimensionality reduction in many cases while having a much lower complexity.
2. Triplet Embedding via Ranking
In this section we formally define the triplet embedding problem. Let denote a set of objects. Suppose that the feature (metric) representation of these objects is unknown. However, some information about the relative similarities of these objects is available in the form of triplets. A triplet is an ordered tuple which represents a constraint on the relative similarities of the objects , , and , of the type “object is more similar to object than to object .” Let denote the set of triplets available for the set of objects .
Given the set of triplets , the triplet embedding problem amounts to finding a metric representation of the objects, , such that the similarity constraints imposed by the triplets are satisfied as much as possible by a given distance function in the embedding. For instance, in the case of Euclidean distance, we want
| (1) |
The reason that we may not require all the constraints to be satisfied in the embedding is that there may exist inconsistent and/or conflicting constraints among the set of triplets. This is a very common phenomenon when the triplets are collected via human evaluators via crowdsourcing (Wilber et al., 2014; Amid and Ukkonen, 2015).
We can consider the triplet embedding problem as a ranking problem imposed by the set of constraints . More specifically, each triplet can be seen as a partial ranking result where for a query over , we are given two results, namely and , and the triplet constraint specifies that “the result should have relatively higher rank than ”. In this setting, only the order of closeness of test objects to the query object determines the ranking of the objects.
Let us define to be non-negative loss associated with the triplet constraint . To reflect the ranking constraint, the loss should be a monotonically increasing (decreasing) function of the pairwise distance (). These properties ensure that whenever and . We can now define the triplet embedding problem as minimizing the sum of the ranking losses of the triplets in , that is,
| (2) |
In the above formulation, the individual loss of each triplet is unbounded. This means that in cases where a subset of the constraints are corrupted by noise, the loss of even a single inconsistent triplet may dominate the total objective (2) and result in a poor performance. In order to avoid such effect, we introduce a new robust transformation to cap the individual loss of each triplet from above by a constant. As we will see, the capping helps to avoid the noisy triplets and produce high-quality embeddings, even in the presence of a significant amount of noise.
3. Robust Loss Transformations
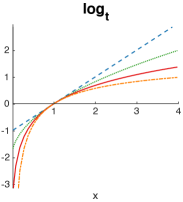
We first introduce the generalized and functions as the generalization of the standard and functions, respectively. The generalized function with temperature parameter is defined as (Naudts, 2002, 2004b)
| (3) |
Note that is concave and non-decreasing and generalizes the function which is recovered in the limit . The function is defined as the inverse of function.
| (4) |
where . Similarly, the standard is recovered in the limit . Figure 2 and 2 illustrate the and functions for several values of .
One major difference with the standard and functions is that the familiar distributive properties do not hold in general: and . An important property of is that it decays to zero slower than for values of . This motivates defining heavy-tailed distributions using the function. More specifically, the -exponential family of distributions is defined as a generalization of the exponential family by using the function in place of the standard function (Naudts, 2004a; Sears, 2010).
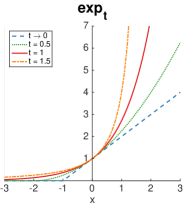
Our main focus is the capping property of the function: for values , the function with grows slower than the function and reaches the constant value in the limit . This idea can be used to define the following robust loss transformation on the non-negative unbounded loss :
| (5) |
Note that , as desired. Moreover, the derivative of the transformed loss as along with the additional property that the loss function converges to a constant as , i.e., . We will use this transformation to develop a robust ranking approach for the problem of the triplet embedding in presence of noise in the set of constraints.
Finally, note that setting yields the transformation
| (6) |
which has been used for robust binary ranking in (Yun et al., 2014). Note that grows slower than , but still as . In other words, the transformed loss will not be capped from above. We will show that this transformation is not sufficient for robustness to noise.
4. -Exponential Triplet Embedding
Building on our discussion on the heavy-tailed properties of generalized exp function (4), we can define the ratio
| (7) |
with as the loss of the ranking associated with the triplet . The loss is non-negative and satisfies the properties of a valid loss for ranking, as discussed earlier. Note that due to heavy-tail of function with , the loss function (7) encourages relatively higher-satisfaction of the ranking compared to, e.g., standard function.
Defining the loss of each triplet as the ranking loss in (7), we formulate the objective of the triplet embedding problem as minimizing the sum of robust transformations of individual losses, that is,
| (8) |
in which, . We call our method -Exponential Triplet Embedding (-ETE, for short). Note that the loss of each triplet in the summation is now capped from above by . Additionally, the gradient of the objective function (8) with respect to the positions of the objects
| (9) |
includes additional forgetting factors that damp the effect of those triplets that are highly-unsatisfied.
5. Connection to Previous Methods
Note that by setting , we can use the property of the log function to write the objective (8) as the following equivalent maximization problem333Note that in general.
| (10) |
where
| (11) |
is defined as the probability that the triplet is satisfied. Setting and recovers the STE and t-STE (with ) formulations, respectively444The Student-t distribution with degrees of freedom can be written in form of a -exponential distribution with (see (Ding and Vishwanathan, 2010)).. STE (and t-STE) aim to maximize the joint probability that the triplets are satisfied in the embedding . The poor performance of STE and t-STE in presence of noise can be explained by the fact that there is no capping of the log-satisfaction probabilities555Note that in this case, the probabilities should be capped from below. of each triplet (see (6)). Therefore, the low satisfaction probabilities of a the noisy triplet dominates the objective function (10) and thus, results in poor performance.
6. Applications to Dimensionality Reduction
Now, consider the case where a high-dimensional representation is provided for a set of objects. Having the -ETE method in hand, one may ask the following question: “given the high-dimensional representation for the objects, is it possible to find a lower-dimensional representation for these objects by satisfying a set of ranking constraints (i.e., triplets), formed based on their relative similarities in the representation ?”. Note that the total number of triplets that can be formed on a set of objects is and trying to satisfy all the possible triplets is computationally expensive. However, we argue that most of the these triplets are redundant and contain the same amount of information about the relative similarity of the objects. For instance, consider two triplets and in which and are located far away and and are neighbors of each other. Given , having provides no extra information on the placements of and , as long as and are located close together in the embedding. In other words, and are viewed by as almost being the same object.
Note that for each object , the nearby objects having relatively short distance to specify the local structure of the object, whereas those that are located far away determine the global placement of in the space. For that matter, for each query object , we would like to consider those triplets (with high probability) that preserve both local and global structure of the data. Following the discussion above, we emphasize on preserving the local information by explicitly choosing the first test object among the nearest-neighbors of the query object . The global information of the object is then preserved by considering a small number of objects, uniformly sampled from those that are located farther away. This leads to the following procedure for sampling a set of informative triplets. For each object , we choose the first object from the set of -nearest neighbors of and then, sample the outlier object uniformly from those that are located farther away from than the first object. This is equivalent to sampling a triplet uniformly at random conditioned on that the first test object is chosen among the -nearest neighbors of . We use equal number of nearest-neighbors and outliers for each point, which results in triplets in total.
The original -ETE formulation aims to satisfy each triplet equally likely. This would be reasonable in cases where no side information about the extent of each constraint is provided. However, given the high-dimensional representation of the objects , this assumption may not be accurate. In other words, the ratio of the pairwise similarities of the objects specified in each triplet may vary significantly among the triplets. To account for this variation, we can introduce a notion of weight for each triplet to reflect the extent that the triplet needs to be satisfied. More formally, let denote the weight associated with the triplet and let denote the set of all triplet weights. The Weighted -ETE can be formulated as minimizing the sum of weighted capped losses of triplets, that is,
| (12) |
The -ETE method can be seen as a special case of the weighted triplet embedding formulation where all the triplets have unit weights.
Finally, to assign weights to the sampled triplets, we note that the loss ratio in (7) is inversely proportional to how well the triplet is satisfied in the embedding. This suggests using the inverse loss ratios of the triplets in the high-dimensional space as the weights associated with the triplets. More formally, we set
| (13) |
where is a constant scaling factor for the pair . We set to the distance of to its -th nearest neighbor. This choice of scaling adaptively handles the dense as well as the sparse regions of data distribution. Finally, the choice of function rather than using with is to have more emphasis on the distances of the objects in the high-dimensional space. The pseudo-code for the algorithm is shown in Algorithm 1. In practice, dividing each weight at the end by the maximum weight in and adding a constant positive bias to all weight improves the results.
Note that both sampling and weighting the triplets using (13) and calculating the gradient of loss requires calculating the pairwise distances only between objects in the high-dimensional space (for instance, by using efficient methods to calculate -nearest neighbors such as (Hyvönen et al., 2015)) or the low-dimensional embedding. In many cases, , which results in a huge computational advantage over complexity of t-SNE.
7. Experiments
In this section, we conduct experiments to evaluate the performance of -ETE for triplet embedding as well the application of Weighted -ETE for non-linear dimensionality reduction. In the first set of experiments, we compare -ETE to the following triplet embedding methods: ) GNMDS, ) CKL, ) STE, and ) t-STE. We evaluate the generalization performance of the different methods by means of satisfying unseen triplets and the nearest-neighbor error, as well as their robustness to constraint noise. We also provide visualization results on two real-world datasets. Next, we apply the Weighted -ETE method for non-linear dimensionality reduction and compare the result to the t-SNE method. The code for the (Weighted) -ETE method as well as all the experiments will be publicly available upon acceptance.
|
|
|
|
|
|
|
|
| (a) | (b) | (c) | (d) |
|
|
|
|
|
|
|
|
| (e) | (f) | (g) | (h) |
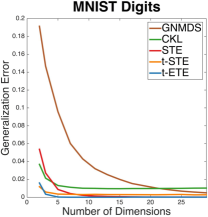
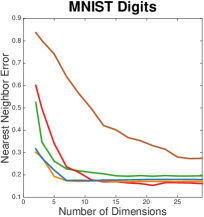
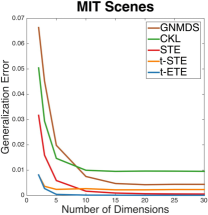
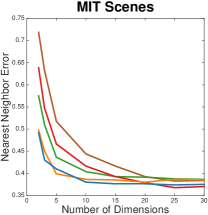
7.1. Generalization and Nearest-Neighbor Error
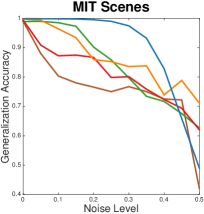
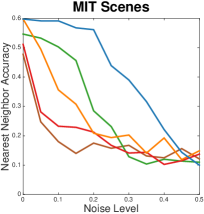
We first evaluate the performance of different methods by means of generalization to unseen triplets as well as preserving the nearest-neighbor similarity. For this part of experiments, we consider the MNIST Digits 666http://yann.lecun.com/exdb/mnist/ (1000 subsamples) and MIT Scenes 777http://people.csail.mit.edu/torralba/code/spatialenvelope/ (800 subsamples) datasets. The synthetic triplets are generated as mentioned earlier ( triplets per point). To evaluate the generalization performance, we perform a -fold cross validation and report the fraction of held-out triplets that are unsatisfied as a function of number of dimension. This quantity indicates how well the method learns the underlying structure of the data. Additionally, we calculate the nearest-neighbor error as a function of number of dimensions. The nearest-neighbor error is a measure of how well the embedding captures the pairwise similarity of the objects based on relative comparisons. The results are shown in Figure 3-3. As can be seen, -ETE performs as good as the best performing method or even better on both generalization and nearest-neighbor error. This indicates that -ETE successfully captures the underlying structure of the data and scales properly with the number of dimensions.
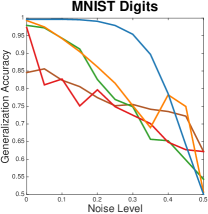
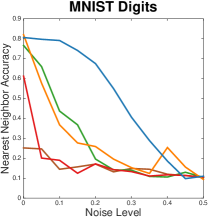
7.2. Robustness to Noise
Next, we evaluate the robustness of the different methods to triplet noise. To evaluate the performance, we generate a different test set for both datasets with the same number of triplets as the training set. For each noise level, we randomly subsample a subset of training triplets and reverse the order of the objects. After generating the embedding, we evaluate the performance on the test set and report the fraction of the test triplets that are satisfied as well as the nearest-neighbor accuracy. The results are shown in Figure 3-3. As can be seen, the performance of all the other methods starts to drop immediately when only a small amount of noise is added to the data. On the other hand, -ETE is very robust to triplet noise such that the performance is almost unaffected for up to of noise. This verifies that -ETE can be effectively applied to real-world datasets where a large portion of the triplets may have been corrupted by noise.
7.3. Visualization Results
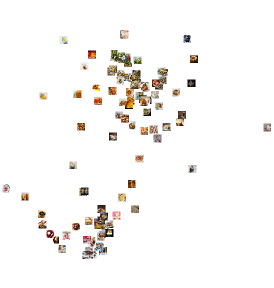
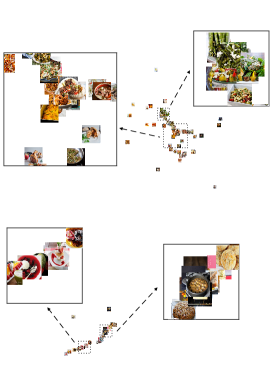
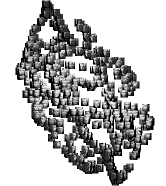
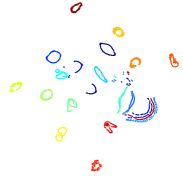
We provide visualization results on the Food (Wilber et al., 2014) and Music (Ellis et al., 2002) datasets. Figures 4 and 4 illustrate the results on the Food dataset using t-STE and -ETE (), respectively. The same initialization for the data points is used for the both methods. As can be seen, no clear clusters are evident using the t-STE method. On the other hand, -ETE reveals three main clusters in the data: “Vegetables and Meals” (top), “Ice creams and Deserts” (bottom left), and “Breads and Cookies” (bottom right).
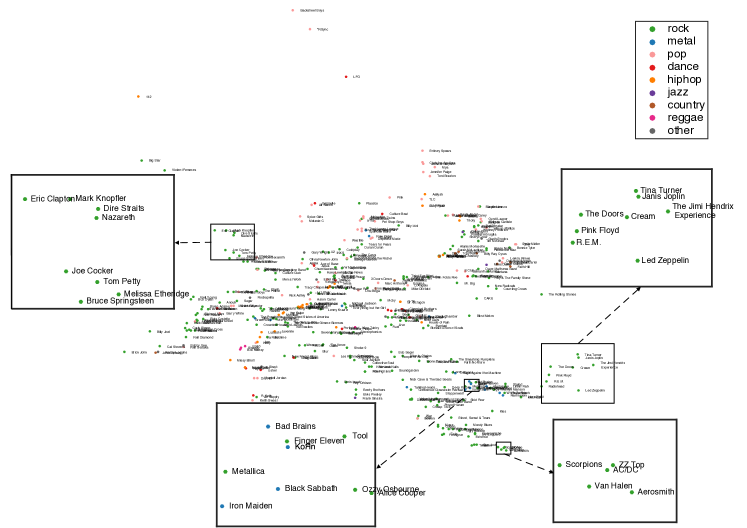
The visualization of the Music dataset using the -ETE method () is shown in Figure 5. The result can be compared with the one using the t-STE method888Available on homepage.tudelft.nl/19j49/ste. The distribution of the artists and the neighborhood structure are similar for both methods, but more meaningful in some regions using the -ETE method. This can be due to the noise in the triplets that have been collected via human evaluators. Additionally, -ETE results in nearest-neighbor error on the data points compared to error using t-STE.
7.4. Dimensionality Reduction Results
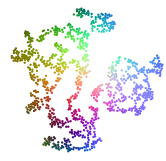
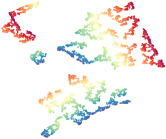
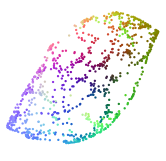
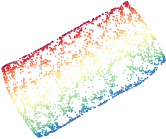
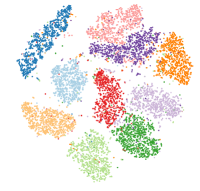
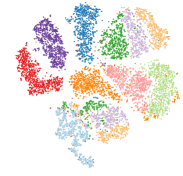
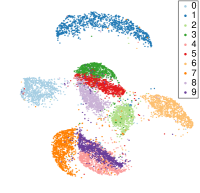
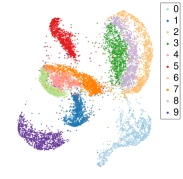
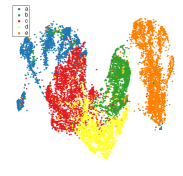
We apply the weighted triplet embedding method to find a -dimensional visualization of the following datasets: ) Wine999UCI repository., ) Sphere ( uniform samples from a surface of a three-dimensional sphere101010research.cs.aalto.fi/pml/software/dredviz/), ) Swiss Roll ( sub-samples111111web.mit.edu/cocosci/isomap/datasets.html), ) Faces ( synthetic faces with different pose and lighting), ) COIL-20121212www1.cs.columbia.edu/CAVE/software/softlib/coil-20.php, ) MNIST ( sub-samples), and ) USPS ( images of handwritten digits131313www.cs.nyu.edu/~roweis/data.html). We compare our results with those obtained using the t-SNE method. In all experiments, we use for our method (for COIL-20, we use ) and bias . The results are shown in Figure 6.
As can be seen, our method successfully preserves the underlying structure of the data and produces high-quality embedding on all datasets, both having an underlying low-dimensional manifold (e.g., Swiss Roll), or clusters of points (e.g., USPS). On the other hand, in most cases, t-SNE over-emphasizes the separation of the points and therefore, tears up the manifold. The same effect happens for the clusters, e.g., in the USPS dataset. The embedding forms multiple separated sub-clusters (for instance, the clusters of points ‘’s, ‘’s, and ‘’s are divided into several smaller sub-clusters). Our objective function also enjoys better convergence properties and converges to a good solution using simple gradient descent. This eliminates the need for more complex optimization tricks such as momentum and early over-emphasis, used in t-SNE.
8. Conclusion
We introduced a ranking approach for embedding a set of objects in a low-dimensional space, given a set of relative similarity constraints in the form of triplets. We showed that our method, -ETE, is robust to high level of noise in the triplets. We generalized our method to a weighted version to incorporate the importance of each triplet. We applied our weighted triplet embedding method to develop a new dimensionality reduction technique, which outperforms the commonly used t-SNE method in many cases while having a lower complexity and better convergence behavior.
References
- (1)
- Agarwal et al. (2007) Sameer Agarwal, Josh Wills, Lawrence Cayton, Gert Lanckriet, David Kriegman, and Serge Belongie. 2007. Generalized Non-metric Multidimensional Scaling. In Proceedings of the Eleventh International Conference on Artificial Intelligence and Statistics. San Juan, Puerto Rico.
- Amid et al. (2015) Ehsan Amid, Aristides Gionis, and Antti Ukkonen. 2015. A kernel-learning approach to semi-supervised clustering with relative distance comparisons. In Joint European Conference on Machine Learning and Knowledge Discovery in Databases. Springer, 219–234.
- Amid and Ukkonen (2015) Ehsan Amid and Antti Ukkonen. 2015. Multiview Triplet Embedding: Learning Attributes in Multiple Maps. In Proceedings of the 32nd International Conference on Machine Learning (ICML-15). 1472–1480. http://jmlr.org/proceedings/papers/v37/amid15.pdf
- Davis et al. (2007) Jason V Davis, Brian Kulis, Prateek Jain, Suvrit Sra, and Inderjit S Dhillon. 2007. Information-theoretic metric learning. In Proceedings of the 24th international conference on Machine learning. ACM, 209–216.
- Ding and Vishwanathan (2010) Nan Ding and S. V. N. Vishwanathan. 2010. -Logistic Regression. In Proceedings of the 23th International Conference on Neural Information Processing Systems (NIPS’10). Cambridge, MA, USA, 514–522.
- Ellis et al. (2002) Daniel P. W. Ellis, Brian Whitman, Adam Berenzweig, and Steve Lawrence. 2002. The Quest for Ground Truth in Musical Artist Similarity. In Proceedings of the 3rd International Conference on Music Information Retrieval (ISMIR ’02). Paris, France, 170–177.
- Hyvönen et al. (2015) Ville Hyvönen, Teemu Pitkänen, Sotiris Tasoulis, Elias Jääsaari, Risto Tuomainen, Liang Wang, Jukka Corander, and Teemu Roos. 2015. Fast k-nn search. arXiv preprint arXiv:1509.06957 (2015).
- Liu et al. (2012) Eric Yi Liu, Zhishan Guo, Xiang Zhang, Vladimir Jojic, and Wei Wang. 2012. Metric learning from relative comparisons by minimizing squared residual. In 2012 IEEE 12th International Conference on Data Mining. IEEE, 978–983.
- Maaten and Hinton (2008) Laurens van der Maaten and Geoffrey Hinton. 2008. Visualizing data using t-SNE. Journal of Machine Learning Research 9, Nov (2008), 2579–2605.
- Naudts (2002) Jan Naudts. 2002. Deformed exponentials and logarithms in generalized thermostatistics. Physica A 316 (2002), 323–334. http://arxiv.org/pdf/cond-mat/0203489
- Naudts (2004a) Jan Naudts. 2004a. Estimators, escort probabilities, and phi-exponential families in statistical physics. Journal of Inequalities in Pure and Applied Mathematics 5, 4 (2004), 102.
- Naudts (2004b) Jan Naudts. 2004b. Generalized thermostatistics based on deformed exponential and logarithmic functions. Physica A 340 (2004), 32–40.
- Sears (2010) Timothy Sears. 2010. Generalized Maximum Entropy, Convexity and Machine Learning. Ph.D. Dissertation. The Australian National University.
- Tamuz et al. (2011) Omer Tamuz, Ce Liu, Serge Belongie, Ohad Shamir, and Adam T. Kalai. 2011. Adaptively Learning the Crowd Kernel. In Proceedings of the 28th International Conference on Machine Learning (ICML-11).
- van der Maaten and Weinberger (2012) L. van der Maaten and K. Weinberger. 2012. Stochastic triplet embedding. In 2012 IEEE International Workshop on Machine Learning for Signal Processing. 1–6. DOI:http://dx.doi.org/10.1109/MLSP.2012.6349720
- Wilber et al. (2014) Michael Wilber, Sam Kwak, and Serge Belongie. 2014. Cost-Effective HITs for Relative Similarity Comparisons. In Human Computation and Crowdsourcing (HCOMP). Pittsburgh.
- Yun et al. (2014) Hyokun Yun, Parameswaran Raman, and S. V. N. Vishwanathan. 2014. Ranking via Robust Binary Classification. In Proceedings of the 27th International Conference on Neural Information Processing Systems (NIPS’14). Cambridge, MA, USA, 2582–2590. http://dl.acm.org/citation.cfm?id=2969033.2969115